
Uses an abuses of inteligence - Eye on Society · The test used was the original version of what...
30
Chapter 9 Does the “Flynn Effect” Invalidate the Interpretation Placed on Most of the Data Previously Believed to Show a Decline in Intellectual Abilities with Age? Francis Van Dam and John Raven Acknowledgements The authors are deeply indebted to Jean Raven for her continuous assistance. Also to the academic authorities of Louvain University, at the time of the first test, Mrs R. Berte (Faculty of Psychology and Educational Sciences), Mrs M. Tits, Professors L. Ghosez and I. De Aguirre (Faculty of Sciences), but also for their aid to the feasibility of the retest, Professor M. Crochet, Rector, and Professor M. Hupet, Decan of the Faculty of Psychology and Educational Sciences. Internal services of the University and Mr P.Escoyez deserve our sincere gratitude. Assistance of Mrs. L. Sohy and Messrs. Tran Quoc Duy and J.-C. Van Dam for statistical controls and graphical versions of our data has been highly appreciated. Abstract This paper is divided into two Parts. Part I presents longitudinal data on the way people’s performance on the Advanced Progressive Matrices changed as they aged. The data come from 99 Louvain University students who were first tested in 1970 or 1971 and followed up in 2002- 03. The data relate directly to the questions about the validity of widely held beliefs about the “decline” in ability with increasing age that have been called into question by data published by Flynn and others who have documented a dramatic increase in scores with date of birth. These
Transcript of Uses an abuses of inteligence - Eye on Society · The test used was the original version of what...

Chapter 9
Does the “Flynn Effect” Invalidate the Interpretation Placed on Most of the Data Previously Believed to Show a Decline in
Intellectual Abilities with Age?
Francis Van Dam and John Raven
Acknowledgements
The authors are deeply indebted to Jean Raven for her continuous assistance. Also to the academic authorities of Louvain University, at the time of the fi rst test, Mrs R. Berte (Faculty of Psychology and Educational Sciences), Mrs M. Tits, Professors L. Ghosez and I. De Aguirre (Faculty of Sciences), but also for their aid to the feasibility of the retest, Professor M. Crochet, Rector, and Professor M. Hupet, Decan of the Faculty of Psychology and Educational Sciences. Internal services of the University and Mr P.Escoyez deserve our sincere gratitude.
Assistance of Mrs. L. Sohy and Messrs. Tran Quoc Duy and J.-C. Van Dam for statistical controls and graphical versions of our data has been highly appreciated.
Abstract
This paper is divided into two Parts. Part I presents longitudinal data on the way people’s performance on the Advanced Progressive Matrices changed as they aged. The data come from 99 Louvain University students who were fi rst tested in 1970 or 1971 and followed up in 2002-03. The data relate directly to the questions about the validity of widely held beliefs about the “decline” in ability with increasing age that have been called into question by data published by Flynn and others who have documented a dramatic increase in scores with date of birth. These
Francis Van Dam and John Raven 259
data documenting the secular increase in RPM scores with date of birth suggest that the age differences in earlier cross-sectional studies may need to be reinterpreted. Instead of showing that scores decline with age they may simply show that people born more recently get higher scores. The data reported in this paper suggest that most of the apparent “decline” is probably due to the secular increase in scores. However, they also show that trends with age are far from universal. Some respondents’ scores increased almost as much as others declined. Part II presents data which bear on the question of whether, as people age, it is not so much their ability to solve problems as the time they need to do so that declines.
Chapter 9: Stability and Change in Adulthood 260
Part I: Changes In The Number of Problems Correctly Solved As People Grow Older
1. Introduction
Data on the “intelligence” test scores achieved by people of various ages that have been assembled by testing samples of the general populations of a number of countries at a particular time (e.g. Deary, 2000) – i.e. data from cross-sectional studies – have generally been interpreted to mean that most abilities decline steadily as age advances. It has usually been claimed that “fl uid intelligence” or “reasoning ability” declines most rapidly and routine skills and knowledge decline less. A striking graph supporting this position will be found in Schaie and Willis (1986).
Flynn (1984, 1987), on the other hand, assembled data collected mainly from 18 year olds entering military service in a wide range of countries and demonstrated that there had been a huge inter-generational increase in scores. Similar data had earlier been published by such authors as Thorndike (1975, 1977), Garfi nkel and Thorndike (1976), and Bouvier (1969) and Raven (1981). While discussing his data, Flynn suggested that at least a signifi cant proportion of what had previously been believed to be a “decline with age” in reality refl ected an increase with date of birth (because the older people in the cross-sectional samples had, of course, been born earlier).
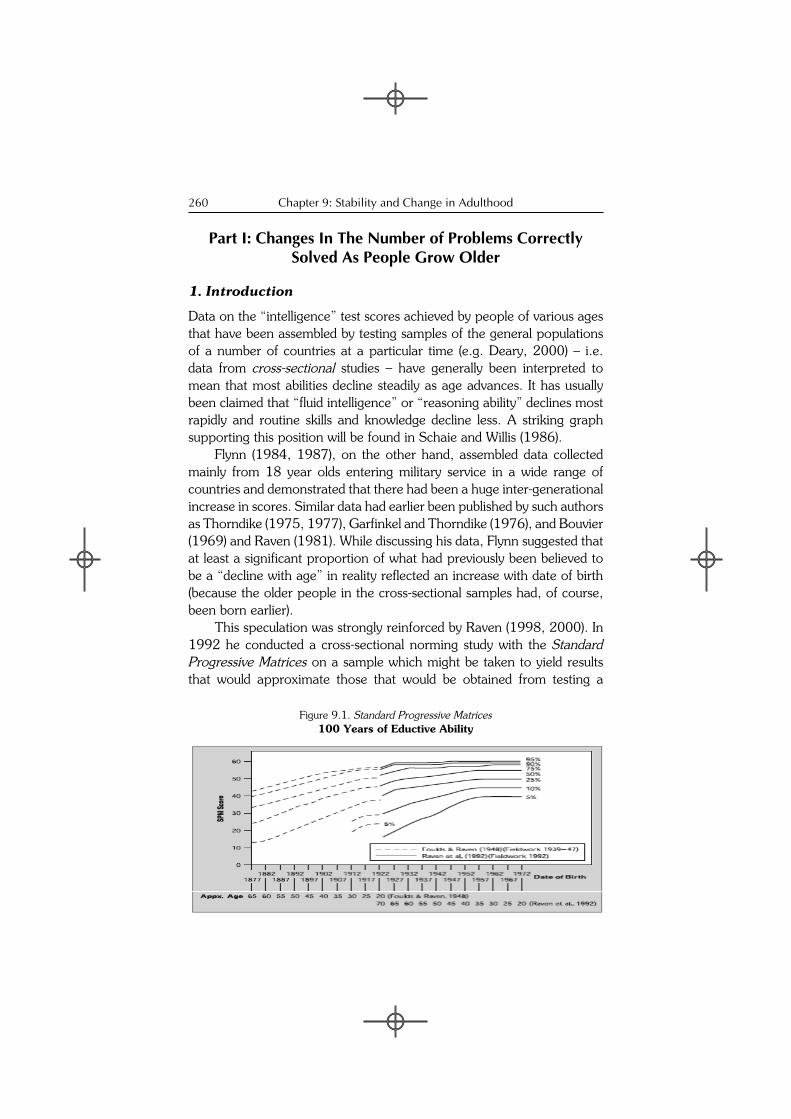
This speculation was strongly reinforced by Raven (1998, 2000). In 1992 he conducted a cross-sectional norming study with the StandardProgressive Matrices on a sample which might be taken to yield results that would approximate those that would be obtained from testing a
Figure 9.1. Standard Progressive Matrices100 Years of Eductive Ability

Francis Van Dam and John Raven 261
cross-section of adults in the UK and compared the graphed percentile age norms from that study with similar norms estimated by his father from data available 50 years earlier – i.e. about 1942 (Raven, J.C., 1948; Foulds, & Raven, J. C., 1948). In Figure 9.1 (reproduced from Raven, 2000) the cross sectional norms from the two studies, which are normally plotted with increasing age as the X axis (thus purporting to show a “decline” with age), are plotted by date of birth. The results from each study thus show an increase in scores with date of birth until the dates on which the two cross sectional studies were conducted. If the apparent increases with date of birth were, in reality, due to declines with age then the two sets of graphs (from the 1942 and 1992 studies) would be side by side, each set starting from approximately the same point. But that is not what we see. Instead, the graphs show a continuous increase. Particularly striking is the fact that the scores of a sample of the 1922 birth cohort tested circa 1942 (when they were approximately 20 years of age) were almost the same as those of a sample of the same birth cohort tested in 1992 (when they would have been approximately 70 years of age).
It may be noted in passing that the data are similar to Flynn’s in that they present results obtained at different points in time, but differ in the sense that, whereas Flynn’s data related mainly to 18 year old military conscripts, these data cover all age groups or, stated differently, and perhaps in a way more relevant to the theme of this article, a cross-section of people from every birth cohort from 1877 to 1972.
In any event, it would seem from these data that Raven Standard Progressive Matrices scores at all levels of ability do not decline with age but, instead, increase steadily with date of birth.
The signifi cance of these data cannot be over-estimated. If the absence of almost any decline with age were confi rmed, the implication would be that the interpretation placed on the data collected in the course of the numerous cross-sectional studies already mentioned would have to change.
To fully test this hypothesis, it would be necessary to draw together the results of several longitudinal studies in which cross-sections of the adult population had been tested on a number of occasions.
Because of the diffi culties involved in tracing people who had been tested 20 or more years earlier, very few such studies exist – with anytest, let alone the Raven Progressive Matrices.
One of the most widely cited studies – and one which is generally believed to have contributed such data – is Schaie’s (1983) Seattle

Chapter 9: Stability and Change in Adulthood 262
Longitudinal Study, which was conducted with Thurstone’s PrimaryMental Abilities test. Yet even this study was plagued by huge population losses and relatively short follow-up periods. (Although the study started out with 500 respondents, this number had fallen to 92 after 28 years – i.e. after much the same time lapse as the period over which the present study was conducted.) These problems forced Schaie to make endless adjustments to his basic data in order to arrive at what might, at best, be viewed as extremely tentative conclusions.
Owens (1959, 1966) examined the scores of 129 college freshmen who had been tested with the Army Alpha Examination at ages 19, 50 and 61. From 19 to 50 years of age there was little change in mean scores, and, even between 50 and 61 years of age, the only signifi cant decline was on numerical ability and this amounted to a mere .20 of a standard deviation.
Schwartzman et al. (1987) also reported a decline of only .85 of a standard deviation in non-verbal ability over a 40-year interval time period among 260 respondents whose average age at retest was 64.7.
Pushkar Gold and collaborators (1991), quoted by Deary (2000), also indicate a decline in so-called “fl uid” (but not “crystallised”) “intelligence” in their longitudinal data based on 300 respondents between 25 and 65 years.
Deary and his colleagues have published a series of remarkable studies (of which Deary et al, 2000 is but one example) based on a follow up, in 1998, of a sample of 101 Scottish adults from the 1921 birth cohort, the entire population of whom had been tested in 1932 when they were 10-11 years old. Unfortunately, because the sample had not been tested between these two time points, there were no data on the scores obtained at maturity (i.e. at about 18 years of age) so it was impossible to fi nd out whether there had been any development or decline in scores with advancing age. Nevertheless, it is worth reporting that the correlation between the scores of these people tested 66 years apart was 0.63 (corrected for restriction of range 0.73).
In order to check the validity of the now strengthening hypothesis that the data that had previously been thought to show a decline in scores with age really revealed an increase in scores with date of birth, the second author (Raven) contacted a number of researchers who were known to have tested large samples on one or other of the Raven Progressive Matrices tests a number of years ago and who might have kept suffi cient information on the names and addresses of those concerned to make it feasible to consider recontacting them.
Francis Van Dam and John Raven 263
The primary author of this article was one of those so contacted. In the course of a research he conducted in 1970-71 he had tested 1,095 fi rst year students in the University of Louvain on the AdvancedProgressive Matrices and it appeared that, through the alumni records of the university, it might be possible to trace the current addresses of some of those concerned. The diffi culties involved in doing this and the overall success or otherwise of the operation will be described below.
2. The Design of the Present Study
2.1. Participants
1095 fi rst year students in the French Speaking division of the University of Louvain had been tested with a 48-item version of Set II of the Advanced Progressive Matrices (then known as PMA 1947) in 1970 and 1971.
For the present study, the scores of all Asiatic, African, Australian, and similar students were discarded, leaving only Belgian, French, German, and similar respondents: 844 in all.
In 1970 and 1971, students were tested, in groups of about 50, soon after their registration. They came mainly from the Faculties of Applied Sciences. There were no students of the exact sciences or Arts. No longitudinal study was planned at this time. The research was intended to fi nd ways of minimising academic failure and assist in career choice. The testing was organised with the support of the University authorities. In 1970 the testing was voluntary but it was compulsory in 1971.
2.2. Tests and testing procedures in 1970 and 1971
The test used was the original version of what has, from 1962, been known as the Advanced Progressive Matrices (APM). Then known as PMA 47, this had an introductory, practice, set of 12 items (termed “Set I”) followed by a main test (“Set II”) of 48 items. However, the introductory set (Set I) was not administered in 1971. Set II was administered with a 40 minute time limit. In both years, respondents were asked to indicate the item in Set II that they were working on after 30 minutes. Unfortunately, not all students did so.
2.3. Overall results
The mean score of the 1970 group (n = 288) was 34.25 and that of the 1971 group (n = 556) 35.48. The distribution of scores for the 1971

Chapter 9: Stability and Change in Adulthood 264
group (to whom Set I was not administered) was slightly less Gaussian than that of the 1970 group.
The scores of both groups were well above (t = 5.2, p = .001) those for secondary school students from the same region at the same period (M = 32.21, n = 278) (Florquin, 1964).
2.3.2. Variation in scores with gender and subject studied
Overall, there were no differences between the mean scores of men (34.83) and women (35.36). However this was not true within subjects. Women studying in faculties in which they were a distinct minority (such as veterinary medicine and agronomics) got higher scores than men studying those subjects. They had lower scores in other subjects, such as biology, where they were in a majority. The impossibility of generalising from a population with such internal variation to sex differences in general is thus immediately obvious and it invalidates any attempt to tease out any generalisable differential effects of gender from the changes in scores over time to be documented below.
3. The Follow-Up Study
3.1. Participants.
The ex-students were traced through the University alumni records. It was possible to trace only 217 of the 844 students initially tested 30 years earlier, and this with the utmost diffi culty. These were sent a letter, accompanied by a test booklet, instructions, an answer sheet, and a prepaid return envelope. Only 99 (60 males and 39 females) returned the material. The proportion of men and women happened to be the same as in the initial study (respectively. 61% and 39 %). 57 of the respondents from whom replies were obtained had fi rst been tested in 1970 and 42 in 1971.
3.2. Procedure.
As mentioned, those ex-students whose addresses could be traced were sent a letter explaining the purpose of the study (and reminding them of the earlier testing) and asking them to again try to solve the problems of the same (48-item) version of APM Set II that they had taken in 1970 or 1971. At this time they were not given any information about the scores they had obtained on the previous testing, but they were told they would obtain feedback on the scores obtained on both occasions once the new scores were obtained.

Francis Van Dam and John Raven 265
Tab
le 9
.1.
Adv
ance
d Pr
ogre
ssiv
e M
atric
es, S
et II
, 48
Item
Ver
sion
Cor
rela
tion
s B
etw
een
19
70
/71
and
20
02
-03
Sco
res;
Cor
rela
tion
s B
etw
een
Num
ber
of I
tem
s A
nsw
ered
Cor
rect
ly (
SC
OR
E)
and
Num
ber
of I
tem
s A
ttem
pted
(S
CA
N)
Initi
al T
est
(197
0-19
71)
Ret
est
(200
2-20
03)
Scor
e 30
min
Scan
30
min
Scor
e 40
min
Scan
40
min
Scor
e 30
min
Scan
30
min
Scor
e 40
min
Scan
40
min
Tes
tSc
ore
30 m
in1.
00Sc
an 3
0 m
in0.
591.
00Sc
ore
40 m
in0.
890.
381.
00Sc
an 4
0 m
in0.
390.
780.
291.
00R
etes
tSc
ore
30 m
in0.
600.
380.
490.
231.
00Sc
an 3
0 m
in0.
390.
360.
230.
190.
771.
00Sc
ore
40 m
in0.
570.
290.
500.
150.
920.
581.
00Sc
an 4
0 m
in0.
220.
290.
180.
080.
590.
850.
521.
00
Bas
ed o
n th
e 78
res
pond
ents
who
ind
icat
ed t
he n
umbe
r of
the
pro
blem
the
y w
ere
wor
king
on
at t
he e
nd o
f bo
th 3
0 an
d 40
min
utes
on
both
oc
casi
ons.

Chapter 9: Stability and Change in Adulthood 266
Ex-students who had not completed their University studies – i.e. who had failed to graduate – were sent the same package of materials as those who graduated.
In the instructions for taking the test, respondents were asked to limit the time they worked on it to 40 minutes. Also, to circle on the answer sheet the number of the problem they were working on after 30 minutes had elapsed. Only 78 of the 99 respondents who completed the retest marked the item they had reached after 30 minutes at both the initial and follow up testing. As a result, some of the results reported below refer to the overall sample (n= 99) while others are derived from the more restricted sample of 78.
Once the test booklet had been returned and the answer sheet scored, respondents were sent simple information about their performance at both the fi rst and second occasion. The letter was written in a rather neutral way, reporting score(s) in terms like “average, superior, highly superior, inferior to the mean” etc. Pessimistic judgments were avoided as much as possible, but an extended commentary explored possible implications for work and career. A lottery ticket was enclosed with the report, which was also a token of thanks for participation in the study.
4. Results
4.1. Test-retest reliability.
In addition to analysing the number of items answered correctly after 30 and 40 minutes, an analysis was also made of the total number of items attempted – i.e. how far into the test respondents had got by the time they reached these two time markers. The latter scores are referred to as SCAN scores (number of attempted or scanned items). Although discussed later, Table 9.1 includes correlational statistics for these scores as well as for the “number correct” scores (SCORE), obtained at the fi rst and second testing.
As can be seen from Table 9.1, the overall test-retest correlation between the scores achieved at the end of 40 minutes in the initial and follow up testing was 0.50. In other words, the initial scores explained only 25% of the variance in scores 30 years later. This is less than was the case in Deary’s study (which was conducted with a different test over a longer time period). Part of the difference undoubtedly stems from the restricted range of abilities covered by the present study, and allowance must also be made for this when interpreting the results presented be-low.

Francis Van Dam and John Raven 267
Although we have not included them here, we calculated these correlations broken down by sex and year of fi rst testing. From this more detailed analysis it emerged that the test-retest correlations for the fi nal scores obtained in 40-minutes were 0.46 for females and 0.55 for males. Also that the overall correlation was lower (0.36) for the group fi rst tested in 1970 and higher (0.62) for the group fi rst tested in 1971.
From Table 9.1 it will be seen that, among the 78 respondents who recorded the number of the item they were working on at the end of 30 minutes in both 1970/71 and 2002/03, the overall test-retest correlation between the scores achieved after 30 minutes work was 0.60 and that this was higher than the test-retest correlation on completion of the test at the end of 40 minutes (which was 0.50).
The correlation between the number of items attempted at fi rst and second testing was .36 at the end of 30 minutes and .08 after 40 minutes had elapsed. It follows that there seem to have been some fairly dramatic changes in what might be considered to be an index of people’s speed of work over the intervening 30 years and that this was greater than the changes in the number of items answered correctly.
Figure 9.2. Advanced Progressive Matrices, Set II, 48 Item Version, 40 Minute Time Limit
Distribution of 1970/71 Scores for 99 Respondents Retested in 2002-03

Chapter 9: Stability and Change in Adulthood 268
Figure 9.3. Advanced Progressive Matrices, Set II, 48 Item Version, 40 Minute Time Limit Distribution of Final (40 Minutes) Scores Obtained in 2002/03 Compared with 1970-71 Distribution (n = 99)
0
2
4
6
8
10
12
14
20 21 22 23 24 25 26 27 28 29 30 31 32 33 34 35 36 37 38 39 40 41 42 43 44 45 46 47 48
Scores
Freq
uenc
y
Test 1970-71
Retest (2002-03)
Figure 9.4. Distribution of Losses and Gains 1970/71-2002/03: 40 Minute Time Limit (n = 99)A Negative Number Means That The Scores Have Gone Down From 1970/71 to 2003/04
0
2
4
6
8
10
12
14
-13 -12 -11 -10 -9 -8 -7 -6 -5 -4 -3 -2 -1 0 1 2 3 4 5 6 7 8 9
Gains/Losses
Freq
uenc
y

Francis Van Dam and John Raven 269
4.2. Changes over time
4.2.1. Overall scores
The average fi nal score in the overall time limit of 40 minutes for the whole group (99 respondents) fell from 35.9 to 33.4 between 1970/71 and 2002/03. The standard deviation increased slightly, from 4.13 to 4.57. (The overall distribution of the 844 students tested in 1970/71 was Gaussian, according to the chi-square formula.) A histogram of the distribution of the fi nal (40 minute time limit) 2002/03 scores for the 99 respondents involved in the follow up study is given in Figure 9.1, and, in Figure 9.2, the same histogram is compared with the 1970/71 histogram of the same 99 S’s. A histogram of the individual gains and losses is presented in Figure 9.3.
The t test for paired samples between individual scores at both tests equals 5.726 (df = 98) and yields a very highly signifi cant difference (p < 0.000).
In addition to noting the overall decrease in scores, it is important to draw attention to the great individual variation in the change scores: almost as many scores have increased as decreased, none have fallen by more than 13 points and the majority changed very little.
Attention should be drawn to the fact that it is more diffi cult to increase scores than to decrease them because increasing them involves solving more diffi cult items. Nevertheless, from the point of view of comparing relative gains and losses, this is actually a minor problem. Much more basic problems stem from the fact that there is no guarantee that the items in the test are equally spaced in terms of diffi culty. Consequently, as Prieler and Raven have shown in another chapter of this book, assessing relative gains and losses is fraught with diffi culty.
4.2.2. Differential changes among those fi rst tested in 1970 com-pared with those fi rst tested in 1971
The mean scores of those fi rst tested in 1970 fell less than those of the group fi rst tested in 1971. The scores of the fi rst group (n = 41) declined by only 1.27 (from 34.39 to 33.12) points although the standard deviation of scores for this group increased considerably (from 3.8 to 4.9). The average decline in the scores of those fi rst tested in 1971 (n = 58) was greater (3.38 points, from 36.97 to 33.59) but there was a smaller increase in the S.D. (from 4.18 to 4.43). However, since the original mean score of the fi rst group was already relatively low (34.39), it means

Chapter 9: Stability and Change in Adulthood 270
that those respondents had never been able to solve the more diffi cult items that the second group solved on the fi rst occasion but became unable to reach or solve within the time limit on the second occasion. The change scores may therefore have different meanings for the two groups.
4.2.3. Gender differences.
Overall, the full-time scores of the 60 male respondents declined less than those of the 39 females, the declines in the means being respec-tively 1.78 and 3.62 (Figure 4). Both declines are statistically signifi cant (t = 3.1 df = 59 p < .003 for men and t = 5.6 df = 38 p < 0.000 for women). This gender difference is all the more striking in that there was no signifi cant difference between the scores of 39 female and 60 male participants when tested in 1970/71 (M = 36.26 for men and 35.67 for women).This is consistent with the absence of signifi cant difference stat-ed between the whole samples of men (n = 517) and women (n = 327) at their fi rst testing in 1970-1971.
Despite the impression given by these overall fi gures, the results appear to vary considerably with whether one is dealing with the group initially tested in 1970 or 71 (whom, it will be recalled, were subject to
Figure 9.5. Advanced Progressive Matrices, Set II, 48 Item Version, 40 Minute Time Limit
Mean Scores of Men (n = 60) and Women (n = 39) at Test (1970-71) and Retest (2002-03)
36,26
32,64
35,66
33,89
30
31
32
33
34
35
36
37
Test (1970-71) Retest (2001-02)
w omen
men
Francis Van Dam and John Raven 271
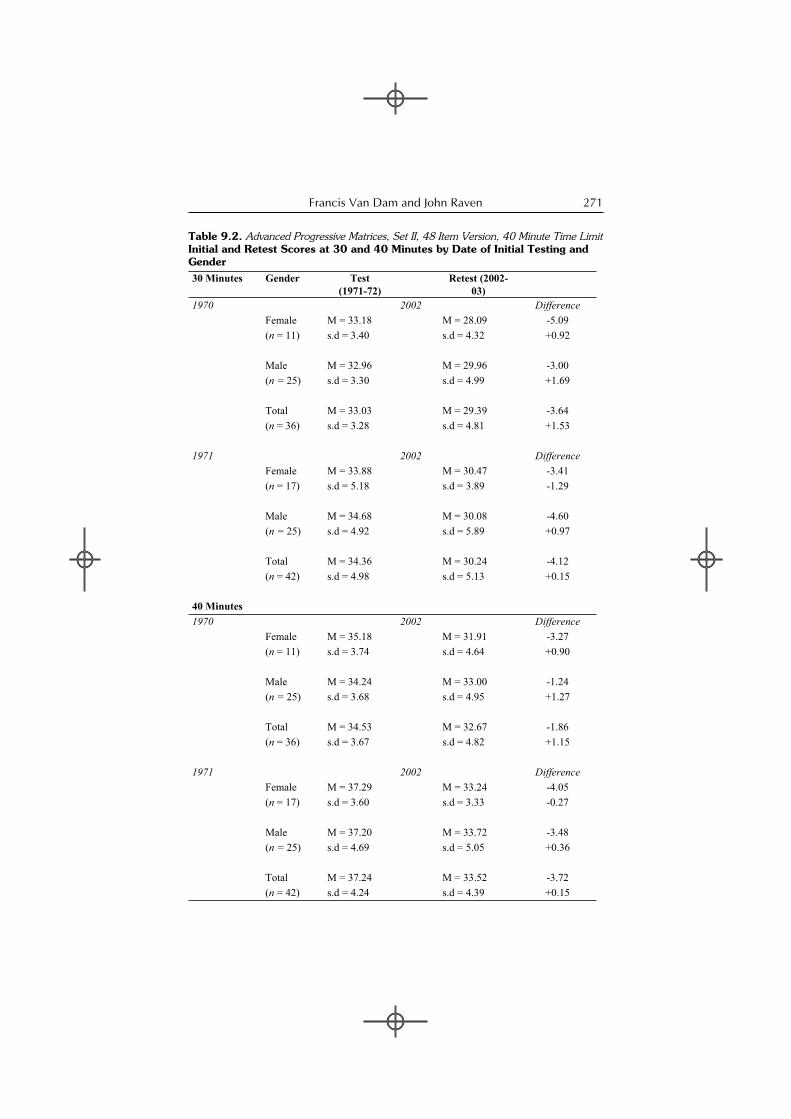
Table 9.2. Advanced Progressive Matrices, Set II, 48 Item Version, 40 Minute Time Limit Initial and Retest Scores at 30 and 40 Minutes by Date of Initial Testing and Gender30 Minutes Gender Test
(1971-72)Retest (2002-
03)1970 2002 Difference
Female M = 33.18 M = 28.09 -5.09(n = 11) s.d = 3.40 s.d = 4.32 +0.92
Male M = 32.96 M = 29.96 -3.00(n = 25) s.d = 3.30 s.d = 4.99 +1.69
Total M = 33.03 M = 29.39 -3.64(n = 36) s.d = 3.28 s.d = 4.81 +1.53
1971 2002 DifferenceFemale M = 33.88 M = 30.47 -3.41(n = 17) s.d = 5.18 s.d = 3.89 -1.29
Male M = 34.68 M = 30.08 -4.60(n = 25) s.d = 4.92 s.d = 5.89 +0.97
Total M = 34.36 M = 30.24 -4.12(n = 42) s.d = 4.98 s.d = 5.13 +0.15
40 Minutes1970 2002 Difference
Female M = 35.18 M = 31.91 -3.27(n = 11) s.d = 3.74 s.d = 4.64 +0.90
Male M = 34.24 M = 33.00 -1.24(n = 25) s.d = 3.68 s.d = 4.95 +1.27
Total M = 34.53 M = 32.67 -1.86(n = 36) s.d = 3.67 s.d = 4.82 +1.15
1971 2002 DifferenceFemale M = 37.29 M = 33.24 -4.05(n = 17) s.d = 3.60 s.d = 3.33 -0.27
Male M = 37.20 M = 33.72 -3.48(n = 25) s.d = 4.69 s.d = 5.05 +0.36
Total M = 37.24 M = 33.52 -3.72(n = 42) s.d = 4.24 s.d = 4.39 +0.15

Chapter 9: Stability and Change in Adulthood 272
different testing procedures). A breakdown of the results by year of fi rst testing and gender is therefore given in Table 9.2 for the 78 respondents who actually indicated which item they were working on at the end of both 30 and 40 minutes in both 1970/71 and 2002/2003.
By and large, the mean scores of women decline more than those of men, irrespective of the initial year of testing. This could be an effect of not practicing a job, as P.E.Vernon (1947) suggested. This hypothesis fi nds some support in the fact that the largest decline in our sample came from a woman who had never practised any professional job but raised an exceptionally big family.
° ° ° ° °This study was conducted to throw some light on the question of
whether there is still any reason to believe that reasoning – or meaning-making – ability declines with advancing age when the evidence from the cross-sectional data that have in the past been used to justify this claim has, at least to a great extent, been discredited and shown (like similar data on height and life expectancy) to reveal primarily a secular increase in scores with date of birth.
To investigate this hypothesis, it is necessary to compare the magnitude of the, at best far from universal, “decline” in scores with age documented above with the increase over time that would have been expected to have occurred among respondents of similar ability over the same period of time. The comparison has to be with people of similar ability because, as can be seen from Figure 9.1, the original cross-sectional data reveal differential raw score changes over the years at different levels of ability. These have been widely interpreted – for example, by J. C. Raven (1948) himself – as showing that the scores of the more able “decline” “less” than those of the less able. Unfortunately, as can be seen from another chapter in this book, Prieler and Raven (2002) have demonstrated that, obvious as it may seem, such a conclusion cannot really be drawn from these data. Despite this, it is clear from Figure 9.1 that any attempt to fi nd out how changes over time documented through a longitudinal study of a group of people who do not constitute a representative sample of the general population compare with the changes that one would expect to fi nd in data collected in a cross-sectional study conducted at the end of the period must compare like with like. The “decline” to be expected at the 95th percentile would, for example, be very much less than that to be expected at the 5th percentile. In short, we need to compare the (minimal) rates of decline in scores with advancing age documented above with the

Francis Van Dam and John Raven 273
magnitude of the changes revealed in the previously mentioned cross-sectional studies for people of similar levels of ability.
Unfortunately, even making such a comparison presents serious diffi culties because no good cross-sectional general population norms were available for the Advanced Progressive Matrices (PMA 1947) in 1970/72. This is partly because the APM was developed with the specifi c objective of spreading the scores of the top 20% of the general population and would thus not be expected to discriminate within the rest of the population1.
Nevertheless an undated Guide to the Use of Progressive Matrices (1947) published in the UK in about 1948 or 1950 and reprinted one or more times before 1958 (Raven, J. C., c 1950) does include the norms shown in Table 9.3 for 20 year olds for the 48-item version of the test administered with a 40 minute time limit.
The 1963 French Manual (Schutzenberger, 1963) also included two sets of norms.
One set, dated 1960-1962, came from a highly qualifi ed group of 200 respondents aged 25 to 40 comprising engineers, managers and offi ce workers, and reported by the “Services Psychotechniques de la radiotechnique de Suresnes (France)”. The group tested appears to be similar in demographic composition to that involved in the present study in that it consisted mainly of graduates who had studied different subjects. The mean APM score was 34.08 with a S.D. of 6.4.
Another standardisation, carried out in 1955, was based on 340 applicants (of both sexes) for jobs with KLM (Royal Dutch Airlines). They appear to be of above average ability in that they were all able to solve more than half of the items in APM Set I.
The 20-24 age group (n = 100) obtained a mean score of 28.1 with a S.D. of 5.3 whereas the 40+ age group had a mean of 22.6 and a S.D. of 6, a lowering which started already for the 35-39 years age group . This decline of 5.5 points in raw scores over 15 years is fairly comparable
Table 9.3. APM Set II, 48 Item Version, 40 Minute Time LimitBritish Norms for 20 Year OldsDate of collection/estimation unknown, but probably about 1948-50
Percentile Score95 3490 3175 2650 21

Chapter 9: Stability and Change in Adulthood 274
Tab
le 9
.4.
APM
Set
II, 4
8 Ite
m V
ersi
on, 4
0 M
inut
e T
ime
Lim
itB
ritish
Cro
ss-S
ection
al P
erce
ntile
Nor
ms
by A
ge a
nd Y
ear
of T
esti
ng Age
in Y
ears
2030
4050
Yea
r
Perc
entil
e
1952
1970 /71
Estim
.
1992
1952
1992
1952
1992
1952
Estim
.
1970 /71
Estim
.
1992
2002 /03
Estim
.95
3439
4333
4331
4230
3541
4390
3136
4130
4128
4026
3339
4375
2631
3724
37 2
136
1927
3437
50 2
126
32 1
932
--30
--21
2831
Not
es:
The
nor
ms
whi
ch h
ave,
for
con
veni
ence
, be
en d
ated
circ
a 19
52 c
ome
from
Rav
en,
J. C
. (1
952)
. T
he n
orm
s fo
r th
e 40
min
ute
vers
ion
for
20 y
ear
olds
com
e di
rect
ly fr
om th
at p
ublic
atio
n, b
ut th
e no
rms
for
30 a
nd 4
0 ye
ar o
lds
have
bee
n es
timat
ed fr
om n
orm
s fo
r un
timed
adm
inis
trat
ion.
T
he n
orm
s fo
r 50
yea
r ol
ds a
t th
at t
ime
have
bee
n de
rived
by
extr
apol
atin
g th
e tr
end
in t
he 2
0-30
-40
year
old
s’ d
ata.
The
197
0/71
nor
ms
wer
e in
terp
olat
ed b
etw
een
the
c195
2 an
d 19
92 n
orm
s.

Francis Van Dam and John Raven 275
to that reported at this level of ability in cross-sectional studies conducted with the SPM in the 1950’s.
It is clear from the data summarised above that the 1970/71 scores of all 99 respondents involved in the present study were above the 75th
percentile of the norms for 20 year olds in the 1950 British norms. They also equal or surpass the 50th percentile from the KLM study and 82 of them (83 %) scored above the 75th percentile from that study. As we have seen, the mean scores matched those obtained in the Suresnes study.
In order to compare the (minor, irregular, and frequently reversed) “decline” in scores with increasing age documented in the present study with that which would have been expected for this ability group on the basis of longitudinal data previously (and erroneously) thought to demonstrate such a “decline”, it is necessary to convert the 1992 British norms established for the shorter version of the test published in Great Britain in 1962 (and used from then until the present day) to the equivalents that would have been expected for the 48-item version of APM Set II used in the present study.
Graph 4 in the editions of the (British) Guide to the Use of the Advanced Progressive Matrices published between 1965 and 1975 (Raven, J. C., 1965) identifi es the items eliminated when Set II was reduced from 48 to 36 items in 1962. Items 1-8 and 17 were eliminated because no one got them wrong. Item 11 was a bad item. And items 44 and 46 were too diffi cult.
It follows that one can add 8 to scores on the new test that lie between 1 and 2, 9 to scores between 3 and 7, 10 to scores up to 33, and 12 to scores above that in order to obtain the equivalent scores that would have been obtained on the 48 item test. This conversion has been used to prepare Table 9.4.
It seems clear from the data in Table 9.4 and the French data presented above that the mean score of the 20 year old students tested in Louvain in 1970/71 (35.9) was somewhere around the 90th percentile when judged against appropriate norms.
30 years later, that is to say by the time of the follow up study, these ex-students were approximately 50 years old. By then, their average score had fallen to 33.4. This approximates the 90th percentile score of their parents, who might be assumed to have been about 50 years old in 1970/71.
However, the data in the table are more than a little puzzling. The best estimate for the 90th percentile for 50 year olds in a cross sectional

Chapter 9: Stability and Change in Adulthood 276
sample conducted in 2002/03 was 43, which is way above the mean score of the ex-Louvain students. Yet these are the birth cohort who had been 20 in 1970/71. How could the 90th percentile score of that same birth cohort possibly have increased from 36 to 43 as they got 30 years older? It is all very well to argue that, over the years, there has been an intergenerational increase of this magnitude from generation to generation. It is quite another to believe that, as people age they get much higher scores. In fact the scores of these ex-students did not goup. They went down and by precisely the amount that would have been predicted from the estimated cross sectional norms for 1970/71. How can it possibly be that the cross-sectional norms for the same birth cohort show such an increase over the years?
The 75th percentile for 20 years olds in the UK data for the 36 items test increased from 14 to 27 from 1962 to 1992, a gain of 13 points, so the same raise can be expected to be 16 on the 48 item test.
In the 1992, 36-item, version of the test and in the context of 20 to 40 years of age, the loss related to maturity equals 1 point (from 27 to 26) for both the UK and the US untimed administrations of Set II (APM Manual 1998 p. 85/86 and 89-91): so there is place for an increase of scores - the Flynn effect - and for a close convergence of the scores of young and mature respondents in the context of recent norms.
If the loss in the 75th percentile norm from a 20 year old in 1962 to a 40 year old in 1992 was only 1 point less (perhaps 2 on a 48 item test), it would suggest that the true decline was about 2 points, which is virtually identical to the actual decline at that level of ability in the Louvain data.
With such fi gures, it is clear that the bulk of the general population increase has in fact been due to the “Flynn effect”.

Francis Van Dam and John Raven 277
Part II: Changes in Processing Speed or Strategy
Introduction
Two widely asserted claims in the literature on “intelligence” are (a) that the well-known variance in “intelligence” is mainly attributable to differences in speed of work, reaction time, even rate of neural transmission, and (b) that, as people age, their reaction times slow, thus leading to “declines” in their “intelligence”. Deary (2000) has, however, shown that, while no consistent relationships can be established between Raven Progressive Matrices scores and most measures of “reaction time”, there is a reasonably consistent relationship with “inspection time”. Inspection time tests assess how long people need to be 80% accurate in their judgments about which of two lines of markedly different length is the longer. The test itself is not speeded; it is not administered under the stress of time constraints. Prieler and Raven, in another chapter of this book, have shown that timing Item-Response-Theory-based measures of ability seriously contaminates the results because, under timed conditions, many people never reach the more diffi cult items and therefore cannot demonstrate how well they can do. The result is that the scores obtained constitute an uninterpretable mixture of speed and ability. Forbes (1962) showed that timing the APM (a “power” test constructed to satisfy the requirements of Item Response Theory) seriously discriminates against those who work more slowly and carefully. And both Schaie (see Deary, 2000) and Raven (2000) concluded, together with Deary himself (2000), that the main changes with advancing age stem, not from declines in ability, but in the amount that can be accomplished in a given time.
Given that, in the present study, it was known how many items 78 respondents had attempted both at the end of 30 minutes and on completion of testing at the end of the test, it seemed worthwhile, despite the problems of interpretation introduced by the 40 minute time limit, to review the available data in more detail to see what light could be thrown on the question of whether the primary effect of aging is to slow processing speed rather than to depress ability.
4.3 Retest reliability of the indices
The number of items attempted within a given time might be viewed as an index of processing speed or, at least, some kind of indication of respondents’ attitude to risk-taking or trade off between speed and accuracy of work. Unfortunately, the indices of processing speed available from this study (number of items attempted at 30 minutes; number

Chapter 9: Stability and Change in Adulthood 278
attempted by the end of the test [40 minutes]; and the difference between the two) are even less reliable (in the statistical sense) than the “number of items answered correctly” scores that have already been examined. For those fi rst tested in 1970, the correlation between the number of items attempted by the end of the test (40 minutes) in 1970 and 2002/03 was 0.07. For those fi rst tested in 1971 this correlation was 0.36. At the end of 30 minutes the respective correlations were 0.02 and 0.57. Clearly, individual differences in the number of items attempted in a given amount of time are unstable. Perhaps this means that they are not a reliable index of “speed of work” or that “speed of work” is itself unstable, i.e. that it changes quite dramatically with ageing or the conditions of test administration. But the change in the correlations over the last ten minutes point at least to an interaction between “speed” and “diffi culty”. (It may be relevant to point out that, for the Standard Progressive Matrices, a number of researchers have found no relationship between fi nal score and the number of items attempted in a given time.)
4.3.1 Number of items attempted in 2002/03 compared with number attempted in 1970/71.
Let’s consider the restricted (n = 78) sample of those having marked the item they reached after both 30 and 40 minutes. The number of items attempted by the end of the test (40 minutes) fell on average by more than 4 (44.82 to 40.42) from 1970/71 to 2002/03. At the same time, the variability between respondents – i.e. the standard deviation – increased from 3.30 to 4.97. On average, respondents stopped the retest after attempting 40-41 items, and this irrespective of their initial ability level or of the (former) way of being administered the test, whereas the last attempted item had been, on average, 43.72 (in 1970) and 45.76 (in 1971), giving an overall average for 1970/71 of 45 items examined. In other words, the average number of items attempted after 40 minutes at the retest was just above the average number that had been reached after 30 minutes in the initial test (40.42 vs. 39.58).
4.3.2. Correlations between number of items attempted and number correct in 1970/71 and 2002/03.
The overall correlation between the number of items attempted and number correct was 0.29 in 40 minutes in 1970/71 and 0.52 in 2002/03, but the difference between these correlations is not statistically signifi cant (chi2 = 3.49 df = 98; p < .10).

Francis Van Dam and John Raven 279
Tab
le 9
.5.
Adv
ance
d Pr
ogre
ssiv
e M
atric
es, S
et II
, 48
Item
Ver
sion
, 40
Min
ute
Tim
e Li
mit
Var
iation
s in
the
rel
atio
nshi
p be
twee
n nu
mbe
r of
item
s at
tem
pted
(SC
AN
) an
d nu
mbe
r co
rrec
t (S
CO
RE ) a
t 30 a
nd 4
0 m
inut
es
(n =
78)
Test
(197
0-19
71)
Ret
est (
2002
- 20
03)
30 m
inut
es40
min
utes
30 m
inut
es40
min
utes
SCO
RE
SCA
NSC
AN
SCO
RE
SCA
NSC
OR
ESC
AN
Mea
n va
lues
*33
.74
39.5
835
.99
44.8
229
.85
34.1
833
.13
40.4
2
Diff
eren
ceSC
AN
- SC
OR
E**
5.84
8.83
4.33
7.29
Gai
ns in
10
min
utes
mor
e***
SCO
RE
2.25
3.28
SCA
N5.
246.
24
* T
here
is a
gen
eral
dec
reas
e in
the
aver
age
num
ber
corr
ect (
SCO
RE)
and
the
num
ber
atte
mpt
ed (S
CA
N) a
t ret
est.
**
The
sup
erio
rity
of th
e nu
mbe
r of
item
s at
tem
pted
(SC
AN
) ove
r th
e nu
mbe
r of
item
s an
swer
ed c
orre
ctly
(SC
OR
E) a
lso d
eclin
es a
t bot
h 30
and
40
min
utes
(4.3
3<5.
84) a
nd (7
.29<
8.33
) at r
etes
t.**
* T
here
is a
n in
crea
se in
bot
h no
of i
tem
s an
swer
ed c
orre
ctly
(3.2
8>2.
25) a
nd n
o of
item
s at
tem
pted
(6.2
4>5.
24) a
t ret
est a
nd th
e ra
te o
f gai
n in
crea
ses
(3.2
8/6.
24 =
0.5
2% >
2.2
5/5.
24 =
0.4
3%)

Chapter 9: Stability and Change in Adulthood 280
Once again, these fi gures vary with year of initial testing. In 1970, the correlation is near zero at both 30 and 40 minutes but reaches respectively .76 and .45 in 1971. In contrast, closer correlations (most of them higher than .65) are found between score and number of attempted items at the retest for participants of both initial years of testing.
4.3.2.1. Variation in the relationship between number of items at-tempted and number correct at 30 and 40 minutes.
The correlation between the number of items correctly solved (SCORE) and the number attempted (SCAN) was much higher at the end of 30 minutes (r = .59) than on completion of the test (r = .29) both at the 1970/71 testing, taken as a whole with n = 78, and again in 2002/03 [the corresponding values being 0.77 and 0.52.]. Within a same testing session, a higher correlation between number correct and number attempted (an indication of the relationship between accuracy and processing speed), means that fewer errors have been made within a given number of attempted items.
So, the higher correlations at the end of 30 minutes compared with those obtained on completion of the test seem to indicate that respondents were making relatively few errors until they encountered items that were too diffi cult for them. At that point they may have resorted to guessing, although that is unlikely because other works (such as that of Raven, 1981; Carpenter, Just, & Shell, 1990; Vodegel Matzen, 1991) suggest that people’s answers to problems that are too diffi cult for them are not random but guided by incorrect hypotheses stemming from neglect of the most diffi cult rules governing the logic of the matrix.
Turning now to the test-retest reliability of the information on number of items attempted, we may note that, whereas there is effectively no correlation between the number attempted at the end of 40 minutes in 1971/72 and the number attempted by that time in 2002/03, the correlation at the end of 30 minutes was .36. This would seem to indicate that, as they age, many people change their strategy for dealing with more diffi cult problems, perhaps confi rming the common fi nding that older people in general tend to work more slowly and carefully, check their work more, and adopt less risky strategies.
4.3.2.2.4 Gender differences in number of items attempted.
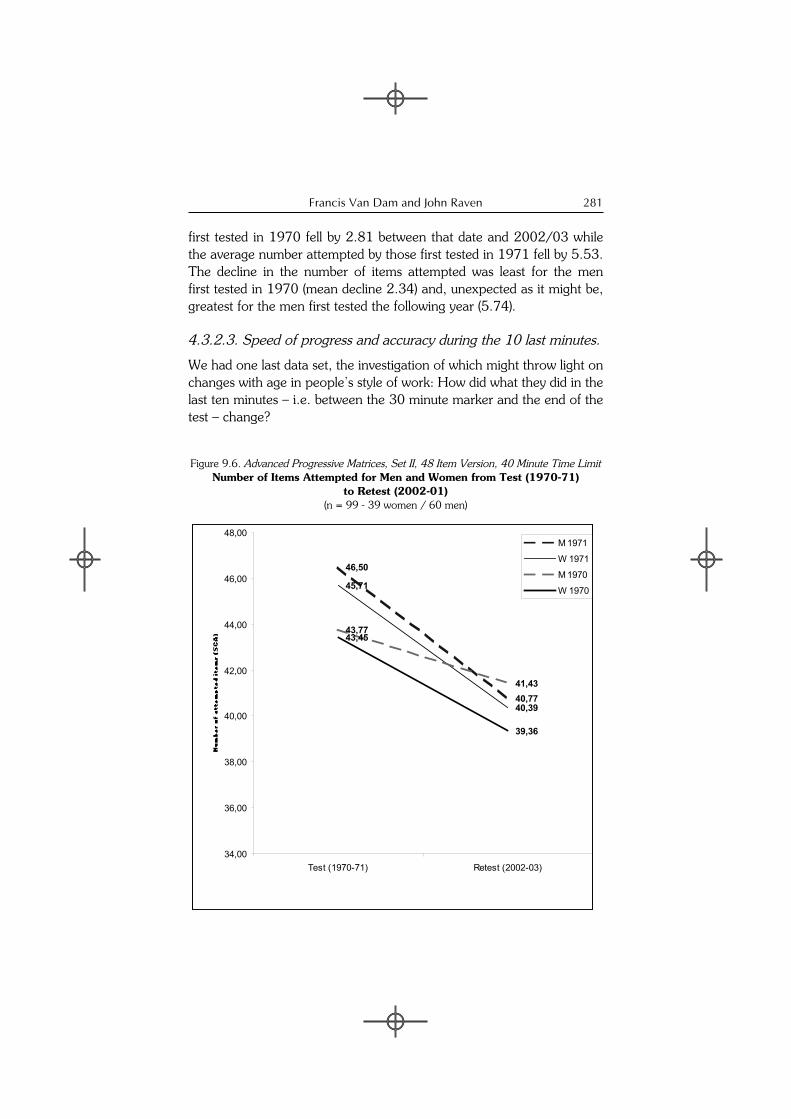
The decline in the number of items attempted for the whole test is greater for women than men – the mean decline being 4.97 items for women and 4.03 for men. The mean number items attempted by all of those
Francis Van Dam and John Raven 281
fi rst tested in 1970 fell by 2.81 between that date and 2002/03 while the average number attempted by those fi rst tested in 1971 fell by 5.53. The decline in the number of items attempted was least for the men fi rst tested in 1970 (mean decline 2.34) and, unexpected as it might be, greatest for the men fi rst tested the following year (5.74).
4.3.2.3. Speed of progress and accuracy during the 10 last minutes.
We had one last data set, the investigation of which might throw light on changes with age in people’s style of work: How did what they did in the last ten minutes – i.e. between the 30 minute marker and the end of the test – change?
Figure 9.6. Advanced Progressive Matrices, Set II, 48 Item Version, 40 Minute Time LimitNumber of Items Attempted for Men and Women from Test (1970-71)
to Retest (2002-01)(n = 99 - 39 women / 60 men)
46,50
40,77
45,71
40,39
43,77
41,43
43,45
39,36
34,00
36,00
38,00
40,00
42,00
44,00
46,00
48,00
Test (1970-71) Retest (2002-03)
M 1971
W 1971
M 1970
W 1970

Chapter 9: Stability and Change in Adulthood 282
Within the same testing session
Compared with the number of items they had tackled per minute during the fi rst 30 minutes of a testing session, the average respondent tackled less items and got less of those items right during the fi nal 10 minutes of the 40 minute testing session, both at the initial test and the retest. The proportion SCORE/SCANNED is signifi cantly lower for the last 10 minutes: more time was spent on each of these more diffi cult items with little gain in the number correct.
Between the two testing sessions
During the last ten minutes, our respondents not only explored, on average, one item more at their retest than they had done in the initial testing, but they were also able to solve one more item. Of course, they were working on slightly easier items and could be expected to progress more quickly than they had done 30 years before.
A more detailed study of the items that were attempted and successfully solved during the last ten minutes reveals that our respondents employed more economical strategies at the retest than they had done previously. During this time they increased their scores by, on average, only 2.25 points (out of 5.24 attempted items) at the initial testing but by 3.28 points (out of 6.24 items attempted during the last 10 minutes) at the retest, in other words the rates of success were respectively 43% and 52%. In addition to an explanation in terms of mastering easier items (the gain in score), it may be that the older respondents had developed more fruitful strategies toward the end of the test.
5. Analysis of the Global Effi ciency at the Retest
As we have seen, all groups of respondents had, at the retest, on average, attempted fewer items at the end of both 30 and 40 minutes.
Nevertheless, again both at 30 minutes and at the end of the test, they solved a higher proportion of the items they attempted. In other words, they function more economically in that their restricted speed is compensated by a higher precision.
In addition, during the last ten minutes, they explore more (but easier) items than they did in the last ten minutes of the initial test and they solve a higher proportion of those easier items – just as they did during the whole retest. There is one exception to this general trend and it concerns the group of females fi rst tested in 1971.

Francis Van Dam and John Raven 283
So, they work more slowly and carefully – but their fi nal scores on average (and there are many exceptions to the general statement) never catch up with what they did earlier.
Conclusion
Perhaps the most important conclusion to be drawn from this study is the virtual impossibility of making meaningful generalisations. The results obtained varied dramatically from sub-population to sub-population and from individual to individual.
Only about 25% of the variance in full-time scores is explained by the variation in initial scores. Thus the rank-order of respondents’ scores was very different at retest than it was at the beginning. Many people increased their scores dramatically, but similar decreases were slightly more common. The scores were more stable at the end of 30 minutes when respondents were working on the easier items and the scores obtained therefore approximated more closely to those that would have been obtained on a speed test than a power test. As they were called upon to exercise more creativity and persistence in order to solve the more diffi cult problems the rank order of respondents changed more. This could be due, as researchers such as Kohn and Schooler (1978, 1982), Jaques (1976), Lempert et al. (1990), and Naoi & Schooler (1990) have claimed, to variation in the demands made upon them to deal with complex problems in a work or family situation or it could be due to variation in motivation. There is no way of telling from the data available to us.
There was, however, a fairly large and intriguing difference between the results obtained from the group fi rst tested in 1970 and the group fi rst tested in 1971. The test-retest correlations for the fi rst group were 0.33 and 0.42 0.36 at 30 and 40 minutes respectively for the fi rst group and 0.75 and 0.74 0.62 for the second group. Attempts to elucidate the reasons for the difference (not reported here) were unsuccessful.
On average the scores fell somewhat (by, on average, 2.5 items) but, as noted, there was enormous individual variation with almost as many respondents showing an increase in scores as showing a decline … with some of the changes (in both directions) amounting to 9 or 10 items or more.
The next question - the question the study was undertaken to answer – is how much of the secular increase in the scores of respondents of

Chapter 9: Stability and Change in Adulthood 284
the same age that Thorndike and Garfi nkel, Flynn, and Raven have so clearly demonstrated accounts for the apparent decline in scores with age that the data collected in cross-sectional studies have so often been interpreted to imply.
Despite considerable individual variation in the increases or decreases in scores with increasing age it is clear that it is simply not true that the reasoning – or “meaning making” – capacity of most individuals can be expected to decline at the rate previously anticipated from approximately 20 to 50 years of age. Despite the unexpected diffi culties encountered when trying to interpret changes in the norms, it is obvious that the average decline in scores between these ages is trivial when compared with the secular increase in scores with date of birth that has occurred among people of similar levels of ability over the same period. Furthermore, it would seem clear from the data presented that the variation in the individual increases or decreases in scores over these 30 years is more likely to be accounted for by such things as whether (as researchers like those mentioned above have claimed) people have found themselves in situations in which they have to investigate complex problems, rather than biological processes.
A fairly extensive trawl for material which would cast light on changes in strategies with age, and especially on the question of whether it takes older people longer to achieve given levels of accuracy (without changing the diffi culty levels of the most diffi cult problems they are able to solve correctly), failed to yield many conclusive results. This was due to the unreliability of the indices of number of problems attempted, the variation in the results from one sub-population to another, and the effects of introducing timing into the administration of a “power” test constructed according to the principles of Item Response Theory. The discussion may thus play an important role in alerting researchers to the diffi culties that are likely to confront them when designing and interpreting studies in the area.

Francis Van Dam and John Raven 285
Notes
9.1.It follows from this that scores on the APM cannot be expected to produce a Gaussian distribution and it is obvious from Figure 9.1 that the within birth-cohort (age group) scores on the SPM are not Gaussianly distributed either. These observations render all attempts (such as Flynn’s) to reduce the analysis to means and standardisations or to apply conventional statistical analyses – such as signifi cance testing and regression analyses – inappropriate.
References
Bayley N. (1970). Development of mental abilities. In P. M. Mussen (Ed.), Carmichael’sManual of Child Psychology. New York: Wiley.
Bouvier, U. (1969). Evolution des cotes à quelques Tests. Belgium: Centre de Recherches, Forces Armées Belges.
Carpenter, P. A., Just, M. A., & Shell, P. (1990). What one intelligence test measures: A theoretical account of the processing in the Raven Progressive Matrices Test. Psychological Review, 97(3), 404-431.
Deary, I., Whalley, L. J., Lemmon, H., Starr, J. S., & Crawford, J. R. (2000). The stability of individual differences in mental ability from chidhood to old age: fol-low-up of the 1932 Scottish Mental Survey. Intelligence, 28, 49-55.
Deary, I. (2000). Looking down on human intelligence: From psychometrics to the brain, Oxford Psychology Series, 34. Oxford: Oxford University Press.
Florquin, F. (1964). Les “P.M. 47” (PMA 1 ET 2) de J.C.Raven au niveau des classes terminales du cycle secondaire. Revue belge de Psychologie et de Pédagogie,XXVI, 108.
Flynn, J. R. (1984). IQ gains and the Binet decrements. Journal of Educational Measurement, 21, 283-290.
Flynn, J. R. (1984). The mean IQ of Americans: Massive gains 1932 to 1978. Psychological Bulletin, 95, 29-51.
Flynn, J. R. (1987). Massive IQ gains in 14 nations: What IQ tests really measure. Psychological Bulletin, 101, 171-191.
Foulds, G. A., & Raven, J. C. (1948). Normal changes in the mental abilities of adults as age advances. Journal of Mental Science, XCIV(394), January, 133-142.
Garfi nkel, R., & Thorndike, R. L. (1976). Binet item diffi culty: Then and now. ChildDevelopment, 47, 959-965.
Huteau, M. (2002). Psychologie Différentielle, cours et exercices (2nd Ed.). Paris: Dunod.
Jaques, E. (1976). A General Theory of Bureaucracy. London: Heinemann.Kohn, M. L., & Schooler, C. (1978). The reciprocal effects of the substantive com-
plexity of work and intellectual fl exibility: A longitudinal assessment. AmericanJournal of Sociology, 84, 24-52.

Chapter 9: Stability and Change in Adulthood 286
Kohn, M. L., & Schooler, C. (1982). Job conditions and personality: A longitudinal assessment of their reciprocal effects. American Journal of Sociology, 87, 1257-86.
Lempert, W., Hoff, E. H., & Lappe, L. (1990). Occupational Biography and Personality Development: A Longitudinal Study of Skilled Industrial Workers. Berlin: Max Planck Institute for Human Development and Education.
McCall, R. B., Appelbaum, M. L., Hogarty, P. S. (1973). Development change in mental performance. Monographs of the Society for Research in Child develop-ment, 38, 150.
Mc Call, R. B. (1979). The development of intellectual functioning of later I.Q. In J. Osofsky (Ed.), Handbook of Infant Development. New York: Wiley.
Naoi, M., & Schooler, C. (1990). Psychological consequences of occupational condi-tions among Japanese wives. Social Psychology Quarterly, 53, 100-116.
Owens, W. A. (1959). Is age kinder to the initially more able? Journal of Gerontology, 14, 334-337.
Owens, W. A. (1966). Age and mental abilities: A second adult follow-up. Journal of Educational Psychology, 57, 311-325.
Plassman, B. L. et al. (1995). Intelligence and education as predictors of cognitive state in late life: a 50-year follow-up. Neurology, 45, 1446-1450.
Prieler, J. A., & Raven, J. (10/20/02). The Measurement of Change in Groups and Individuals, with Particular Reference to the Value of Gain Scores: A New IRT-Based Methodology for the Assessment of Treatment Effects and Utilizing Gain Scores. WebPsychEmpiricist http://www.wpe.info/papers_table.html
Pushkar Gold, D., Andres, D., Etezadi, J., Arbuckle, T., Schwartzman, A., & Chaikelson, J. (1995). Structural equation model of intellectual change and con-tinuity and predictors of intelligence in older men. Psychology and Aging, 10, 294-303.
Raven, J. (1981). Manual for Raven’s Progressive Matrices and Vocabulary Scales. Research Supplement No. 1: The 1979 British Standardisation of the Standard Progressive Matrices and Mill Hill Vocabulary Scales, Together With Comparative Data From Earlier Studies in the UK, US, Canada, Germany and Ireland. San Antonio, TX: Harcourt Assessment.
Raven, J. (1998, updated 2003). The “decline” of eductive ability in adulthood. In J. Raven, J. C. Raven, & Court, Manual for Raven’s Progressive Matrices and Vocabulary Scales. Section 1: General Overview. San Antonio, TX: Harcourt Assessment.
Raven, J., (2000), The Raven’s Progressive Matrices: Change and stability over cul-ture and time. Cognitive Psychology, 41, 1-48.
Raven, J. C. (1948). The comparative assessment of intellectual ability. British Journal of Psychology, 39, 12-19.
Raven, J. C. (c 1950). Progressive Matrices (1947): Plan and Use of the Scale with The Report of An Experimental Survey Carried Out by G. A. Foulds. London:H. K. Lewis.
Raven, J. C. (1965). Advanced Progressive Matrices: Plan and Use of the Scale with a Report of Experimental Work carried out by G. A. Foulds and A .R. Forbes.London: H. K. Lewis. nb this is NOT the same reference as that cited on the line above.

Francis Van Dam and John Raven 287
Schaie, K. W. (Ed.). (1983). Longitudinal Studies of Adult Psychological Development.New York: Guilford Press.
Schaie, K. W., & Willis, S. L. (1986). Adult Development and Ageing (2nd edition). Boston: Little Brown
Schutzenberger, A.A. (1963). Matrix 1947. Manuel d’Instructions et Etalonnages.Paris: Editions Scientifi ques et Psychotechniques.
Schwartzman, A. E., Gold, D., Andres, D., Arbuckle, T. Y., & Chaikleson, J. (1987). Stability of intelligence: A 40 year follow up. Canadian Journal of Psychology,41, 244-256.
Thorndike, R. L. (1975). Mr. Binet’s Test 70 Years Later. Presidential Address to the American Educational Research Association.
Thorndike, R. L. (1977). Causation of Binet IQ decrements. Journal of Educational Measurement, 14, 197-202.
Van Dam, F. (1976). Les “Advanced Progressive Matrices I & II” de J.C.Raven au niveau des premières candidatures en sciences, Revue belge de Psychologie et de Pédagogie, XXXVII, 155, 65-76.
Vernon, P. E. (1947). The variations of intelligence with occupation, age and locality. British Journal of Psychology (Statistical Section), 1(1), 52-63.
Vodegel-Matzen, L. B. L. (1994). Performance on Raven’s Progressive Matrices.Ph.D. Thesis, University of Amsterdam.