
USER MANUAL - Energy Advice€¦ · Calculation results exporting ... 16.4. User manual ......
88
USER MANUAL Version 4.0
-
Upload
truongthien -
Category
Documents
-
view
223 -
download
0
Transcript of USER MANUAL - Energy Advice€¦ · Calculation results exporting ... 16.4. User manual ......

USER MANUAL Version 4.0

Content
Content ............................................................................................................................................................... 2
INTRODUCTION .................................................................................................................................................. 5
1. INSTALLING AND LAUNCHING “EA – PSM” SOFTWARE ............................................................................. 6
2. BASICS OF GRAPHICAL USER INTERFACE ................................................................................................... 7
2.1. Main interface ............................................................................................................................................ 7
2.2. General setting window ............................................................................................................................. 8
3. CREATING THE POWER SYSTEM COMPONENTS ...................................................................................... 11
3.1. Principle of the one-line diagram drawing ............................................................................................... 11
3.2. Meanings of icons on the Grid Elements pane ........................................................................................ 12
3.3. Creating the Infinite Busbar ..................................................................................................................... 13
3.4. Defining parameters of the regular Busbar ............................................................................................. 14
3.5. Defining parameters of the power Line ................................................................................................... 15
3.6. Defining parameters of the 2 – winding and 3 – winding transformers .................................................. 19
3.7. Defining parameters of the Generator .................................................................................................... 22
3.8. Defining parameters of the Load ............................................................................................................. 23
3.9. Defining parameters of the Inverter ........................................................................................................ 24
3.10. Defining parameters of the Photovoltaic systems and Wind turbines ............................................ 24
3.11. Defining parameters of the Capacitor .............................................................................................. 25
3.12. Defining parameters of the Series Reactor and Shunt Reactor ....................................................... 25
3.13. Defining parameters of the Active Filter .......................................................................................... 26
3.14. Defining parameters of the Passive Filter ........................................................................................ 27
3.15. Defining parameters of the Induction Motor .................................................................................. 28
4. Append scheme to scheme ...................................................................................................................... 30
5. Cage numbering ....................................................................................................................................... 32
6. Adding notes ............................................................................................................................................ 33
7. PERFORMING POWER GRID CALCULATIONS ........................................................................................... 34
7.1. Power flow calculations ........................................................................................................................... 34
7.2. Short circuit calculations .......................................................................................................................... 36
7.3. Harmonic analysis .................................................................................................................................... 38
7.4. Motor start - up analysis .......................................................................................................................... 40
7.5. Arc flash module ...................................................................................................................................... 42
7.6. Motor dynamic analysis ........................................................................................................................... 44
8. PROTECTION COORDINATION .................................................................................................................. 46
8.1. Adding “Protection unit” to elements ..................................................................................................... 47

MB Energy Advice K. Baršausko g. 59-436, LT-51423 Kaunas 3
Legal entity's code 303038190 +370 635 16380
A.s. LT984010042503106510 www.energyadvice.lt
AB DNB bank [email protected]
8.2. Configuring overcurrent protection ......................................................................................................... 53
8.3. Configuring non-direction overcurrent protection .................................................................................. 53
8.4. Configuring directional overcurrent protection ....................................................................................... 55
8.5. Configuring undervoltage protection ....................................................................................................... 55
8.6. Configuring ground fault protection ........................................................................................................ 56
8.7. Configuring non-directional ground fault protection .............................................................................. 56
8.8. Configuring directional ground fault protection ...................................................................................... 57
8.9. Configuring fuse protection ..................................................................................................................... 58
8.10. Configuring circuit breaker protection ............................................................................................. 60
8.11. Configuring user defined circuit breaker protection........................................................................ 62
8.12. Configuring mini circuit breaker protection ..................................................................................... 63
8.13. Configuring custom curve protection .............................................................................................. 64
9. DISTANCE PROTECTION ............................................................................................................................ 66
9.1. Distance protection configuration ........................................................................................................... 68
9.2. Distance protection coordination chart ................................................................................................... 70
10. Line zero sequences parameters.............................................................................................................. 72
11. PROTECTION TRACKING MODULE............................................................................................................ 72
12. AUTOMATIC OVERCURRENT RELAY COORDINATION .............................................................................. 73
13. ELEMENT MODELING ............................................................................................................................... 75
13.1. GENERATOR MODELLING ................................................................................................................. 75
13.2. MOTOR MODELLING ........................................................................................................................ 75
13.3. TRANSFORMER MODELLING ............................................................................................................ 76
13.4. STANDARD CIRCUIT BREAKER MODELLING ..................................................................................... 76
13.5. STANDART OVERLOAD PROTECTIONS MODELLING ......................................................................... 78
13.6. WIRES, CABLES AND TOWERS MODELLING ..................................................................................... 79
14. CABLE AMPACITY...................................................................................................................................... 82
15. DATA IMPORTING AND EXPORTING ........................................................................................................ 84
15.1. Calculation results exporting ............................................................................................................ 84
15.2. One line diagram exporting as a picture or drawing ........................................................................ 84
15.3. Custom data format(CDF) importing and exporting ........................................................................ 86
16. HELP FUNCTIONS ...................................................................................................................................... 87
16.1. Send feedback .................................................................................................................................. 87
16.2. System Log ....................................................................................................................................... 87
16.3. Notification log ................................................................................................................................. 88
16.4. User manual ..................................................................................................................................... 88

MB Energy Advice K. Baršausko g. 59-436, LT-51423 Kaunas 4
Legal entity's code 303038190 +370 635 16380
A.s. LT984010042503106510 www.energyadvice.lt
AB DNB bank [email protected]

MB Energy Advice K. Baršausko g. 59-436, LT-51423 Kaunas 5
Legal entity's code 303038190 +370 635 16380
A.s. LT984010042503106510 www.energyadvice.lt
AB DNB bank [email protected]
INTRODUCTION
EA – PSM 4 is the latest release of our advanced system modeling software. In this version
of EA – PSM users will find new functionalities like dynamic motor starting, automatic relay
coordination and significant improvements on a one-line network diagram drawing. We are thankful
to our customers that gave valuable insights, which have led to these software improvements.
EA – PSM 4 is one of the most innovative power system modeling software currently
available on a market, its compatibility with all devices from PC to tablets provides our customers
with unlimited accessibility to one of the most important tool in their work. Power system modeling
was never as easy as with EA – PSM 4, which took definition of user – friendly software to the next
level.
Try new features of EA – PSM 4:
Motor dynamic starting calculation module
Model of passive filters
Overload protection type
Note feature
Automatic setting of inverse time for overcurrent protections
New circuit breaker protection modelling system
Calculator efficiency and speed improvements
Graphical changes and improvements

MB Energy Advice K. Baršausko g. 59-436, LT-51423 Kaunas 6
Legal entity's code 303038190 +370 635 16380
A.s. LT984010042503106510 www.energyadvice.lt
AB DNB bank [email protected]
1. INSTALLING AND LAUNCHING “EA – PSM” SOFTWARE
Installing and launching “EA – PSM” software is simple. User who purchased the software
gets two USB keys. One with software installer and another with dongle. After launching installer, it
will take 4 steps to complete installation.
“EA – PSM” can be launched only using dongle as shown in Figure 1.1. Purchasers get a
dongle key at the moment he is buying the software or by post.
Figure 1.1 Dongle for EA-PSM

MB Energy Advice K. Baršausko g. 59-436, LT-51423 Kaunas 7
Legal entity's code 303038190 +370 635 16380
A.s. LT984010042503106510 www.energyadvice.lt
AB DNB bank [email protected]
2. BASICS OF GRAPHICAL USER INTERFACE
2.1. Main interface
Main workspace window is shown in Figure 2.1.1 contains the most important functions to
quickly model the grid and apply wanted study scenario or calculation.
Figure 2.1.1 Main EA – PSM window
1. Menu bar
2. The main tool bar. Contains a list of buttons for creating grid and calculating different cases
3. System elements bar for fast one line system diagram drawing (creating bus bars and adding
other system elements)
4. Graphic window for one line diagram
5. Creates new graphic window. Opens new window for the one-line system drawing
6. Opens saved file
7. Save, Save As and Save As Picture functions
8. Zoom In, Zoom Out and Zoom to Fit functions
9. Creating a busbar. Opens window to configure a busbar
10. Add element. Opens window for creating a new system element (loads, generators and etc.)
11. Shows if all parameters of system elements are valid (“ ” in green background if no faults
were found, “!” in yellow background if not recommended parameters were found and “ ”
in red background if erroneous parameters where found )
12. Calculate. Performs selected calculation (load flow, harmonics load flow, motor start-up,
short circuit)
13. Display results. Select to depict results in a one – line diagram of a particular calculation
14. Summary. Results depicted in tables of different calculations

MB Energy Advice K. Baršausko g. 59-436, LT-51423 Kaunas 8
Legal entity's code 303038190 +370 635 16380
A.s. LT984010042503106510 www.energyadvice.lt
AB DNB bank [email protected]
2.2. General setting window
Settings window shown in Figure 2.2.1 is reached through the Main menu bar selecting
“Tools” → “Settings”. Here in tab “General” user could change program language, frequency of AC,
calculations standard, customize autosave options and select custom colors and names for phase
markings.
In tab “Display” (Figure 2.2.2) it is possible to choose which of the calculated parameters
should be displayed in a one – line diagram.
Figure 2.2.1 Tab “General” in a “Settings” window
Figure 2.2.2 Tab “Display” in a “Settings” window
In a “Calculation” tab user can change power flow calculations accuracy and voltage factors
for minimum and maximum short – circuit current calculations (determined in existing standards)

MB Energy Advice K. Baršausko g. 59-436, LT-51423 Kaunas 9
Legal entity's code 303038190 +370 635 16380
A.s. LT984010042503106510 www.energyadvice.lt
AB DNB bank [email protected]
and choose which calculation device to use (CPU or GPU). To determine which is more optimal user
can run a test and compare the results.
Figure 2.2.3 Tab “Calculation” in a “Settings” window
In “Interface” tab (Figure 2.2.4) user can turn on and off automatic element deselecting from
elements panel, after adding it to the scheme (user can also find this button above element panel. See
Figure 2.1.1) and short circuit result table opening after calculations are completed.
Figure 2.2.4 Tab “Interface” in a “Settings” window
In “Graphics” tab (Figure 2.2.5) user can select which element graphic type will be used in
scheme drawing. There are 3 types of elements: IEEE and IEC which are based on the standards and
EA-PSM which are default and not based on any standard.

MB Energy Advice K. Baršausko g. 59-436, LT-51423 Kaunas 10
Legal entity's code 303038190 +370 635 16380
A.s. LT984010042503106510 www.energyadvice.lt
AB DNB bank [email protected]
Figure 2.2.5 Tab “Graphics” in a “Settings” window

MB Energy Advice K. Baršausko g. 59-436, LT-51423 Kaunas 11
Legal entity's code 303038190 +370 635 16380
A.s. LT984010042503106510 www.energyadvice.lt
AB DNB bank [email protected]
3. CREATING THE POWER SYSTEM COMPONENTS
3.1. Principle of the one-line diagram drawing
To draw one-line network diagram in EA – PSM user should choose one of the icons from
the Grid Elements pane (3 in Figure 2.1.1), each icon represents particular system element (See 3.2
paragraph). When icon is chosen, it is shown in a darker background, this means that now it is possible
to add the element on a graphic window (4 in Figure 2.1.1) by pushing at any point of it. In order to
deselect icon just push Esc button on a keyboard. Elements like transformers and lines that need to
be placed between two busbars are added in 3 simple steps:
1. Preferable element on the “Grid Elements” pane is chosen.
2. The first busbar is selected.
3. The second busbar is selected.
Another way to do this is to simply push on a white space between two busbars and element will be
added automatically.
User can change location at which grid element is connected by double clicking on that
element, pushing on the green dot at the location, where the element is connected to a busbar and
simply dragging it to another bus.
Hint 2: In order to select several elements user can click right mouse button and drag around
those elements or can hold Ctrl button pushed and select several elements by clicking on them
one by one.
Parameters of the system element can be changed in its properties dialog which pops out
after double clicking on that element or after pushing the right mouse key on it and selecting
“Properties”.
Hint 3: CTRL + C will copy selected elements. CTRL + V will add copied elements to the
scheme at the position of the mouse.
Hint 1: If by any accident element was deleted or added not in the right place, user can always
use “Undo” (Ctrl + Z) and “Redo” (Ctrl + Y) functions to correct a mistake.

MB Energy Advice K. Baršausko g. 59-436, LT-51423 Kaunas 12
Legal entity's code 303038190 +370 635 16380
A.s. LT984010042503106510 www.energyadvice.lt
AB DNB bank [email protected]
3.2. Meanings of icons on the Grid Elements pane
All icons on the Grid Elements pane (3 in Figure 2.1.1) have their own meaning:
- Busbar.
- Electric line.
- 2-winding transformer.
- 3-winding transformer.
- Reactor.
- Synchronous generator.
- Wind turbine.
- Photovoltaic system.
- Inverter
- Note.
- Load.
- Induction motor.
- Capacitors bank.
- Shunt reactor.
- Breaker
- Fuse
- MCB
- Disconnector
- Active filter
- Passive filter
- Standard overload protection
- This button allows user to change element palette from being static to automatically hide when
cursor is not in range. It is very useful if display size is small or when user need more working space.
- If toggled this button will disable deselect of selected element from palette after it was added.
It is especially useful when user have to draw a lot of one type of element.

MB Energy Advice K. Baršausko g. 59-436, LT-51423 Kaunas 13
Legal entity's code 303038190 +370 635 16380
A.s. LT984010042503106510 www.energyadvice.lt
AB DNB bank [email protected]
3.3. Creating the Infinite Busbar
It is necessary to have one infinite bus in the system diagram before performing any of the
calculations. Infinite bus represents the entire electrical network to which analyzed system is
connected. Therefore, the first bus added to the graphic window will be infinite bus by default settings
(infinite bus has different color if compared to other buses) and user will be asked to enter its
parameters right after it is added.
First of all, the title and the voltage level of the infinite busbar should be entered in the
“General” tab of the “Bus Properties” window (Figure 3.3.1). User can leave the title which is
assigned by default, however, it is necessary to enter the voltage level manually. Other parameters
that can be changed in this tab is minimum voltage level 𝑈𝑚𝑖𝑛 and maximum voltage level 𝑈𝑚𝑎𝑥.
When calculating if the voltage level exceeds boundary conditions 𝑈𝑚𝑖𝑛 or 𝑈𝑚𝑎𝑥 busbar voltage
rating will become red colored. Min and Max voltage levels for all busbars in the grid can be adjusted
separately.
Figure 3.3.1 Busbar properties window

MB Energy Advice K. Baršausko g. 59-436, LT-51423 Kaunas 14
Legal entity's code 303038190 +370 635 16380
A.s. LT984010042503106510 www.energyadvice.lt
AB DNB bank [email protected]
After first parameters are entered, user shall define short circuit current in the “System” tab
depicted in Figure 3.3.2 (short circuit power or system impedances can be entered instead, if known
by choosing the appropriate description type from “Description type” menu). If the network is
grounded, zero sequence impedances are also required. These parameters are needed for both
minimum and maximum system modes.
Hint 3: System parameters (short circuit power and etc.) are usually provided by a local
power grid operator.
Figure 3.3.2 Infinite busbar properties window
3.4. Defining parameters of the regular Busbar
By default, regular busbar will have the voltage level of the last busbar added into the
diagram. To change the voltage level of the busbar, follow the suggestions from 4.1 paragraph. It is
possible to define that group of busbars is installed in the particular substation. This is done in the
busbar properties “Substation” tab that is depicted in Figure 3.4.1.

MB Energy Advice K. Baršausko g. 59-436, LT-51423 Kaunas 15
Legal entity's code 303038190 +370 635 16380
A.s. LT984010042503106510 www.energyadvice.lt
AB DNB bank [email protected]
Figure 3.4.1 Bus properties “Substation tab”
In order to create new substation, push button, enter substation title and push “Ok”.
After the substation is created, user will be able to choose the substation from a drop down menu,
next to the inscription “Substation” (shown in Figure 3.4.1).
Substations will be visible in the one-line network diagram as a dashed line. User will be
able to calculate short circuits only at busses of the particular substation if needed. This is helpful
when there is a need to analyze big networks, however, there is not necessary to calculate short circuit
at each bus.
3.5. Defining parameters of the power Line
Power line parameters like resistance, reactance and capacitance can be entered into “Line
properties” dialog “General” setting window, which is depicted in Figure 3.5.1. Some of the
parameters will be calculated automatically.

MB Energy Advice K. Baršausko g. 59-436, LT-51423 Kaunas 16
Legal entity's code 303038190 +370 635 16380
A.s. LT984010042503106510 www.energyadvice.lt
AB DNB bank [email protected]
Figure 3.5.1 Power line parameters window
Figure 3.5.2 Power line specific parameters window
MB Energy Advice K. Baršausko g. 59-436, LT-51423 Kaunas 17
Legal entity's code 303038190 +370 635 16380
A.s. LT984010042503106510 www.energyadvice.lt
AB DNB bank [email protected]
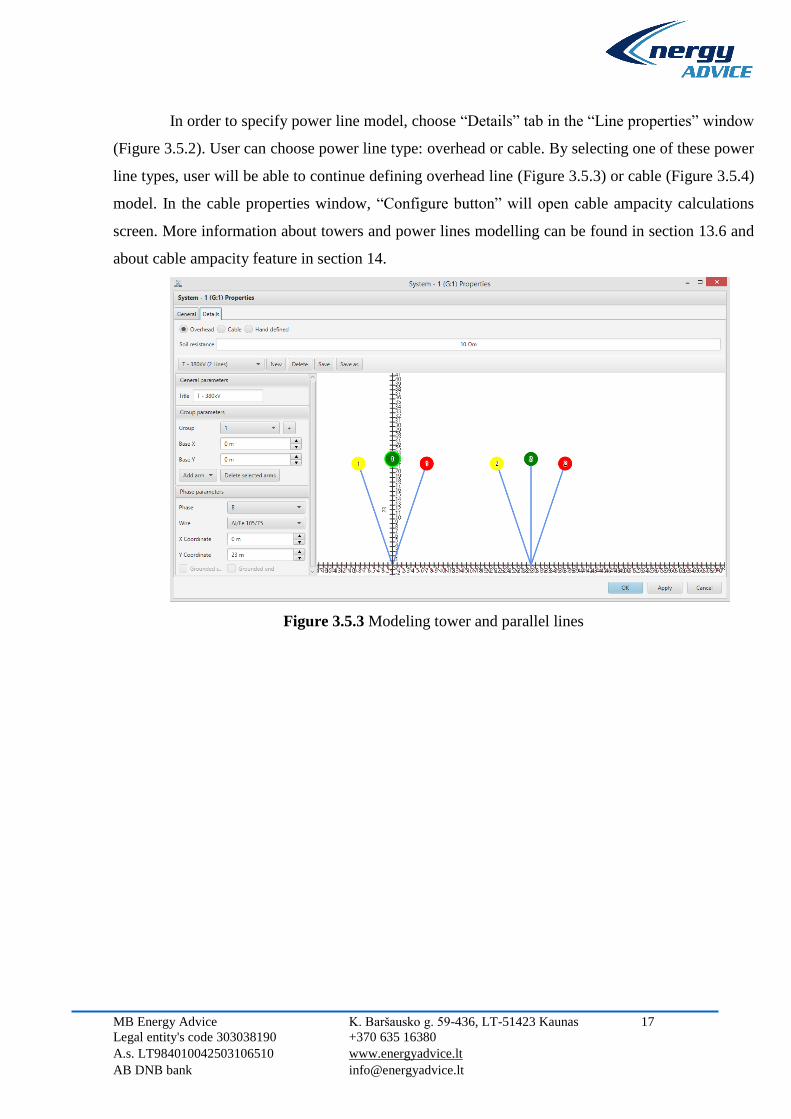
In order to specify power line model, choose “Details” tab in the “Line properties” window
(Figure 3.5.2). User can choose power line type: overhead or cable. By selecting one of these power
line types, user will be able to continue defining overhead line (Figure 3.5.3) or cable (Figure 3.5.4)
model. In the cable properties window, “Configure button” will open cable ampacity calculations
screen. More information about towers and power lines modelling can be found in section 13.6 and
about cable ampacity feature in section 14.
Figure 3.5.3 Modeling tower and parallel lines

MB Energy Advice K. Baršausko g. 59-436, LT-51423 Kaunas 18
Legal entity's code 303038190 +370 635 16380
A.s. LT984010042503106510 www.energyadvice.lt
AB DNB bank [email protected]
Figure 3.5.4 Cable ampacity window
Figure 3.5.5 Parallel lines graphic

MB Energy Advice K. Baršausko g. 59-436, LT-51423 Kaunas 19
Legal entity's code 303038190 +370 635 16380
A.s. LT984010042503106510 www.energyadvice.lt
AB DNB bank [email protected]
3.6. Defining parameters of the 2 – winding and 3 – winding transformers
As for other elements user needs to enter parameters of the transformer manually. For
customizing transformer parameters “Configure” button is selected as shown in Figure 3.6.1 and all
required fields are filled. If there is a possibility to regulate transformer’s tap changer position, then
field next to inscription “Tap changer” is checked and tap changer parameters are entered (shown in
Error! Reference source not found.). In tab “Connection type” user can change phase difference b
etween line – to – line voltage vectors and choose an appropriate connection type (star, delta or
grounded star).
If grounded star connection type is selected, additional graphics will be added to the one-
line network diagram that represents neutral grounding configuration. (Figure 3.6.2 / Figure 3.6.3/
Figure 3.6.4)
Figure 3.6.1 “Configure” tab of transformer parameters
Figure 3.6.2 Grounded star
where X and R is not zero
Figure 3.6.3 Grounded star
where X is equal to zero
Figure 3.6.4 Grounded star
where R is equal to zero

MB Energy Advice K. Baršausko g. 59-436, LT-51423 Kaunas 20
Legal entity's code 303038190 +370 635 16380
A.s. LT984010042503106510 www.energyadvice.lt
AB DNB bank [email protected]
Advanced parameters in “Advanced” tab (Figure 3.6.5) are only required for harmonic losses
calculation. For other calculations they are not necessary.
Figure 3.6.5“Advanced” tab of transformer parameters
For a three – winding transformer, input parameters are as shown in Figure 3.6.6. If short
circuit powers (P_SC(high), P_SC(mid), P_SC(low)) are given referred to a primary circuit
((P_SC(high-mid), P_SC(high-low), P_SC(mid-low)), the following formulas should be used to
calculate individual windings data (P_SC(high), P_SC(mid), P_SC(low)).
PkHigh 0.5 PkHigh_mid PkHigh_low PkMid_low
PkMid 0.5 PkHigh_mid PkMid_low PkHigh_low
PkLow 0.5 PkHigh_low PkMid_low PkHigh_mid

MB Energy Advice K. Baršausko g. 59-436, LT-51423 Kaunas 21
Legal entity's code 303038190 +370 635 16380
A.s. LT984010042503106510 www.energyadvice.lt
AB DNB bank [email protected]
Figure 3.6.6 Three winding transformer properties “Configure” tab

MB Energy Advice K. Baršausko g. 59-436, LT-51423 Kaunas 22
Legal entity's code 303038190 +370 635 16380
A.s. LT984010042503106510 www.energyadvice.lt
AB DNB bank [email protected]
3.7. Defining parameters of the Generator
Parameters needed to be entered for a synchronous generator are depicted in generator
parameters window in Figure 3.7.1.
Figure 3.7.1 Generator parameters window
Hint 4: It is possible to change loading of generators, motors, loads and inverters. This
function is useful when these system elements are not working under full loading conditions
and one needs to asses these conditions in the calculation. Loading can be changed in the
parameter window of these elements or in the load flow summary table (14 in Figure 2.1.1).

MB Energy Advice K. Baršausko g. 59-436, LT-51423 Kaunas 23
Legal entity's code 303038190 +370 635 16380
A.s. LT984010042503106510 www.energyadvice.lt
AB DNB bank [email protected]
3.8. Defining parameters of the Load
To fully define load, user should enter its real and reactive power, or enter real power and
power factor in a load properties window (Figure 3.8.1).
Figure 3.8.1 Load properties window

MB Energy Advice K. Baršausko g. 59-436, LT-51423 Kaunas 24
Legal entity's code 303038190 +370 635 16380
A.s. LT984010042503106510 www.energyadvice.lt
AB DNB bank [email protected]
3.9. Defining parameters of the Inverter
To fully define inverter parameters user should enter its real and reactive power or real power
and power factor as for the regular load. However, power inverters are the main reason for voltage
and current distortion in the power systems, therefore, in “Configure” tab of the inverter properties
dialog (depicted in Figure 3.9.1) user can manually define the harmonic spectrum of the inverter.
Figure 3.9.1 Harmonic spectrum of power inverter
Hint 5: By default the harmonic spectrum of 6 pulse power inverter is defined in the
“Configure” tab.
Ratio Ih/ IN (in Figure 3.9.1) is a harmonic current expressed in percent of the inverter base
amperes.
3.10. Defining parameters of the Photovoltaic systems and Wind turbines
Photovoltaic power systems and wind power plants are defined in the same way as the power
inverters. If user wants to define wind power plant that is connected to the network without the
inverter, then “Generator” element should be used as provided in Section 3.7.

MB Energy Advice K. Baršausko g. 59-436, LT-51423 Kaunas 25
Legal entity's code 303038190 +370 635 16380
A.s. LT984010042503106510 www.energyadvice.lt
AB DNB bank [email protected]
3.11. Defining parameters of the Capacitor
To fully define the capacitor just enter its real and reactive power, example is in Figure
3.11.1.
Figure 3.11.1 Capacitor properties windowFigure 3.11.1
3.12. Defining parameters of the Series Reactor and Shunt Reactor
Shunt reactors are used in the high voltage transmission systems to mitigate increase of
voltage due to parallel capacitance between overhead lines and ground or cable conductors and
ground. Series reactors are used to reduce short – circuit currents.
Shunt reactor is defined identically as the capacitor or load. On the other hand, series reactor
is more like transformer but it has only one coil. Series reactor is connected between two busses and
user shall define its voltage level, short circuit power and nominal power as depicted in Figure 3.12.1.

MB Energy Advice K. Baršausko g. 59-436, LT-51423 Kaunas 26
Legal entity's code 303038190 +370 635 16380
A.s. LT984010042503106510 www.energyadvice.lt
AB DNB bank [email protected]
Figure 3.12.1 Series reactor parameters dialog
3.13. Defining parameters of the Active Filter
Active filter is used to mitigate higher harmonics, by injecting the required frequency, same
amplitude, however, opposite direction currents into the power network. When adding this element
user has to choose at which bus it will be connected and enter its nominal current, and observable
element (Figure 3.13.1). In the “Configure” window user can specify filter current limit for each
harmonic.
Figure 3.13.1 Active filter parameters dialog

MB Energy Advice K. Baršausko g. 59-436, LT-51423 Kaunas 27
Legal entity's code 303038190 +370 635 16380
A.s. LT984010042503106510 www.energyadvice.lt
AB DNB bank [email protected]
3.14. Defining parameters of the Passive Filter
In EA-PSM it is possible to design single-tuned harmonics filter. This type of filter is
commonly used to mitigate individual harmonics in the powers systems. Passive filters are connected
near to harmonics-generating loads like variable frequency drives, solar power plants and etc.
In order to create single-tuned filter model (Figure 3.14.1), user first should enter “Harmonic
order” that need to be mitigated with the particular filter. Then it is recommended to enter “Reactive
power, Q” according to the load flow results in the nearest power line upstream. Software will
automatically calculate filter inductance according to the “Harmonic order” and “Reactive power,
Q”, thus user do not need to specify inductance value manually. It is recommended to specify passive
filter “Resistance, R” value according to filter quality factor. According to the quality factor,
sharpness of the tuning frequency will depend. It is recommended to use quality factor equal to 50
that will cause highest effect on mitigating the selected harmonic. Smaller quality factor values will
have less effect on mitigating the selected harmonic, however, other harmonics will be reduced more.
When quality factor value is decided, resistance of the filter can be calculated from the following
formula:
𝑅 =√𝐿𝐶
𝑘
here L – passive filter inductance, k – quality factor, C – passive filter capacitance that can be
calculated with a formula 𝐶 = 𝑄/(2𝜋𝑓𝑈𝑛2), where f is system frequency, Un – rated (nominal) filter
voltage, Q – reactive power.
Figure 3.14.1 Passive filter properties

MB Energy Advice K. Baršausko g. 59-436, LT-51423 Kaunas 28
Legal entity's code 303038190 +370 635 16380
A.s. LT984010042503106510 www.energyadvice.lt
AB DNB bank [email protected]
3.15. Defining parameters of the Induction Motor
EA-PSM has a functionality to calculate static and dynamic induction motor starting. In this
section information will be provided, how to define induction motor parameters.
Double click on the motor element and “General” properties tab (Figure 3.15.1) will open.
Active and reactive power of the induction motor can be defined manually by entering “Real power,
P” and “Reactive power, Q” or “Power factor, cosφ” values. Note, that “Real power, P” is electrical
power that can be measured with a power analyzer and it is not a mechanical power that is
usually provided on the nameplate of the induction motor.
For static induction motor starting calculation, data in the “Configure” tab (Figure 3.15.2)
should be specified.
Electrical power of the induction motor will depend on the mechanical load. With EA-PSM
it is possible to calculate electrical power of the induction motor without performing measurements,
however, load properties and induction motor specifications need to be defined. For this purpose,
in the induction motor properties window select “Dynamics” tab (Figure 3.15.3) and push the check
box next to the inscription “Use dynamics” as shown in Figure 3.15.3. When this box is selected,
data described in “General” and “Configure” tabs will not be used for the calculations. Real
and reactive power as well as starting current will be automatically calculated according to the
induction motor specifications in “Dynamics” tab (Figure 3.15.3) and load properties in “Load
Figure 3.15.1 Motor properties “General” tab
Figure 3.15.2 Motor properties “Configure” tab

MB Energy Advice K. Baršausko g. 59-436, LT-51423 Kaunas 29
Legal entity's code 303038190 +370 635 16380
A.s. LT984010042503106510 www.energyadvice.lt
AB DNB bank [email protected]
properties” tab (Figure 3.15.4). It will be also possible to calculate dynamic motor starting after
this data is specified.
Figure 3.15.3 Motor properties “Dynamics” tab
Figure 3.15.4 Motor properties “Load properties”
tab
Data to be specified in “Dynamics” and “Load properties” tabs:
RPM – rated revolutions per minute,
J – total mechanical inertia,
Xls – stator leakage reactance per phase,
Xlr – rotor leakage reactance per phase,
Xm – magnetizing reactance per phase,
Rs – stator resistance per phase,
Pm – rated mechanical power,
B – friction coefficient,
Efficiency – induction motor efficiency,
Tm_n – full load torque,
Load type: “Constant” – typical for screw compressors and conveyors; “Linear; “Square” – typical
for centrifugal pumps and fans; “Cube”; “Polynomial”.
Load – mechanical load momentum for the induction motor axis.
Load 𝜔𝑠 – rated load speed at which defined momentum will appear.

MB Energy Advice K. Baršausko g. 59-436, LT-51423 Kaunas 30
Legal entity's code 303038190 +370 635 16380
A.s. LT984010042503106510 www.energyadvice.lt
AB DNB bank [email protected]
The majority of this data can be given be the induction motor manufacturer. However, if it
is not known, it is highly recommended to use motor models that are provided in EA-PSM library
(push drop down menu button that is shown in Figure 3.15.1).
4. Append scheme to scheme
This feature allows users to merge two EA-PSM schemes into one. The functionality allows
to work efficiently with big networks.
Figure 4.1 Main scheme
Figure 4.2 New/test scheme

MB Energy Advice K. Baršausko g. 59-436, LT-51423 Kaunas 31
Legal entity's code 303038190 +370 635 16380
A.s. LT984010042503106510 www.energyadvice.lt
AB DNB bank [email protected]
First of all, open the scheme which you want to append into i.e.(Figure 4.1). Then select File
→ button, “Open file” box will pop up. Select scheme which you want to append (i.e.
Figure 4.2) into currently opened scheme and click “Open”. “Append grid” box will show up (Figure
4.3).
Figure 4.3 Append grid box
In “Opened file insertion bus” select a new/test scheme’s bus which will be merged with the
selected main scheme’s bus. In “Current grid insertion bus” select a main scheme’s bus which will
be a start point for an appended scheme. Then click “Ok” button and two schemes will be merged
together (Figure 4.4Figure 4.4).
Figure 4.4 Two schemes merged together

MB Energy Advice K. Baršausko g. 59-436, LT-51423 Kaunas 32
Legal entity's code 303038190 +370 635 16380
A.s. LT984010042503106510 www.energyadvice.lt
AB DNB bank [email protected]
5. Cage numbering
In order to create neat and easy to understand scheme user could define cage number for the
breakers. The breaker numbering will also prevent line connections from the rearrangement after
changing bus position. Program will automatically sort breaker cages depending on their number and
give them a fixed position. Scheme with numbered cages is shown in Figure 5.2.
Figure 5.1 Breaker properties window
In order to define cage number for the breaker, double tap on the breaker and in the properties
window (Figure 5.1) specify “Cage number” and click “Apply”.
Figure 5.2 Scheme with cage numbers

MB Energy Advice K. Baršausko g. 59-436, LT-51423 Kaunas 33
Legal entity's code 303038190 +370 635 16380
A.s. LT984010042503106510 www.energyadvice.lt
AB DNB bank [email protected]
6. Adding notes
By selecting from the elements panel and clicking on the
desired location on the network, user can add a note. To change
note contents double click on it and in the properties table (Figure
6.2) change title, text and the color of the note. Note size can be
changed by dragging bottom right corner.
Figure 6.1 Note
Figure 6.2 Note properties
Note also can be linked with a busbar, then it will move together with the linked bus. To link
note with a busbar simply click and drag “Linking button” at the bottom left corner of the note on the
desired busbar.

MB Energy Advice K. Baršausko g. 59-436, LT-51423 Kaunas 34
Legal entity's code 303038190 +370 635 16380
A.s. LT984010042503106510 www.energyadvice.lt
AB DNB bank [email protected]
7. PERFORMING POWER GRID CALCULATIONS
EA-PSM program is capable of performing these calculations:
Power flow
Short circuit (three phase, phase – to – phase, phase to neutral, two phases to
neutral)
Harmonics load flow
Static and dynamic motor start – up
Arc flash
Protection tracking
Relay coordination
7.1. Power flow calculations
To calculate power flows in the grid:
In the main menu bar select “Calculate” and press the dropdown icon
Press “Power Flow” and power flows will be calculated, results will be displayed
on the one-line network diagram.
Results can be also analyzed from the summary table (Figure 7.1.1), for opening
the table press “Load flow summary” (Figure 2.1.1)
By choosing elements from the table (simply push on the line in the table), user can
navigate through the one-line network diagram.
Additional data can be added to the summary table by pushing “+” sign on the upper
right corner of the table.
It is possible to change parameters of loads, generators, motors and other elements from the
summary table. User can double click on the parameter that needs to be changed and update
the value.

MB Energy Advice K. Baršausko g. 59-436, LT-51423 Kaunas 35
Legal entity's code 303038190 +370 635 16380
A.s. LT984010042503106510 www.energyadvice.lt
AB DNB bank [email protected]
Figure 7.1.1 Power flow results in a summary table
Red color in the load flows summary table indicates that either voltage or current exceeds
the limit. Voltage limit can be defined manually for each bus. Current limit depends on the
permitted current, which is usually provided by the manufacturer. Cables’ current limit can
be calculated according to the installation conditions with EA-PSM cable ampacity module.
Blue color in the summary table indicates that economically feasible limit of line current is
exceeded. It is recommended to choose line with a bigger cross section area.

MB Energy Advice K. Baršausko g. 59-436, LT-51423 Kaunas 36
Legal entity's code 303038190 +370 635 16380
A.s. LT984010042503106510 www.energyadvice.lt
AB DNB bank [email protected]
7.2. Short circuit calculations
To perform short circuit calculation:
In the main menu bar select “Calculate” and press the dropdown icon
From the drop-down list choose whether EA-PSM should “Calculate Minimum
Short Circuit”, “Calculate Maximum Short Circuit” or “Calculate Both”.
Then calculate “Short circuit K3”, “Short circuit K2”, “Short circuit K1” or “Short
circuit K1,1”.
The results will be saved in the short circuit summary table (Figure 7.2.1) and on
the one-line diagram. In the summary table on the left side select the short circuit
location, on the upper tab choose short circuit type (K3,K2,K1,K1,1, min or max).
The selected results will appear in the table. Phase voltage and current values are
marked UA, UB, UC, IA, IB, IC. Voltage and current values of different sequences
are marked ad U1,U2,U0, I1, I2, I0.
Selecting maximum or minimum short circuit icon (Figure 2.1.1)
will allow to analyze the results according to the short circuit location, by choosing
the short circuited bus on the one-line network diagram.

MB Energy Advice K. Baršausko g. 59-436, LT-51423 Kaunas 37
Legal entity's code 303038190 +370 635 16380
A.s. LT984010042503106510 www.energyadvice.lt
AB DNB bank [email protected]
Figure 7.2.1 Short circuit calculation results table
K3 – three–phase short circuit;
K2 – phase – to – phase short circuit;
K1 – phase-to-earth short circuit;
K1,1 – two-phase-to-earth short circuit;
With EA-PSM user can also calculate peak values of the short circuit current. On the upper
left side of the short circuit summary table push button “Peak”. Example of “Peak” values table are
shown in Figure 7.2.2.Meanings of the short circuit results values are:
Ip – peak current,
Idc0 – DC component of the short circuit current at the beginning of the short circuit,
Idc100 – DC component of the short circuit current after 100 seconds from the beginning of
the short circuit,
Ib – breaking current (estimated current that breaker will disconnect),
R, X – network resistance and reactance values.

MB Energy Advice K. Baršausko g. 59-436, LT-51423 Kaunas 38
Legal entity's code 303038190 +370 635 16380
A.s. LT984010042503106510 www.energyadvice.lt
AB DNB bank [email protected]
Figure 7.2.2 Short circuit peak values
It is not necessary to calculate short circuit at all buses of the network. User can choose at
which bus short circuit should be calculated. From “Calculate” drop-down select “Calculate on click”,
choose the short circuit types you wish to calculate. Select maximum or minimum
short circuit icon (13 in Figure 2.1.1) and now it is possible to calculate short circuits at only one bus,
by simply clicking on that bus. Another way of doing this is to specify substation for the bus (Section
3.4) and calculate short circuit at the substation “Calculate” -> “Short circuit” -> “All in substations”.
7.3. Harmonic analysis
To perform harmonic analysis:
In main menu bar select “Calculate” and press icon and select “Harmonics”.
Keyboard button “F6” can be also used.
Results will appear on the one-line diagram, user can analyze harmonics spectrum
charts by putting mouse cursor on any of the network elements. Also observe
harmonics results by pressing “Harmonics load flow summary”
(Figure 2.1.1Figure 2.1.1 Main EA – PSM window).
Summary table of harmonics load flow results is depicted in Figure 7.3.1. Here user
can observe voltage harmonics at each bus and current harmonics at each branch.

MB Energy Advice K. Baršausko g. 59-436, LT-51423 Kaunas 39
Legal entity's code 303038190 +370 635 16380
A.s. LT984010042503106510 www.energyadvice.lt
AB DNB bank [email protected]
By pressing icon results will be displayed graphically as depicted in
Figure 7.3.2.
Red color in the harmonics results data indicated that total harmonics distortion
value is over the limit. Yellow color indicates that separate harmonics are exceeding
the limit. Harmonic limits are derived from IEEE standard.
Harmonic spectrum charts of each grid element can be observed by putting mouse
cursor on it and results will be shown directly on the one-line network diagram.
Figure 7.3.1 Harmonic load flow calculation results
Figure 7.3.2 Harmonic results graphic

MB Energy Advice K. Baršausko g. 59-436, LT-51423 Kaunas 40
Legal entity's code 303038190 +370 635 16380
A.s. LT984010042503106510 www.energyadvice.lt
AB DNB bank [email protected]
Voltage harmonic limits are provided in EA-PSM according to IEC 61000-3-6. Current
harmonic limits are calculated taking into account Isc/In ratio and are given according to
IEEE 519.
ES-PSM allows to calculate transformer power losses caused by harmonic load flows.
Additional data of low and high winding resistance should be specified in the transformer parameters
table. Transformer harmonic losses results are shown in Figure 7.3.3.
Data like active power losses in the transformer windings and eddy current losses are
automatically calculated. Also transformer temperature increase of oil and windings due to these
losses are calculated.
Figure 7.3.3 Transformer harmonic loses table
7.4. Motor start - up analysis
To perform motor start – up analysis:
First of all, user have to choose which motors should be assessed in the motor start – up
calculation. This can be done by choosing an appropriate motor and pressing the right mouse key
on it. A small list will show up with inscription “Set Starting”. User need to push on this
inscription and now motor will be assessed in the motor start – up calculation. Another way to do
this is to choose “Calculate” (12 in Figure 2.1.1) → “Motor Start” →” Motor Selection” and select
those motors that should be assessed in the calculation.

MB Energy Advice K. Baršausko g. 59-436, LT-51423 Kaunas 41
Legal entity's code 303038190 +370 635 16380
A.s. LT984010042503106510 www.energyadvice.lt
AB DNB bank [email protected]
After motors are selected user should press “Calculate” → “Motor Start” → Motor start simple”
or push F7 button on keyboard to perform the motor start – up analysis.
Results will instantly show up on a one line diagram or can be observed in “Motor Start – Up
Summary” table (Figure 7.4.1) which is activated by pressing button (14 in Figure
2.1.1).
Figure 7.4.1 Results of motor start – up analysis
NOTE. Button (upper right corner) in every result chart (Figure 7.1.1, Figure 7.2.1, Figure
7.3.1, Figure 7.4.1….) allows users to select which columns will be shown in result chart (Figure
7.4.2).

MB Energy Advice K. Baršausko g. 59-436, LT-51423 Kaunas 42
Legal entity's code 303038190 +370 635 16380
A.s. LT984010042503106510 www.energyadvice.lt
AB DNB bank [email protected]
Figure 7.4.2 “+” button function
7.5. Arc flash module
This module allows user to calculate arc flash incident energy, flash boundary, both arc and
fault currents, safe working distance. EA-PSM calculations are validated in accordance with IEEE
1584 standard. It is possible to choose from different equipment types and calculate incident energy
at any selected distance. Arc flash calculation results of EA-PSM can be used to optimize protection
devices and improve laborers working conditions by minimizing arc flash hazard exposed energy and
estimating safe working distance.
Figure 7.5.1 Bus substation panel

MB Energy Advice K. Baršausko g. 59-436, LT-51423 Kaunas 43
Legal entity's code 303038190 +370 635 16380
A.s. LT984010042503106510 www.energyadvice.lt
AB DNB bank [email protected]
To calculate arc flash user first has to select calculation parameters. This can be done by
opening fault bus properties and switching to “Substation” panel (Figure 7.5.1). Arc flash calculation
requires installation type to be selected. EA-PSM offers 4 installation/equipment types that complies
with IEEE 1584 standard:
1. Open air
2. Switchgear
3. MCC and panels (when voltage below 15kV)
4. Cables
User has an option to manually determine the arc flash distance. It will be used for
calculating the incident energy.
After all parameters are set click “Apply” and “Ok”
buttons save and close the dialog. Now arc flash can be calculated
by pressing “Calculate” at the top bar and selecting “Calculate arc
flash” (Shortcut to this action is F8) (Figure 7.5.2). Results table
will pop up. (Figure 7.5.3). All the data can be exported to the
Excel sheet as with other result tables.
Figure 7.5.2 Calculating arc flash
Figure 7.5.3 Arc flash summary table

MB Energy Advice K. Baršausko g. 59-436, LT-51423 Kaunas 44
Legal entity's code 303038190 +370 635 16380
A.s. LT984010042503106510 www.energyadvice.lt
AB DNB bank [email protected]
7.6. Motor dynamic analysis
In order to calculate dynamic motor starting, motor parameters should be specified according
to section 3.15. After this is done, push “Calculate” on the top menu bar, choose “Motor start” and
“Motor dynamic” from the lists that will appear. In the “Motor dynamic” window (Figure 7.6.1), user
can specify how much time ES-PSM should calculate of the induction motor starting. Parameters
“Step” and “ɛ” are needed for the solver of the induction motor starting and will have influence on
accuracy of the results and convergence of the solution. It is recommended to leave provided values.
On the right side of the table, motors that will start can be selected. To start the calculations.
“Ok” button should be pushed.
Figure 7.6.1 Motor dynamic parameters window
When calculations will be done, results window will appear as depicted in Figure 7.6.2.

MB Energy Advice K. Baršausko g. 59-436, LT-51423 Kaunas 45
Legal entity's code 303038190 +370 635 16380
A.s. LT984010042503106510 www.energyadvice.lt
AB DNB bank [email protected]
Figure 7.6.2 Motor dynamic start calculation results
In the first “Motor” tab user can analyze results:
s = (ws-wr) / wr – slip of the induction motor.
I_s – stator current.
I_r – rotor current.
Teta – parameter depending on the speed change of the induction motor.
Tem – electromagnetic momentum of the induction motor.
P_mech – mechanical power of the load and induction motor.
T_em(w) – electromagnetic momentum dependency on motor speed (mechanical
characteristic).
Cos(φ) – power factor of the induction motor.
T_load – mechanical momentum of the load.
When “Grid” tab is selected, motor starting influence on voltage and current RMS values and angles
can be analyzed.

MB Energy Advice K. Baršausko g. 59-436, LT-51423 Kaunas 46
Legal entity's code 303038190 +370 635 16380
A.s. LT984010042503106510 www.energyadvice.lt
AB DNB bank [email protected]
8. PROTECTION COORDINATION
With EA-PSM user can design network protection system, find optimal parameters for
protection devices, in order to maintain selectivity and fastest possible operation. From EA-PSM 4
user can also use automatic relay coordination feature for event more effective coordination of
inverse-time and definite-time characteristics of protection devices.
When a one-line network diagram is fully designed and different grid modes are analyzed it
is possible to model and coordinate grid relay protection. Users can add different kinds of protections:
Overcurrent protection
Undervoltage protection
Ground fault protection
Fuse
Circuit breaker
Mini circuit breaker
Thermal overload protection
Distance protection

MB Energy Advice K. Baršausko g. 59-436, LT-51423 Kaunas 47
Legal entity's code 303038190 +370 635 16380
A.s. LT984010042503106510 www.energyadvice.lt
AB DNB bank [email protected]
8.1. Adding “Protection unit” to elements
To add “Protection unit” double click on the system element to which protection need to be
added. Table shown in Figure 8.1.1 will pop out and “in” and/or “out” can be selected. Breaker can
be also added by selecting a protection device from the elements panel (Figure 2.1.1) and pressing on
the desired element in the scheme. Transformer with added protection can be seen in Figure 8.1.2.
Specific types of the “Protection units” can be chosen from the elements panel (3 in Figure
2.1.1) and connected to any system element.
Figure 8.1.1 Adding protection for created element window
Figure 8.1.2 Protection added for the transformer

MB Energy Advice K. Baršausko g. 59-436, LT-51423 Kaunas 48
Legal entity's code 303038190 +370 635 16380
A.s. LT984010042503106510 www.energyadvice.lt
AB DNB bank [email protected]
Breaker unit properties window overview
By double clicking on the “Protection unit” element, its properties window will open, shown
in Figure 8.1.3.In “General” tab (Figure 8.1.3) user can edit general information about the protection
unit, add current transformer and breaker data. EA – PSM will already provide recommended values
for the breaker, in blue colored lines.
The current transformer tab is designed to calculate ALF value, which is “Accuracy limiting
factor” of the transformer. However, properties that will be specified for the current transformer, is
not going to affect trip unit operation in any way. Explanation of the current transformer parameters
are provided below:
CT type – current transformer type (name). If it is 5P20, then 5P is accuracy class and 20 is
accuracy limiting factor (ALF). This means that when current is less than “20 * In “(In is nominal
current) then accuracy is 5%.
Coefficient – is current transformer ratio.
PN – is current transformer burden at which rated accuracy of the transformer is reached.
IED load – trip unit winding resistance.
Explanation of the breaker properties are provided below:
IN – nominal current.
UN – nominal voltage.
IKmax – maximum short circuit current.
Ip – peak short circuit current.
Idc – DC component of the short circuit current.
IB – breaking current.

MB Energy Advice K. Baršausko g. 59-436, LT-51423 Kaunas 49
Legal entity's code 303038190 +370 635 16380
A.s. LT984010042503106510 www.energyadvice.lt
AB DNB bank [email protected]
Figure 8.1.3 Breaker properties “General tab”
Figure 8.1.4 Breaker properties “Short Circuit” tab
In a “Short Circuit” tab shown in Figure 8.1.4 filtered short circuit results can be seen. Only
short circuits, which flow through the selected protection are shown in the table.
If asymmetrical short circuit is selected (K2, K1, K1.1), user will be able to analyze vector
diagrams by pressing “Vectors” button, as shown in Figure 8.1.5.

MB Energy Advice K. Baršausko g. 59-436, LT-51423 Kaunas 50
Legal entity's code 303038190 +370 635 16380
A.s. LT984010042503106510 www.energyadvice.lt
AB DNB bank [email protected]
Figure 8.1.5 Short circuit current and voltage phasors at a busbar

MB Energy Advice K. Baršausko g. 59-436, LT-51423 Kaunas 51
Legal entity's code 303038190 +370 635 16380
A.s. LT984010042503106510 www.energyadvice.lt
AB DNB bank [email protected]
In “Chart” tab, time-current charts of the selected protection devices will be depicted as in
(Figure 8.1.6), for convenient selectivity analyzes. Dotted line shows estimated time-current curve
error range, due to the imperfection of the protection devices. “Value tracker” feature helps users to
efficiently analyze the graphic and adjust protection devices (Figure 8.1.7).
Figure 8.1.6 Main protection chart

MB Energy Advice K. Baršausko g. 59-436, LT-51423 Kaunas 52
Legal entity's code 303038190 +370 635 16380
A.s. LT984010042503106510 www.energyadvice.lt
AB DNB bank [email protected]
Figure 8.1.7 Value tracker feature
Figure 8.1.8 Breaker properties “Protection” tab

MB Energy Advice K. Baršausko g. 59-436, LT-51423 Kaunas 53
Legal entity's code 303038190 +370 635 16380
A.s. LT984010042503106510 www.energyadvice.lt
AB DNB bank [email protected]
In a “Protection” tab shown in Figure 8.1.8 circuit breakers and relay protection can be
selected and edited by clicking “Add protection” button.
“Remove” button will delete selected protection.
“Export” button will form a report with the short circuit results and the protection device
parameters.
8.2. Configuring overcurrent protection
When overcurrent protection is selected from the list (Figure 8.1.8) and added to the Breaker
unit, user can configure its parameters. There are three different stages of overcurrent protection – I>,
I>> and I>>>. The configuration of all stages is the same, the only difference is the name that
distinguishes different stages. User can choose to configure non-directional or directional overcurrent
protection.
8.3. Configuring non-direction overcurrent protection
By default, added overcurrent protections are non-directional, show in Figure 8.3.1.
Figure 8.3.1 Non-directional overcurrent protection configuration

MB Energy Advice K. Baršausko g. 59-436, LT-51423 Kaunas 54
Legal entity's code 303038190 +370 635 16380
A.s. LT984010042503106510 www.energyadvice.lt
AB DNB bank [email protected]
Selecting “Characteristic” drop-down menu, user can select one of IEC or IEEE standard
tripping curves: definite time, normal inverse time, very inverse time, extremely inverse time and
long-time inverse time.
“Direction” drop down menu defines direction of the overcurrent protection. It can be non-
directional, directional forward or directional reverse.
Check box “Connected curve” enables option to connect different overcurrent protection
stages into one curve, as shown in Figure 8.3.2.
Figure 8.3.2 Connected overcurrent protection stages
“Relay time setting” defines protection time setting. Minimum values is 20 ms.
“Relay current setting” defines protection current setting in primary values.
Table shown in Figure 8.3.1, depicts protection sensitivity values of each short circuit type
calculate according to the “Relay current setting”. Sensitivity coefficient formula is provided in Eq.
(1).
𝑘𝑠𝑒𝑛𝑠 =𝐼𝑆𝐶
𝐼𝑟𝑒𝑙𝑎𝑦.𝑠𝑒𝑡𝑡𝑖𝑛𝑔.𝑐𝑢𝑟𝑟𝑒𝑛𝑡
(1)
Isc in this equation is min short circuit current. Bigger setting current means smaller ksens
value. It is recommended to have sensitivity value not less than 2, this assures that protection will
react to particular short circuit at particular bus. If sensitivity is less than 2, table cell turns red.

MB Energy Advice K. Baršausko g. 59-436, LT-51423 Kaunas 55
Legal entity's code 303038190 +370 635 16380
A.s. LT984010042503106510 www.energyadvice.lt
AB DNB bank [email protected]
8.4. Configuring directional overcurrent protection
There are two types of directional overcurrent protection – forward and reverse. Direction
overcurrent protection configuration window is shown in Figure 8.4.1.
Basic parameters are the same as in non-directional protection – characteristic, direction,
time settings and current setting.
“Characteristic angle” defines angle in degrees in which the protection is facing.
“Sector angle” is angle in degrees, which defines the tripping area of protection.
“Polarization voltage” defines the voltage needed for protection to trip.
On the left in Figure 8.4.1 user can view the directional protection diagram. By clicking
“Vectors” button in the table user can view different short circuit vectors and their direction.
Figure 8.4.1 Directional overcurrent protection configuration
8.5. Configuring undervoltage protection
When undervoltage protection is selected from the list (Figure 8.1.8) and added to Breaker
unit, user can configure its parameters. Like in overcurrent protection, there are three different stages
of undervoltage protection – U<, U<< and U<<<. Configuration of undervoltage protection is shown
in Figure 8.5.1.
“Phase selection type” defines the protection selection type. There are three types to choose
from – Phase to Ground, Phase to Phase, Positive sequence.
“Time setting” defines protection tripping time.

MB Energy Advice K. Baršausko g. 59-436, LT-51423 Kaunas 56
Legal entity's code 303038190 +370 635 16380
A.s. LT984010042503106510 www.energyadvice.lt
AB DNB bank [email protected]
“Voltage setting” defines minimum element voltage at which protection will trip.
“Minimal current” defines minimum current at which protection can operate.
Table shown in Figure 8.5.1, depicts protection sensitivity values of each short circuit type
based on voltage setting. If sensitivity value is between 1 and 2, cell color is yellow, if sensitivity
value is less that one or infinity, cell color is red.
Figure 8.5.1 Under voltage protection configuration
8.6. Configuring ground fault protection
When ground fault protection is selected from the list (Figure 8.1.8) and added to Breaker
unit, user can configure its parameters. This protection is very similar to overcurrent protection, user
also can choose non-directional or directional ground fault protection.
8.7. Configuring non-directional ground fault protection
Configuration of non-directional ground fault protection is the same as non-directional
overcurrent protection (see 8.3 paragraph). Configuration window is shown in Figure 8.7.1.

MB Energy Advice K. Baršausko g. 59-436, LT-51423 Kaunas 57
Legal entity's code 303038190 +370 635 16380
A.s. LT984010042503106510 www.energyadvice.lt
AB DNB bank [email protected]
Figure 8.7.1 Non-directional ground fault protection configuration
Like in non-directional overcurrent protection, user have to define direction, time setting and
current setting. Ground fault sensitivity table is similar to overcurrent protection sensitivity table,
only ground fault table compares current setting with short circuit K1 and K1,1 zero sequence current
multiplied by 3. If sensitivity value is less than 2, cell color is red.
8.8. Configuring directional ground fault protection
Directional ground fault protection also has two directions – forward and reverse. Like in
directional overcurrent protection user also have to define direction, time settings, current settings,
characteristic angle and sector angle. Configuration window is shown in Figure 8.8.1.
Differently than in overcurrent protection user can also define directional protection tripping
zone characteristic. User can choose Sector (same like in directional overcurrent protection), Sin (no
sector angle property) and Cos (no sector angle property). By selecting different short circuit from
the table, user can view its vectors in diagram and see if protection will trip. If current vector is inside
light blue area ground fault protection will trip.

MB Energy Advice K. Baršausko g. 59-436, LT-51423 Kaunas 58
Legal entity's code 303038190 +370 635 16380
A.s. LT984010042503106510 www.energyadvice.lt
AB DNB bank [email protected]
Figure 8.8.1 Directional ground fault protection configuration
8.9. Configuring fuse protection
When fuse protection is selected from the list (Figure 8.1.8) and added to Breaker unit, user
can select different fuses from EA-PSM fuse library, shown in Figure 8.9.1. Fuse configuration
windows is shown in Figure 8.9.2.
Figure 8.9.1 Fuse selection library

MB Energy Advice K. Baršausko g. 59-436, LT-51423 Kaunas 59
Legal entity's code 303038190 +370 635 16380
A.s. LT984010042503106510 www.energyadvice.lt
AB DNB bank [email protected]
Figure 8.9.2 Fuse configuration window
Click on the button and warning message will pop up (Figure 8.9.3). Adding fuse will
disable and remove other protections from this breaker. After pressing “OK”, it will be possible to
add the fuse.
Figure 8.9.3 Warning message

MB Energy Advice K. Baršausko g. 59-436, LT-51423 Kaunas 60
Legal entity's code 303038190 +370 635 16380
A.s. LT984010042503106510 www.energyadvice.lt
AB DNB bank [email protected]
By double clicking select the manufacturer → fuse name → current. Press „Ok“ button. The time-
current curve will be displayed on the right as in Figure 8.9.2. Use mouse wheel to zoom in and out,
left click to drag the graphic for more precise investigation. User can modify fuse title to better
distinguish it from other fuses. After „Apply“ button is pressed selected fuse is saved and „Chart“
section gets updated with the same graphic.
8.10. Configuring circuit breaker protection
Circuit breaker protection could be selected from the list (Figure 8.1.8) and added to Breaker
unit.
To select a circuit breaker user has to click on “Select Breaker” button. Then a circuit breaker
model selection window, shown in Figure 8.10.1, will pop up. There user should expand one of the
manufacturers (ABB, Siemens, Schneider…), then expand one of breaker models and select
appropriate tripping unit and press “OK”. Circuit breaker will be added and its curve will be shown
on the right in configuration window.

MB Energy Advice K. Baršausko g. 59-436, LT-51423 Kaunas 61
Legal entity's code 303038190 +370 635 16380
A.s. LT984010042503106510 www.energyadvice.lt
AB DNB bank [email protected]
Figure 8.10.1 Circuit breaker model selection library
Figure 8.10.2 Circuit breaker configuration window

MB Energy Advice K. Baršausko g. 59-436, LT-51423 Kaunas 62
Legal entity's code 303038190 +370 635 16380
A.s. LT984010042503106510 www.energyadvice.lt
AB DNB bank [email protected]
In configuration window (Figure 8.10.2) user can modify circuit breaker title, define nominal
circuit breaker current, define overload protection values (IR value and tR time value), short circuit
protection values (Isd value and tsd time value), instantaneous short circuit protection value (Ii value)
and ground fault protection value (Ig current value tg time value). Protection number and number of
properties depend on manufacturer and circuit breaker tripping unit. Every property value arrays are
taken from official public manufacturer documentation.
On the right, in configuration window, user can instantly preview curve changes. To make
configuration more easily there are several markers in the chart:
I_N in red – this is the nominal current of element or current from power flows.
I_Motor_start in green – current flowing through element during motor starting.
I_max in yellow – current calculated based on I_N and coefficients “Ka” (reserve
coefficient), “Kp” (transitional process coefficient), “Kg” (protection return coefficient). Coefficients
are configure in main configuration window. I_max value is calculated based on Eq. (2).
𝐼_max = 𝐼_𝑁 ∙𝐾𝑎∙𝐾𝑝
𝐾𝑔 (2)
8.11. Configuring user defined circuit breaker protection
In circuit breaker model selection user can select “User Defined” option (Figure
8.10.1Figure 8.11.1). This option is added if user did not find required circuit breaker in EA-PSM
library. User can easily define any circuit breaker characteristic. User defined circuit breaker
configuration window is shown in Figure 8.11.1.
Figure 8.11.1 User defined circuit breaker configuration window

MB Energy Advice K. Baršausko g. 59-436, LT-51423 Kaunas 63
Legal entity's code 303038190 +370 635 16380
A.s. LT984010042503106510 www.energyadvice.lt
AB DNB bank [email protected]
In configuration window user has to define nominal circuit breaker IN and three points
(current on x axis and time on y axis) shown in the right side of Figure 8.11.1. Each current point is
defined as a coefficient, which is multiplied by the nominal current, and each time point is defined in
seconds.
List of values to be defined:
IN – nominal current
I1 = IN * k1– coefficient k1 for a vertical Long Time Pickup line
t1 at I2t – time setting for overload stage or Long Time Band at this time breaker will trip when
current is I1
I2 = IN * k2 - coefficient k2 for a vertical Short Time Pickup line
t2 – time setting for a Short Time Band if “I2t” is selected, short time band will have I2t mode like
Long Time Band
I3 = IN *k3 - coefficient k3 for a vertical Instantaneous Pickup line
t3 – time setting for an Instantaneous Trip line
8.12. Configuring mini circuit breaker protection
When mini circuit breaker protection is selected from the list (Figure 8.1.8) and added to the
Breaker unit, user can configure its parameters. Mini circuit breaker is a circuit breaker used to protect
low voltage and low power appliances. Its configuration window is shown in Figure 8.12.1.

MB Energy Advice K. Baršausko g. 59-436, LT-51423 Kaunas 64
Legal entity's code 303038190 +370 635 16380
A.s. LT984010042503106510 www.energyadvice.lt
AB DNB bank [email protected]
Figure 8.12.1 Mini circuit breaker configuration window
In configuration window user can modify mini circuit breaker title, its nominal current IN,
ultimate current Iu (it should be larger than maximum short circuit current) and tripping characteristic
(B, C, D, K or Z). Like in circuit breaker, there are markers in the chart to ease nominal current
selection (see Configuring circuit breaker protection8.10 paragraph).
8.13. Configuring custom curve protection
When custom curve protection is selected from the list (Figure 8.1.8) and added to Breaker
unit, user can configure its parameters. Custom curve is used when none of the protection fits user
needs, or user has to add a dynamic protection curve, or user only has a protection curve on paper.
Custom curve can be defined two ways – by defining a curve formula or by defining few points on
the curve.
To define a curve by formula user has to enter a correct formula containing variable “I” in it
(Figure 8.13.1). User has to fully define the formula with all parentheses and correct mathematical
operators. In Figure 8.13.1 normal inverse time formula is defined with 600 A and 1s settings. User
also must define a starting value from which the curve starts and end value at which the curve ends
(or leave it at zero and let the curve extend to short circuit current).

MB Energy Advice K. Baršausko g. 59-436, LT-51423 Kaunas 65
Legal entity's code 303038190 +370 635 16380
A.s. LT984010042503106510 www.energyadvice.lt
AB DNB bank [email protected]
Figure 8.13.1 Custom curve parameters window
To define a curve by points, user has to enter base current and a few points in p.u. system
from the manufacturer provided data (Figure 8.13.2). To enter points user has to double-click on
“Current, A” or “Time, s” column cell, enter a value and press “Enter”. There is an option to check
“Interpolate” for each point. Use this option if you have a non-linear curve and you want it to be
smoother. To get the best result change the polynomial power (best use 3-9 values).

MB Energy Advice K. Baršausko g. 59-436, LT-51423 Kaunas 66
Legal entity's code 303038190 +370 635 16380
A.s. LT984010042503106510 www.energyadvice.lt
AB DNB bank [email protected]
Figure 8.13.2 Custom curve defined by points configuration window
9. DISTANCE PROTECTION
EA-PSM has an enhanced distance protection modelling and coordination module. User can
add and coordinate various distance protection relays from manufacturers like “Siemens”, “Alstom”,
“Schneider”, “ABB” or create costume distance protection relay model. In order to add distance relay
in the breaker unit properties (Figure 8.1.3), user should select “Distance protection” tab and check
the “Use distance protection” checkbox. Distance protection configuration will apply instantly and
does not require confirmation via “OK” or “Apply”.
Note that distance protection can’t be added at the connection point of elements such as
generators, loads, motors and similar.

MB Energy Advice K. Baršausko g. 59-436, LT-51423 Kaunas 67
Legal entity's code 303038190 +370 635 16380
A.s. LT984010042503106510 www.energyadvice.lt
AB DNB bank [email protected]
Figure 9.1 Configuration tab of the distance protection
In the “Configuration” toolbar (Figure 9.1) user can enable or disable distance protection for
selected breaker with “Use distance protection” checkbox, also by pressing “Export” button user can
export distance protection settings and short circuit results into text report (Figure 9.2).
Figure 9.2 Distance protection export settings

MB Energy Advice K. Baršausko g. 59-436, LT-51423 Kaunas 68
Legal entity's code 303038190 +370 635 16380
A.s. LT984010042503106510 www.energyadvice.lt
AB DNB bank [email protected]
9.1. Distance protection configuration
In the “Configuration” window (Figure 9.1) user can specify parameters of the distance
relays. For this purpose, short circuit results can be also depicted.
On the right side of the window:
1. “View settings” button: opens short circuit vectors selection window, the dialog is shown
in Figure 9.1.1. In the dialog user can choose, which of the vectors should be displayed.
Figure 9.1.1 View settings popup
- System mode: select short circuit system mode.
- K2, K11, K1: selection checkboxes for which resistance measurement loops to show for
each asymmetrical short circuit type.
1) A-B: Phase A to Phase B
2) B-C: Phase B to Phase C
3) C-A: Phase C to Phase A
4) A-G: Phase A to ground
5) B-G: Phase B to ground
6) C-G: Phase C to ground
- “Max Z to show” field: short circuit vectors above specified value will not be shown,
a notification will popup if the vector is higher.
2. “Buses” pane: list of all buses in the system. Each list cell is bordered and contains five
checkboxes. The top-left checkbox shows impedance vectors from breaker unit bus to the selected

MB Energy Advice K. Baršausko g. 59-436, LT-51423 Kaunas 69
Legal entity's code 303038190 +370 635 16380
A.s. LT984010042503106510 www.energyadvice.lt
AB DNB bank [email protected]
list bus. K3, K2, K1 and K1,1 checkboxes show appropriate short circuit impedance vectors from
breaker unit bus to the selected list bus. Each short circuit vectors are colored as follows: K3 – red;
K2 – green; K1 – blue; K1,1 – yellow;
On the left side of the window, user can configure distance protection settings:
1) “IED” dropdown menu: select witch type of distance protection to use.
2) “Blinder” box: click to expand load blinder settings, a load blinder can be enabled or
disabled, specific settings vary based on distance protection type.
3) “Zone” dropdown: select zone to edit, if zone has a ground current compensation
factor it is set to the factor of the selected zone for drawing short circuit vectors.
4) “Direction” dropdown menu: select zone direction from Forward, Reverse and Non-
directional.
5) “Enable” checkbox: Enable or disable currently selected zone.
6) “Time delay” field: Set time delay for selected zone.
7) Other fields are distance protection type specific and are defined by manufacturer.

MB Energy Advice K. Baršausko g. 59-436, LT-51423 Kaunas 70
Legal entity's code 303038190 +370 635 16380
A.s. LT984010042503106510 www.energyadvice.lt
AB DNB bank [email protected]
9.2. Distance protection coordination chart
Figure 9.2.1 Distance protection coordination tab
On the left side of configuration chart (Figure 9.2.1) user can configure:
1) Select to show phase to phase or phase to ground zones.
2) Show or hide distance protection of current breaker.
3) List of all distance protections in the system.
By double-clicking on a distance protection curve, user can open protection configuration
popup, shown in Figure 9.2.2.

MB Energy Advice K. Baršausko g. 59-436, LT-51423 Kaunas 71
Legal entity's code 303038190 +370 635 16380
A.s. LT984010042503106510 www.energyadvice.lt
AB DNB bank [email protected]
Figure 9.2.2 Distance protection configuration popup
Hint 6: Solid line in chart represent configured distance protection zones;
Dashed colored lines represent distance protection tolerance;
Dashed gray lines represent impedance from breaker unit bus to the marked bus.
Hint 7: Basic chart controls:
- Auto range chart by double-clicking;
- Zoom in and out with mouse wheel;
- Press and drag left mouse button to zoom to rectangle;
- Press and drag mouse wheel button to pan chart;
- Equalize axis scale by clicking on another axis (ex.: equalize y axis by clicking on
x axis)

MB Energy Advice K. Baršausko g. 59-436, LT-51423 Kaunas 72
Legal entity's code 303038190 +370 635 16380
A.s. LT984010042503106510 www.energyadvice.lt
AB DNB bank [email protected]
10. Line zero sequences parameters
Each line positive sequence impedance is shown in the calculations Summary tables.
As well as the relation between the return path resistance and line resistance RE/RL, and the relation
between the return path reactance and line reactance XE/XL as depicted in the picture. Magnitude and
angle of the coefficient K0 for each line is calculated automatically. Coefficient K0 and relations RE/RL
and XE/XL are 0 for transformers.
11. PROTECTION TRACKING MODULE
Automatic protection tracking feature allows estimation of protection devices operation
under initiated network conditions (normal, short circuit at any bus or motor start-up). The results of
the evaluation are displayed in tabular and graphical format thus allowing better understanding of the
protection devices operation and simple detection of unexpected protection devices tripping
problems.
Protection tracking window (Figure 11.1) is opened by pressing “Optimize” -> “Protection
Tracking” on the main menu bar. In protection tracking window, user can choose analysis type: Short
circuit/ Power flows/ Motor start. If the short circuit is selected user have to choose short circuit bus
(SC bus), short circuit type (SC) and enter resistance at the fault location (R fault).
In Figure 11.1 three-phase short circuit with 2 ohm resistance at fault location is initiated.
When the required conditions are defined, calculation is started by pressing “Calculate” button. As
depicted in Figure 11.1 1 one histogram represents behavior of the protection system, pick up time of
that histogram is green. Another histogram represents behavior of particular protection devices (there
can be more than one device in the protection system). Only those protection systems that caught
abnormal system parameters are depicted.
Meanings of colors can be found by moving mouse cursor on the color. Sometimes
histogram sections can be short, thus it is possible to use mouse wheel to zoom in or out.

MB Energy Advice K. Baršausko g. 59-436, LT-51423 Kaunas 73
Legal entity's code 303038190 +370 635 16380
A.s. LT984010042503106510 www.energyadvice.lt
AB DNB bank [email protected]
Figure 11.1 Protection tracking window
12. AUTOMATIC OVERCURRENT RELAY COORDINATION
In order to use this functionality, open one line network diagram on EA-PSM. Place breakers
from elements list on the branches, where overcurrent protection relays should be added.
Figure 12.1 One-line network diagram with 5 overcurrent protection devices in line

MB Energy Advice K. Baršausko g. 59-436, LT-51423 Kaunas 74
Legal entity's code 303038190 +370 635 16380
A.s. LT984010042503106510 www.energyadvice.lt
AB DNB bank [email protected]
In Figure 12.1 example of the functionality implementation is shown. In the network, 5
overcurrent protection devices are connected in line. In order to choose optimal parameters for these
devices, open “Relay coordination” table, by selecting “Optimize” from the main menu bar and then
“Relay coordination”. The table will open as depicted in Figure 12.2.
Figure 12.2 Overcurrent relay optimization main window
Explanation of coefficients of “Default reserve values” are provided in Eq. (2) in the text
above. “Default precision values” are current transformer and relay winding precision in percent.
Sensitivity values are explained in Eq. (1) in the text above. User can choose inverse-time or definite-
time protection type.
In “Breakers” tab user can select particular breakers that are already places in the network,
software will optimize trip units only for selected breakers. In this example, all five breakers from
Figure 12.1 are selected. Results of fully automatic relay optimization are provided in Figure 12.3.

MB Energy Advice K. Baršausko g. 59-436, LT-51423 Kaunas 75
Legal entity's code 303038190 +370 635 16380
A.s. LT984010042503106510 www.energyadvice.lt
AB DNB bank [email protected]
Figure 12.3 Overcurrent relay optimization results
13. ELEMENT MODELING
Modelling tools allow user to predefine models of grid elements, that later can be easily
accessed for the network scheme development. In order to create element model, click on the
“Modelling” button, which is on the main menu bar, and select required element. The table will appear
where user should define valid parameters of the selected element. After the parameters are defined,
push “Save new” button. Element model can be also created directly from an existing grid element
“Properties” table by pushing “Save model” button.
13.1. GENERATOR MODELLING
To create generator model user has to define required parameters, enter its name and save
the model. Generator parameters are explained in Figure 3.7.1.
13.2. MOTOR MODELLING
Parameters for induction motor model are described in 3.15 paragraph. Motor modelling
windows are depicted in Figure 13.2.1 and Figure 13.2.2.

MB Energy Advice K. Baršausko g. 59-436, LT-51423 Kaunas 76
Legal entity's code 303038190 +370 635 16380
A.s. LT984010042503106510 www.energyadvice.lt
AB DNB bank [email protected]
Figure 13.2.1 Motor modelling “Simple tab”
Figure 13.2.2 Motor modelling “Dynamics”
13.3. TRANSFORMER MODELLING
User has to enter transformer model title, choose transformer type (2 windings / 3 windings
/ 3 windings split) and provide other required parameters. Transformer tap changer and windings
configuration can be also included into the model. A detailed information about the 2 - windings
transformer is shown in Figure 3.6.1 and Figure 3.6.5. More information about the 3 - windings
transformer can be found in Figure 3.6.6.
13.4. STANDARD CIRCUIT BREAKER MODELLING
EA-PSM allows to create database of solid-state trip units, created model can be used for the
protection system development. Necessary parameters of the trip unit could be determined from the
manufacturer provided catalogs or from the protection unit nameplate.
To create a breaker model, in “Nameplate” tab (Figure 13.4.1) user should enter data, like
manufacturer, series and model.

MB Energy Advice K. Baršausko g. 59-436, LT-51423 Kaunas 77
Legal entity's code 303038190 +370 635 16380
A.s. LT984010042503106510 www.energyadvice.lt
AB DNB bank [email protected]
Figure 13.4.1 Standard circuit breaker modelling “Nameplate” tab
In “Nominal values” tab (Figure 13.4.2) user should define breaker nominal current “In”
values. Data can be entered as discrete numbers (i.e. “7.5 9 10.5 12 13.5 15”), where each number
represents valid current setting for the trip unit, or as currents array with a constant step (i.e.”
min=7.5, max =15, step = 1.5”). For nominal current values, dependency usually should be
selected to “None”.
Depending on the breaker capabilities in the “LT” (long time pickup), “ST” (short time
pickup), “I” (instantaneous pickup), G (“grounding protection”) each functionality current and
time settings should be defined in the same manner.

MB Energy Advice K. Baršausko g. 59-436, LT-51423 Kaunas 78
Legal entity's code 303038190 +370 635 16380
A.s. LT984010042503106510 www.energyadvice.lt
AB DNB bank [email protected]
Figure 13.4.2 Breaker modelling “Nominal values” tab
13.5. STANDART OVERLOAD PROTECTIONS MODELLING
With EA-PSM user can model overload protection relays and use created models for further
protection system development.
In order to create overload relay model, push “Modelling” button on the “Menu bar” and
select “Standard overload Protections”. Siemens 3UA50 00-1K relay model will be created in this
example. The relay technical data taken from the manufacturer’s publicly available sources is
provided in Table 1.
Setting range (A) Times the setting current (x Ie)
1.2 3 4 5 6 7 8
8; 8.9; 10.1; 11.3; 12.5 7200 24.5 14.8 10.2 7.8 6.2 5.2
Table 1 Relay technical data
In the Figure 13.5.1 relay modeling window is shown. User can define “Manufacturer”,
“Series” and “Model” titles. In “Label” window, current settings should be defined. Between separate
current settings values, space symbol must be left. In the list below, “Time, s” and “Current, p.u.”
values should be defined from the manufacturer provided data.
Current should be defined in per unit system, where base value is the current setting (i.e. 8, 8.9, 10.1
and etc.)

MB Energy Advice K. Baršausko g. 59-436, LT-51423 Kaunas 79
Legal entity's code 303038190 +370 635 16380
A.s. LT984010042503106510 www.energyadvice.lt
AB DNB bank [email protected]
Figure 13.5.1 Standard overload protection modelling window
When this data is provided, user can “Save” model into the EA-PSM database. It is possible
to add overload protection devices into the network from the elements panel, by selecting the symbol
.
13.6. WIRES, CABLES AND TOWERS MODELLING
In EA - PSM user can create templates for cables, overhead lines and towers that can be used
latter for the one-line network diagram development. It is also possible to use EA-PSM build-in
models of these network elements.
In order to create templates for previously mentioned elements select “Modelling” from the
main menu bar (Figure 2.1.1) and choose “Wire types”, “Cable types” or “Tower types” from the
drop down menu. Table will pop out as shown in Figure 13.6.1, Figure 13.6.2 or Figure 13.6.3
respectively. Here user will have to enter the required parameters and press “Save” to save the model.
To modify existing model, update its parameters and press “Save” button.
The required parameters can be found from the specifications of the equipment, which is
usually provided by a manufacturer.

MB Energy Advice K. Baršausko g. 59-436, LT-51423 Kaunas 80
Legal entity's code 303038190 +370 635 16380
A.s. LT984010042503106510 www.energyadvice.lt
AB DNB bank [email protected]
Figure 13.6.1 Wire type configuration window
Figure 13.6.2 Cable type modelling configuration window

MB Energy Advice K. Baršausko g. 59-436, LT-51423 Kaunas 81
Legal entity's code 303038190 +370 635 16380
A.s. LT984010042503106510 www.energyadvice.lt
AB DNB bank [email protected]
Figure 13.6.3 Tower type configuration window
In order to create costume tower type model, push “New” button that is highlighted in red in
Figure 13.6.3 and enter its name. The simple tower model will open as depicted in Figure 13.6.3 with
base coordinates (0;5) and phase coordinates (-0.5;0), (0.5;0), (0; 0.5). Phase coordinates are defined
considering the base coordinate as the reference point.
To give a full understanding of the tower type modeling, the example is described further in
the text. First of all, user should define “Group” number. The value shows number of parallel towers.
EA-PSM will use this data for overhead lines parameters calculation. In the example, group number
value is “2”. Phase, neutral, grounding and lighting protection conductors can be added for each group
separately by choosing the conductor type from the “Add arm” list. Base point coordinates can be
changed by updating “Base X” and “Base Y” values. For example, first tower base coordinates are (-
2;5) and another has base coordinates (2;5).
Each phase coordinates can be defined separately. As both towers are the same, coordinates
of phase conductors will not be different. For A conductor coordinate is (-1.04;0), for B (0;0.6), for
C (1.04;0). It is convenient to select phase conductor symbol on the tower drawing and define its
parameters in “Phase parameters” panel. At the same time, “Wire” type can be selected for each
phase. The result of tower type modelling is depicted in Figure 13.6.4, the model should be saved by
pushing one of the buttons: “Save” or “Save New”.
Ground with coordinates (±∞; 0)
(Base X=0; Base Y=5)
Phase conductors

MB Energy Advice K. Baršausko g. 59-436, LT-51423 Kaunas 82
Legal entity's code 303038190 +370 635 16380
A.s. LT984010042503106510 www.energyadvice.lt
AB DNB bank [email protected]
Figure 13.6.4 Two identical parallel towers model
14. CABLE AMPACITY
Cable ampacity module allows to estimate permitted cable current, which depends on cable
voltage, ambient conditions and cable arrangement. User can perform cable ampacity calculation in
accordance with:
IEC 6036-5-52 – Low-voltage electrical installation – 1kV or less
IEC 60502-1 – Power cables with extruded insulation – 1kV – 3.6kV
IEC 60502-1 – Power cables with extruded insulation – 6kV – 36kV

MB Energy Advice K. Baršausko g. 59-436, LT-51423 Kaunas 83
Legal entity's code 303038190 +370 635 16380
A.s. LT984010042503106510 www.energyadvice.lt
AB DNB bank [email protected]
To estimate cable current rating, first double-click to open properties window. Switch to “Details”
tab and select “Cable” checkbox. When cable type is chosen, as in Figure 14.1 push “Configure”
button to open “Cable Ampacity” window (Figure 14.2). In this window, specific data, describing
cable installation conditions, should be defined. Choose one of the listed installation method types
then push “Apply” to calculate cable ampacity rating and “Ok” to validate calculations for chosen
cable. Cable ampacity will be taken into account during calculations like load flows. In case current
exceeds ampacity rating, notification will be provided on the one-line network diagram and in the
summary table (current inscription will to red).
NOTE. Currently cable ampacity ratings is only calculated for cables of 0.4kV to 36kV.
Figure 14.1 Choosing cable from library
TIP. You can filter out unwanted cables by
pressing right mouse button on the table
headers (Manufacturer, Type, Voltage level,
Conductor material, Insulation type) and
deselecting unsuitable parameters or searching
for a cable by its parameter name.

MB Energy Advice K. Baršausko g. 59-436, LT-51423 Kaunas 84
Legal entity's code 303038190 +370 635 16380
A.s. LT984010042503106510 www.energyadvice.lt
AB DNB bank [email protected]
Figure 14.2 Cable ampacity calculation window
15. DATA IMPORTING AND EXPORTING
15.1. Calculation results exporting
In order to export any of the calculation results user should open Summary window as was
described in paragraph 7 and press button. Then choose desired data to export and
formatting type (export as numbers or as text).
Visual diagrams can be exported as a picture in .png format or user can copy data as a text
to the excel sheet or text document. By pressing right mouse button user will see a context menu with
“Save Picture” (save .png format picture in selected location) and “Copy Data” (copy diagram data
as text) option.
15.2. One line diagram exporting as a picture or drawing
EA – PSM allows to export a one – line diagram as a picture in .png format or as a drawing
in .dxf format that can be later modified with CAD programs (Figure 15.2.1). To export one line
diagram, user should choose “File” → “Export” → “Drawing .dxf file” (or “Picture .png file”) and
define location of the exported file on the computer.

MB Energy Advice K. Baršausko g. 59-436, LT-51423 Kaunas 85
Legal entity's code 303038190 +370 635 16380
A.s. LT984010042503106510 www.energyadvice.lt
AB DNB bank [email protected]
Figure 15.2.1 One line diagram exporting

MB Energy Advice K. Baršausko g. 59-436, LT-51423 Kaunas 86
Legal entity's code 303038190 +370 635 16380
A.s. LT984010042503106510 www.energyadvice.lt
AB DNB bank [email protected]
15.3. Custom data format(CDF) importing and exporting
Users now can import and export schemes from/to CDF text file. This format allows users
to exchange main scheme elements and parameters.
To import CDF file, click File → Import → Import CDF file. If user has an opened scheme
our software will suggest to save it before importing to prevent any work losses. Click import button
and select a CDF text file containing scheme parameters.
Be aware that our software does not use all of the CDF parameters. Table 2 shows which
values are not used for calculations by EA-PSM.
Section Parameter
Bus Load flow number
Bus Loss zone number
Bus Final voltage
Bus Final angle
Bus Desired volts
Bus Shunt conductance G
Bus Shunt susceptance B
Bus Remote controlled bus number
Branch Load flow number
Branch Loss zone number
Branch Type (4, 5 types are not supported)
Branch Control bus number
Branch Side
Branch Transformer (phase shifter) final angle
Branch Minimum voltage, MVAR or MW limit
Branch Maximum voltage, MVAR or MW limit
Section Explanation
Loss Zone EA-PSM does not support lose zones
Interchange Data EA-PSM does not support interchange data
Tie Line EA-PSM does not support tie line data.
Table 2 Unused data

MB Energy Advice K. Baršausko g. 59-436, LT-51423 Kaunas 87
Legal entity's code 303038190 +370 635 16380
A.s. LT984010042503106510 www.energyadvice.lt
AB DNB bank [email protected]
To export scheme to IEEE Common Data Format (CDF) text file click File → Export →
Export CDF file and select destination where the text file will be created. Be aware, that CDF does
not support all scheme parameters that EA-PSM uses for calculations, so there can be following data
loses:
Transformer winding voltage is exported as voltage of the bus to which transformer
is connected.
Transformer MVA rating is exported as integer, so any decimal values will be
exported as rounded integer values.
If more than one load, generator or capacitor is connected to a single bus, their active
and reactive powers will be summed and exported as a single generator, load or
capacitor values.
All active and reactive power values in CDF are exported as MW and MVAR so low
values will be too small and will not be exported.
Base power is automatically selected as that of the highest load, generator or
capacitor active or reactive power.
Case identification name will be the same as the name of the scheme user is
exporting.
16. HELP FUNCTIONS
In the main menu bar there is a button “Help”. By pressing it user can get important
information about the program, send his feedback and observe system log information.
16.1. Send feedback
Our goal is to create a power system modeling software with a superior product experience
to its end – user, therefore, we appreciate any feedback from our customers, as it helps us to
accomplish our goals. Thus, if any idea or impression occurs while working with EA – PSM please
don’t hesitate to send it by simply pressing “Help” → “Send feedback”. Any language is acceptable.
16.2. System Log
Problems of the calculations are usually depicted in the “System Log” window that can be
accessed by pressing “Help” → “System Log”. Therefore, if any problem occurs, please copy the text
from this window by pressing “Save” button or send it directly to us by pressing “Report” button. We
will solve the problem as fast as possible and contact you to inform about the possible solutions.

MB Energy Advice K. Baršausko g. 59-436, LT-51423 Kaunas 88
Legal entity's code 303038190 +370 635 16380
A.s. LT984010042503106510 www.energyadvice.lt
AB DNB bank [email protected]
16.3. Notification log
Here user can see all the processes output during the use of the EA-PSM. If error occurs,
reason could be also shown here.
16.4. User manual
This function will open the most recent version of EA-PSM user manual.