User Interface Development Human Interface Devices User Technology User Groups Accessibility.
Upload
elvitha-fransiskaCategory
view
483download
37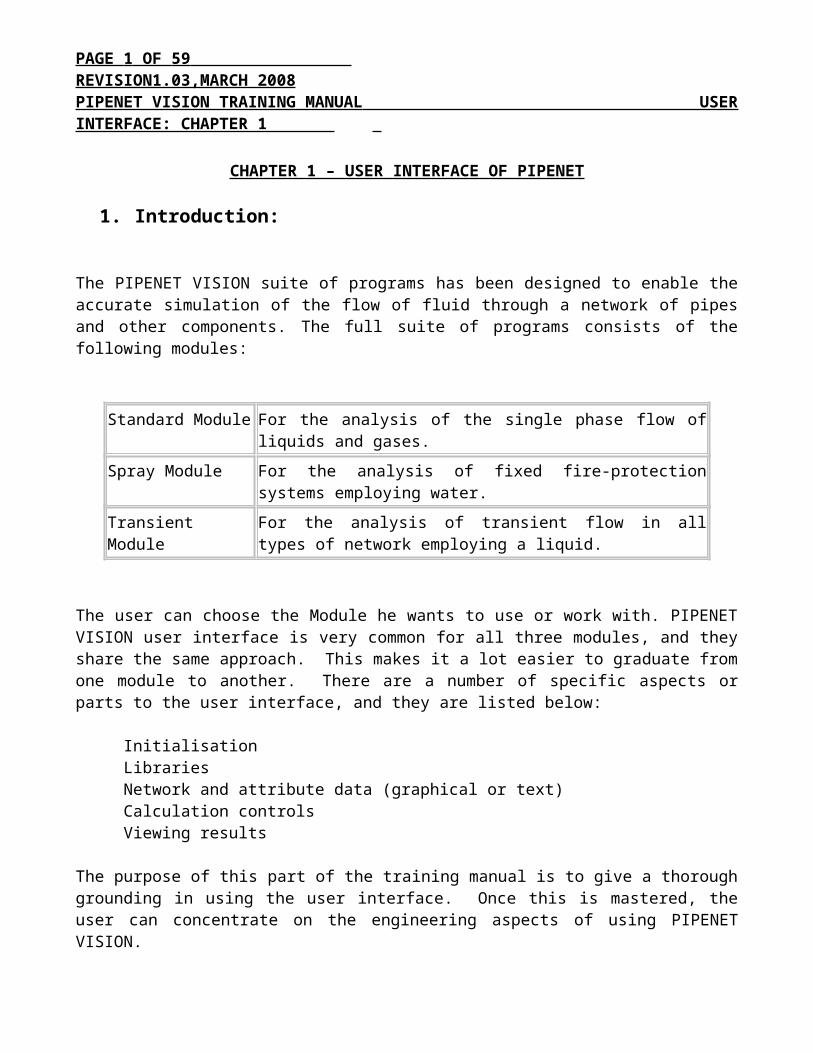
PAGE 1 OF 47 REVISION1.03,MARCH 2008 PIPENET VISION TRAINING MANUAL USER INTERFACE: CHAPTER 1
CHAPTER 1 – USER INTERFACE OF PIPENET
1. Introduction:
The PIPENET VISION suite of programs has been designed to enable the accurate simulation of the flow of fluid through a network of pipes and other components. The full suite of programs consists of the following modules:
Standard Module For the analysis of the single phase flow of liquids and gases.
Spray Module For the analysis of fixed fire-protection systems employing water.
Transient Module For the analysis of transient flow in all types of network employing a liquid.
The user can choose the Module he wants to use or work with. PIPENET VISION user interface is very common for all three modules, and they share the same approach. This makes it a lot easier to graduate from one module to another. There are a number of specific aspects or parts to the user interface, and they are listed below:
InitialisationLibrariesNetwork and attribute data (graphical or text)Calculation controlsViewing results
The purpose of this part of the training manual is to give a thorough grounding in using the user interface. Once this is mastered, the user can concentrate on the engineering aspects of using PIPENET VISION.
To create a New Project
When the user wants to start a new project in the Pipenet Vision, he has to access Pipenet Vision through the Pipenet Vision icon in the desktop or through Start ¦ Program ¦ Pipenet Vision ¦ Pipenet Vision.
Once PIPENET Vision is chosen, the PIPENET screen shall be changed as under.
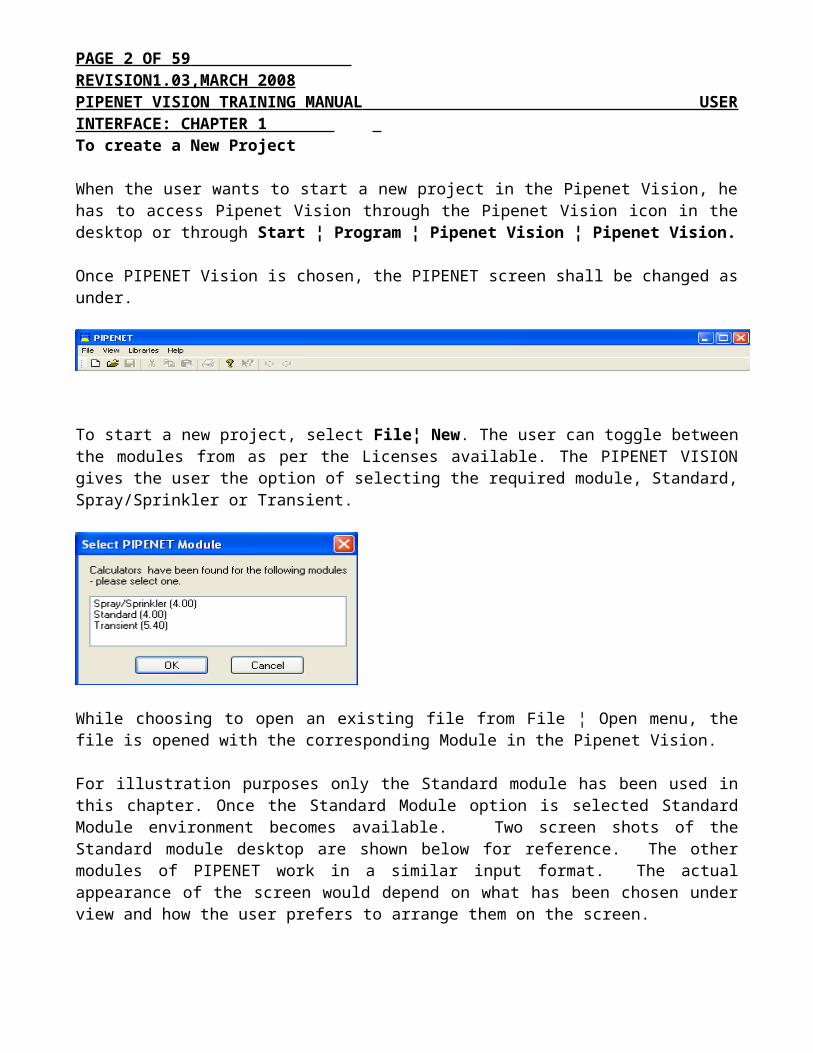
PAGE 2 OF 47 REVISION1.03,MARCH 2008 PIPENET VISION TRAINING MANUAL USER INTERFACE: CHAPTER 1 To start a new project, select File¦ New. The user can toggle between the modules from as per the Licenses available. The PIPENET VISION gives the user the option of selecting the required module, Standard, Spray/Sprinkler or Transient.
While choosing to open an existing file from File ¦ Open menu, the file is opened with the corresponding Module in the Pipenet Vision.
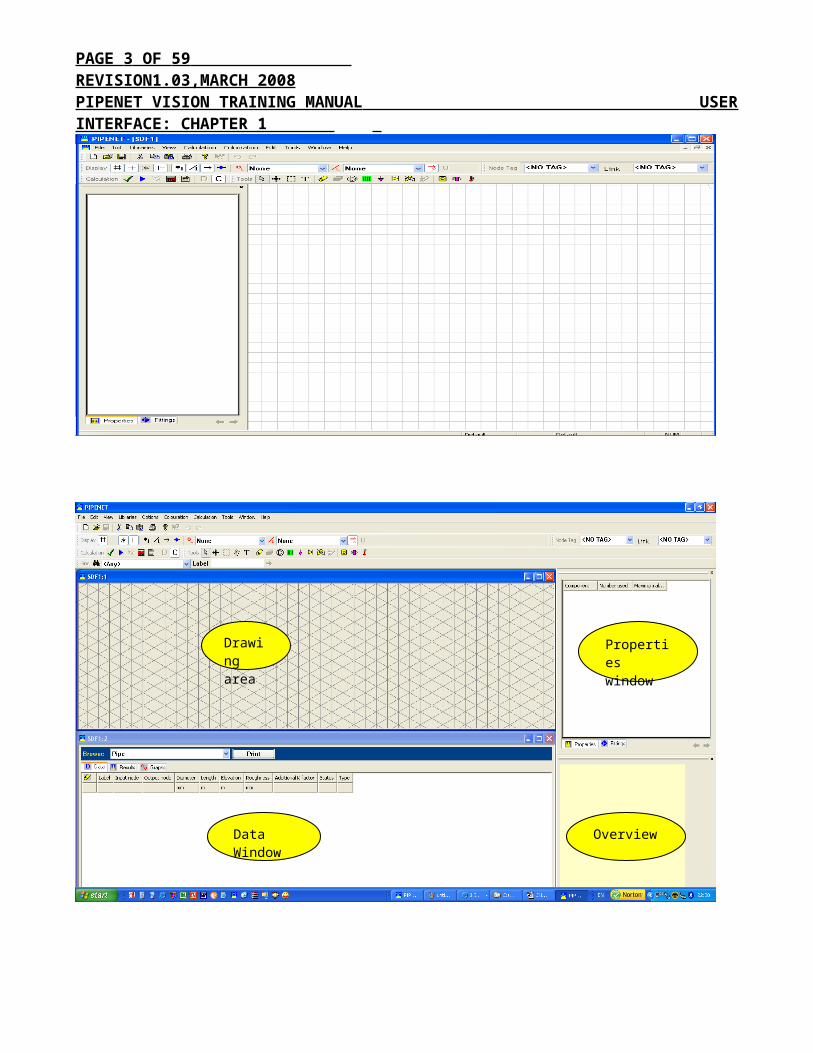
For illustration purposes only the Standard module has been used in this chapter. Once the Standard Module option is selected Standard Module environment becomes available. Two screen shots of the Standard module desktop are shown below for reference. The other modules of PIPENET work in a similar input format. The actual appearance of the screen would depend on what has been chosen under view and how the user prefers to arrange them on the screen.
PAGE 3 OF 47 REVISION1.03,MARCH 2008 PIPENET VISION TRAINING MANUAL USER INTERFACE: CHAPTER 1
2. File Menu:
Drawing area
Data Window
Properties window
Overview
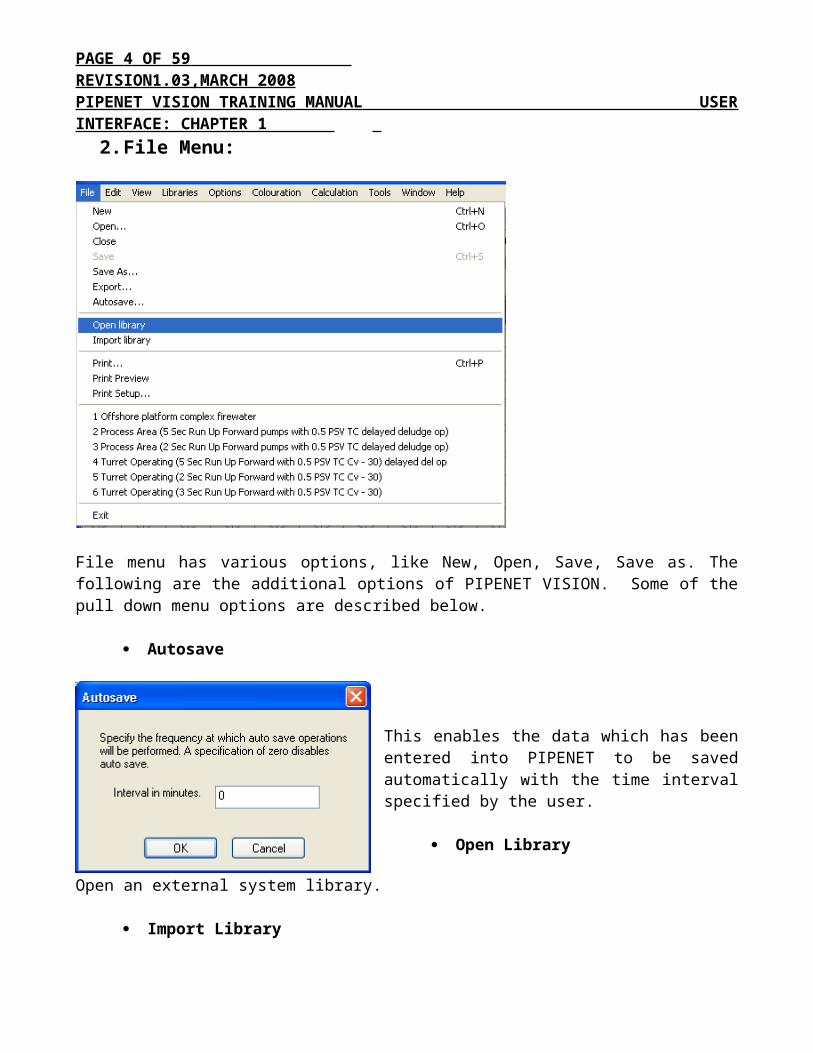
PAGE 4 OF 47 REVISION1.03,MARCH 2008 PIPENET VISION TRAINING MANUAL USER INTERFACE: CHAPTER 1 File menu has various options, like New, Open, Save, Save as. The following are the additional options of PIPENET VISION. Some of the pull down menu options are described below.
Autosave
This enables the data which has been entered into PIPENET to be saved automatically with the time interval specified by the user.
Open Library Open an external system library.
Import Library Import a library file - open a system library or old format library file (e.g. .pmp pump library file) and import its definitions into the local user library.
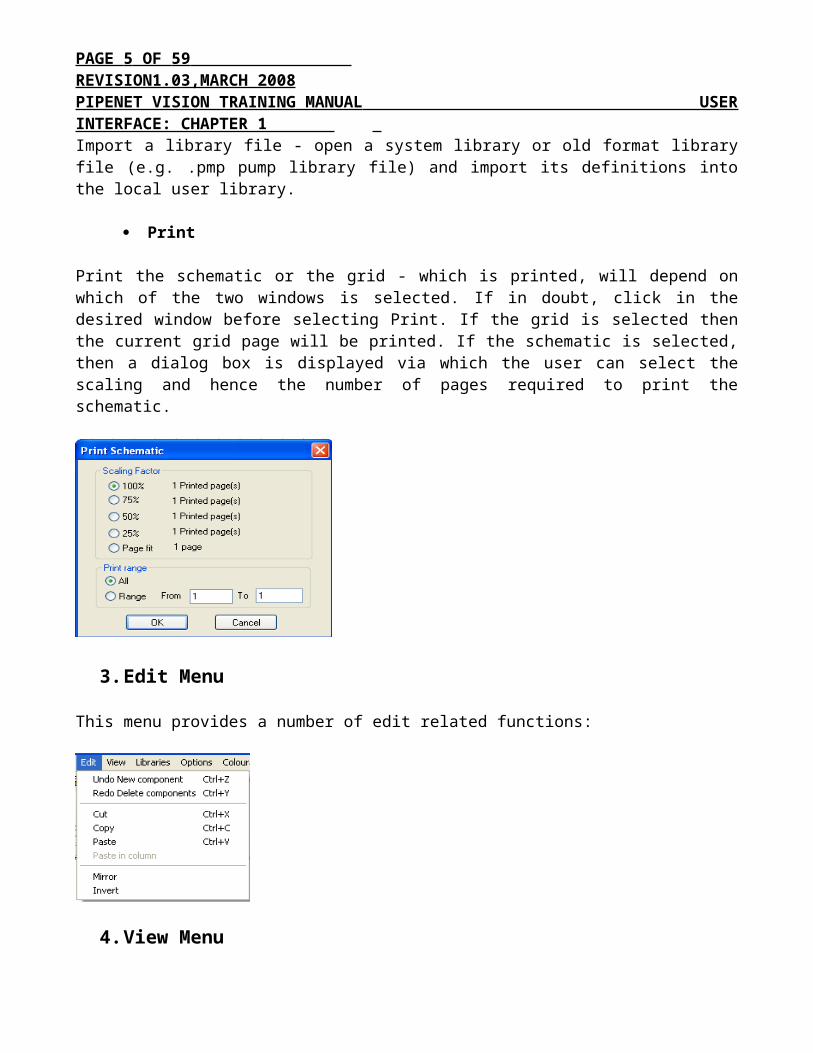
Print Print the schematic or the grid - which is printed, will depend on which of the two windows is selected. If in doubt, click in the desired window before selecting Print. If the grid is selected then the current grid page will be printed. If the schematic is selected, then a dialog box is displayed via which the user can select the scaling and hence the number of pages required to print the schematic.
PAGE 5 OF 47 REVISION1.03,MARCH 2008 PIPENET VISION TRAINING MANUAL USER INTERFACE: CHAPTER 1
3. Edit Menu
This menu provides a number of edit related functions:
4. View Menu
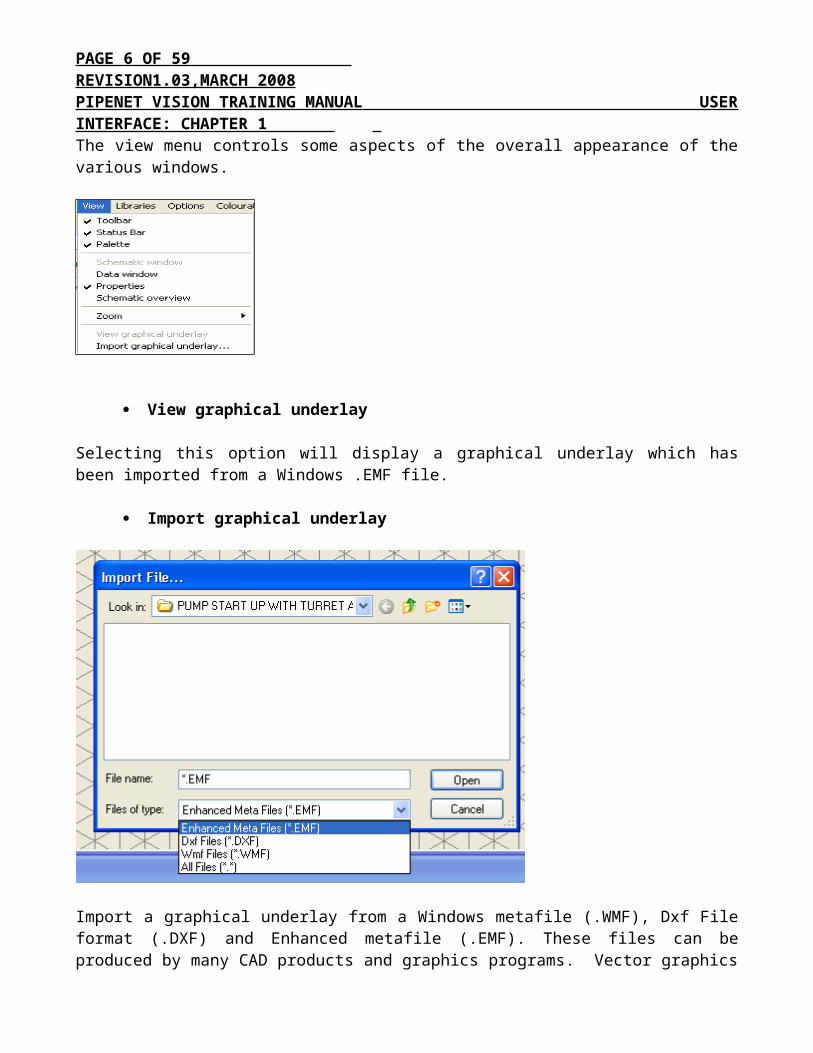
The view menu controls some aspects of the overall appearance of the various windows.
View graphical underlay Selecting this option will display a graphical underlay which has been imported from a Windows .EMF file.
Import graphical underlay
PAGE 6 OF 47 REVISION1.03,MARCH 2008 PIPENET VISION TRAINING MANUAL USER INTERFACE: CHAPTER 1
Import a graphical underlay from a Windows metafile (.WMF), Dxf File format (.DXF) and Enhanced metafile (.EMF). These files can be produced by many CAD products and graphics programs. Vector graphics file formats are used because they allow easy scaling of the underlay drawings. The imported graphic is displayed near the centre of the window scaled to fit the current size of the window. Such scaling could be independent of the scaling of PIPENET schematic. The size of the imported graphic can be controlled by zoom (see above). Its position is currently not controllable, however using the Area tool to move the network, the registration between the underlay and the PIPENET VISION network can be adjusted. The intensity of the displayed image, specified as a percentage, can be controlled via the underlay tool (The U button) on the Options toolbar.
5. Libraries
Libraries are used for storing items, which would be used several times in the same network or in different networks.
Types of Library
Two types of library are used in Pipenet Vision modules, namely Local User Library and System Library. They are described below.
Local User Library
This library is associated with the data file and is opened when the data file is open. It can contain the following for the Standard module
1. Pipe schedules
PAGE 7 OF 47 REVISION1.03,MARCH 2008 PIPENET VISION TRAINING MANUAL USER INTERFACE: CHAPTER 1
2. Control Valve Type3. Fittings4. Fluids 5. Pumps (Co-efficient Known & Co-efficient unknown)
There is only one local user library. PIPENET Vision automatically saves the library file when the ‘Sunrise Data File’ or .sdf is stored. The Library file takes the name of the ‘Sunrise Data File’. A local user library can be shared by one or more data file. If the library is changed in one network, it is changed for all users of the library.
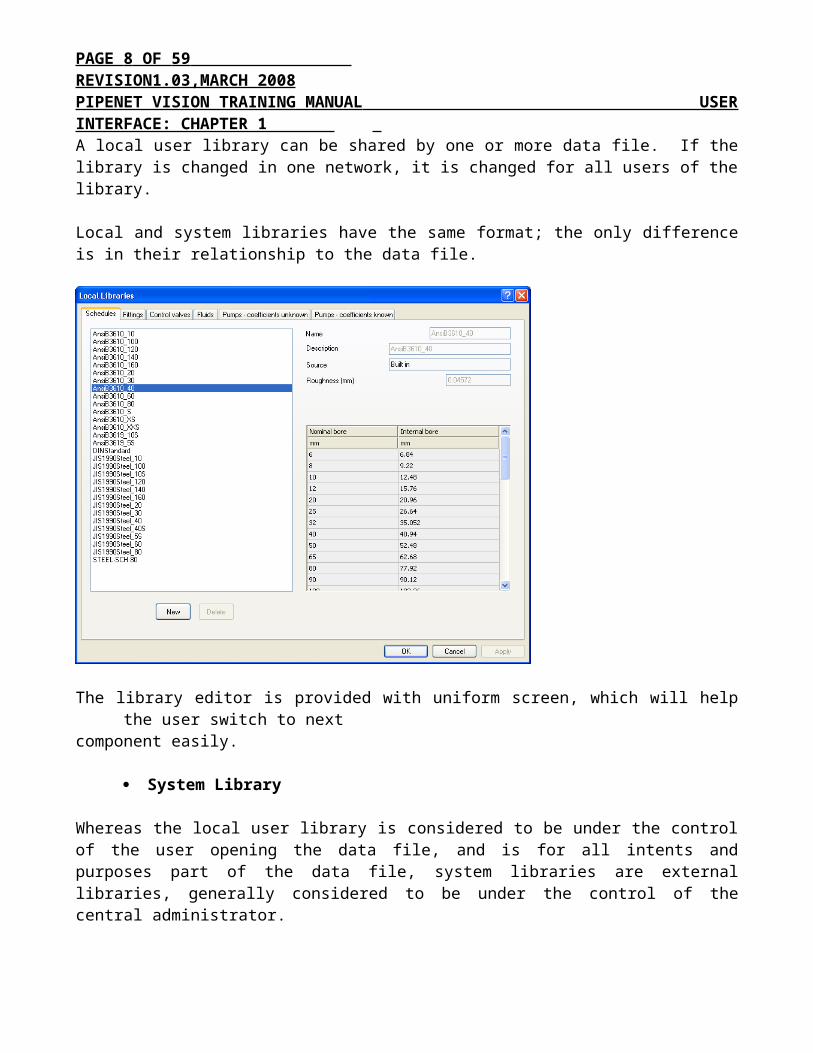
Local and system libraries have the same format; the only difference is in their relationship to the data file.
The library editor is provided with uniform screen, which will help the user switch to nextcomponent easily.
System Library
Whereas the local user library is considered to be under the control of the user opening the data file, and is for all intents and purposes part of the data file, system libraries are external libraries, generally considered to be under the control of the central administrator.
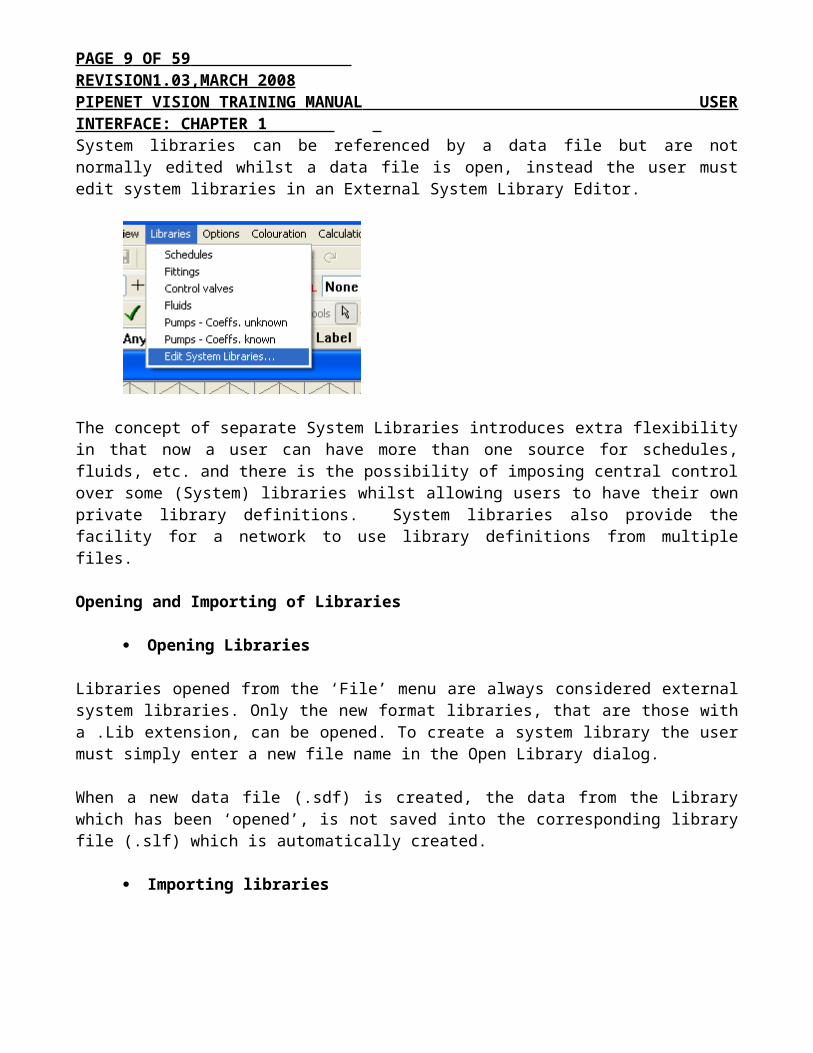
System libraries can be referenced by a data file but are not normally edited whilst a data file is open, instead the user must edit system libraries in an External System Library Editor.
PAGE 8 OF 47 REVISION1.03,MARCH 2008 PIPENET VISION TRAINING MANUAL USER INTERFACE: CHAPTER 1
The concept of separate System Libraries introduces extra flexibility in that now a user can have more than one source for schedules, fluids, etc. and there is the possibility of imposing central control over some (System) libraries whilst allowing users to have their own private library definitions. System libraries also provide the facility for a network to use library definitions from multiple files.
Opening and Importing of Libraries
Opening Libraries
Libraries opened from the ‘File’ menu are always considered external system libraries. Only the new format libraries, that are those with a .Lib extension, can be opened. To create a system library the user must simply enter a new file name in the Open Library dialog.
When a new data file (.sdf) is created, the data from the Library which has been ‘opened’, is not saved into the corresponding library file (.slf) which is automatically created.
Importing libraries
Imported libraries are merged into the single local user library. So, the data from the Library which has been ‘imported’ is saved into the corresponding library file (.slf) which is automatically created.
Libraries - example 1 - new data and library file
In this example we assume that a new data file is being created and no library files exist 1. Create a new project 2. Define the library items using the Library Editor dialog. 3. Create the network.
Libraries - example 2 - new data file using old style library files
In this example we assume that a new data file is being created but it is required to import library files created under a version of PIPENET, prior to the launch of PIPENET Vision.
PAGE 9 OF 47 REVISION1.03,MARCH 2008 PIPENET VISION TRAINING MANUAL USER INTERFACE: CHAPTER 1
1. Create a new project 2. Go to the File menu and select the option Import library 3. Use the file dialog to select the library to open, that is a .PDF, .PMP, etc. file 4. Open the file - the file is imported into the local user library 5. Repeat steps 2 and 3 for each old style library to be imported 6. Create the network.
Libraries - example 3 - old data file using old style library files
Opening an old style .Dat file automatically imports any old style library files referenced by the .Dat file.
Data Stored in Libraries
Pipe Schedule Library
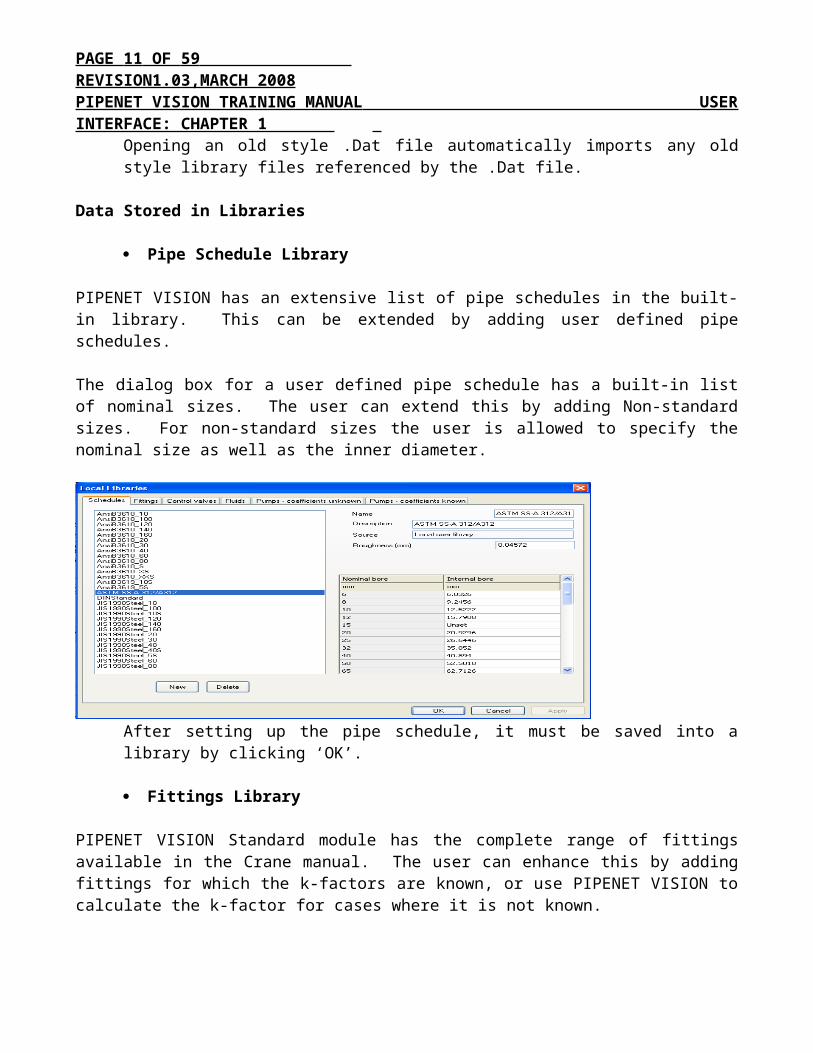
PIPENET VISION has an extensive list of pipe schedules in the built-in library. This can be extended by adding user defined pipe schedules.
The dialog box for a user defined pipe schedule has a built-in list of nominal sizes. The user can extend this by adding Non-standard sizes. For non-standard sizes the user is allowed to specify the nominal size as well as the inner diameter.
After setting up the pipe schedule, it must be saved into a library by clicking ‘OK’.
Fittings Library
PIPENET VISION Standard module has the complete range of fittings available in the Crane manual. The user can enhance this by adding fittings for which the k-factors are known, or use PIPENET VISION to calculate the k-factor for cases where it is not known.
PAGE 10 OF 47 REVISION1.03,MARCH 2008 PIPENET VISION TRAINING MANUAL USER INTERFACE: CHAPTER 1
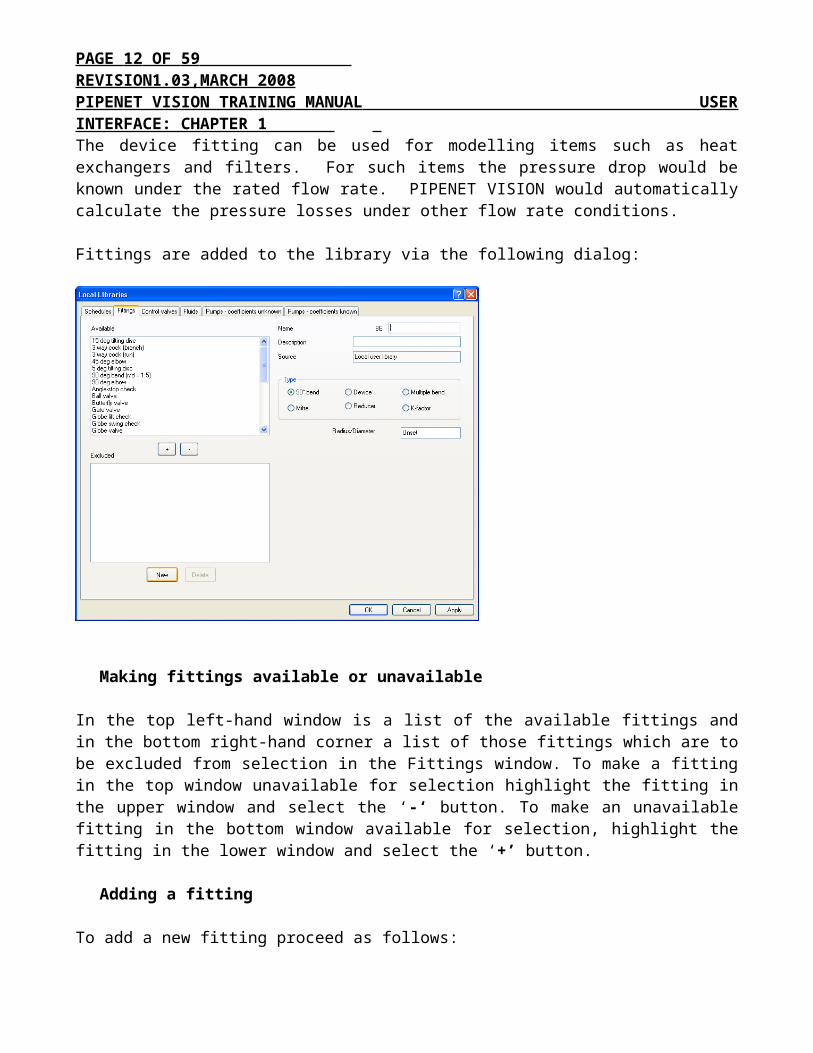
The device fitting can be used for modelling items such as heat exchangers and filters. For such items the pressure drop would be known under the rated flow rate. PIPENET VISION would automatically calculate the pressure losses under other flow rate conditions.
Fittings are added to the library via the following dialog:
Making fittings available or unavailable
In the top left-hand window is a list of the available fittings and in the bottom right-hand corner a list of those fittings which are to be excluded from selection in the Fittings window. To make a fitting in the top window unavailable for selection highlight the fitting in the upper window and select the ‘-‘ button. To make an unavailable fitting in the bottom window available for selection, highlight the fitting in the lower window and select the ‘+’ button.
Adding a fitting
To add a new fitting proceed as follows:
1. Select the New button 2. Enter the name of the fitting 3. Enter an optional long description for the fitting 4. Select the type of fitting from those listed 5. Supply the Parameters (dependent on fitting type) in the one, two or three edit
PAGE 11 OF 47 REVISION1.03,MARCH 2008 PIPENET VISION TRAINING MANUAL USER INTERFACE: CHAPTER 1
boxes provided. Note the number of edit boxes provided and the label for each box will change according to the fitting type selected 6. Select the Apply button to apply add the fitting.
Deleting a fitting from the Library
Highlight the desired fitting in the top left-hand window and select the Delete button; button is disabled for built-in fittings.
After setting up the user defined fittings, they must be saved into a library by using OK button.
Fluids Library
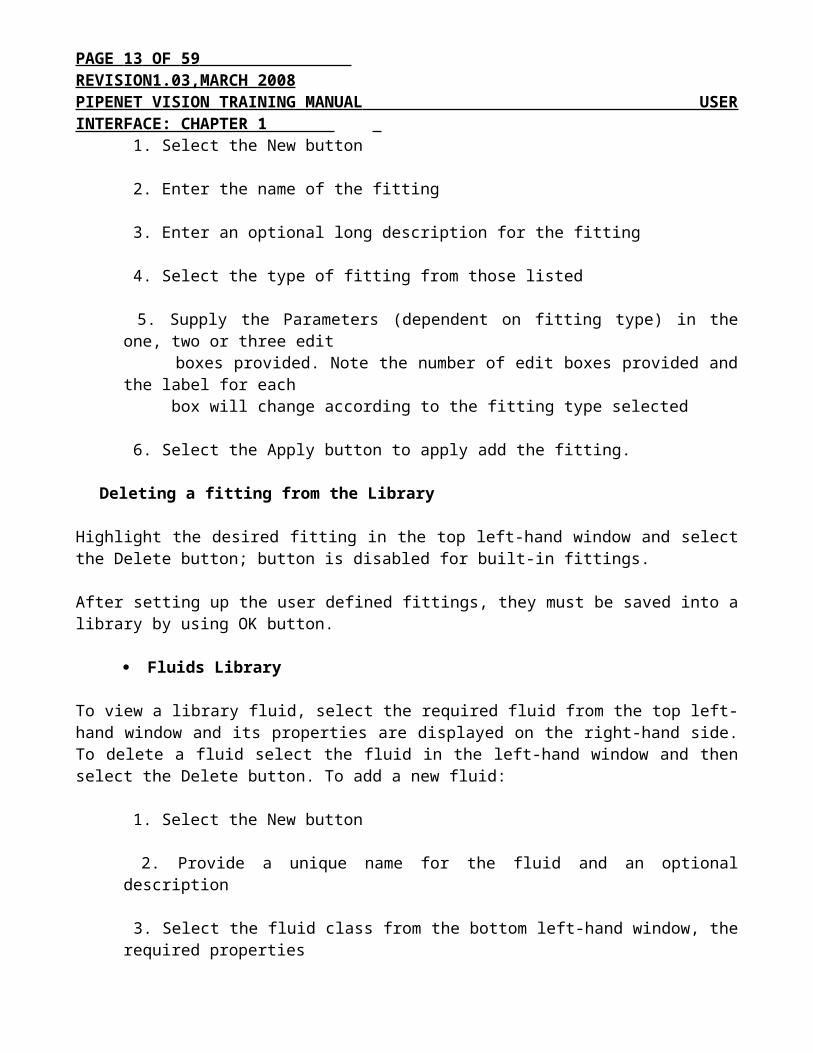
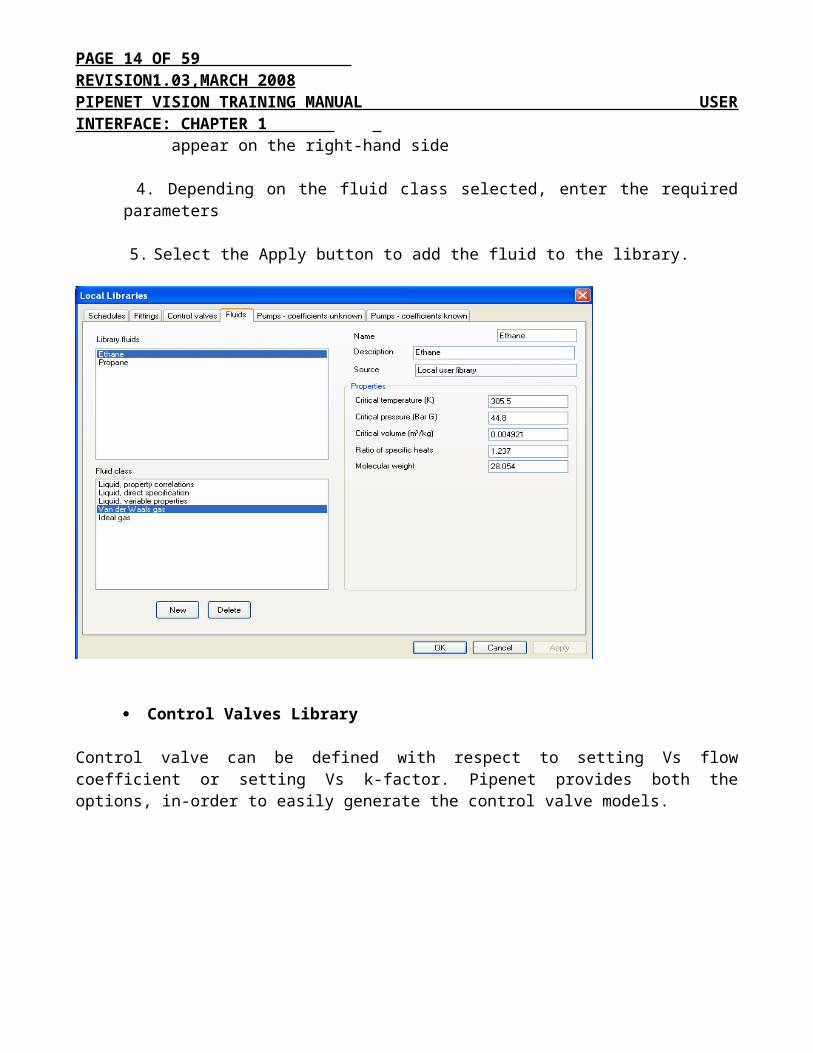
To view a library fluid, select the required fluid from the top left-hand window and its properties are displayed on the right-hand side. To delete a fluid select the fluid in the left-hand window and then select the Delete button. To add a new fluid:
1. Select the New button 2. Provide a unique name for the fluid and an optional description 3. Select the fluid class from the bottom left-hand window, the required properties appear on the right-hand side 4. Depending on the fluid class selected, enter the required parameters 5. Select the Apply button to add the fluid to the library.
PAGE 12 OF 47 REVISION1.03,MARCH 2008 PIPENET VISION TRAINING MANUAL USER INTERFACE: CHAPTER 1
Control Valves Library
Control valve can be defined with respect to setting Vs flow coefficient or setting Vs k-factor. Pipenet provides both the options, in-order to easily generate the control valve models.
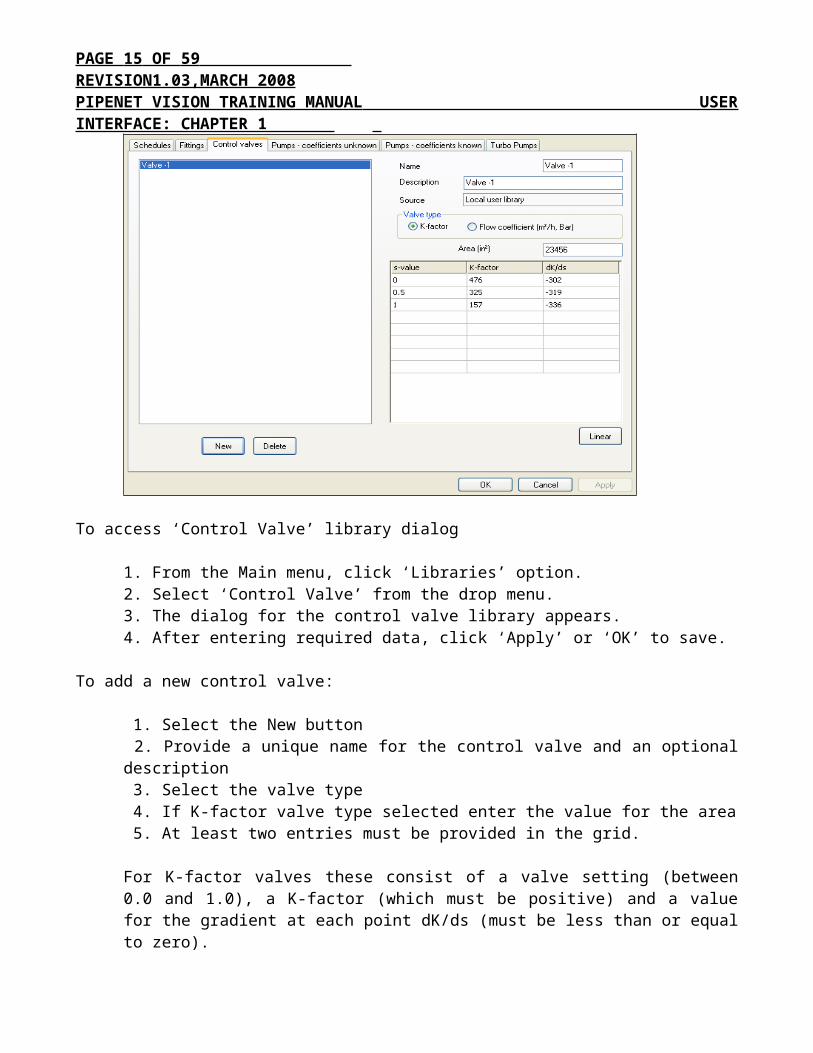
To access ‘Control Valve’ library dialog
PAGE 13 OF 47 REVISION1.03,MARCH 2008 PIPENET VISION TRAINING MANUAL USER INTERFACE: CHAPTER 1
1. From the Main menu, click ‘Libraries’ option.2. Select ‘Control Valve’ from the drop menu.3. The dialog for the control valve library appears.4. After entering required data, click ‘Apply’ or ‘OK’ to save.
To add a new control valve:
1. Select the New button 2. Provide a unique name for the control valve and an optional description 3. Select the valve type 4. If K-factor valve type selected enter the value for the area 5. At least two entries must be provided in the grid.
For K-factor valves these consist of a valve setting (between 0.0 and 1.0), a K-factor (which must be positive) and a value for the gradient at each point dK/ds (must be less than or equal to zero). For Flow coefficient valves these consist of a valve setting (between 0.0 and 1.0), a Flow coefficient (which must be positive) and a value for the gradient at each point dCv/ds (must be positive).
6. Select the Apply button to add the control valve to the library.
To view the created library control valve, select the required control valve from the left-hand window and its properties are displayed on the right-hand side.
To delete a control valve select the control valve in the left-hand window and then select the Delete button.
The control valves can also be generated directly in the schematic.
Pumps Library
Pumps - Coefficients Unknown
In PIPENET VISION Standard module, data for pumps and fans can be created into a library. PIPENET VISION also does a curve fit and uses the coefficients in the calculations. The input data must be in the form of data pairs taken from the performance curves.
Typically, the pump curves are not supplied in the same units as the units in which pressure drop calculations are going to be made. For example, it is usual to specify the pump curve in head of fluid, rather than psi. For this reason, the pump/fan module accepts data in its own units.
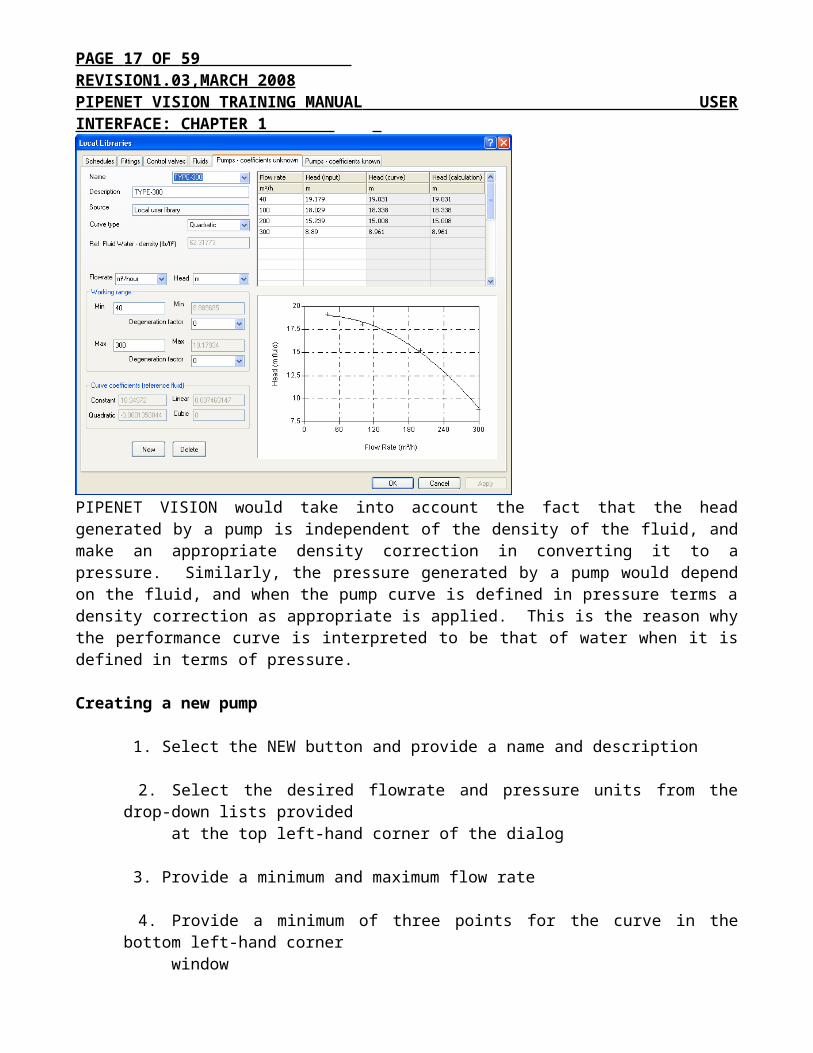
The dialog box for inputting a pump curve is shown below:
PAGE 14 OF 47 REVISION1.03,MARCH 2008 PIPENET VISION TRAINING MANUAL USER INTERFACE: CHAPTER 1
PIPENET VISION would take into account the fact that the head generated by a pump is independent of the density of the fluid, and make an appropriate density correction in converting it to a pressure. Similarly, the pressure generated by a pump would depend on the fluid, and when the pump curve is defined in pressure terms a density correction as appropriate is applied. This is the reason why the performance curve is interpreted to be that of water when it is defined in terms of pressure.
Creating a new pump
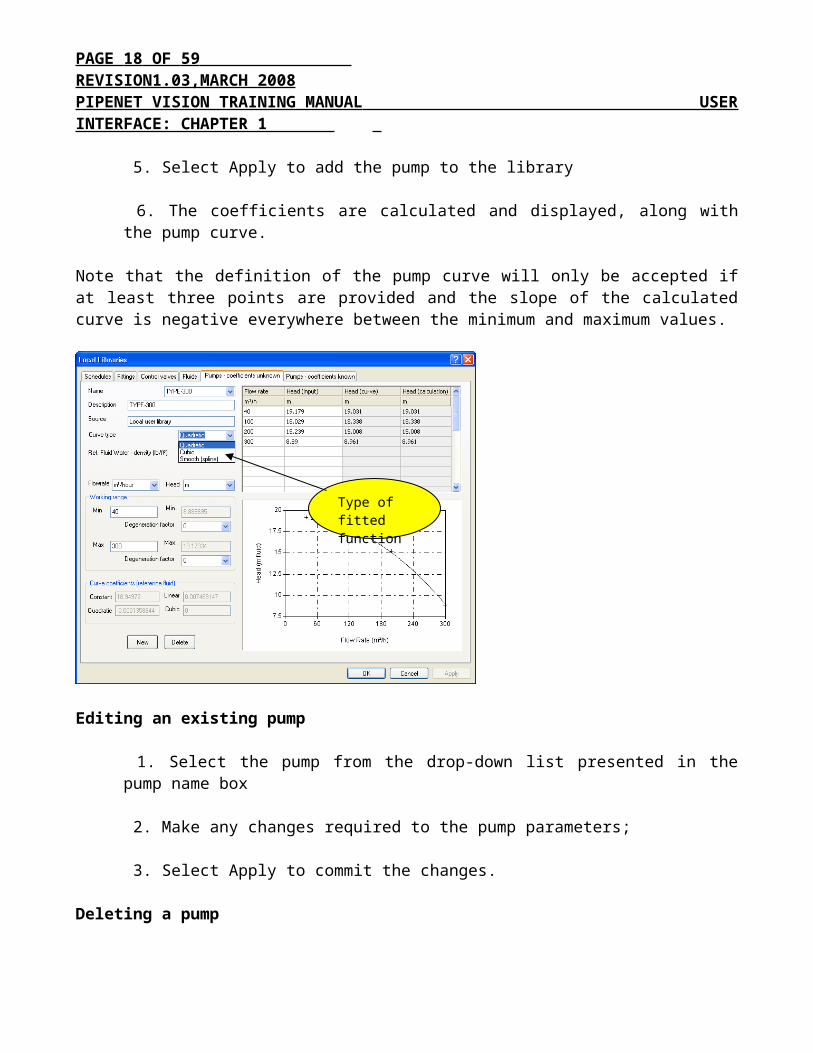
1. Select the NEW button and provide a name and description 2. Select the desired flowrate and pressure units from the drop-down lists provided at the top left-hand corner of the dialog 3. Provide a minimum and maximum flow rate 4. Provide a minimum of three points for the curve in the bottom left-hand corner window 5. Select Apply to add the pump to the library 6. The coefficients are calculated and displayed, along with the pump curve.
Note that the definition of the pump curve will only be accepted if at least three points are provided and the slope of the calculated curve is negative everywhere between the minimum and maximum values.
PAGE 15 OF 47 REVISION1.03,MARCH 2008 PIPENET VISION TRAINING MANUAL USER INTERFACE: CHAPTER 1
Editing an existing pump
1. Select the pump from the drop-down list presented in the pump name box 2. Make any changes required to the pump parameters; 3. Select Apply to commit the changes.
Deleting a pump
1. Select the pump from the drop-down list presented in the pump name box; 2. Select the Delete button.
Pumps Coeffs. Known
This capability is hardly ever used.
In case, the pump coefficients defining the performance curve are provided by the manufacturer, then using ‘Pump Co-efficient Known’ dialog box, the Coordinates are provided and corresponding performance curve is produced by PIPENET Vision.
In order to introduce the concepts of the user interface, we take a simple network and analyse how the input can be made. We will also use PIPENET VISION Standard module for this purpose.
6. Options
Title
Type of fitted function
PAGE 16 OF 47 REVISION1.03,MARCH 2008 PIPENET VISION TRAINING MANUAL USER INTERFACE: CHAPTER 1
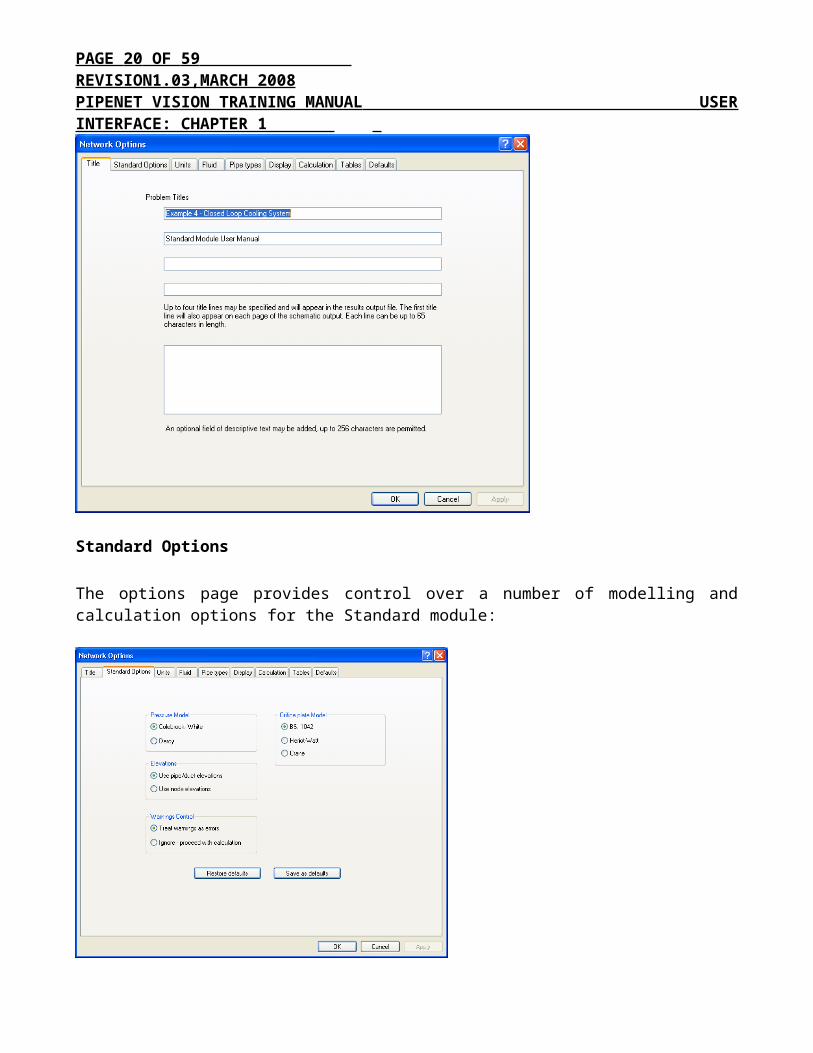
Use this dialog to enter a title for the Pipenet problem. A title may consist of up to four lines of text, each line no more than 65 characters in length. The first line of the title will be displayed on each page of a printed schematic.
Standard Options
The options page provides control over a number of modelling and calculation options for the Standard module:
PAGE 17 OF 47 REVISION1.03,MARCH 2008 PIPENET VISION TRAINING MANUAL USER INTERFACE: CHAPTER 1
Naturally the options for the Spray/Sprinkler and Transient modules are different. They would be described under the relevant chapters.
Pressure Model
There are two options for the Pressure Model; the user can use either Colebrook – White equation or Coulson and Richardson equation. This will have small change in calculating the pressure drop in a system.
Elevations
Specify means by which node heights are derived:
Use pipe/duct elevations Each pipe or duct is assigned a change in elevation (rise) from its input to its output. A reference node is selected and assigned a reference height. and the height of each node calculated with reference to the reference node. This option can result in height inconsistencies if a network contains one or more loops. In a loop the sum of the elevation changes must sum to zero, however, if a rise has been incorrectly entered the sum will not be zero and a height check error will be reported. Height check errors can be difficult to locate in large loops.
Use node elevations The elevation of each node is directly entered as an attribute of the node - height check errors cannot occur with this method.
Warnings Control
PAGE 18 OF 47 REVISION1.03,MARCH 2008 PIPENET VISION TRAINING MANUAL USER INTERFACE: CHAPTER 1 There are two types of diagnostic in PIPENET.
Error – this type of diagnostic indicates to the user that a calculation cannot be performed.
Warning – this type of diagnostic is for the user’s information and a calculation might still be possible.
Generally, .calculation can be allowed to proceed even if there is a warning.
Orifice plate model
Select one of the available options. Generally for restriction orifice plates the recommended option is ‘Crane’
BS1042 If the BS1042 model is used, the restrictions of that standard are applied so plates may only be used in pipes with diameters in the range 2–14 inches (50.8–355.6mm). Furthermore the ratio of the orifice diameter to the pipe diameter must be in the range 0.1 – 0.748 for larger pipes.
This standard is intended mainly for modelling flow metering orifice plates. So it is very accurate in cases where the pressure loss is low. However, it is not suitable for restriction orifice plates.
Heriot-Watt If the "Heriot-Watt Orange Book" orifice plate model is used the ratio of the orifice diameter to the pipe diameter should be less than 0.8 (see also Modelling - Orifice plates). This is proprietary Sunrise Systems data.
Crane Orifice plates are modelled according to the Crane Technical Paper 410. This is suitable for restriction orifice plates.
7. Units
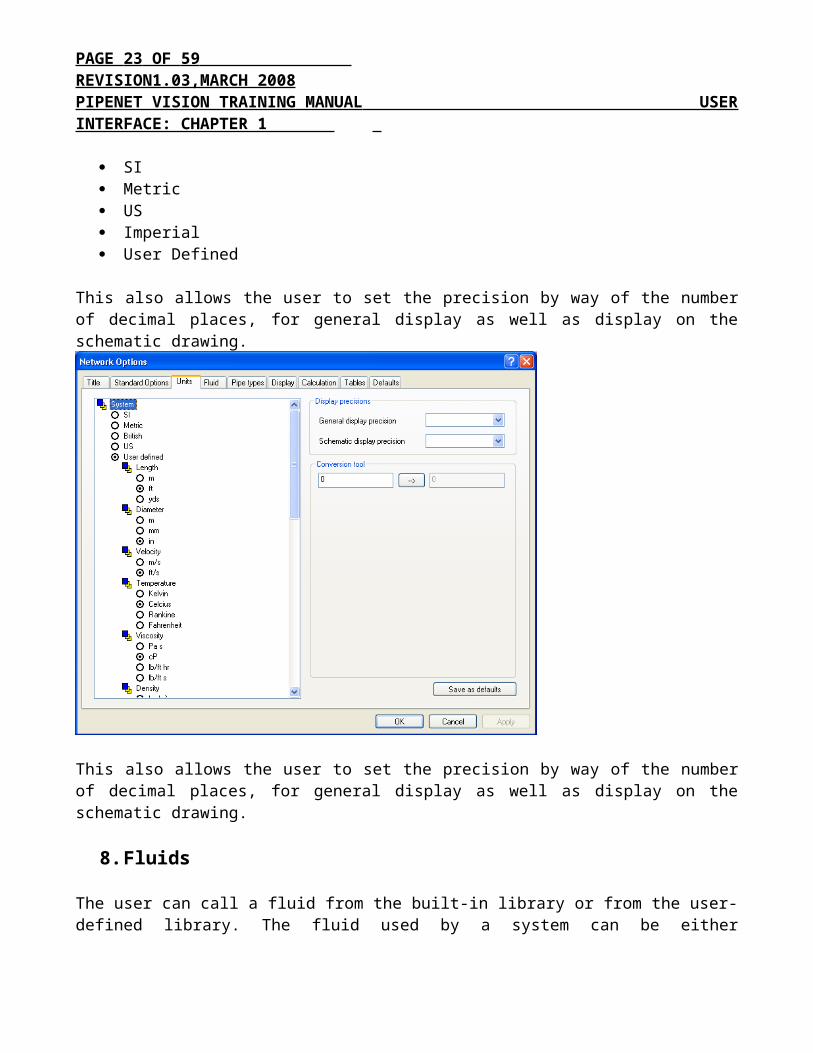
A wide selection of unit systems is provided, including:
SI Metric US Imperial User Defined
This also allows the user to set the precision by way of the number of decimal places, for general display as well as display on the schematic drawing.
PAGE 19 OF 47 REVISION1.03,MARCH 2008 PIPENET VISION TRAINING MANUAL USER INTERFACE: CHAPTER 1
This also allows the user to set the precision by way of the number of decimal places, for general display as well as display on the schematic drawing.
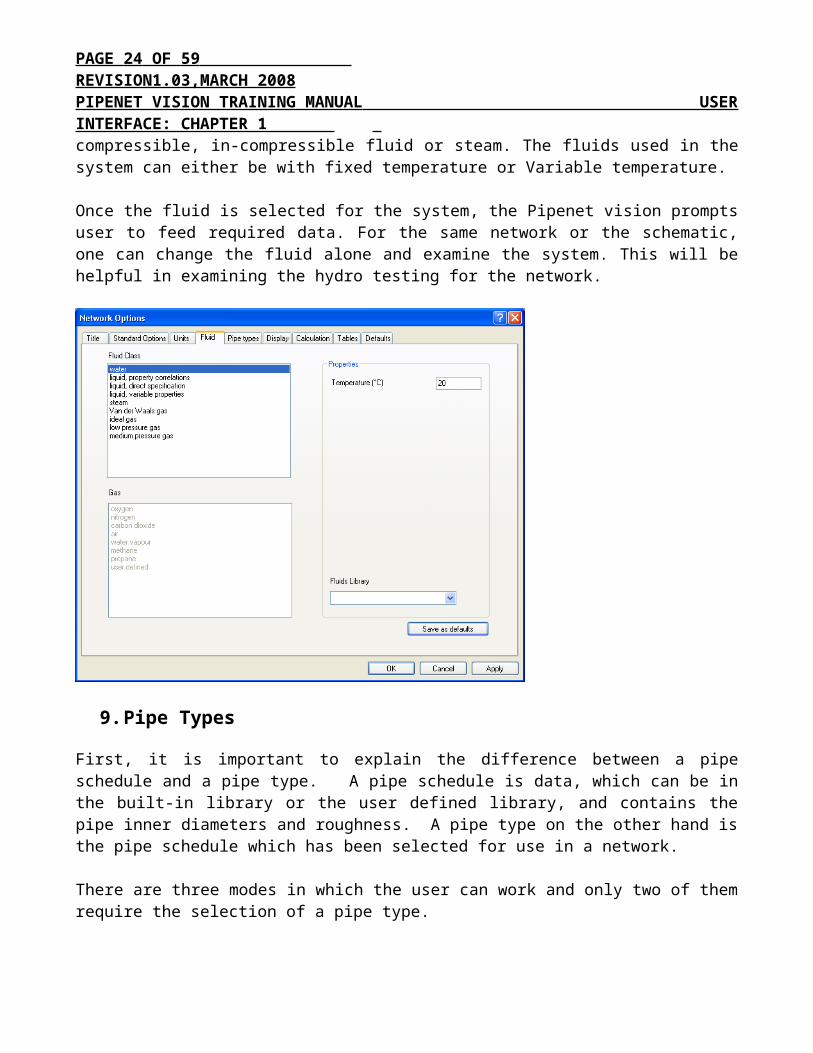
8. Fluids
The user can call a fluid from the built-in library or from the user-defined library. The fluid used by a system can be either compressible, in-compressible fluid or steam. The fluids used in the system can either be with fixed temperature or Variable temperature.
Once the fluid is selected for the system, the Pipenet vision prompts user to feed required data. For the same network or the schematic, one can change the fluid alone and examine the system. This will be helpful in examining the hydro testing for the network.
PAGE 20 OF 47 REVISION1.03,MARCH 2008 PIPENET VISION TRAINING MANUAL USER INTERFACE: CHAPTER 1
9. Pipe Types
First, it is important to explain the difference between a pipe schedule and a pipe type. A pipe schedule is data, which can be in the built-in library or the user defined library, and contains the pipe inner diameters and roughness. A pipe type on the other hand is the pipe schedule which has been selected for use in a network.
There are three modes in which the user can work and only two of them require the selection of a pipe type.
In the simplest mode the user can input the pipe internal diameters directly in the pipes attributes properties window. It is important that the user does not specify a pipe type in this mode because PIPENET would take that as a signal the nominal sizes are to be used.
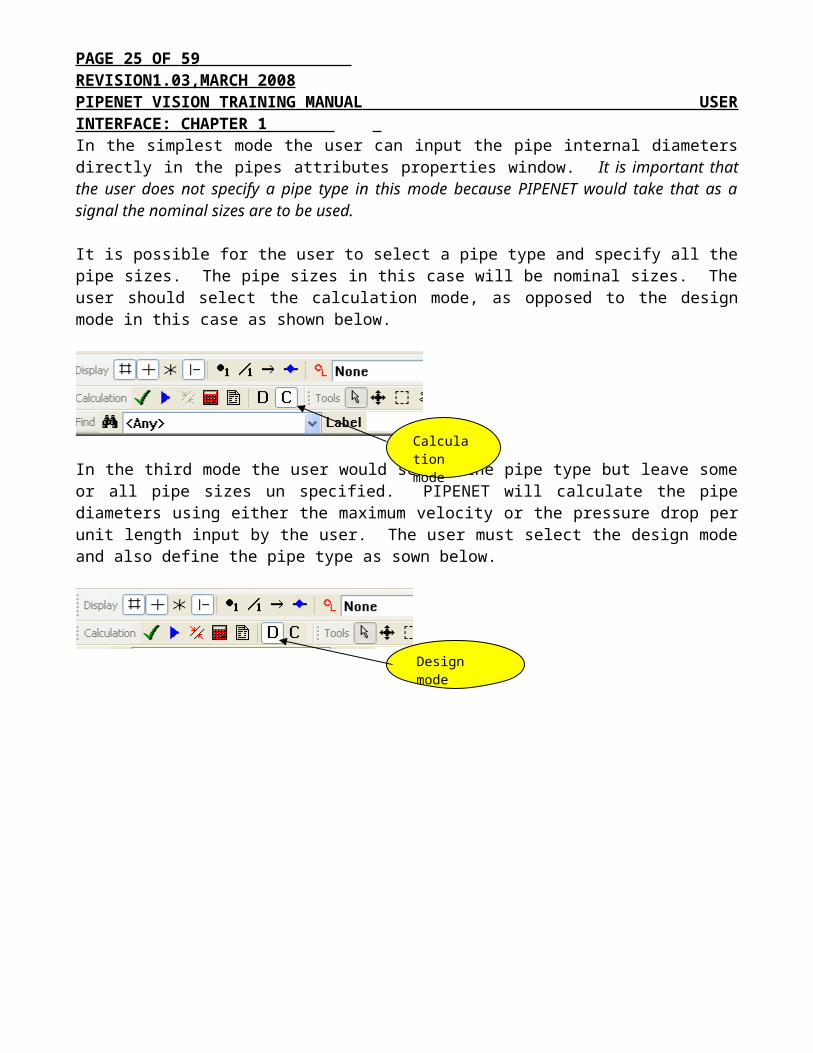
It is possible for the user to select a pipe type and specify all the pipe sizes. The pipe sizes in this case will be nominal sizes. The user should select the calculation mode, as opposed to the design mode in this case as shown below.
In the third mode the user would select the pipe type but leave some or all pipe sizes un specified. PIPENET will calculate the pipe diameters using either the maximum velocity or
Calculation mode
PAGE 21 OF 47 REVISION1.03,MARCH 2008 PIPENET VISION TRAINING MANUAL USER INTERFACE: CHAPTER 1 the pressure drop per unit length input by the user. The user must select the design mode and also define the pipe type as sown below.
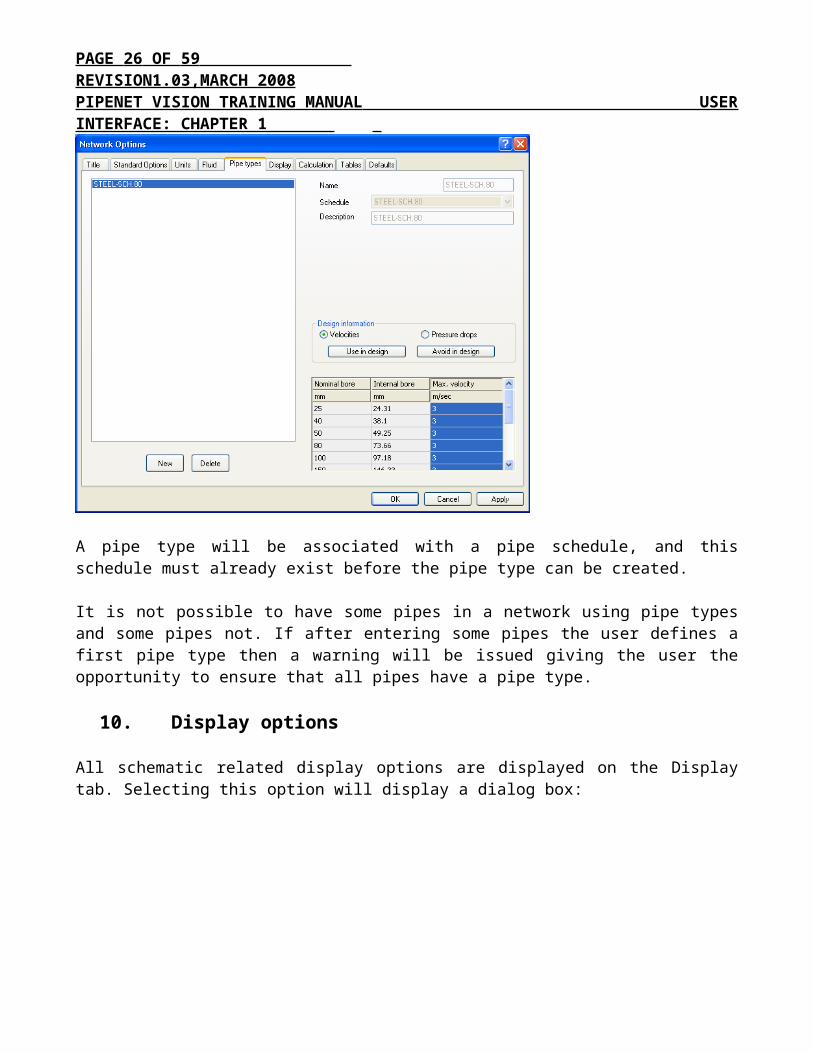
A pipe type will be associated with a pipe schedule, and this schedule must already exist before the pipe type can be created.
It is not possible to have some pipes in a network using pipe types and some pipes not. If after entering some pipes the user defines a first pipe type then a warning will be issued giving the user the opportunity to ensure that all pipes have a pipe type.
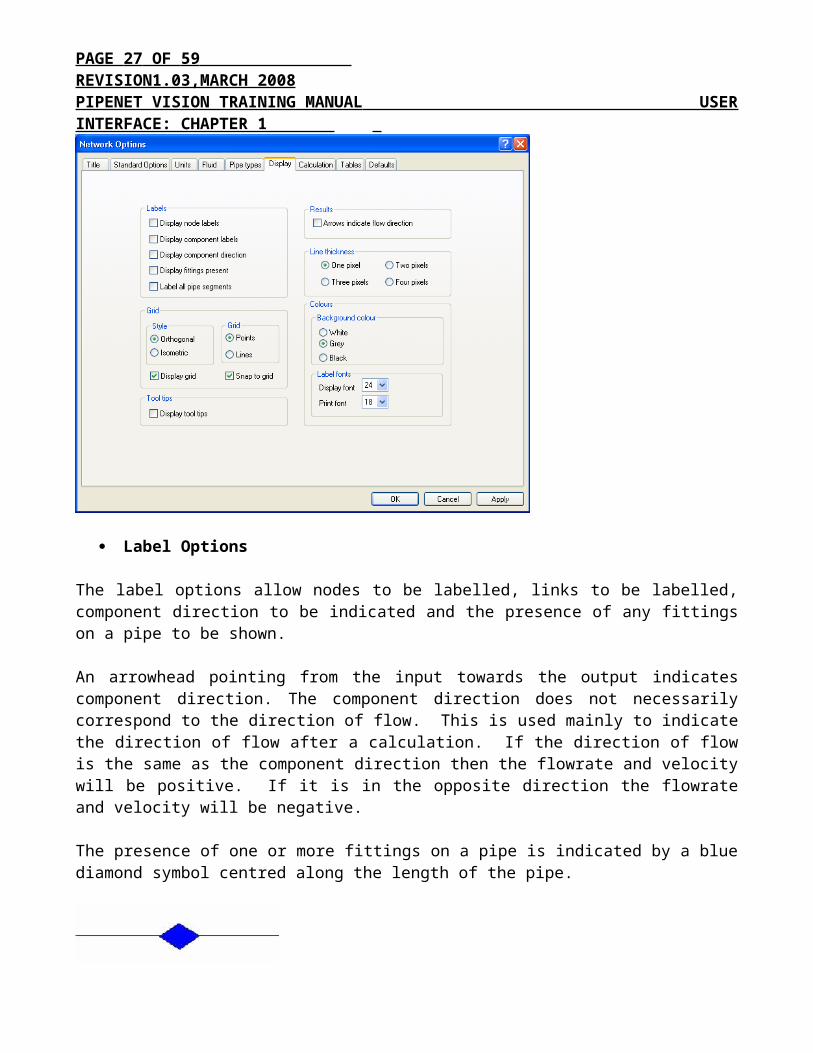
10. Display options
All schematic related display options are displayed on the Display tab. Selecting this option will display a dialog box:
Design mode
PAGE 22 OF 47 REVISION1.03,MARCH 2008 PIPENET VISION TRAINING MANUAL USER INTERFACE: CHAPTER 1
Label Options
The label options allow nodes to be labelled, links to be labelled, component direction to be indicated and the presence of any fittings on a pipe to be shown.
An arrowhead pointing from the input towards the output indicates component direction. The component direction does not necessarily correspond to the direction of flow. This is used mainly to indicate the direction of flow after a calculation. If the direction of flow is the same as the component direction then the flowrate and velocity will be positive. If it is in the opposite direction the flowrate and velocity will be negative. The presence of one or more fittings on a pipe is indicated by a blue diamond symbol centred along the length of the pipe.
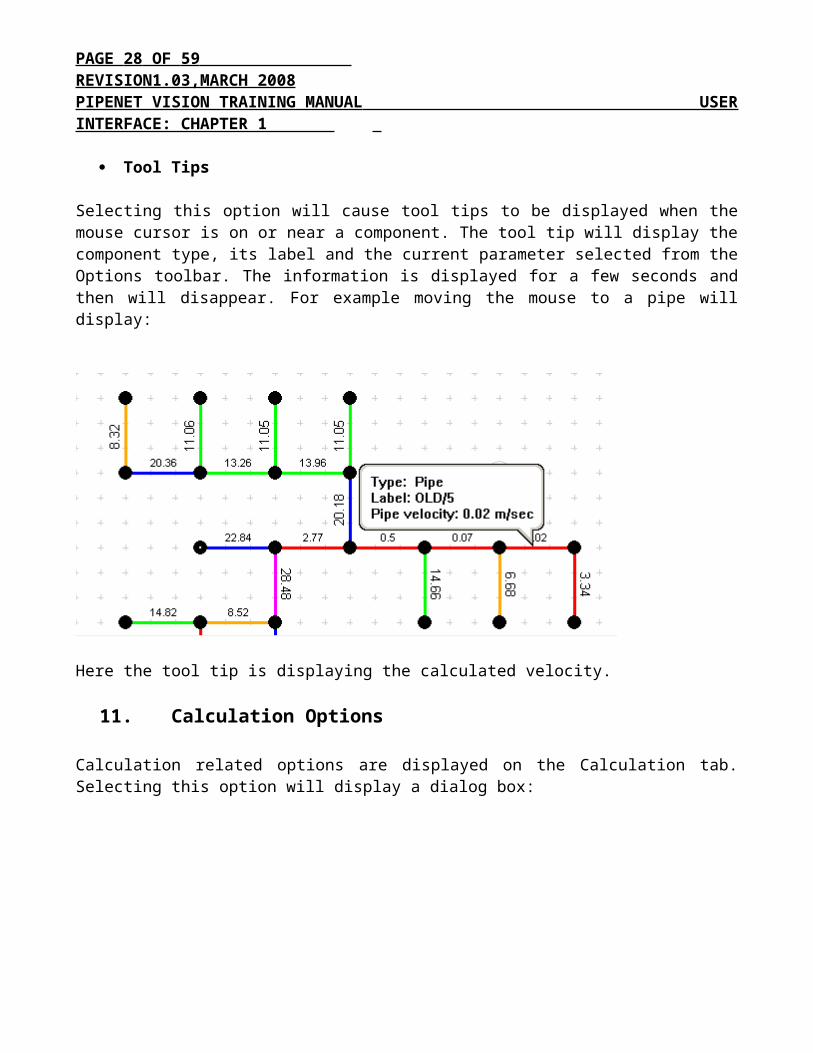
Tool Tips
Selecting this option will cause tool tips to be displayed when the mouse cursor is on or near a component. The tool tip will display the component type, its label and the current parameter selected from the Options toolbar. The information is displayed for a few seconds and then will disappear. For example moving the mouse to a pipe will display:
PAGE 23 OF 47 REVISION1.03,MARCH 2008 PIPENET VISION TRAINING MANUAL USER INTERFACE: CHAPTER 1
Here the tool tip is displaying the calculated velocity.
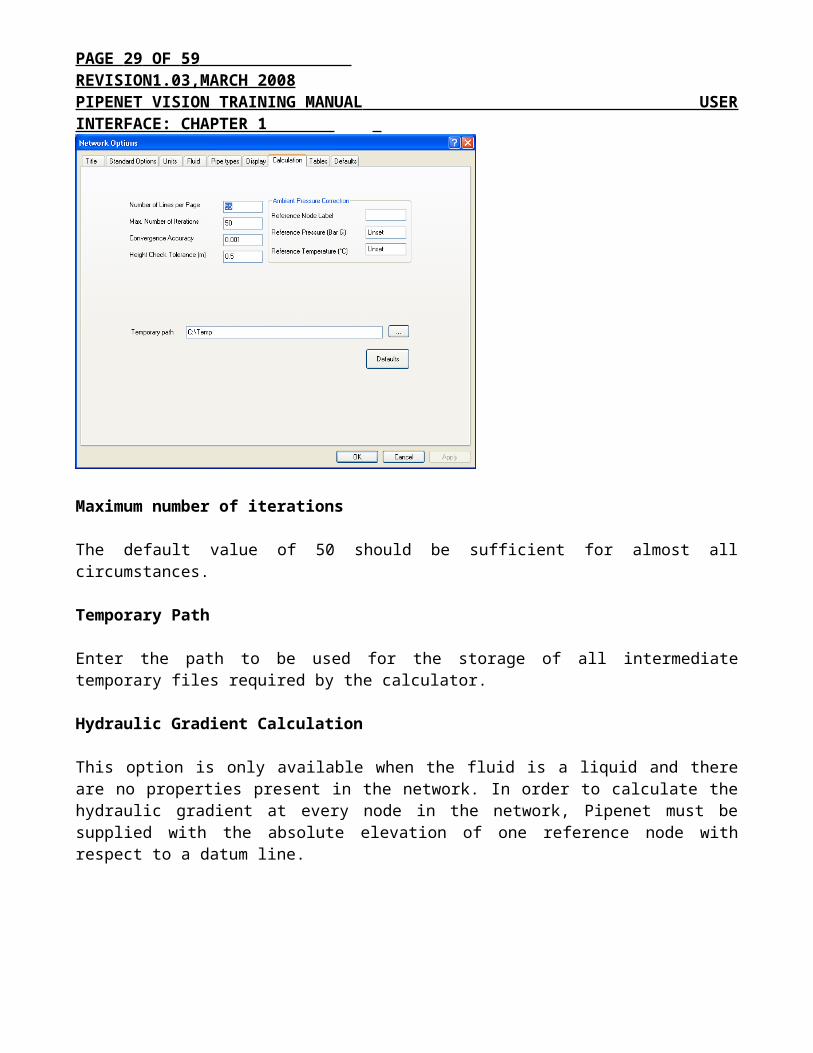
11. Calculation Options
Calculation related options are displayed on the Calculation tab. Selecting this option will display a dialog box:
Maximum number of iterations
The default value of 50 should be sufficient for almost all circumstances.
Temporary Path
PAGE 24 OF 47 REVISION1.03,MARCH 2008 PIPENET VISION TRAINING MANUAL USER INTERFACE: CHAPTER 1 Enter the path to be used for the storage of all intermediate temporary files required by the calculator.
Hydraulic Gradient Calculation
This option is only available when the fluid is a liquid and there are no properties present in the network. In order to calculate the hydraulic gradient at every node in the network, Pipenet must be supplied with the absolute elevation of one reference node with respect to a datum line.
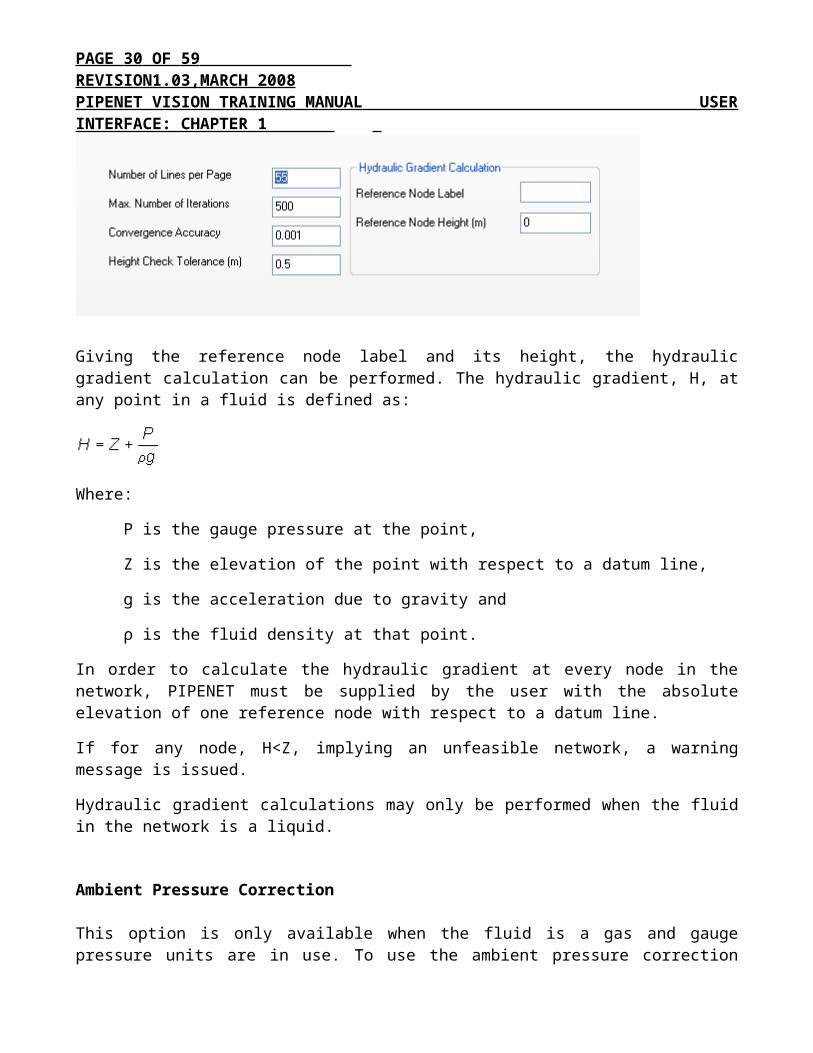
Giving the reference node label and its height, the hydraulic gradient calculation can be performed. The hydraulic gradient, H, at any point in a fluid is defined as:
Where:
P is the gauge pressure at the point,
Z is the elevation of the point with respect to a datum line,
g is the acceleration due to gravity and
ρ is the fluid density at that point.
In order to calculate the hydraulic gradient at every node in the network, PIPENET must be supplied by the user with the absolute elevation of one reference node with respect to a datum line.
If for any node, H<Z, implying an unfeasible network, a warning message is issued.
Hydraulic gradient calculations may only be performed when the fluid in the network is a liquid.
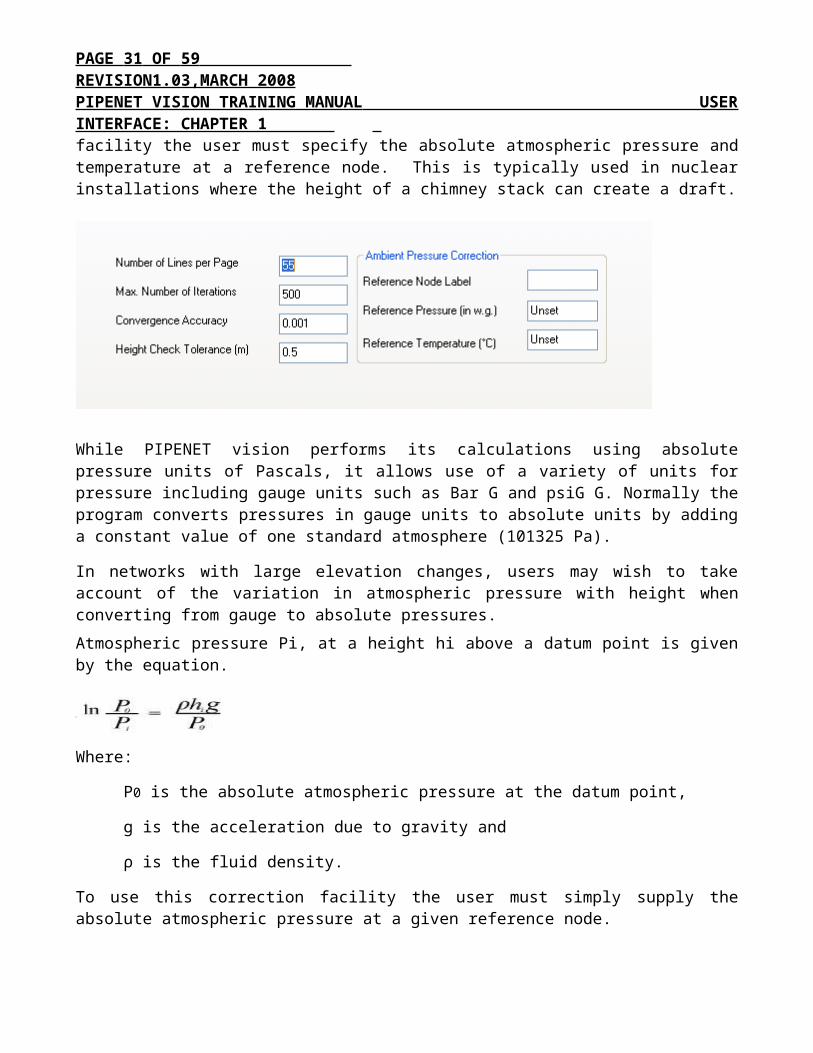
Ambient Pressure Correction
PAGE 25 OF 47 REVISION1.03,MARCH 2008 PIPENET VISION TRAINING MANUAL USER INTERFACE: CHAPTER 1 This option is only available when the fluid is a gas and gauge pressure units are in use. To use the ambient pressure correction facility the user must specify the absolute atmospheric pressure and temperature at a reference node. This is typically used in nuclear installations where the height of a chimney stack can create a draft.
While PIPENET vision performs its calculations using absolute pressure units of Pascals, it allows use of a variety of units for pressure including gauge units such as Bar G and psiG G. Normally the program converts pressures in gauge units to absolute units by adding a constant value of one standard atmosphere (101325 Pa).
In networks with large elevation changes, users may wish to take account of the variation in atmospheric pressure with height when converting from gauge to absolute pressures.
Atmospheric pressure Pi, at a height hi above a datum point is given by the equation.
Where:
P0 is the absolute atmospheric pressure at the datum point,
g is the acceleration due to gravity and
ρ is the fluid density.
To use this correction facility the user must simply supply the absolute atmospheric pressure at a given reference node.
Ambient pressure correction is permitted by PIPENET only when gauge pressure units are being used and the fluid in the network is a gas.
NOTES
1. The use of a default value for Pipe/Duct Roughness is particularly useful when most or all of the pipes/ducts in the network have the same roughness.
2. Some of the lines in this box may be greyed out when not relevant, and cannot be edited. For example it is not possible to set default values for Duct Height or Width when the fluid in the network is a liquid, as ducts cannot be used with liquids, and a
PAGE 26 OF 47 REVISION1.03,MARCH 2008 PIPENET VISION TRAINING MANUAL USER INTERFACE: CHAPTER 1
default elevation cannot be set if Node Elevation has been selected in the menu option Options ¦ Defaults or Init ¦ Defaults.
Colouration Menu:
This menu contains three items which can be used to setup the colouring of nodes and/or pipes and ducts based on the value of one or more attributes.
Simple rules
This option is used to define the colouring of links and or nodes based on the value of a single attribute or result, for example node elevation, pipe length, velocity of fluid through pipe, and so on.
Complex nodes
This option is used to define more complex colouring rules for nodes based on the values of more than one attribute or result.
Complex links
This option is used to define more complex colouring rules for pipes and ducts based on the values of more than one attribute or result.
Colour Schemes:
Simple Colour Schemes
With simple colour schemes, the user selects a component attribute or result, for example, pipe length, pressure difference, node elevation, and then creates a scheme by associating the selected attribute or result with a set of intervals. The intervals are defined by five values v1, v2, v3, v4, v5, the intervals being:
≤ v1 RED>v1 & ≤ v2 ORANGE>v2 & ≤ v3 GREEN>v3 & ≤ v4 CYAN>v4 & ≤ v5 BLUE>v5 MAGENTA
If intervals are not defined they will be provided automatically based on a suitable scaling of the known values for the attributes or results. Note for results the intervals are calculated on the completion of a calculation.
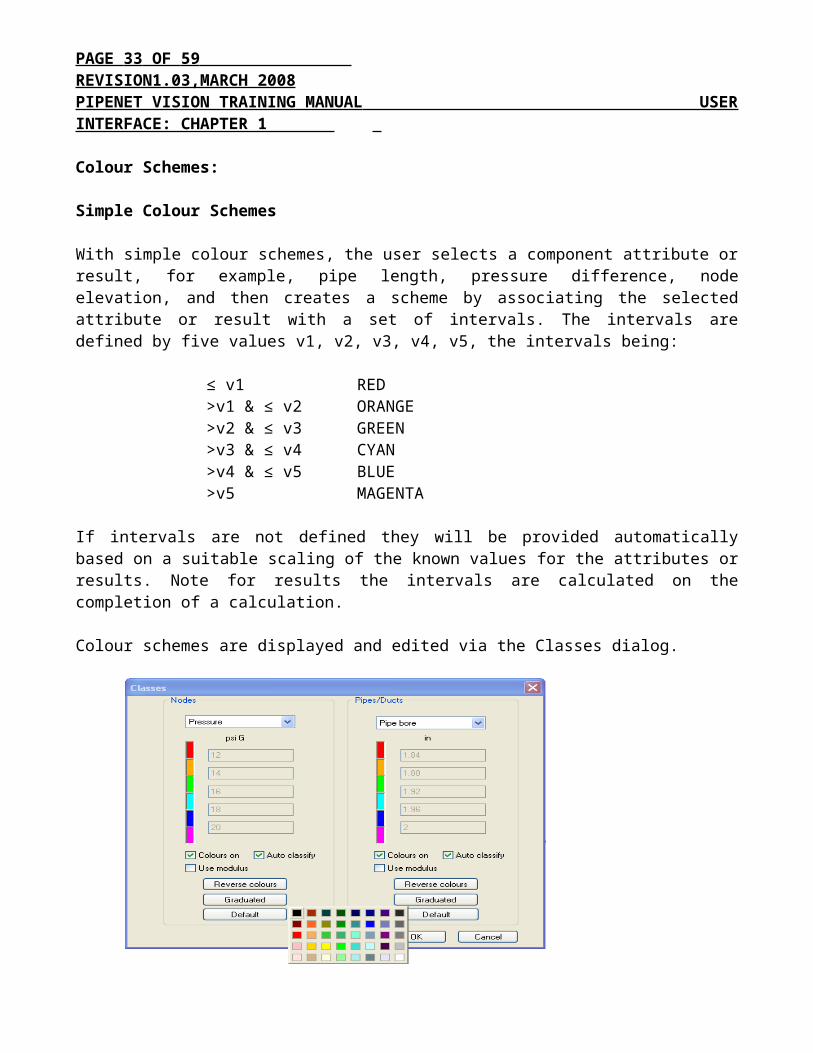
Colour schemes are displayed and edited via the Classes dialog.
PAGE 27 OF 47 REVISION1.03,MARCH 2008 PIPENET VISION TRAINING MANUAL USER INTERFACE: CHAPTER 1
This consists of two columns, one for nodes and the other for pipes/nozzles. At the head of each column is a combo box for selecting the colour scheme. Note these two combo boxes have a dual purpose in also selecting which attribute is displayed above a component in the schematic.
Below the combo box are five edit boxes used for defining the six intervals. The coloured boxes alongside the edit boxes define the colours for the six intervals. The edit boxes will be greyed out if the selected colouring scheme does not use intervals.
Immediately below each column of five edit boxes are two check boxes:
Colours On - used to enable/display colours. If this box is unchecked then the default colouring scheme will be used. However, the selected attribute will still be displayed when the Display Attributes buttons are selected.
Auto classify - used to select automatic calculation of ranges following completion of a calculation. If this box is checked then the five values defining the six intervals will be re-calculated each time a calculation is performed.
Use modulus - if this is selected then classification will not take the sign of the attribute into consideration. For example typically the user would be interested in the magnitude of the velocity, rather than whether it is positive or negative.
The final three buttons are used to select the way in which the intervals are coloured, the default being the six colours ordered as RED, ORANGE, GREEN, CYAN, BLUE and MAGENTA. The ordering of the colours may be reversed by selecting the Reverse colours button. As an alternative to the six colours a single colour may be selected to be represented in six shades. Selecting the Graduated button displays a pop-up window via which the colour can be selected.
The two combo boxes for selecting the colour scheme (and hence the attribute to be
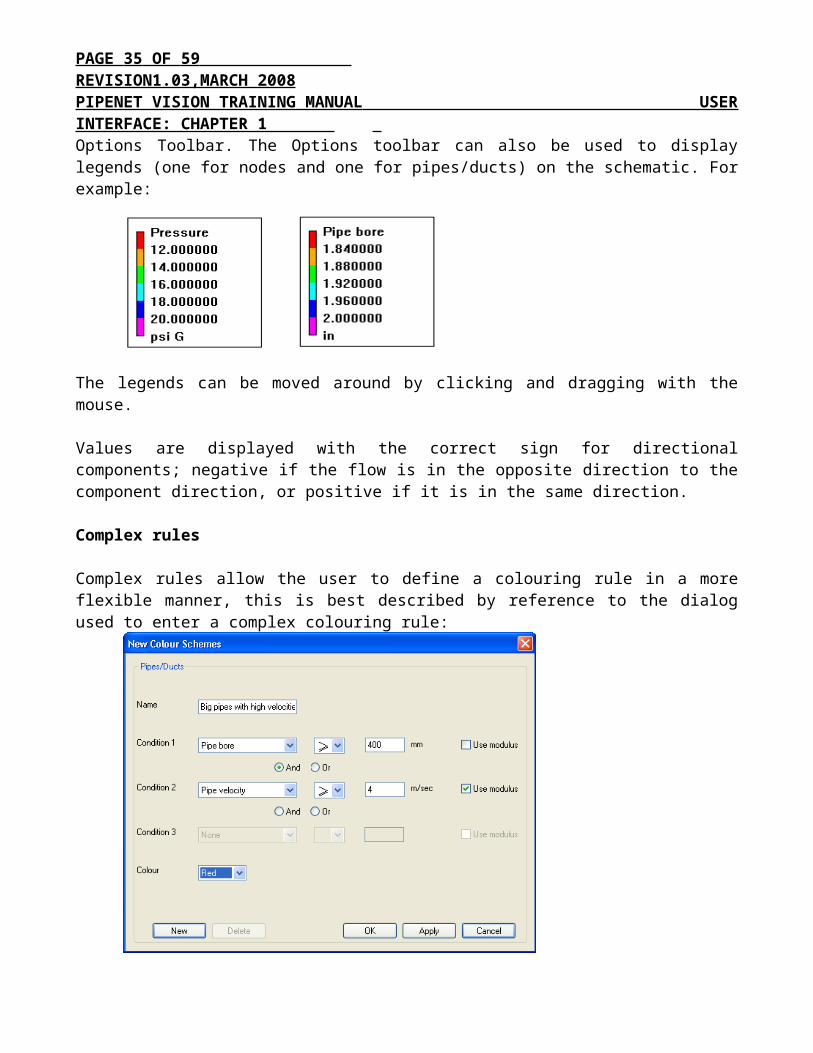
PAGE 28 OF 47 REVISION1.03,MARCH 2008 PIPENET VISION TRAINING MANUAL USER INTERFACE: CHAPTER 1 displayed on the schematic) are reproduced on the Options Toolbar. The Options toolbar can also be used to display legends (one for nodes and one for pipes/ducts) on the schematic. For example:
The legends can be moved around by clicking and dragging with the mouse.
Values are displayed with the correct sign for directional components; negative if the flow is in the opposite direction to the component direction, or positive if it is in the same direction.
Complex rules
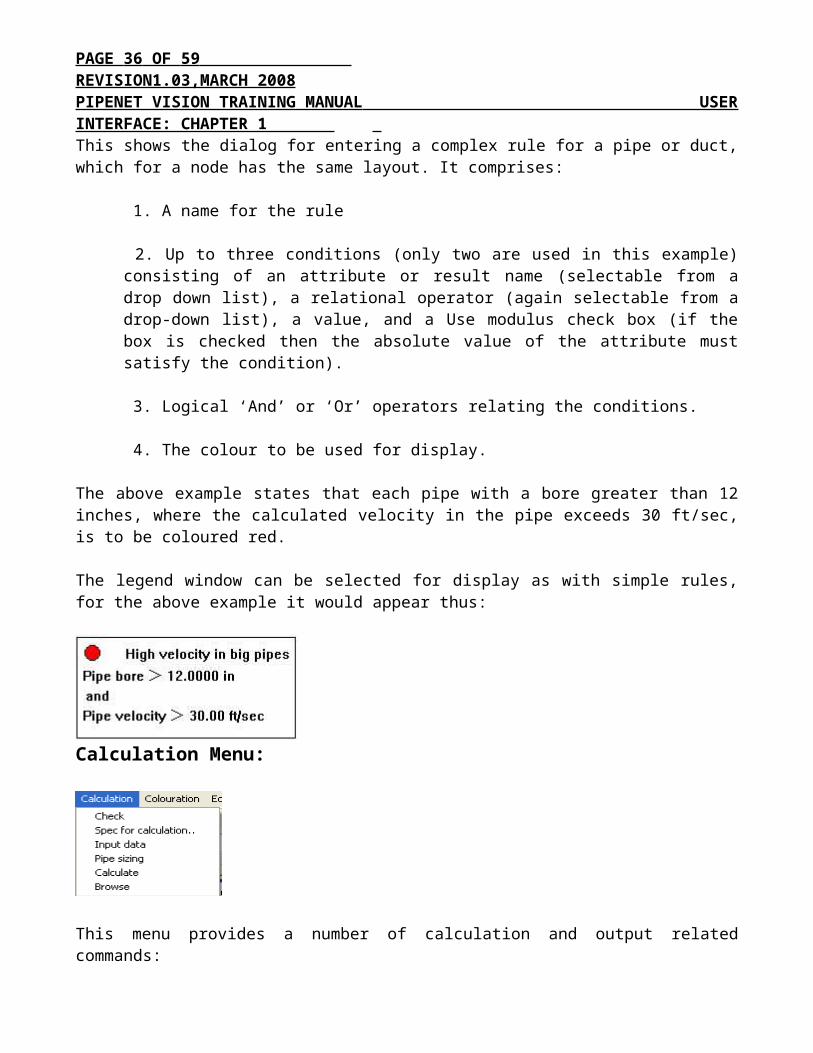
Complex rules allow the user to define a colouring rule in a more flexible manner, this is best described by reference to the dialog used to enter a complex colouring rule:
This shows the dialog for entering a complex rule for a pipe or duct, which for a node has the same layout. It comprises:
1. A name for the rule 2. Up to three conditions (only two are used in this example) consisting of an attribute or result name (selectable from a drop down list), a relational operator (again selectable from a drop-down list), a value, and a Use modulus check box (if the box is checked then the absolute value of the attribute must satisfy the condition).
PAGE 29 OF 47 REVISION1.03,MARCH 2008 PIPENET VISION TRAINING MANUAL USER INTERFACE: CHAPTER 1
3. Logical ‘And’ or ‘Or’ operators relating the conditions. 4. The colour to be used for display.
The above example states that each pipe with a bore greater than 12 inches, where the calculated velocity in the pipe exceeds 30 ft/sec, is to be coloured red.
The legend window can be selected for display as with simple rules, for the above example it would appear thus:
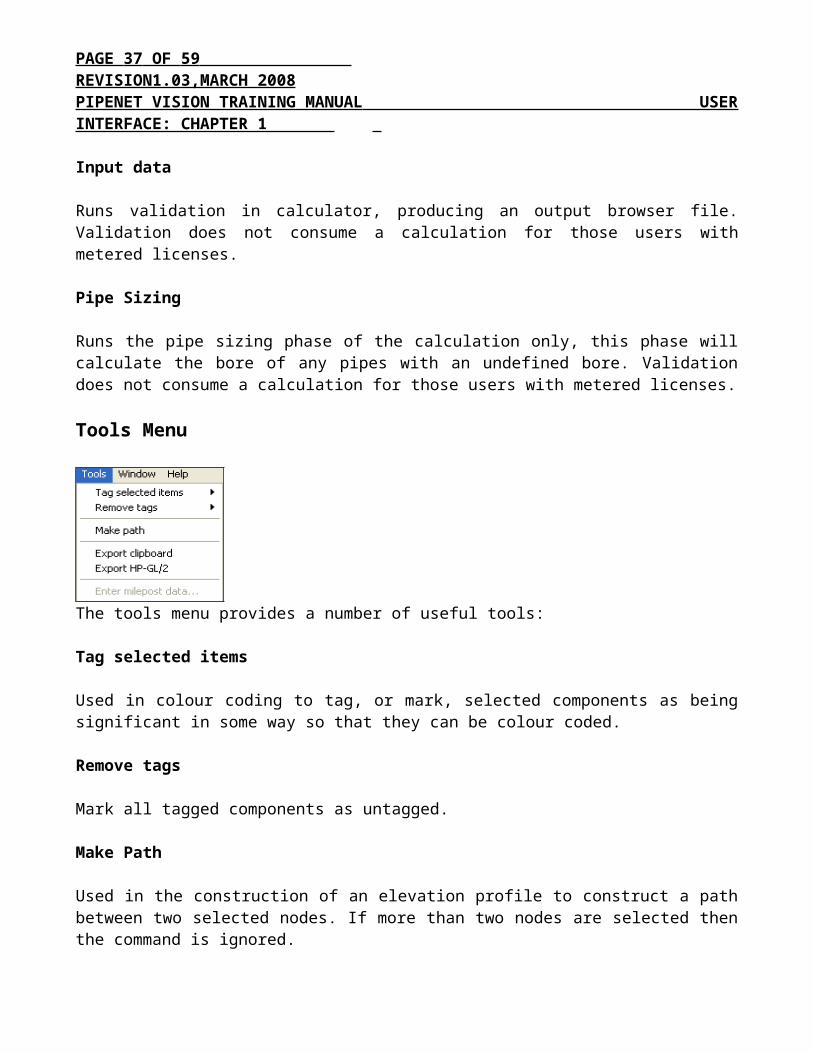
Calculation Menu:
This menu provides a number of calculation and output related commands:
Input data Runs validation in calculator, producing an output browser file. Validation does not consume a calculation for those users with metered licenses. Pipe Sizing Runs the pipe sizing phase of the calculation only, this phase will calculate the bore of any pipes with an undefined bore. Validation does not consume a calculation for those users with metered licenses. Tools Menu
PAGE 30 OF 47 REVISION1.03,MARCH 2008 PIPENET VISION TRAINING MANUAL USER INTERFACE: CHAPTER 1
The tools menu provides a number of useful tools:
Tag selected items Used in colour coding to tag, or mark, selected components as being significant in some way so that they can be colour coded. Remove tags Mark all tagged components as untagged. Make Path Used in the construction of an elevation profile to construct a path between two selected nodes. If more than two nodes are selected then the command is ignored.
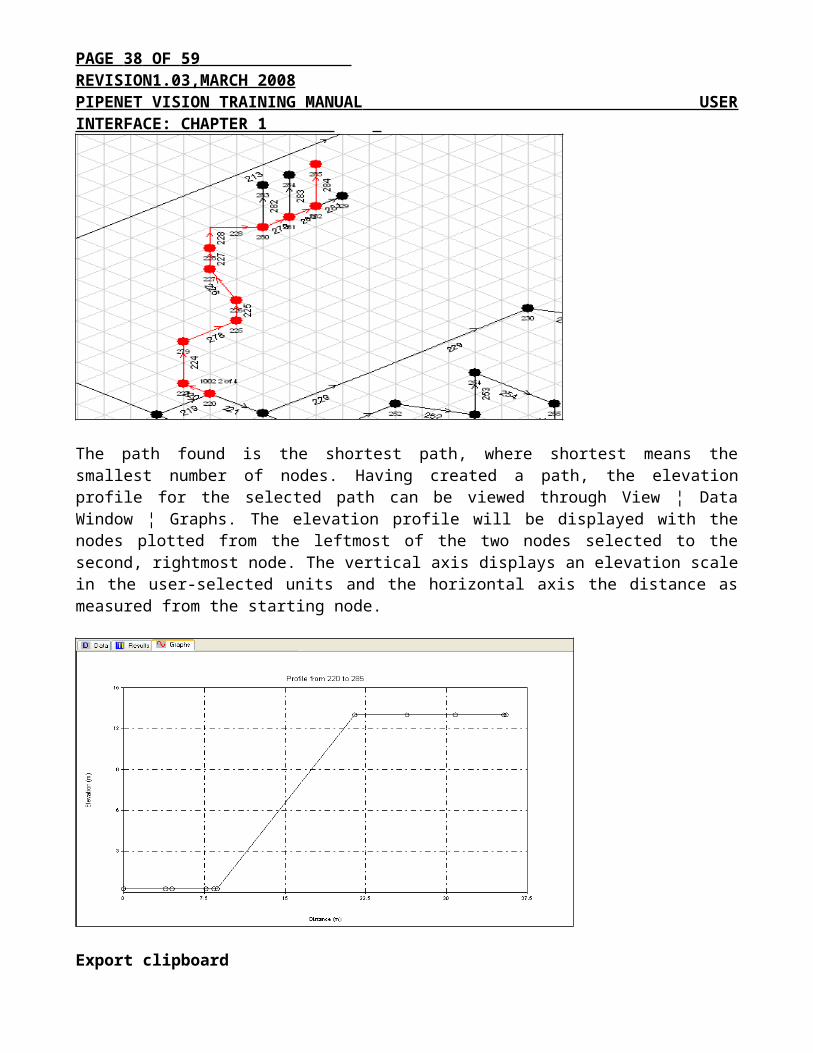
The path found is the shortest path, where shortest means the smallest number of nodes. Having created a path, the elevation profile for the selected path can be viewed through View ¦ Data Window ¦ Graphs. The elevation profile will be displayed with the nodes plotted from the leftmost of the two nodes selected to the second, rightmost node. The vertical axis displays an elevation scale in the user-selected units and the horizontal axis the distance as measured from the starting node.
PAGE 31 OF 47 REVISION1.03,MARCH 2008 PIPENET VISION TRAINING MANUAL USER INTERFACE: CHAPTER 1
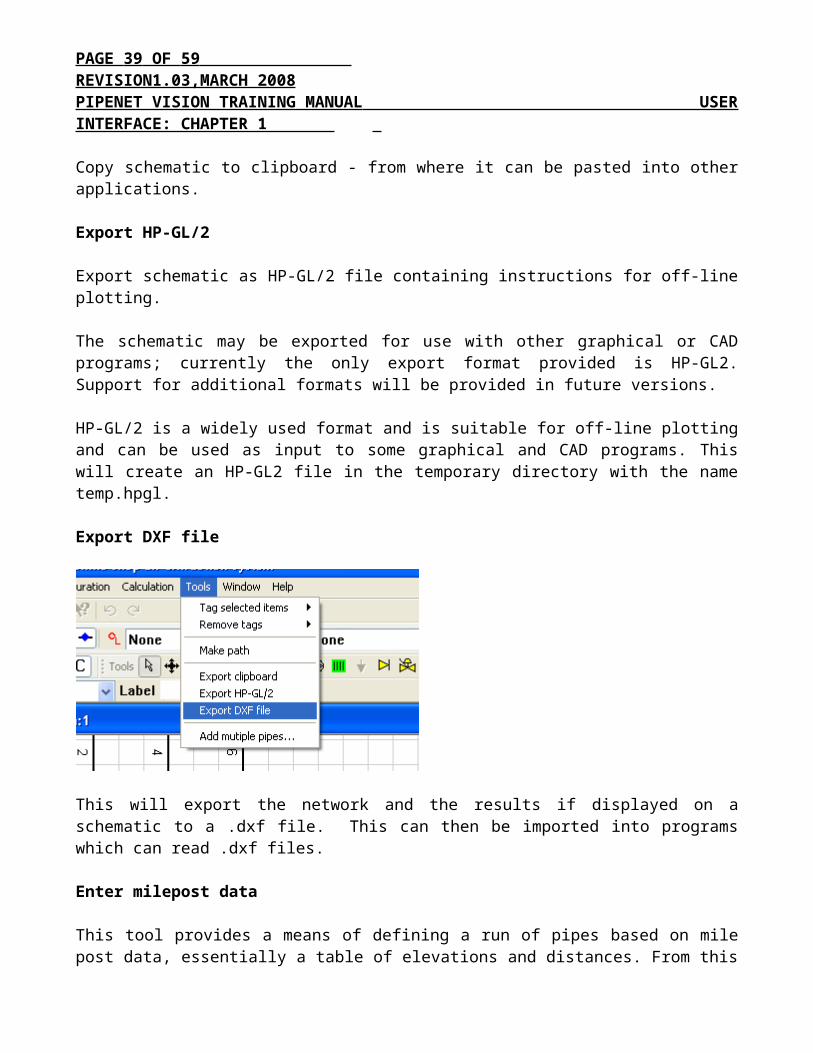
Export clipboard Copy schematic to clipboard - from where it can be pasted into other applications. Export HP-GL/2 Export schematic as HP-GL/2 file containing instructions for off-line plotting.
The schematic may be exported for use with other graphical or CAD programs; currently the only export format provided is HP-GL2. Support for additional formats will be provided in future versions.
HP-GL/2 is a widely used format and is suitable for off-line plotting and can be used as input to some graphical and CAD programs. This will create an HP-GL2 file in the temporary directory with the name temp.hpgl.
Export DXF file
PAGE 32 OF 47 REVISION1.03,MARCH 2008 PIPENET VISION TRAINING MANUAL USER INTERFACE: CHAPTER 1 This will export the network and the results if displayed on a schematic to a .dxf file. This can then be imported into programs which can read .dxf files.
Enter milepost data This tool provides a means of defining a run of pipes based on mile post data, essentially a table of elevations and distances. From this data, if supplied in a suitable form, the PIPENET module can automatically generate a sequence of pipes with the correct lengths and rises (elevation changes). The detailed description will be given later in this book.
Schematic Input Revisited
Creating Waypoints:
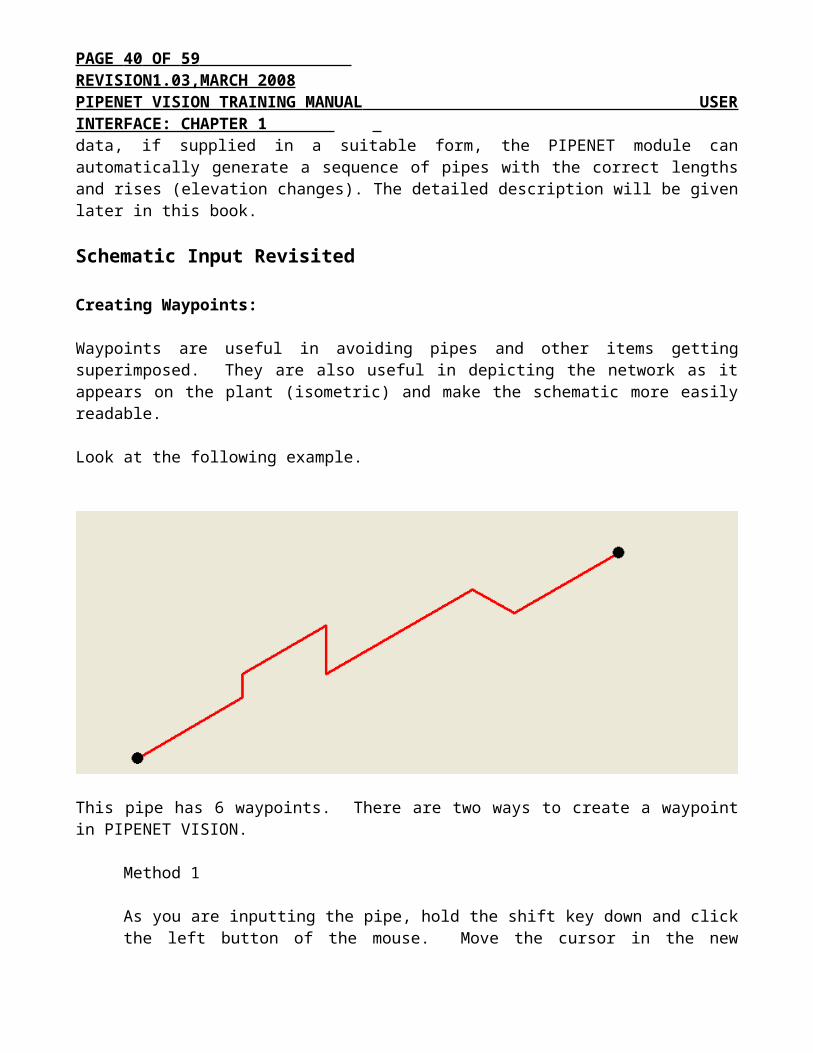
Waypoints are useful in avoiding pipes and other items getting superimposed. They are also useful in depicting the network as it appears on the plant (isometric) and make the schematic more easily readable.
Look at the following example.
This pipe has 6 waypoints. There are two ways to create a waypoint in PIPENET VISION.
Method 1
As you are inputting the pipe, hold the shift key down and click the left button of the mouse. Move the cursor in the new direction of the pipe. This will create a change in direction, or waypoint.
Method 2
PAGE 33 OF 47 REVISION1.03,MARCH 2008 PIPENET VISION TRAINING MANUAL USER INTERFACE: CHAPTER 1
The alternative would be to move the cursor to the point where you wish to create a waypoint, click and hold down the mouse button and move the cursor. This will create a change in direction of the pipe.
Deleting an item:
Point the cursor to the item you wish to delete, right click the mouse button and then click on Delete.
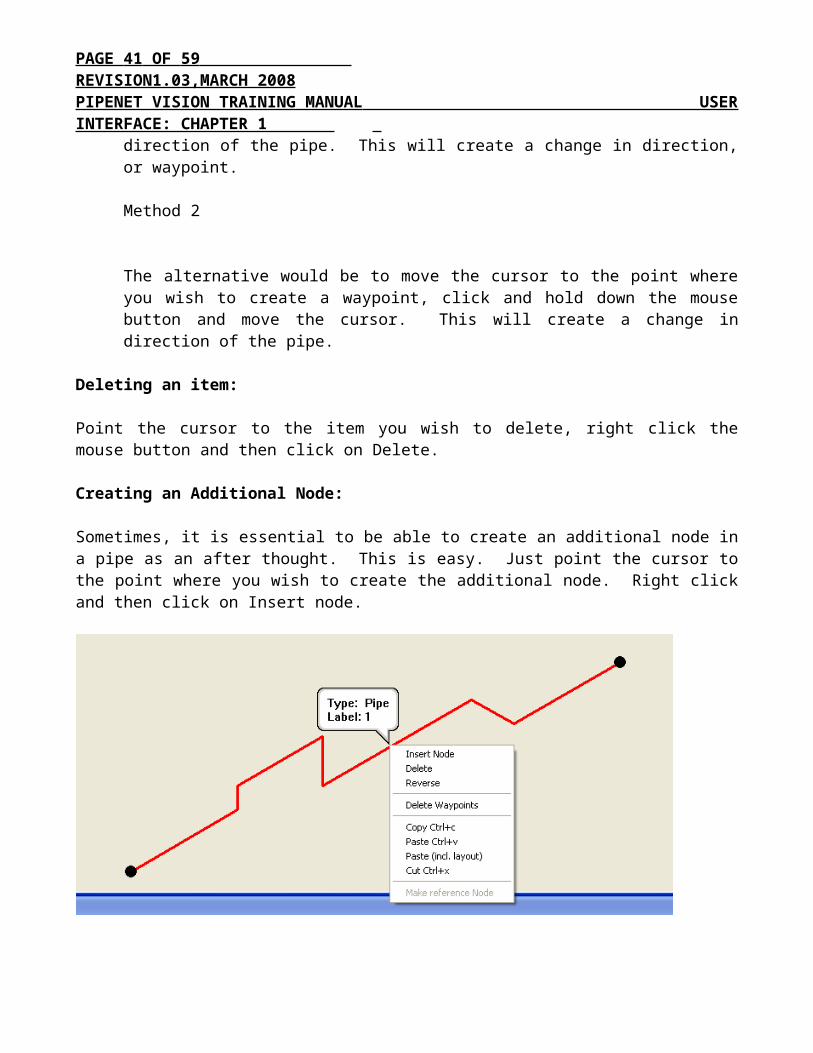
Creating an Additional Node:
Sometimes, it is essential to be able to create an additional node in a pipe as an after thought. This is easy. Just point the cursor to the point where you wish to create the additional node. Right click and then click on Insert node.
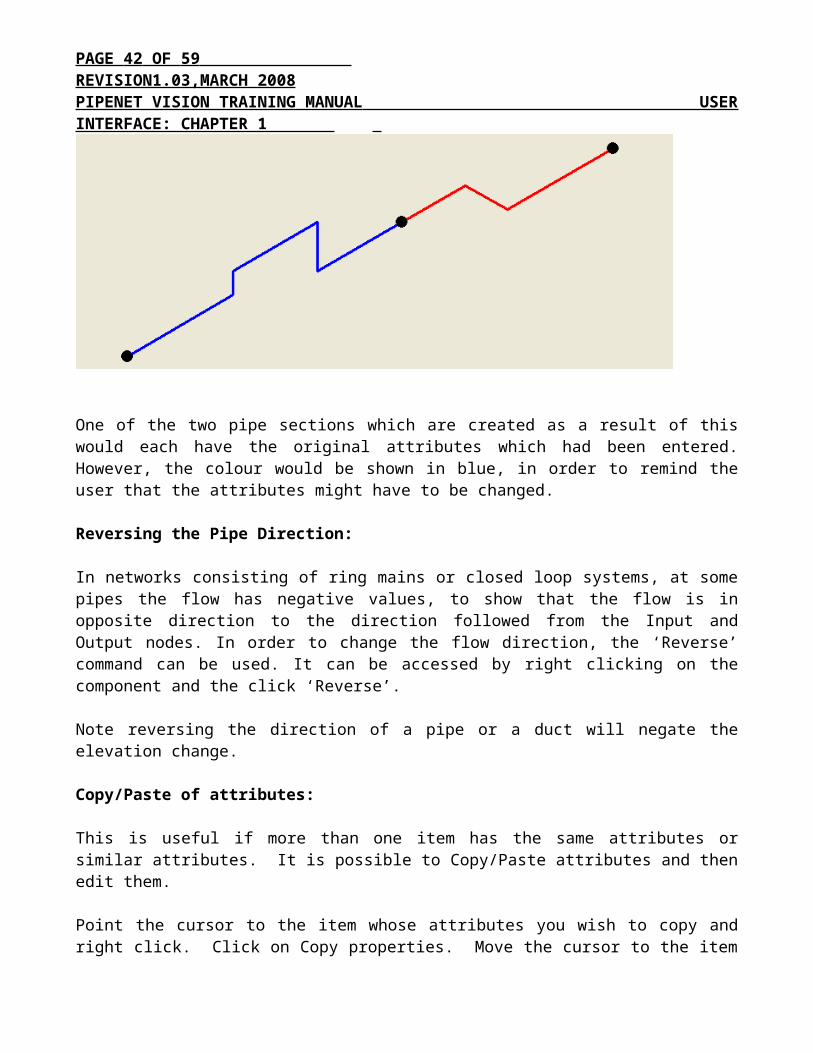
PAGE 34 OF 47 REVISION1.03,MARCH 2008 PIPENET VISION TRAINING MANUAL USER INTERFACE: CHAPTER 1 One of the two pipe sections which are created as a result of this would each have the original attributes which had been entered. However, the colour would be shown in blue, in order to remind the user that the attributes might have to be changed.
Reversing the Pipe Direction:
In networks consisting of ring mains or closed loop systems, at some pipes the flow has negative values, to show that the flow is in opposite direction to the direction followed from the Input and Output nodes. In order to change the flow direction, the ‘Reverse’ command can be used. It can be accessed by right clicking on the component and the click ‘Reverse’.
Note reversing the direction of a pipe or a duct will negate the elevation change.
Copy/Paste of attributes:
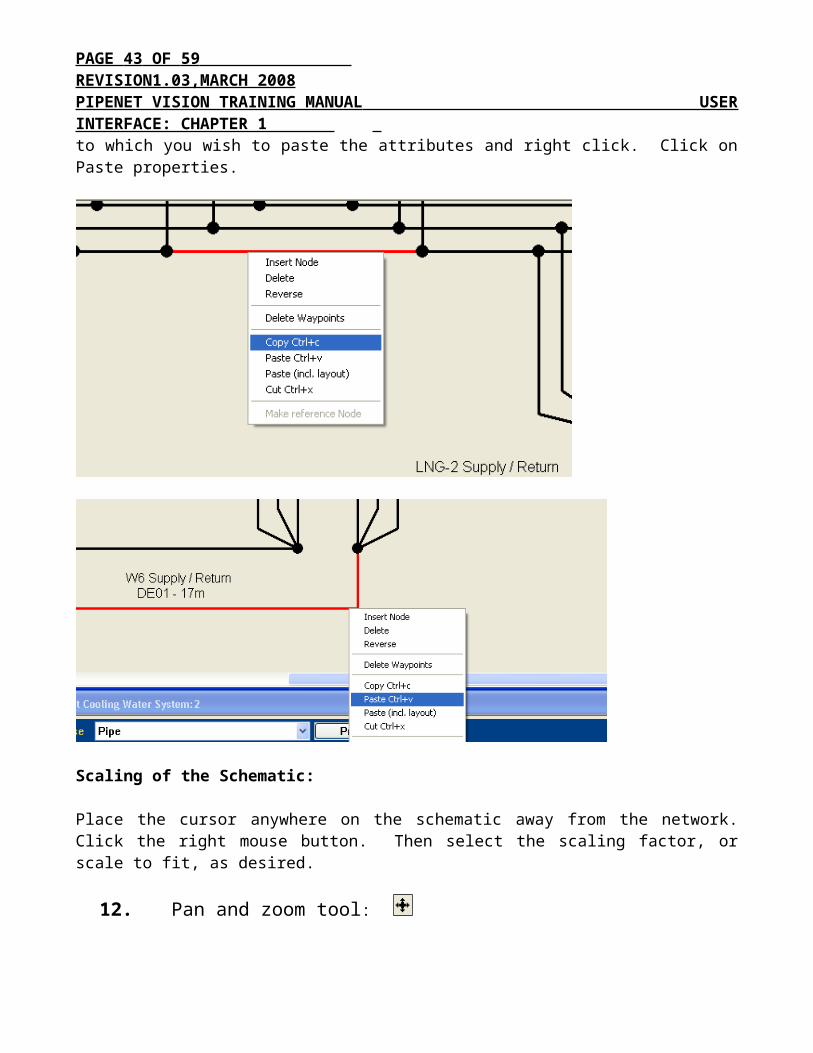
This is useful if more than one item has the same attributes or similar attributes. It is possible to Copy/Paste attributes and then edit them.
Point the cursor to the item whose attributes you wish to copy and right click. Click on Copy properties. Move the cursor to the item to which you wish to paste the attributes and right click. Click on Paste properties.
PAGE 35 OF 47 REVISION1.03,MARCH 2008 PIPENET VISION TRAINING MANUAL USER INTERFACE: CHAPTER 1
Scaling of the Schematic:
Place the cursor anywhere on the schematic away from the network. Click the right mouse button. Then select the scaling factor, or scale to fit, as desired.
12. Pan and zoom tool:
This tool can be used to ‘zoom’ the network to a required size or to ‘pan’ across the network.
To zoom the network, hold down the left mouse button and drag the cursor until the network is at the required Size.
Dragging to the right will enlarge the network, to the Left will minimize.
To pan across the network, click the left mouse button whilst in the schematic window and move the mouse in the direction you wish to pan. Click the left mouse button again to cease panning.
Whilst panning, if the cursor is moved to the edge of the window the network will scroll along until the end of the scroll bar is reached.
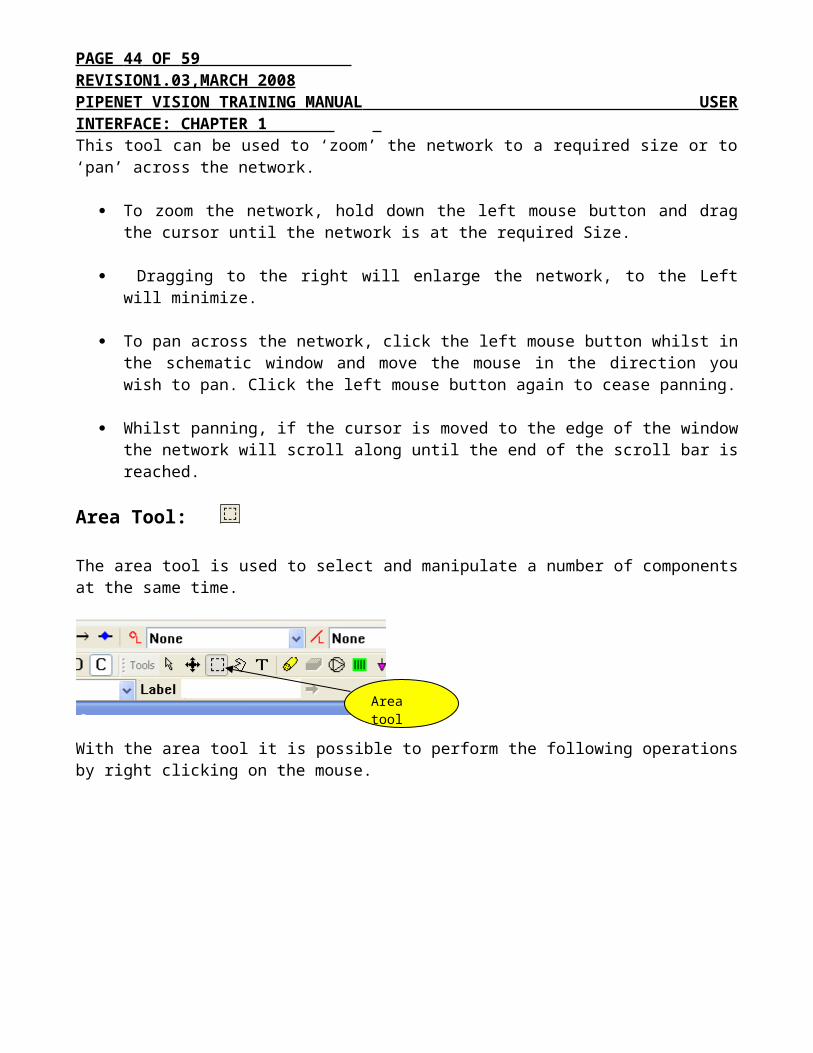
Area Tool: The area tool is used to select and manipulate a number of components at the same time.
With the area tool it is possible to perform the following operations by right clicking on the mouse.
Area tool
PAGE 36 OF 47 REVISION1.03,MARCH 2008 PIPENET VISION TRAINING MANUAL USER INTERFACE: CHAPTER 1
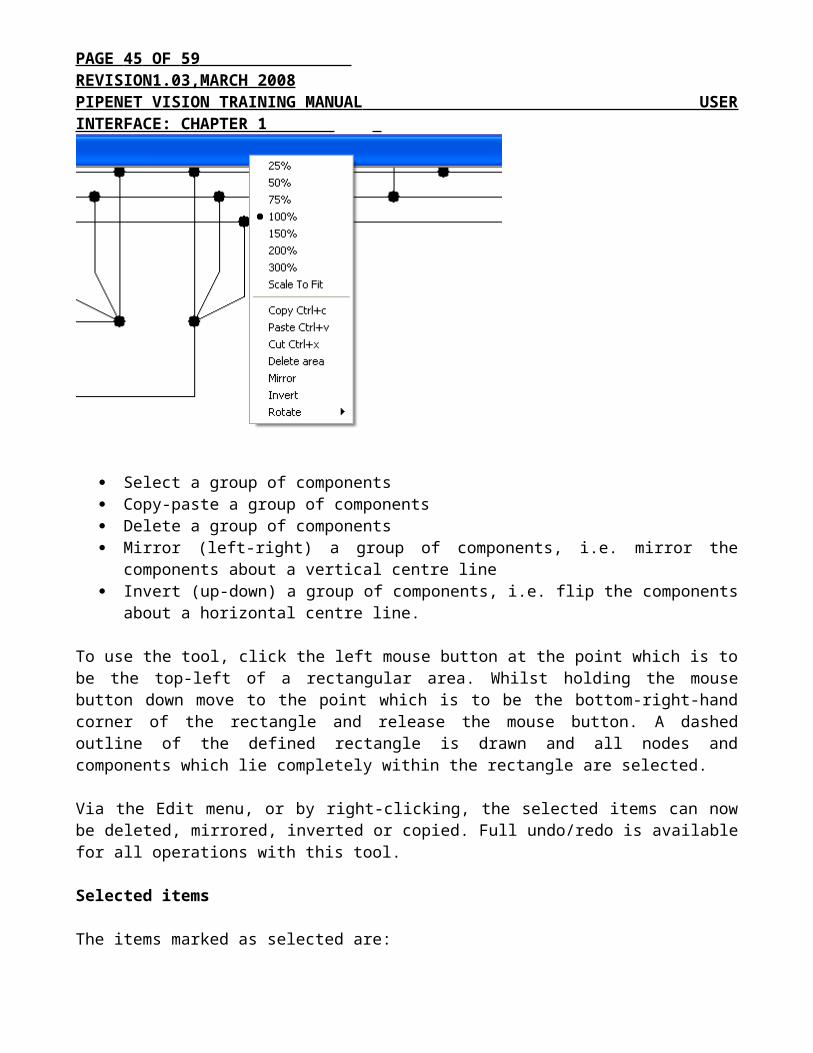
Select a group of components Copy-paste a group of components Delete a group of components Mirror (left-right) a group of components, i.e. mirror the components about a vertical
centre line Invert (up-down) a group of components, i.e. flip the components about a horizontal
centre line. To use the tool, click the left mouse button at the point which is to be the top-left of a rectangular area. Whilst holding the mouse button down move to the point which is to be the bottom-right-hand corner of the rectangle and release the mouse button. A dashed outline of the defined rectangle is drawn and all nodes and components which lie completely within the rectangle are selected.
Via the Edit menu, or by right-clicking, the selected items can now be deleted, mirrored, inverted or copied. Full undo/redo is available for all operations with this tool.
Selected items
The items marked as selected are:
Each node contained within the rectangle
Each link component contained within the rectangle whose input and output nodes are both within the rectangle, i.e. components crossing the boundary are not selected.
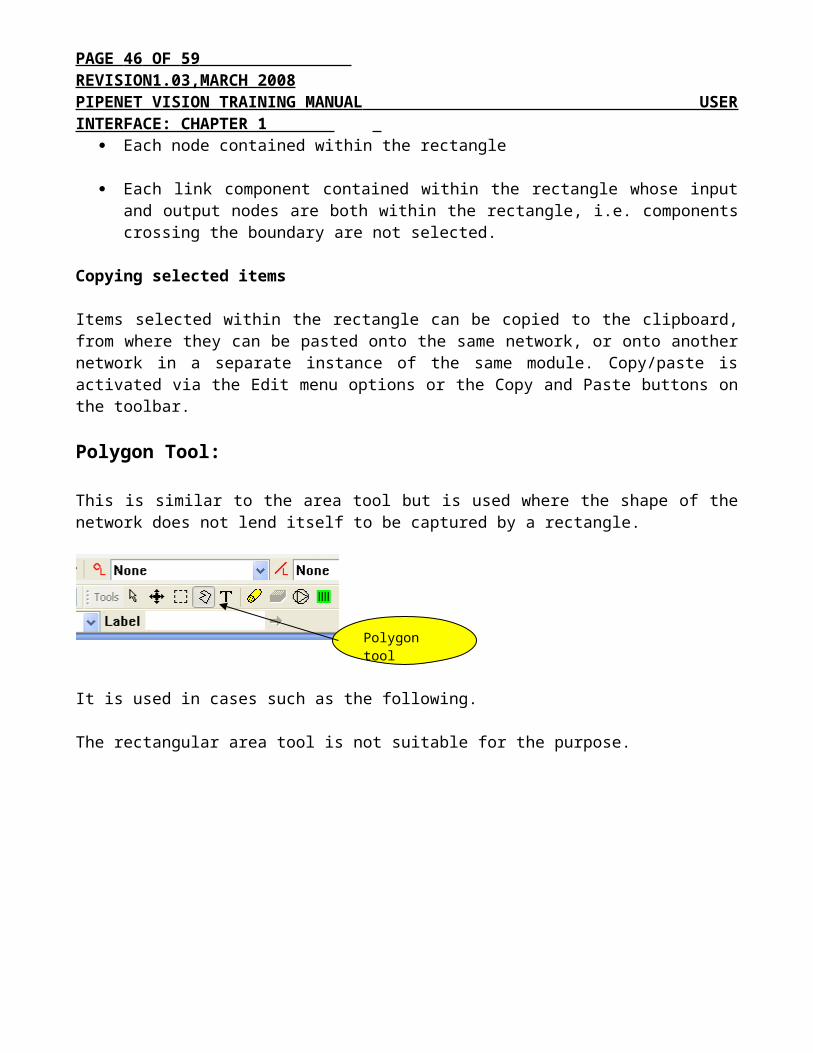
Copying selected items
PAGE 37 OF 47 REVISION1.03,MARCH 2008 PIPENET VISION TRAINING MANUAL USER INTERFACE: CHAPTER 1 Items selected within the rectangle can be copied to the clipboard, from where they can be pasted onto the same network, or onto another network in a separate instance of the same module. Copy/paste is activated via the Edit menu options or the Copy and Paste buttons on the toolbar.
Polygon Tool:
This is similar to the area tool but is used where the shape of the network does not lend itself to be captured by a rectangle.
It is used in cases such as the following.
The rectangular area tool is not suitable for the purpose.
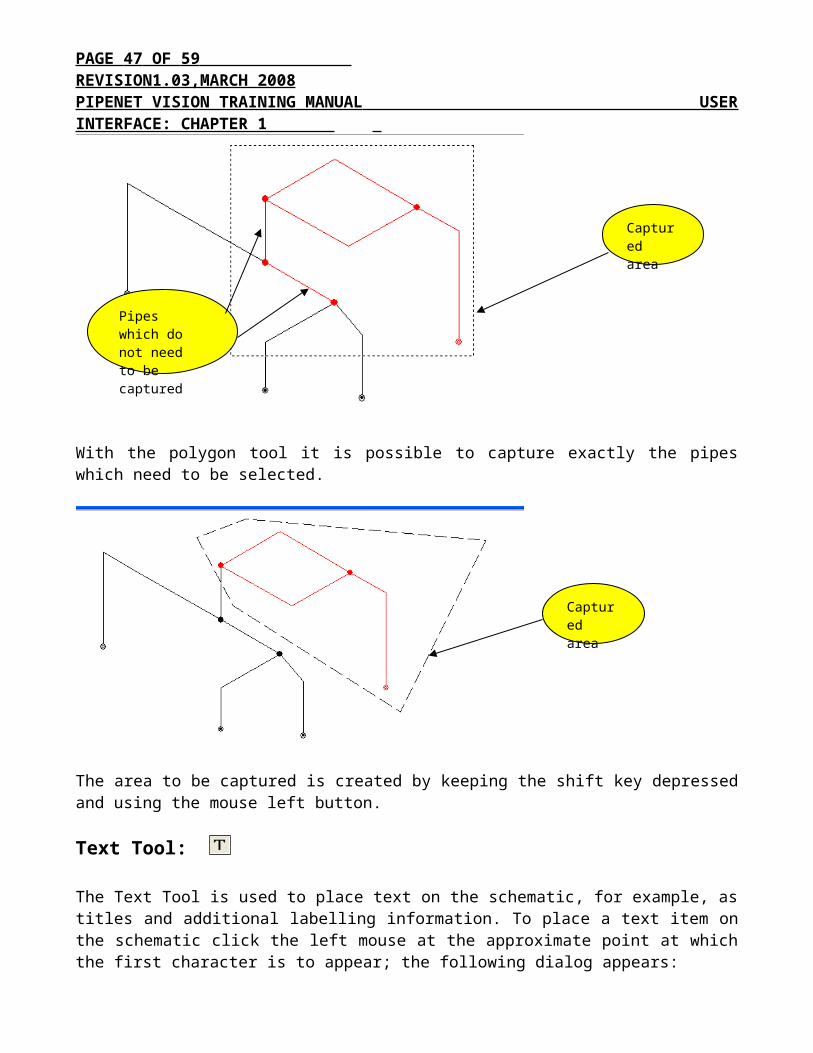
With the polygon tool it is possible to capture exactly the pipes which need to be selected.
Polygon tool
Pipes which do not need to be captured
Captured area
PAGE 38 OF 47 REVISION1.03,MARCH 2008 PIPENET VISION TRAINING MANUAL USER INTERFACE: CHAPTER 1
The area to be captured is created by keeping the shift key depressed and using the mouse left button.
Text Tool:
The Text Tool is used to place text on the schematic, for example, as titles and additional labelling information. To place a text item on the schematic click the left mouse at the approximate point at which the first character is to appear; the following dialog appears:
Enter the text which is to appear in the text field and then select OK to accept the text or Cancel to abort. Text options can be specified in the Properties Window and include typeface, size, style (normal, bold, italic or bold and italic) and colour.
Captured area
PAGE 39 OF 47 REVISION1.03,MARCH 2008 PIPENET VISION TRAINING MANUAL USER INTERFACE: CHAPTER 1
Moving and editing text
Once a text element has been added to the schematic it can be selected, edited and moved: 1. Click on a text element and its properties can be edited in the Properties Window. 2. Click and drag to move the text. 3. Right-click on a text element and select ‘Delete’ from the pop-up menu to delete the text.
Navigation in the Network
To move around the network, displaying each component in turn can of course be achieved by using the mouse to select the component and then viewing its attributes in the Properties Window. Alternatively, you can view all components of a given type via the Tabular Window, clicking on a row will highlight the corresponding component in the schematic window, and vice-versa, selecting a component in the schematic window highlights the corresponding component in the Tabular View. Yet another way is to use the two arrow buttons in the bottom right-hand corner of the Properties Window to select the next component of the same type (right-facing arrow) or the previous component of the same type (left-facing arrow).
There is another way to move around the network, highlighting components in turn, using the four cursor keys on the keyboard. This is best illustrated by the following example. With pipe 2 the currently selected component and all component directions being from left to right, selecting the right cursor key moves to pipe 3 and selecting the left cursor key moves backwards to pipe 1.
PAGE 40 OF 47 REVISION1.03,MARCH 2008 PIPENET VISION TRAINING MANUAL USER INTERFACE: CHAPTER 1
Now consider what happens when we are on pipe 3:
Selecting the right cursor key will move to uppermost component on the right, i.e. pipe 4:
To move to pipe 5 from pipe 4 simply select the down cursor key:
Selecting the down cursor key again will move to pipe 6 whilst selecting the up cursor key will move back to pipe 4.
PAGE 41 OF 47 REVISION1.03,MARCH 2008 PIPENET VISION TRAINING MANUAL USER INTERFACE: CHAPTER 1
If the component is reversed, i.e. the input node is to the right of the output node then selecting the right cursor key will move to the link to the left. Similarly selecting the left cursor key will move to the link to the right of the current link. So selecting the right cursor key is interpreted as a move in the component direction and the left cursor key as a move in the reverse direction.
Schematic Underlay
It is possible to import a graphic to underlay the main pipe network. The graphic to be imported must be an Enhanced metafile (file extension .EMF).
The image is loaded on the first request to display the underlay. Once loaded the underlay may be zoomed to establish the relative scale between the underlay and the network. Generally the procedure will be as follows:
1. Load the underlay (from View menu/ Import graphical underlay) 2. Establish a suitable scaling for the underlay (from View/Zoom/underlay/scaling) 3. Start drawing the network over the underlay
The display of the underlay can be turned on or off via the View menu - when turned off the underlay will track any changes to the scale of the network, retaining the correct relation.
Zoom of the underlay is independent of the network, whereas zooming the network, also zooms the underlay to maintain relative scales.
Overview window
PAGE 42 OF 47 REVISION1.03,MARCH 2008 PIPENET VISION TRAINING MANUAL USER INTERFACE: CHAPTER 1 Provides an overall view of the schematic with a rectangle showing the part of the network currently displayed in the schematic window. The rectangle tracks changes in size and position of the main schematic window but the rectangle in the overview can also be dragged to effect the scroll of the main schematic window.
Display of the Overview window, which is not shown on starting the program, is via the View | Schematic Overview menu option
Copy to Clipboard
This is used for copying and pasting the schematic drawings to documents and is an invaluable feature. Click on Schematic then Copy to Clipboard. Open the document and position the cursor where you wish to place it. Then go to Edit and Paste.
Zoomed area
PAGE 43 OF 47 REVISION1.03,MARCH 2008 PIPENET VISION TRAINING MANUAL USER INTERFACE: CHAPTER 1
20
16
21
21
26
6 78
8
89
10
1112
12 12 12
12 13 13
14
15
27
27
28
28
28
28 29 29
3031
3131
32
33
3435
3535
36
37
38
38
38
3940
42
47
47
47
47
53
53
45 45
45
45
45
45 46
46
46
46
46
22
2
2 3
34
5
5
5
5
5 5 55
17 17
1819
191919
22
2324
242424
49
49
50
50
50
50
51
41
25
43
1
1
1
44
44
48
48
52
52
52
1
1
2
3
18
14
19
15
20
23
6 7
8
109
1112
13
5
28
29 30
31
32
35 36
37
38
39
40
41
42
43
44
34
50
45 46 47
2
3
4
16
17
21
22
24
25
2726
49
33
1
48
Other useful features of PIPENET
Any description of PIPENET would be incomplete without the following features being covered.
Global and Local Edit
This is applied to the data window. It is best illustrated by an examples.
Change the roughness of all pipes from 0.06 mm to 0.08 mm.
PAGE 44 OF 47 REVISION1.03,MARCH 2008 PIPENET VISION TRAINING MANUAL USER INTERFACE: CHAPTER 1
PAGE 45 OF 47 REVISION1.03,MARCH 2008 PIPENET VISION TRAINING MANUAL USER INTERFACE: CHAPTER 1
Local edit is similar. The pipes to which the copied value is pasted must be selected.
Sorting in Columns in the Data Window
This can be an invaluable feature. For example it might be very useful to determine the pipe with the maximum velocity or the maximum pressure. This can be done in the data window.
Select results display tab
PAGE 46 OF 47 REVISION1.03,MARCH 2008 PIPENET VISION TRAINING MANUAL USER INTERFACE: CHAPTER 1
Copy/Paste to a Spreadsheet
Copy the data window by Edit/Copy as shown below.
Click at the heading to sort the column
Click here to select the results
PAGE 47 OF 47 REVISION1.03,MARCH 2008 PIPENET VISION TRAINING MANUAL USER INTERFACE: CHAPTER 1
Open the Spreadsheet program and paste
Closing Remarks
This part of the training course is intended to give an introduction to the user interface for PIPENET VISION. The input for the other modules is similar. This is a good opportunity to navigate and become familiar with all aspects of PIPENET VISION user interface.