UseR in the financial sector
29
UseR in the financial sector International Workshop on Computational and Financial Econometrics Geneva, 20 - 22 April 2007 Dr. Bernhard Pfaff Invesco Asset Management Deutschland GmbH Frankfurt am Main
Transcript of UseR in the financial sector

UseR in the financial sector
International Workshop on
Computational and Financial Econometrics
Geneva, 20 - 22 April 2007
Dr. Bernhard Pfaff
Invesco Asset Management Deutschland GmbH
Frankfurt am Main

2
Table of Contents
Section 01 – Overview
Section 02 – The case of R
Section 03 – Multiple equation model
Section 04 – Summary
CONFIDENTIALITY NOTICE: All material presented is compiled from sources believed to bereliable and current, but accuracy cannot be guaranteed. This is not to be construed as an offerto buy or sell any financial instruments. It is not our intention to state, indicate or imply in anymanner that current or past results are indicative of future profitability or expectations. As withall investments there are associated inherent risks. Please obtain and review all financial materialcarefully before investing. This publication may contain confidential and proprietary informationof INVESCO Institutional and/or AMVESCAP International Companies. Circulation, disclosure,or dissemination of all or any part of this material to any unauthorized persons is prohibited.Unauthorized reproduction or distribution of all or any part of this material is prohibited.

3
1 Overview
Overview
01

4
Overview
� Using R in the financial sector
– The pros and cons.
– Examples.
� A structural multiple equation model
– Purpose.
– Model setup.
– Implementation and results.
� Summary

5
2 The case of R
The case of R
02

6
Life before R at Invesco
Let’s not kid ourselves: the most widely used piece of software
for statistics is Excel.a
� Use of MS Excel (VBA) was ubiquitous.
� Hence, statistical analysis was confined to MS Excel.
� RATS was used as sole econometric software package.
� Stock Selection: Indicator analysis have been directly
computed on the SQL-databases.
� Reports have been processed manually.a
Brian D. Ripley (‘Statistical Methods Need Software: A View of Statistical Computing’) Opening lecture
RSS 2002, Plymouth (September 2002), cited from package fortune by Achim Zeileis.

7
The pros & cons
PROS FIRST . . .
� Transparency: one can look under the hood.
� Powerful: Rich language, highly customisable, speed.a
� Interfaces: C/C++, FORTRAN/Fortran, Java,
tcl/TK, etc.
� Connectivity: ODBC, (D)COM, ftp, socket, etc.
� Reporting: Sweave, R2HTML, graphics (bmp, jpg,
Metafile, pdf, png, ps).
� Support: Documentation, books, Wiki, dedicated
email lists, conferences, courses.
� R is free, no license/upgrade issues.a
Quoting Tom Maycock from the RATS list (21 February 2007): “[RATS-L] RATS 6.3 Tip:
SMPL option on PRINT: . . . print(smpl=percent>100.0) / percent . . . ”.
In R the same is: percent[percent > 100.0].

8
The pros & cons
. . . AND SOME CONS
� Learning: R can be a real challenge for the novice.
� Econometric packages: Still some unchartered waters.
� Complexity: R, its CRAN-packages and projects are
evolving at a breath-taking pace.

9
Life with R at Invesco
EXAMPLES
� Centrally distributed as a software package with
Rtools, Emacs/ESS, MikTeX, AucTeX, MinGW.
� Accessing proprietary database written in Delphi via
(D)COM interface.
� Econometric modelling of financial markets (TAA).
� Enhancing/speeding up indicator calculations for stock
selection.
� Automated reporting (pdf- and html-output).

10
3 Multiple equation model
Multiple equation model
03

11
Purpose
� Today’s capital markets are highly interdependent.
� This interdependence takes place across countries
and/or across assets.
� Model’s purpose: exploit these interdependencies for
one-step-ahead forecasts.
� Take explicitly macroeconomic variables into account,
such that it can be employed for scenario analysis too.

12
Structure
� Dependencies and interdependencies between the
equities & bond markets across countries are taken
explicity into account.
� A linkage between each of the countries bond market
to the equity market is implemented via the term
spread.
� Aside of financial instruments, key macroeconomic
variables are included in the model too.
� End-of-month data for S&P 500, EuroSTOXX, FTSE
all share, Nikkei 225 and 10-year benchmark yields
(10-year + for U.K) are used as endogenous variables.

13
Tinbergen’s arrow diagram
equs eqeu equk eqjp bdus bdeu bduk bdjp exog.var.
t− 1
t
t + 1
��
�
��
�
��
�
�
�
�
��
�
��
�
��
�

14
Estimation, solving and forecasting
ESTIMATION, SOLVING AND FORECASTING
� The reaction functions are estimated by OLS
(end-of-month data, sample: 01.1992 – 12.2006).
� The estimated reaction functions and the identities are
grouped together to form the model.
� The model is solved for the endogenous variables by
applying the Gauß-Seidel algorithm.
� One-step ahead forecasts can be generated without
further information.

15
Technicalities
� R is used as an interface to the Fair-Parke program.a
� Within the R script, the necessary data to run the
model is imported and transformations are calculated
where applicable.
� The set of time series is then exported to a suitable
formatted ASCI-file to be read into the FP-program.
� The output of the FP-program is written to ASCI-files,
which are then imported to R for further processing
and analysis.
� The FP input file creation is simplified and structured
through a GUI written in tcl/TK.a
The Fair-Parke program itself is written in FORTRAN and
is available at: http://fairmodel.econ.yale.edu/fp/fp.htm.

16
Dynamic and static ex post forecasts
U.S. EQUITY AND BOND40
060
080
010
0012
0014
00
S&
P 5
00
1995 2000 2005
U.S. equity
actualdynamicstatic
45
67
8
Ret
urn
US
T 1
0Y B
ench
mar
k p.
a. %
1995 2000 2005
U.S. Treasuries
actualdynamicstatic

17
Dynamic and static ex post forecasts
EUROZONE EQUITY AND BOND10
020
030
040
0
Eur
o S
TO
XX
1995 2000 2005
Eurozone equity
actualdynamicstatic
34
56
7
Ret
urn
Eur
o 10
Y B
ench
mar
k p.
a. %
1995 2000 2005
Eurozone Bunds
actualdynamicstatic

18
Dynamic and static ex post forecasts
U.K. EQUITY AND BOND15
0020
0025
0030
00
FT
SE
ALL
SH
AR
E
1995 2000 2005
U.K. equity
actualdynamicstatic
45
67
8
Ret
urn
GB
P 1
0Y+
Ben
chm
ark
p.a.
%
1995 2000 2005
U.K. Gilts
actualdynamicstatic

19
Dynamic and static ex post forecasts
JAPAN EQUITY AND BOND10
000
1500
020
000
Nik
kei 2
25
1995 2000 2005
Japan equity
actualdynamicstatic
12
34
Ret
urn
JPY
10Y
Ben
chm
ark
p.a.
%
1995 2000 2005
Japan JGBs
actualdynamicstatic
20
Backtest
GENERAL SETTINGS
� Backtest period runs from 01.2001 until 12.2006.
� The model is estimated and solved recursively, thereby
the one-month ahead forecasts are generated
(end-of-period).
� Qualitative and quantitative forecast measures are
calculated, i.e. hit rates, Theil’s U and its
decomposition.
� Finally, trade performance based on futures are
computed for holding initial cash positions of 10,000
USD, EUR, GBP and JPY, respectively.
� The benchmark for all is the one-month money market
rate.

21
Backtest
FORECAST ERROR MEASURES
hit rate (pct.) Theil’s U Bias Variance Random
Eurozone equity 73 0.645 0.086 0.124 0.790
U.S. equity 70 0.669 0.126 0.058 0.816
U.K. equity 63 0.664 0.232 0.051 0.717
Japan equity 59 0.640 0.167 0.057 0.776
Eurozone bond 69 0.498 0.137 0.023 0.840
U.S. bond 73 0.497 0.055 0.164 0.781
U.K. bond 62 0.614 0.126 0.147 0.726
Japan bond 76 0.329 0.032 0.000 0.968
22
Backtest
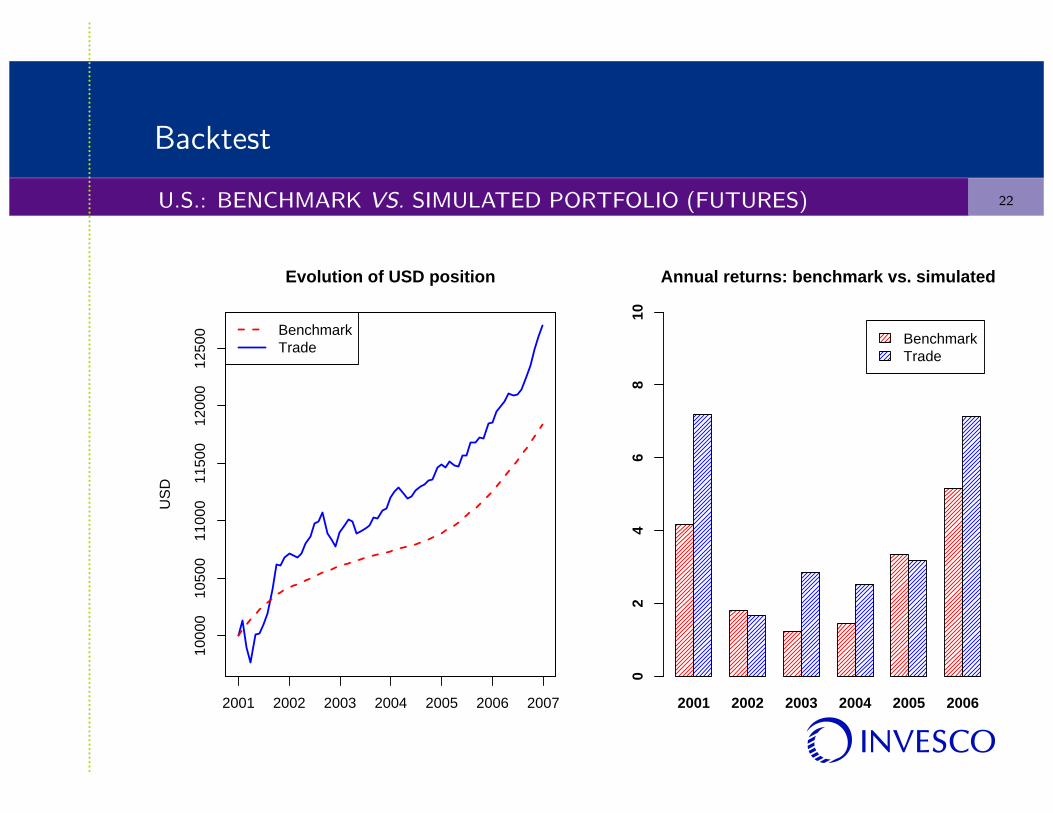
U.S.: BENCHMARK VS. SIMULATED PORTFOLIO (FUTURES)10
000
1050
011
000
1150
012
000
1250
0
US
D
2001 2002 2003 2004 2005 2006 2007
Evolution of USD position
BenchmarkTrade
2001 2002 2003 2004 2005 2006
BenchmarkTrade
Annual returns: benchmark vs. simulated
02
46
810

23
Backtest
EUROZONE: BENCHMARK VS. SIMULATED PORTFOLIO (FUTURES)10
000
1200
014
000
1600
018
000
EU
R
2001 2002 2003 2004 2005 2006 2007
Evolution of EUR position
BenchmarkTrade
2001 2002 2003 2004 2005 2006
BenchmarkTrade
Annual returns: benchmark vs. simulated
05
1015
2025
30

24
Backtest
U.K.: BENCHMARK VS. SIMULATED PORTFOLIO (FUTURES)10
000
1200
014
000
1600
018
000
2000
022
000
GB
P
2001 2002 2003 2004 2005 2006 2007
Evolution of GBP position
BenchmarkTrade
2001 2002 2003 2004 2005 2006
BenchmarkTrade
Annual returns: benchmark vs. simulated
05
1015
2025
30

25
Backtest
JAPAN: BENCHMARK VS. SIMULATED PORTFOLIO (FUTURES)10
000
1500
020
000
2500
0
JPY
2001 2002 2003 2004 2005 2006 2007
Evolution of JPY position
BenchmarkTrade
2001 2002 2003 2004 2005 2006
BenchmarkTrade
Annual returns: benchmark vs. simulated
010
2030
4050
60

26
4 Summary
Summary
04
27
Summary
� The pros outweigh the cons; the experience from using
R by practioneers on a day-to-day is throughout
positive.
� It has been demonstrated how easily R can be
employed and integrated with other software, i.e. the
Fair-Parke program.
� Results from a simple structural multiple equation
model look promising in terms of forecast performance.

28
Literature
? Barrett, R., M. Berry, T. F. Chan, J. Demmel, J. Donato, J. Dongarra, V. Eijkhout, R. Pozo, C.
Romine and H. Van der Vorst, Templates for the Solution of Linear Systems: Building Blocks for
Iterative Methods, 2nd edition, 1994, Philadelphia, PA: SIAM.
? Fair, R., Specification, Estimation, and Analysis of Macroeconomic Models, 1984, Cambridge, MA:
Harvard University Press.
? Fair, R., Testing Macroeconometric Models, 1998, Cambridge, MA: Harvard University Press.
? Fair, R., Estimating How the Macroeconomy Works, 2004, Cambridge, MA: Harvard University Press.
? Greene, W. Econometric Analysis, 5th edition, 2002, Upper Sadle River, NJ: Prentice Hall.
? Judge, G., R. Hill, W. Griffiths, H. Lutkepohl and T. Lee, Introduction to the Theory and Practice of
Econometrics, 2nd edition, 1988, New York, NY, John Wiley & Sons Inc.
? Judge, G., R. Hill, W. Griffiths, H. Lutkepohl and T. Lee, The Theory and Practice of Econometrics,
1985, New York, NY: John Wiley & Sons Inc.

29
Disclaimer
CONFIDENTIALITY NOTICE:
All material presented is compiled from sources believed to be reliable and current, but accuracy cannot be
guaranteed. This is not to be construed as an offer to buy or sell any financial instruments. It is not our
intention to state, indicate or imply in any manner that current or past results are indicative of future
profitability or expectations. As with all investments there are associated inherent risks. Please obtain and
review all financial material carefully before investing. This publication may contain confidential and proprietary
information of INVESCO Asset Management Limited. Circulation, disclosure, or dissemination of all or any
part of this material to any unauthorized persons is prohibited. Unauthorized reproduction or distribution of all
or any part of this material is prohibited. INVESCO has expressed its own views and opinions in this document
and this may change. There is potential for increased volatility in emerging stock markets, and only a modest
proportion of investable wealth should be invested in them. Asset management services are provided by
INVESCO in accordance with appropriate local legislation and regulations. For information on fund
registrations, please refer to the appropriate internet site or your local INVESCO office.
This publication may contain confidential and proprietary information of INVESCO Institutional and/or
AMVESCAP International Companies. It has been furnished to a selected number of professional investors
solely for information. Circulation, disclosure, or dissemination of all or any part of this material to any
unauthorized persons is prohibited. Unauthorized reproduction or distribution of all or any part of this material
is prohibited.