Slide Show iPAL for Biodiesel OIW AO & WIO Version 5plus Work in Progress

World’s BestOil in WaterAnalyzers
USER HANDBOOK:OIW - EX SERIES SIDE STREAM
OIL IN WATER ANALYZERS
DOCUMENT CODE:
0IW - HBO - 0002
VERSION: EX-005

8 Meadowbank Road, Carrickfergus, BT38 8YF, Northern Ireland www.advancedsensors.co.uk
Page 1 of 93
OIW-HBO-0002-EX-005
OIW EX SERIES-SIDE STREAM
OPERATION MANUAL R e v . 0 0 4 M A Y 2 0 1 5
TABLE OF CONTENTS TABLE OF CONTENTS ................................................................................................................................................... 1
DOCUMENT HISTORY .................................................................................................................................................... 4
SYMBOLS USED IN THIS MANUAL ............................................................................................................................. 4
HANDBOOK DESCRIPTIONS ......................................................................................................................................... 5
SECTION 1 - INTRODUCTION ....................................................................................................................................... 6
1.1 - General Information ............................................................................................................................................................... 6 1.2 – General Health & Safety ...................................................................................................................................................... 7 1.3 – Explosion Safety .................................................................................................................................................................... 7 1.4 – Electrical Safety .................................................................................................................................................................... 8 1.5 - Mechanical Safety ................................................................................................................................................................. 8 1.6 – Optical Safety ........................................................................................................................................................................ 9 1.7 - Audio Safety ............................................................................................................................................................................ 9 SECTION 2 – UNIT OVERVIEW .................................................................................................................................. 10
2.1 – Overview of Unit Hardware .............................................................................................................................................. 10 2.2 – Analyzer Identification ....................................................................................................................................................... 14 2.3 – Overview of Measurement and Measurement Cycle .................................................................................................... 15
2.3.1 – Measurement with the OIW Analyzer .......................................................................................................................................... 15 2.3.1.1 – Valve Configurations ............................................................................................................................................................. 15
2.3.2 – Measurement Cycle Overview ....................................................................................................................................................... 16 2.3.3 – Measurement Cycle - Phase Descriptions ................................................................................................................................. 17
2.3.3.1 – Phase 1 – Flowing ................................................................................................................................................................ 17 2.3.3.2 – Phase 2 – Cleaning ............................................................................................................................................................ 18 2.3.3.3 – Flow Valve Closing .............................................................................................................................................................. 18 2.3.3.4 – Phase 3 – Homogenizing ................................................................................................................................................. 18 2.3.3.5 – Phase 4 – Settling ............................................................................................................................................................... 19 2.3.3.6 – Phase 5 – Measuring ......................................................................................................................................................... 19
2.3.4 – Phase Auto Tuning .......................................................................................................................................................................... 20 2.3.5 – Valve Anomalies ................................................................................................................................................................................ 21
SECTION 3 - OVERVIEW OF SOFTWARE OPERATION ............................................................................................ 22
3.1 – The OIW-EX Series Basic Operating Functions ............................................................................................................ 22 3.1.1 – Starting the OIW-EX Series ............................................................................................................................................................ 22 3.1.2 – MS Windows Functions of the OIW Software ........................................................................................................................... 23 3.1.3 – Starting and Stopping the Measurement Cycle ....................................................................................................................... 24 3.1.4 - Exiting the OIW Software ................................................................................................................................................................. 24

8 Meadowbank Road, Carrickfergus, BT38 8YF, Northern Ireland www.advancedsensors.co.uk
Page 2 of 93
OIW-HBO-0002-EX-005
OIW EX SERIES-SIDE STREAM
OPERATION MANUAL R e v . 0 0 4 M A Y 2 0 1 5
3.2 – Main Software Window ..................................................................................................................................................... 25
3.2.1 – Upper Panel: Feedback Display .................................................................................................................................................... 28 3.2.1.1 – Measurement Reading Area .............................................................................................................................................. 28 3.2.1.2 – Status Display ....................................................................................................................................................................... 28 3.2.1.3 – System Information Display .............................................................................................................................................. 29 3.2.1.4 – Reading Menu ....................................................................................................................................................................... 29 3.2.1.5 – System Logs and Alarm Indicators ................................................................................................................................. 30 3.2.1.6 – Measurement Average Display ......................................................................................................................................... 31
3.2.2 – Middle (and Lower) Panel: Graphical Display .......................................................................................................................... 32 3.2.3 – Lower Panel: Configuration Options, Login, Overview and Graphical Displays .............................................................. 35 3.2.3.1 – Configuration Options Panel ............................................................................................................................................. 35 3.2.3.1.1 – General Configuration Options Menu ....................................................................................................................... 36
3.2.3.1.1.2 – Water Line Options ................................................................................................................................................. 39 3.2.3.1.1.3 – Custom Logs .............................................................................................................................................................. 41 3.2.3.1.1.4 – Passwords ................................................................................................................................................................. 42 3.2.3.1.1.5 – Help ............................................................................................................................................................................. 42 3.2.3.1.2 – Schedule Configuration Options Menu ................................................................................................................... 43
3.2.3.1.3 – Alarms Configuration Menu ....................................................................................................................................... 45 3.2.3.1.3.1 – Measurement Alarms ............................................................................................................................................. 45 3.2.3.1.3.2 – System Alarm Settings .......................................................................................................................................... 47
3.2.3.1.4 – Ultrasonics Configuration Menu ............................................................................................................................... 48 3.2.3.1.5 – Oil Type Configuration Menu ..................................................................................................................................... 50 3.2.3.1.5.1 – Oil Curve ..................................................................................................................................................................... 50 3.2.3.1.5.2 – General Oil Settings ............................................................................................................................................... 54 3.2.3.1.5.3 – Oil Calibration .......................................................................................................................................................... 55 3.2.3.1.5.4 – Spectrometer Settings .......................................................................................................................................... 56 3.2.3.1.5.5 – Spectrometer Mask Settings ............................................................................................................................... 57 3.2.3.1.5.6 – Spectrometer Calibration ..................................................................................................................................... 57 3.2.3.1.6 – External Output & Input Configuration Menu ....................................................................................................... 58
3.2.3.2 – Configuration Settings Display Area .............................................................................................................................. 59 3.2.3.2.1 – Measure Cycle ................................................................................................................................................................ 59 3.2.3.2.2 – Alarm Settings ............................................................................................................................................................... 59 3.2.3.2.3 – Active Oil Type ............................................................................................................................................................... 59 3.2.3.2.4 – Next Spectra ................................................................................................................................................................... 60 3.2.3.2.5 – Averaging ........................................................................................................................................................................ 60 3.2.3.2.6 – Serial Number, Software Version, Corporate Logo, Asset Tag and Start/Stop Button ............................ 60
SECTION 4 – SYSTEM LOGS AND TROUBLESHOOTING ........................................................................................ 61
4.1 – List of System Log Messages and User Actions ........................................................................................................... 61 4.2 – Troubleshooting ................................................................................................................................................................. 66
4.2.1 – Calibration Procedure ...................................................................................................................................................................... 66 4.2.1.1 – Sampling Procedure ................................................................................................................................................................. 66 4.2.1.2 – Calibration Steps: ..................................................................................................................................................................... 67 4.2.1.3 – Offset and Integration Time Adjustment .......................................................................................................................... 69 4.2.1.3.1 – Setting the Offset .............................................................................................................................................................. 69 4.2.1.3.2 – Setting the Gain ................................................................................................................................................................ 69

8 Meadowbank Road, Carrickfergus, BT38 8YF, Northern Ireland www.advancedsensors.co.uk
Page 3 of 93
OIW-HBO-0002-EX-005
OIW EX SERIES-SIDE STREAM
OPERATION MANUAL R e v . 0 0 4 M A Y 2 0 1 5
SECTION 5 – DATA LOGGING ................................................................................................................................... 71
5.1 – Introduction .......................................................................................................................................................................... 71 5.2 – Accessing Data Log Files................................................................................................................................................... 71
5.2.1 – Direct Access ...................................................................................................................................................................................... 71 5.2.1.1 – Locating OIW Log Files ............................................................................................................................................................ 73 5.2.1.1.1 – Windows XP ............................................................................................................................................................................. 73 5.2.1.1.2 – Windows 7 ............................................................................................................................................................................... 74
5.3 – OIW Log Files - Overview ................................................................................................................................................. 75 5.3.1 – Monthly OIW Logs ............................................................................................................................................................................ 76
5.3.1.1 – Data Log Files ........................................................................................................................................................................ 77 5.3.1.1.1 – Filename format ............................................................................................................................................................. 77 5.3.1.1.2 – Data File Format and Content .................................................................................................................................... 79
5.3.2 – Oil Type Backup Files ...................................................................................................................................................................... 81 5.3.3 – System Log Files .............................................................................................................................................................................. 82
5.3.3.1 – System Folder Contents ..................................................................................................................................................... 83 SECTION 6 – DUAL FLOW SYSTEM ........................................................................................................................ 84
6.1 - Overview ................................................................................................................................................................................ 84 6.2 - Software Interface .............................................................................................................................................................. 85 APPENDIX 1 – TECHNICAL DATA ............................................................................................................................ 89
APPENDIX 2 – DECLARATION OF CONFORMITY ................................................................................................... 90
APPENDIX 3 – PRODUCT UPDATES (INSERT ANY UPDATES IN THIS SECTION) .............................................. 91
A3.1 – Version 5.2 Release Notes .............................................................................................................................................. 91 A3.1.1 – Visual Changes ................................................................................................................................................................................. 91 A3.1.2 – Feature Enhancements ................................................................................................................................................................. 91 A3.1.3 – Issues Addressed ........................................................................................................................................................................... 92

8 Meadowbank Road, Carrickfergus, BT38 8YF, Northern Ireland www.advancedsensors.co.uk
Page 4 of 93
OIW-HBO-0002-EX-005
OIW EX SERIES-SIDE STREAM
OPERATION MANUAL R e v . 0 0 4 M A Y 2 0 1 5
DOCUMENT HISTORY
Change No. Version Description Released
0 A Draft First draft – separated from installation and User Handbook
1st May 2007
1 B Draft Updated Laser Labels 12th June 2008
2 C Draft Updated Laser Labels 17th June 2008
3 D Draft Added laser caution label 19th June 2008
4 E Draft Updated to match Software 3.38 3rd April 2009
5 1 Document issued 15th April 2009
6 1a Preface page updated 12th June 2009
7 2
1. Second Release after Review Changes made to page breaks. 2. Symbols move to fit in margins. 3. Moved Spectrometer Tab. 4. Updated Cover Page.
29th June 2009
8 3 Updated in-line with Version 4 of the OIW software. 1st February 2010
9 4 Conditions of Use and updated to new corporate formatting. Removal of Ex 11 2 G EEx d 11B T4 from Section 1.1
21st March 2014
10 5
Updated in line with Version 5 of the OIW software. New sections added: Hardware overview; System Logs & Troubleshooting; Data logs, Dual Flow systems; Declaration of Conformity and product updates.
19th May 2015
SYMBOLS USED IN THIS MANUAL
The symbol is used throughout this document to highlight important information.
The definitions of each term used where it is found are as follows:
CAUTION An instruction that draws attention to the risk of damage to the product, process or
surroundings.
INFORMATION Further reference for more detailed information or technical details.
NOTE Clarification of an instruction or additional information.
WARNING An instruction that draws attention to the risk of injury or death.
WARNING: Although Warning hazards are related to potential personal injury, and Caution hazards are associated with material damage, it must be understood that operation of damaged equipment could lead to personal injury or death. All Warning and Caution hazards must be complied with.

8 Meadowbank Road, Carrickfergus, BT38 8YF, Northern Ireland www.advancedsensors.co.uk
Page 5 of 93
OIW-HBO-0002-EX-005
OIW EX SERIES-SIDE STREAM
OPERATION MANUAL R e v . 0 0 4 M A Y 2 0 1 5
HANDBOOK DESCRIPTIONS This handbook is part of a library of handbooks that cover the full operation of the OIW-EX Series of products. The table
below lists the handbooks available. Please ensure that you have read all handbooks required for your job function.
NOTE: Password protected copies of the documents together with a table of the latest revisions are available in the ‘Documents’ section on-line via the following link:
http://www.advancedsensors.co.uk/downloads
*Passwords may be obtained directly from Advanced Sensors Ltd.
Code Handbook Description OIW EX Model
Key: O = Optional , X = Required, N/A = Not Applicable
OIW-HBO-
100-S
1000-S
100-P
1000-P
100-M
1000-M
0001 Side Stream Installation
Hardware information required for the physical installation of the OIW-EX Side Stream Series of units.
X X N/A N/A N/A N/A
0002 User Operation overview & configuration information for the OIW-EX Side Stream Series.
X X N/A N/A N/A N/A
0006 Wireless Controller
Set up and instructions for use of the handheld wireless controller. O O O O N/A N/A
0009 Microscopy
Details the operation of units fitted with the Microscopy system and how to examine the microscopy files.
N/A N/A N/A N/A X X
0010 HART Instructions for HART modem interface and implemented commands.
O O O O N/A N/A
0011 In-Line Probe User
Operation overview & configuration information for the OIW-EX Probe Series.
N/A N/A X X N/A N/A
0012 In-Line Probe Installation
Hardware information required for the physical installation of the OIW-EX Probe Series of units.
N/A N/A X X N/A N/A
0013 MiView
Instructions to access and examine microscopy files using the Advanced Sensors software tool MiView.
N/A N/A N/A N/A X X
8 Meadowbank Road, Carrickfergus, BT38 8YF, Northern Ireland www.advancedsensors.co.uk
Page 6 of 93
OIW-HBO-0002-EX-005
OIW EX SERIES-SIDE STREAM
OPERATION MANUAL R e v . 0 0 4 M A Y 2 0 1 5
SECTION 1 - INTRODUCTION
1.1 - GENERAL INFORMATION This manual provides user information for the basic routine operation of the Advanced Sensors Ltd
OIW-EX Series of Oil in Water Analyzer Systems. These analyzers are designed to conform to EN61010-1 2001 Part 1 and
are for use within Hazardous Areas to analyze the residual hydrocarbon content in Produced Water. The OIW-EX Series
is certified to the following specifications:
ATEX Directive (94/9/EC) Ex ll 2 G Ex d/de llB T4
Class I Div.1 Groups C & D T4 (USA and Canada)
Class I Zone 1 AEx/Ex d / de IIB T4 / T3 (USA and Canada; inc. Dual Seal Range)
Class I Div. 2 Groups A, B, C & D T4 (USA and Canada)
Marine Equipment Directive 96/98/EC
IMO MEPC 107 (49): ABS, USCG & BV
The analyzer software is MS Windows based for ease of use. Industry standard outputs available include: 4-20 mA
signal to output measurements over a configurable range and an Ethernet port over which the user can either receive
data or remotely control the unit. For complete listing of specifications see Appendix 1 page 87.
The oil content is measured using a technique known as Laser Induced Fluorescence (LIF). A laser penetrates through
the process water causing oil droplets to fluoresce. The resulting oil fluorescence value is used to calculate the
proportion of hydrocarbons in the water.
Contamination of the optical path, a result of oil adhesion, is a common problem with oil in water analyzers. To
overcome this problem a proprietary ultrasonic self-cleaning system has been incorporated into the analyzer which
operates at configurable intervals to accommodate the variable environmental conditions.
Should you have any questions or comments regarding any information contained within this manual, please contact us
at address shown below:
Advanced Sensors Ltd 8 Meadowbank Road
Carrickfergus BT38 8YF
Northern Ireland
Tel: +44 (0)28 93 32 89 22 Fax: +44 (0)28 93 32 86 69
Web: www.advancedsensors.co.uk
NOTE: This manual addresses ONLY THE ROUTINE OPERATION of the OIW-EX Series Side– Stream Analyzer systems. INSTALLATION is supported by the Installation Manual (OIW-HBO-0001-EX-010).
INFORMATION: For BILGE MONITORING applications measurement certain settings are factory set and non configurable.
INFORMATION: Access to some functions will be restricted to trained and authorized Advanced Sensors Representatives, Engineers and Personnel. This Operation Manual provides operational instructions for BASIC users only. Advanced functionality will therefore be restricted to authorized personnel only.

8 Meadowbank Road, Carrickfergus, BT38 8YF, Northern Ireland www.advancedsensors.co.uk
Page 7 of 93
OIW-HBO-0002-EX-005
OIW EX SERIES-SIDE STREAM
OPERATION MANUAL R e v . 0 0 4 M A Y 2 0 1 5
1.2 – GENERAL HEALTH & SAFETY 1. The equipment is designed for use in Hazardous Areas therefore shall not be opened without first obtaining the
required ‘hot’ permits.
2. All warning labels on the equipment and packaging shall be observed.
3. Installation shall only be carried out by qualified trained personnel, in accordance with the information in this
manual and under local Health and Safety procedures. Failure to comply with these instructions may
compromise the equipments protective features and result in potentially dangerous consequences or, may
cause the system to operate incorrectly.
4. Commissioning, servicing and repairs shall only be carried out by Advanced Sensors trained personnel.
5. There are NO USER-SERVICEABLE PARTS within the unit. Therefore no requirement exists for the door to be
opened, unless for the express purpose of installation or servicing. Any unauthorized repairs or modifications
will not be under-written by the manufacturer.
6. Ensure all sources of power to the system have been disconnected prior to opening the unit.
7. Safety precautions shall be taken when working with all pipe work subjected to internal pressure or high
temperatures.
8. If any physical damage occurs to the enclosure, display window or connection glands, then the power must be
removed immediately and the manufacturer, or their approved agent, contacted for servicing.
9. An annual service is recommended and should only be performed by the vendor (Advanced Sensors Ltd.), or
their approved agent, to ensure continuous optimum performance.
1.3 – EXPLOSION SAFETY 1. The equipment is contained within a flameproof enclosure. The integrity of the enclosure shall only remain
intact if the equipment is maintained as manufactured. No parts shall be replaced, modified or substituted
without the express consent of the manufacturer or their authorized representative.
2. In the event of physical damage to the sealed enclosure, window or connection glands, the power must be
immediately removed and the manufacturer or their authorized representative contacted for servicing.
3. Local site ‘hot’ working procedures, including permits, must be strictly adhered to as the equipment may
present a local ignition source when the enclosure door is opened and the unit powered up. Once the door is
closed the 14 x Cap head peripheral bolts shall be tightened to a torque of 30.0 Nm.
4. All unused ports in the base of the enclosure shall have an ExD approved brass M25 plug fitted and shall be
tightened to a torque of 33Nm.

8 Meadowbank Road, Carrickfergus, BT38 8YF, Northern Ireland www.advancedsensors.co.uk
Page 8 of 93
OIW-HBO-0002-EX-005
OIW EX SERIES-SIDE STREAM
OPERATION MANUAL R e v . 0 0 4 M A Y 2 0 1 5
1.4 – ELECTRICAL SAFETY 1. The EX system is designed to operate off one of 2 nominal power variants: 115VAC or 230VAC.
2. It is the responsibility of the INSTALLER to ensure compliance with the regional requirements for electrical
safety regarding the provision of a compliant earth, earth bonding, adjacent electrical isolation and circuit
protection.
3. The enclosure shall be grounded via the external earth point, using an earth conductor, and once installation is
complete the system shall be inspected for compliance with regional requirements.
NOTE: Ensure the analyzer voltage and the supply voltages are compatible BEFORE commencing the installation.
1.5 - MECHANICAL SAFETY 1. The system - without the optional sunshade - weighs 93.5 kg (aluminium enclosure) or 141 kg (stainless steel
enclosure) (including the enclosure, stand, flow valve and Measurement Chamber). It is the customer’s
responsibility to ensure appropriate H&S compliance for the movement and manual handling of this unit.
2. Ensure water is present in the measurement chamber at all times during the analytical cycle. Insufficient water
in the chamber may result in damage to the sapphire window and/or the automated cleaning system.
3. The measurement chamber assembly has been design tested to 150 bar. It is the customer’s responsibility to
ensure that the process fluid pressure to the system does not exceed this level.
4. Installations where the process water temperature may be high it is the customer’s responsibility to comply
with any regional H & S signage requirements.
CAUTION: The analyzer unit, including peripherals (i.e. measurement chamber, flow valve and stand), is heavy and weighs more than 90kg. To prevent injury, all movement of the analyzer shall comply with local H & S procedures.

8 Meadowbank Road, Carrickfergus, BT38 8YF, Northern Ireland www.advancedsensors.co.uk
Page 9 of 93
OIW-HBO-0002-EX-005
OIW EX SERIES-SIDE STREAM
OPERATION MANUAL R e v . 0 0 4 M A Y 2 0 1 5
1.6 – OPTICAL SAFETY The system uses a Class 3R laser as part of its measurement process. The light from this source is contained within the
measurement chamber and is safe during normal operation. Power to the laser, or the unit, should not be applied when
the unit is disassembled. Use caution when the cover is removed from the inspection window to prevent direct eye
exposure.
The labelling and the location of this on the side of the unit, is shown in Figure 1 below:
Figure 1: Location of Class 3R laser warning label.
CAUTION: USE OF CONTROLS OR ADJUSTMENTS OR PERFORMANCE OF PROCEDURES OTHER THAN THOSE SPECIFIED HEREIN MAY RESULT IN HAZARDOUS RADIATION EXPOSURE.
1.7 - AUDIO SAFETY
The system uses an ultrasonic based cleaning technology, which will operate periodically to remove oil deposits adhering
to the reading window within the chamber. When the ultrasonic device is in operation noise levels may exceed safe
limits therefore it is recommended that ear protection shall be worn when working on the system or in the vicinity.
WARNING: The area shall be sign posted to indicate high noise levels and recommend suitable PPE (ear protection) be worn.

8 Meadowbank Road, Carrickfergus, BT38 8YF, Northern Ireland www.advancedsensors.co.uk
Page 10 of 93
OIW-HBO-0002-EX-005
OIW EX SERIES-SIDE STREAM
OPERATION MANUAL R e v . 0 0 4 M A Y 2 0 1 5
SECTION 2 – UNIT OVERVIEW
2.1 – OVERVIEW OF UNIT HARDWARE This section provides an overview of the generic external components common to the EX Series with Side-Stream
configuration. Configurations can be customised based on a users requirements and therefore may differ in appearance
to the generic configuration described in this section. For installation information, including electrical connections,
please see the Installation Manual (OIW-HBO-0001) and the electrical diagram supplied with the analyzer.
Figure 2, shows the front of the analyzer with the enclosure (including the display) (#1), terminal box (#2) and stand
(#3). The flameproof stainless steel enclosure (#1) has an offset hinged door with integrated viewing window and
houses the control PC, ultrasonic power supply, light source and additional PC boards required to integrate operation of
the analytical components. The terminal box (#2) (optional) is also a stainless steel enclosure housing the installed
electrical terminals. The analyzer is mounted to a stainless steel stand (#3) with 4 adjustable feet for levelling.
Figure 2: Front view of analyzer. 1. Enclosure (front) with display 2. Terminal box 3. Analyzer stand

8 Meadowbank Road, Carrickfergus, BT38 8YF, Northern Ireland www.advancedsensors.co.uk
Page 11 of 93
OIW-HBO-0002-EX-005
OIW EX SERIES-SIDE STREAM
OPERATION MANUAL R e v . 0 0 4 M A Y 2 0 1 5
The underside of the analyzer enclosure, Figure 3, is equipped with 8 x M25 entries (#1) (4 to the front and 4 to the back
of the enclosure) and all unused entries fitted with nickel plated brass stopping plugs as standard. The OIW enclosure is
also fitted with a nickel plated M5 Earth boss (#2) and an external USB port1 (#3); used for optional external keyboard,
USB mouse or storage drives.
Figure 3: Underside view of an analyzer.
1. M25 General Purpose Entries (x8) 2. M5 Earth boss 3. External USB Port (approved for Hazardous Areas)
The M25 general purpose entries are typically used for wiring electrical connections. OIW analyzers are wired in one of
three standard configurations – without a terminal box, with a terminal box or a terminal box fitted with an isolation
switch. Under special circumstances, analyzers may also be configured to accommodate specific electrical requirements.
1 USB ports are fitted as standard on all units EXCEPT Aluminium enclosures fitted with terminal boxes.

8 Meadowbank Road, Carrickfergus, BT38 8YF, Northern Ireland www.advancedsensors.co.uk
Page 12 of 93
OIW-HBO-0002-EX-005
OIW EX SERIES-SIDE STREAM
OPERATION MANUAL R e v . 0 0 4 M A Y 2 0 1 5
Terminal box not fitted
When a terminal box is not required, such as Class 1 division 1 installations, the front left entry (#1 in Figure 4) is used for
connecting the mains power and the entry to the back right side of the enclosure (#2 in Figure 4) is used to connect the
valve conduit.
Figure 4: Enclosure without a terminal box. 1. Mains entry 2. Valve conduit entry
Terminal box fitted (including with an isolation switch)
Terminal boxes are mounted below the enclosure door and use the 2 outermost M25 entries as shown in Figure 5. The
remaining 2 innermost M25 entries are inaccessible and therefore fitted with nickel plated brass stopping plugs.
Terminal boxes are equipped with 4 x M20 general purpose entries (on the underside); 1 for valve conduit entry (#4) and
the remaining 3 are free for other requirements; such as drain plugs, Ethernet, 4-20 mA and/or Alarm contact cables to
be wired into the control room. Unused entries are fitted with M20 stopping plugs. Finally 1 x M25 entry is allocated to
mains power entry (#2).
Figure 5: Enclosure fitted with 1. a terminal box and 2. An isolation switch
Isolation switches are fitted to the side of the terminal box, as shown above in Figure 5: Enclosure fitted with 1. a
terminal box and 2. An isolation switch #2.
INFORMATION: For electrical connection information please consult the Side Stream Installation manual, OIW-HBO-0001-EX-0014.
a. b.

8 Meadowbank Road, Carrickfergus, BT38 8YF, Northern Ireland www.advancedsensors.co.uk
Page 13 of 93
OIW-HBO-0002-EX-005
OIW EX SERIES-SIDE STREAM
OPERATION MANUAL R e v . 0 0 4 M A Y 2 0 1 5
Process connections are fitted to the rear of the analyzer, #1 in Figure 6a below. Process water is fed in through the
lower process inlet into the measurement chamber (#8) and flows out through the upper process outlet, as indicated by
the red arrows in Figure 6b below. The standard unit configuration consists of a valve assembly (#4 Valve, #5 Actuator
and #6 valve controller), chamber assembly (#8 chamber, cover and connecting pipe work) and sample point (#9).
At the flow outlet a sample point is fitted which terminates, as standard, in a ½” NPT valve (#9) from which samples can
be taken for lab analysis. The measurement chamber is fitted with a viewing window covered by a removable window
cap (#8). The valve assembly fitted to each unit uses a valve controller (#6) to operate the flow valve (#4)
Each unit is fitted with a valve controller to regulate valve position via a pneumatic (fitted as standard), or electric
(optional), actuator controlling the flow of process water into, and out of, the chamber.
Figure 6: a. Rear and b. Magnified rear views of the analyzer. Red arrows denote flow direction.
1. Enclosure 2. Terminal Box 3. Analyzer Stand 4. Flow Ball Valve 5. Pneumatic Actuator 6. Switchbox/Valve controller 7. Conduit containing electrical wiring 8. Chamber assembly with removable cover (for the viewing window) and
9. Sample point with valve.
a.
b.

8 Meadowbank Road, Carrickfergus, BT38 8YF, Northern Ireland www.advancedsensors.co.uk
Page 14 of 93
OIW-HBO-0002-EX-005
OIW EX SERIES-SIDE STREAM
OPERATION MANUAL R e v . 0 0 4 M A Y 2 0 1 5
2.2 – ANALYZER IDENTIFICATION Each OIW analyzer is identifiable by a unique serial number. Figure 7 shows where the serial number can be found on
analyzers with a. Stainless steel and b. Aluminium enclosures. Stainless steel units have an engraved serial number on
the back of the enclosure; while aluminium units have an engraved stainless steel plate attached to the door and the
back of the enclosure.
a. Stainless steel enclosure
b. Aluminium enclosure
Figure 7: Location of analyzer Serial Number for a. Stainless steel and b. Aluminium enclosures.
a.
b.

8 Meadowbank Road, Carrickfergus, BT38 8YF, Northern Ireland www.advancedsensors.co.uk
Page 15 of 93
OIW-HBO-0002-EX-005
OIW EX SERIES-SIDE STREAM
OPERATION MANUAL R e v . 0 0 4 M A Y 2 0 1 5
2.3 – OVERVIEW OF MEASUREMENT AND MEASUREMENT CYCLE 2.3.1 – Measurement with the OIW Analyzer
Fluorescence is a commonly utilised method for measuring the oil content in water; however measurement accuracy is
dependent on oil droplet size. Variation in droplet size may significantly affect the measurement reading despite
consistent oil content. Uniformity of droplet size and distribution are required to achieve a reliable ‘calibrated’ reading.
Therefore all OIW EX Analyzers are equipped with an ultrasonic transducer that serves the following purposes:
1. Breaking down the oil droplets into a uniform size.
2. Emulsifying effect to uniformly distribute the oil droplets within the water sample.
3. Prevention of sensor head and measurement chamber contamination.
Measurements are taken for every second the analyzer cycle is started and the data recorded in the Syslog files.
Scheduled sample measurement readings will appear in blue while all other normal flowing readings will be displayed in
black and out of range values in red. The OIW-EX Series has two methods of graphically displaying measurements with
configurable phase times to optimize performance for a given oil type. Users must login to select the method, selectable
from the ‘Water Line Options’ menu under the ‘General Configurations’ tab, and configure the phase times, from the
‘Measurement Cycle’ menu under the ‘Schedule’ Configuration Options.
The following 2 measurement display options are available:
1. Trending: Real time display of data points as recorded are displayed in the Graphical Display panel with a
red trending line connecting data points for reference. A vertical blue line on the graph will indicate values
obtained during scheduled measurements. When Trending is NOT selected only the scheduled
measurements will appear on the graphical display as vertical blue lines.
2. Trend Compensated: A compensation calculation will apply, obtained during the scheduled measurement,
to measurements in the next flowing phase. Trend compensation can be selected when significant
variations exist between trending and measured results. Possibly arising from differences in oil droplet
size and/or distribution.
2.3.1.1 – Valve Configurations
Standard configuration requires one valve to control the flow of produced water into the sample chamber as shown
below in Figure 8. Additional information for dual stream systems can be found in Section 6 p.84. Alternative
configurations are also available; please contact your local Advanced Sensors Representative for more information.
Figure 8: Standard Single Valve Configuration

8 Meadowbank Road, Carrickfergus, BT38 8YF, Northern Ireland www.advancedsensors.co.uk
Page 16 of 93
OIW-HBO-0002-EX-005
OIW EX SERIES-SIDE STREAM
OPERATION MANUAL R e v . 0 0 4 M A Y 2 0 1 5
2.3.2 – Measurement Cycle Overview
The Measurement Cycle of the OIW-EX is configurable, set using numerical selection options from the ‘Measurement
Cycle’ menu, to accommodate oil types and therefore timing of each phase is variable. Figures 9 and 10 are graphical
representations of the measurement cycle, where Figure 9 provides a simplified overview while Figure 10 details the
processes in taking a measurement reading. The details of each phase will be described in the following Section: 2.3.3
– Measurement Cycle – Phase Descriptions p.17. Configuration of the measurement cycle using the OIW software will
be described in Section 3.2.3.1.2 – Schedule Configuration Options Menu p. 43.
Figure 9: OIW-EX Measurement Cycle Overview
1. Auto – Tune: Cleaning - with the valve open to clean debris from the chamber prior to the valve closing. 2. Auto – Tune: Homogenization – prior to homogenizing samples.
The OIW-EX analyzer auto-tunes only in the following conditions: a) At the start of the 1st cycle, b) At Noon and Midnight, and c) With every ±5oC change in temperature.
Figure 10: OIW-EX Measurement processes
INFORMATION: A comprehensive software overview is covered in Section 3 of this manual.
* FLOWING MEASUREMENTS is continuous for User defined time period and is typically the predominant function of the cycle. The analyzer is measuring every second during the flowing state.
** SCHEDULED MEASUREMENT is composed of a series of configurable processes detailed below in Figure 10.

8 Meadowbank Road, Carrickfergus, BT38 8YF, Northern Ireland www.advancedsensors.co.uk
Page 17 of 93
OIW-HBO-0002-EX-005
OIW EX SERIES-SIDE STREAM
OPERATION MANUAL R e v . 0 0 4 M A Y 2 0 1 5
2.3.3 – Measurement Cycle - Phase Descriptions
Begin the Measurement Cycle by selecting ‘Start’. Once the cycle has started the flow valve will open allowing process
water to begin flowing through the analyzer chamber assembly. The following sub sections will summarise in brief the
status of the analyzer events during flowing, cleaning and measurement phases.
2.3.3.1 – Phase 1 – Flowing
In this phase process water flows freely through the sample chamber, past the flow valve, and returns to the main
process pipeline as indicated by the red arrows in Figure 11. The flowing phase continues – as configured by the user
– until the valve closes in preparation for measurement. Once the measurement, or hold phase, is complete the flow
valve re-opens.
Figure 11: Standard flow valve fitted on the outlet side of the chamber assembly.
Status Display during FLOWING:
During this phase ‘FLOWING’ will appear in the status display with a countdown timer to indicate the remaining
scheduled flow time, as shown below:
Figure 12: Flowing display.
If Trending Enabled is selected: the current measurement reading will be displayed with a trend line in the graphical
display including vertical blue lines to indicate values for scheduled measurements.
If Trending Enabled is NOT selected: then the measurement reading will only appear in the Measurement Reading Area
of the Feedback Display Panel. No graphical data will be shown on screen but data will be recorded in the log file. Only
vertical blue lines will be visible to indicate values for scheduled measurements.

8 Meadowbank Road, Carrickfergus, BT38 8YF, Northern Ireland www.advancedsensors.co.uk
Page 18 of 93
OIW-HBO-0002-EX-005
OIW EX SERIES-SIDE STREAM
OPERATION MANUAL R e v . 0 0 4 M A Y 2 0 1 5
2.3.3.2 – Phase 2 – Cleaning
The cleaning phase occurs within the flowing phase clearing the measurement window and allowing the process flow to
clear debris from the chamber. Cleaning times are user definable to accommodate oil variations in process water
ensuring optimal system performance. When Auto Tuning is enabled, see Section 2.2.2 – Phase Auto Tuning, the
analyzer will auto tune prior to the Cleaning Phase once at midnight. At the end of this phase the flow valve will close.
INFORMATION: Measurements cannot be taken during the Cleaning Phase.
Status Display during CLEANING:
During this phase ‘CLEANING’ will appear in the status display with a countdown timer to indicate the remaining
cleaning time, as shown below.
Figure 13: Cleaning display.
2.3.3.3 – Flow Valve Closing
Analyzers are fitted with flow valves to regulate process water flow through the system. In order to isolate, and hold, a
sample within the chamber the flow valve must close. Valve closing times can vary according to valve type; pneumatic
valves will typically take less than 1 second whereas electrically operated valves can take 15 - 20 seconds. Once the flow
valve has closed the Homogenizing Phase will begin.
INFORMATION: Once either valve has been instructed to open or close it will continue to move to its open or close state – even if the STOP button is pressed.
Status Display during Flow Valve Closing Phase:
‘CLOSING FLOW VALVE’ will appear in the status display to indicate the valve is in motion with a COUNT UP timer.
Figure 14: Valve display.
2.3.3.4 – Phase 3 – Homogenizing
Once the sample is isolated in the chamber, the contents are homogenized to reduce oil particle size into a uniform even
distribution. The homogenization time is configurable, from the ‘Schedule Configuration’ menu, to optimize the
homogenization required for a given oil type.
Status Display during Homogenization:
During this phase the status display will indicate ‘HOMOGENISING’ with a countdown timer for the selected duration as
shown below.
Figure 15: Homogenising display.

8 Meadowbank Road, Carrickfergus, BT38 8YF, Northern Ireland www.advancedsensors.co.uk
Page 19 of 93
OIW-HBO-0002-EX-005
OIW EX SERIES-SIDE STREAM
OPERATION MANUAL R e v . 0 0 4 M A Y 2 0 1 5
2.3.3.5 – Phase 4 – Settling
A short setting period is required after homogenisation has finished allowing any gases to dissipate and create a more
stable suspension in the sample chamber. This setting period is also configurable, from the ‘Schedule Configuration’
menu, to optimize the settling time for the given oil type.
Status Display during Settling:
During this phase ‘SETTLING’ will appear in the status display with a countdown timer to indicate the remaining settling
time, as shown below.
Figure 16: Settling display.
2.3.3.6 – Phase 5 – Measuring (Scheduled Measurement)
The duration of a scheduled measurement phase is user configurable. At scheduled intervals an isolated sample is
homogenised, evenly distributing the oil droplets for a more accurate reading.
INFORMATION: Measurements cannot be taken during the Cleaning Phase.
Status Display during Measuring:
During this phase ‘MEASURING’ will appear in the status display with a countdown timer to indicate the remaining
measurement time, as shown below:
Figure 17: Measuring display.
At the end of this phase the calculated average measured value is displayed in blue text for 3 seconds.

8 Meadowbank Road, Carrickfergus, BT38 8YF, Northern Ireland www.advancedsensors.co.uk
Page 20 of 93
OIW-HBO-0002-EX-005
OIW EX SERIES-SIDE STREAM
OPERATION MANUAL R e v . 0 0 4 M A Y 2 0 1 5
2.3.4 – Phase Auto Tuning
Phase Auto Tuning is a process that automatically adjusts the frequency of the ultrasonic system to optimize
performance of the ultrasonic power supply. If Auto Tuning is ENABLED (by an Authorized AS Engineer) then the
optimal ultrasonic frequency will be identified in this stepwise tuning process.
Figure 18: Auto tune menu indicating ‘Enabled Auto Tuning’ function.
When enabled Phase Auto Tuning will occur at the same point prior to the cleaning and homogenization phases in the
cycle but not for every cycle. Auto Tuning will commence in the following circumstances:
When auto tuning is first turned on (by an authorized AS Engineer);
When the measurement cycle is started;
The first Auto Tune Phase after 24:00 hrs;
With temperature changes of ± 5oC (± 41 oF)
When the user presses the SYSTEM TEST button.
Status Display during Auto Tuning Phase:
During this phase ‘AUTO TUNING’ will appear in the status display with a COUNT UP timer to indicate the time taken to
complete the auto tune sequence, rather than counting down the time.
Figure 19: Auto tuning display.
The frequency tuning time will vary based on the frequency range to be swept and the size of the frequency steps taken
– therefore the tuning time is not configurable.
INFORMATION: A comprehensive software overview is covered in Section 3 of this manual.

8 Meadowbank Road, Carrickfergus, BT38 8YF, Northern Ireland www.advancedsensors.co.uk
Page 21 of 93
OIW-HBO-0002-EX-005
OIW EX SERIES-SIDE STREAM
OPERATION MANUAL R e v . 0 0 4 M A Y 2 0 1 5
2.3.5 – Valve Anomalies
If a valve fails to operate or functions incorrectly then a valve anomaly will be reported. Valve anomalies may occur in
either the open or closed state during any phase of the measurement cycle. The table below summarizes the valve state
and phases in which the anomaly may occur.
Reported Valve State: Phases where Anomalies reported:
CLOSED FREQ TUNING
FLOWING
CLEANING
VALVE OPENING
OPEN
HOMGENIZING
SETTLING
MEASURING
FLUSHING
HOLD
VALVE CLOSING
CLOSED & OPEN Any Time
Status Display during a Valve Anomaly:
In the event of a valve anomaly the status display will display an anomaly message as shown below:
Figure 20: Valve anomaly display.

8 Meadowbank Road, Carrickfergus, BT38 8YF, Northern Ireland www.advancedsensors.co.uk
Page 22 of 93
OIW-HBO-0002-EX-005
OIW EX SERIES-SIDE STREAM
OPERATION MANUAL R e v . 0 0 4 M A Y 2 0 1 5
SECTION 3 - OVERVIEW OF SOFTWARE OPERATION
3.1 – THE OIW-EX SERIES BASIC OPERATING FUNCTIONS The OIW-EX Series of analyzers runs on a standard MS Windows user Operating System (OS). This manual assumes that
the user has a basic competence in using MS Windows OS. In everyday use the system requires minimal access to MS
Windows as it is primarily used to gain access to the data logs stored on the hard drive.
INFORMATION: This Operation Manual provides operational instructions for basic users only. Advanced functionality will therefore be restricted to authorized personnel only.
3.1.1 – Starting the OIW-EX Series
Once installation is complete the system is ready to be turned on. The power up sequence takes approximately 3
minutes. During this time a variety of system level message are displayed on the screen – no user action is required.
The Windows OS starting message will appear followed by the Advanced Sensors OIW-SA software start-up window as
shown below:
Figure 21: OIW Software initialisation message
When the OIW software starts it will automatically detect the hardware configuration and will indicate the model type in
the title bar of the window, as shown below:
Title bar for the OIW-EX-100
Figure 22: Title bar for the OIW-EX-1000

8 Meadowbank Road, Carrickfergus, BT38 8YF, Northern Ireland www.advancedsensors.co.uk
Page 23 of 93
OIW-HBO-0002-EX-005
OIW EX SERIES-SIDE STREAM
OPERATION MANUAL R e v . 0 0 4 M A Y 2 0 1 5
3.1.2 – MS Windows Functions of the OIW Software
The OIW-EX software retains some familiar functions associated with MS Windows. The ‘title bar’ (horizontal bar across
the top of a window) is equipped with the same buttons and corresponding functionality as all MS Windows
applications, as shown in the table below:
Button: Function:
Minimise the current window.
Reduce the current window size.
Maximise the current window.
Close or exit the current window.
At start up the software opens in full screen mode although during the routine power up sequence some screens will
appear rotated by 90o. Routine operation can only be performed with the software in full screen mode however the
window can be minimised when additional tasks, such as backing up data log files, are performed. The software will
continue routine operation when in the minimised state.
Once the measurement cycle has been started the Windows buttons are hidden to prevent accidentally minimising or
exiting the software. The top figure (a.) below shows when the cycle is stopped the buttons are present. The lower
figure (b.) shows when the cycle is running the buttons are no longer visible.
Cycle stopped-buttons visible
Cycle running-buttons hidden
CAUTION: During routine operation no general requirement exists to exit the software, except during routine maintenance by authorised personal.
b.
a.

8 Meadowbank Road, Carrickfergus, BT38 8YF, Northern Ireland www.advancedsensors.co.uk
Page 24 of 93
OIW-HBO-0002-EX-005
OIW EX SERIES-SIDE STREAM
OPERATION MANUAL R e v . 0 0 4 M A Y 2 0 1 5
3.1.3 – Starting and Stopping the Measurement Cycle
At power up the green and white ‘Start’ button, shown below, will appear in the bottom right corner of the
‘Configuration Options’ Display area. System start / stop functions are accessible to all users and no login required.
Once the ‘Start’ button has been pressed, the system measurement cycle will begin and the button then changes to a
red and white ‘Stop’ button, shown below.
Conversely, selecting the ‘Stop’ button will end the current measurement cycle and the system will return to the idle
state and indicate ‘Cycle Stopped’ in the ‘Feedback Display’ area.
NOTE: During routine operation the status display text will be BLACK, however when the system has been manually stopped the text will flash red and white alternately.
3.1.4 - Exiting the OIW Software
Exiting the software is password protected to avoid accidental and/or unauthorised shutdown of the analyzer.
To exit the OIW software, stop the measurement cycle, the Windows buttons will reappear, and click the . A warning
box will open on screen, as shown below, prompting the user to enter an administrator password and confirm the
shutdown.
Figure 23: Exit confirmation prompt
Exiting the software, as described above, is a logged event to ensure user traceability therefore a system log is
generated for every shutdown event. Entering a correct password will generate a successful, or normal, shutdown log.
Entering an incorrect password 3 times will generate a system log alarm to indicate, and highlight, a failed exit attempt.
Additional information about ‘System Logs’ can be found in Section 3.2.1.5 – Alarm Indicators. Additionally the OIW
analyzer has been designed to withstand an immediate shutdown, i.e. power failure or emergency shutdown; restart
options are detailed in Section 3.2.3.1.1 - System Settings.
CAUTION: During routine operation no general requirement exists to exit the software, except during routine maintenance by authorised personal. Should the analyzer become damaged or any problems with routine operation arise, power down the system at the main power isolation point and contact Advanced Sensors Ltd or authorized Agent immediately.

8 Meadowbank Road, Carrickfergus, BT38 8YF, Northern Ireland www.advancedsensors.co.uk
Page 25 of 93
OIW-HBO-0002-EX-005
OIW EX SERIES-SIDE STREAM
OPERATION MANUAL R e v . 0 0 4 M A Y 2 0 1 5
3.2 – MAIN SOFTWARE WINDOW All of the OIW Series of analyzers use common software for simplicity and ease of use. The following sections will
provide a detailed overview of the software’s functionality. The main screen, Figure 24 below, has 3 main information
display panels:
1. Upper Panel: Feedback display
2. Middle Panel: Graphical display – Reading or spectral data (EX-1000 Models ONLY)
3. Lower Panel: Multifunction display for Configuration Options (with login), Overview & additional Graphical display
Figure 24: OIW EX Software main display* (*Please note this screen image is from an EX-1000 and is for illustrative purposes only in this instance)
NOTE: To change any of the configurable options, or display options, user login is required. For any changes to take effect the user must log out. For some changes to take effect restarting the software may be required.

8 Meadowbank Road, Carrickfergus, BT38 8YF, Northern Ireland www.advancedsensors.co.uk
Page 26 of 93
OIW-HBO-0002-EX-005
OIW EX SERIES-SIDE STREAM
OPERATION MANUAL R e v . 0 0 4 M A Y 2 0 1 5
Users can change the graphical displays in the middle and lower panels to display required or preferred information.
Available options vary with model type. The graphical display options available for the EX systems are as follows:
For EX-100 Models:
The EX-100 Graphical Displays, upper and lower, will only display measurement results for a given period of time. The
Reading Value and Time scales can be adjusted to display the same or different ranges for each graphical display. The
additional drop down menu, as shown in Figure 25 below, will only allow the user to select the ‘Reading Graph’ option as
the display type. Display options for the upper (middle panel) and lower (lower panel) graphical display can be found in
the ‘Graph Menu’ options.
For additional information about the ‘Graph Menu’ options and configurations see Section 3.2.2 – Graphical Display
Areas.
Figure 25: Graphical display options for the EX-100

8 Meadowbank Road, Carrickfergus, BT38 8YF, Northern Ireland www.advancedsensors.co.uk
Page 27 of 93
OIW-HBO-0002-EX-005
OIW EX SERIES-SIDE STREAM
OPERATION MANUAL R e v . 0 0 4 M A Y 2 0 1 5
For EX-1000 Models:
The graphical displays (upper and lower) for the EX-1000 have the same basic ‘Graph Menu’ functions as the EX-100.
However, in the EX-1000 both upper and lower graphs have an additional drop down selection menu which allows the
user to select ‘Reading Graph’ or the ‘Spec Graph’ to display reading values or spectral data respectively. Figure 26
below is a graphical display showing a ‘Reading Graph’ (upper graph) and a ‘Spec Graph’ (lower graph). These displays
can show reading data, spectral data or both depending on the user’s requirements.
For additional information about the ‘Graph Menu’ options and configurations see Section 3.2.2 – Graphical Display
Areas.
Figure 26: Graphical display options for the EX-1000
INFORMATION: Additional Spectrometer information is available in the Spectrometer Handbook OIW-HBO-005-EX-003.

8 Meadowbank Road, Carrickfergus, BT38 8YF, Northern Ireland www.advancedsensors.co.uk
Page 28 of 93
OIW-HBO-0002-EX-005
OIW EX SERIES-SIDE STREAM
OPERATION MANUAL R e v . 0 0 4 M A Y 2 0 1 5
3.2.1 – Upper Panel: Feedback Display
The Feedback Display provides the user with system information. The function of this area is to clearly and simply
display the measurement reading, system status and alarm indicators for users. The following section will outline the
purpose and functional information of each component making up this display area. Figure 27 below denotes each
component covered in this section.
Figure 27: Feedback Display Area. 1. Measurement Reading, 2. System Status, 3. System Data, 4. Reading Menu 5. Alarm Indicators,
6. Measurement Average 3.2.1.1 – Measurement Reading Area
This blue window displays the measurement reading value. The reading value will normally be displayed as black text
during routine operation. If the measurement value exceeds the upper calibration limit the reading will turn red and
display the fixed value of the upper limit. The numerical display will be to 2 decimal places for readings below 10, to 1
decimal place for readings between 10 and 100 and whole numbers only for readings above 100 to the upper limit.
3.2.1.2 – Status Display
Below the ‘Measurement Reading’ area, the ‘Status Display’ indicates system information, such as the current
measurement cycle and respective time counter. Cycle phases, as described in Section 2.2 – Overview of Measurement
Cycle, for the EX systems include: Stopped, Valve Opening, Flowing, Cleaning, Valve Closing, Measuring and Auto-Tune.
NOTE: During routine operation the status display text will be BLACK, however when the system has been manually stopped the text will flash RED and WHITE alternately.

8 Meadowbank Road, Carrickfergus, BT38 8YF, Northern Ireland www.advancedsensors.co.uk
Page 29 of 93
OIW-HBO-0002-EX-005
OIW EX SERIES-SIDE STREAM
OPERATION MANUAL R e v . 0 0 4 M A Y 2 0 1 5
3.2.1.3 – System Information Display
Values displayed in this area are for quick reference and include measurement unit, Flu values, process temperature and
current time. Measurement units, Flu values and current time are fixed values and not configurable. Temperature units
can be configured as described below.
NOTE: To change any of the configurable options, or display options, user login is required. For any changes to take effect the user must log out. For some changes to take effect restarting the software may be required.
Measurement units can only be changed from the Configuration Options panel by an authorized Advanced Sensors
Representative or Engineer. Units are one of the measurement parameters associated with the Oil Type File (calibration
file) for a given oil type.
The temperature can be displayed in units of degrees Centigrade (oC) or degrees Fahrenheit (oF) and can be changed
from the General Configuration Options panel. From the ‘General’ menu select the ‘System Settings’ tab and under
‘Temperature Units’ select oC or oF.
Fixed values for Flu, process temperature and time are displayed for quick reference purposes only. The system time is
set in accordance with the MS Windows OS. The time is also located in this area to provide accurate time information
when samples are taken.
3.2.1.4 – Reading Menu
Display options for the Feedback Display area are accessed when right clicking within the Measurement Reading area (if
using a mouse) or by selecting the grey menu button beside the measurement alarm as shown in Figure 28 below.
Figure 28: Reading Menu options.
The Reading Menu allows the user to add a note or text identifier to the system log for reference. The user can also
select to display, or leave blank, the Average Readings box (further described in Section 3.2.1.6). Finally panels can be
selected in which to display the different alarm lists.

8 Meadowbank Road, Carrickfergus, BT38 8YF, Northern Ireland www.advancedsensors.co.uk
Page 30 of 93
OIW-HBO-0002-EX-005
OIW EX SERIES-SIDE STREAM
OPERATION MANUAL R e v . 0 0 4 M A Y 2 0 1 5
3.2.1.5 – System Logs and Alarm Indicators
Multifunctional log and alarm buttons are located below the ‘System Data’ Display with each button representing an
alarm type. When no logs or alarms are present the buttons are green but when a log and/or alarm is triggered the
corresponding button changes to red. Information can be viewed ‘at a glance’ by scrolling over the log and/or alarm
button and the list will appear temporarily in the upper graphical display area ONLY while the cursor is hovering over the
respective button. Selecting an active button will open the respective list in the graphical display (see Section 3.2.1.4 –
Reading Menu Options to select the upper or lower graphic panel for display) and is exited by clicking the red X. An
example of the highlighted log and alarm buttons, listing and delete dialogue are in Figure 29 below. All system logs
and alarms generated are recorded in the system log file for traceability.
Figure 29: Alarm buttons, listing and delete box*.
*Example for illustration only, actual screen may vary with alarm type. The list displays the status, log, severity and acknowledgment listing for each alarm raised, as below in Figure 30. Each
log is accompanied with a time stamp recording the status - when it was raised and then acknowledged. The complete
time and date is displayed when users hover the mouse over a given time in the ‘Raised’ or ‘Ack’ed’ columns.
Figure 30: Alarm list example.

8 Meadowbank Road, Carrickfergus, BT38 8YF, Northern Ireland www.advancedsensors.co.uk
Page 31 of 93
OIW-HBO-0002-EX-005
OIW EX SERIES-SIDE STREAM
OPERATION MANUAL R e v . 0 0 4 M A Y 2 0 1 5
The status indicates if a log or alarm is ‘Raised’, ‘Acknowledged (Ack’ed)’ or ‘Cleared’. ‘Raised’ indicates the system has
raised a log or alarm and no action has been taken. An ‘Ack’ed’ status indicates the user has checked or selected the log
or alarm for more information and the status box will change to amber. Finally ‘Cleared’ indicates the user has cleared
the log or alarm and the status box changes to green. To delete a selection or all logs or alarms right click in the alarm
list and a delete dialogue box will open to confirm the action. Figure 31 shows an example list of alarms, with
descriptive logs in each of the 3 status settings, and the ‘Delete’ system logs confirmation dialogue.
Figure 31: Status indicators and delete options for alarms.
The ‘Log’ column displays information about the log or alarm. See Section 4 – System Logs and Troubleshooting for
additional information.
Next is a ‘Severity’ column, which categorizes logs or alarms into ‘Info’, ‘Minor’, ‘Major’ and ‘Critical’. Information logs,
‘Info’, indicate a log for information only and the alarm button will remain green with ‘Unread Logs’. For alarm logs that
are categorized as ‘Minor’, ‘Major’ or ‘Critical’ the alarm button will change to red. See Section 4.1 – List of System Log
Messages and User Actions for further information.
The OIW-EX series generates three types of alarms:
1. Measurement Alarms: where specified measurement thresholds are exceeded;
2. System Logs: generated as a result of system events during routine operation; and
3. WS (Water Status) Alarms2: alert the user to any spectrometry readings that fall out of the configured range.
To configure both measurement alarms and system logs see Section 3.2.3.3 – Alarms Configuration Menu. WS alarms
are configured under the ‘Oil Type’ menu as described in Section 3.2.3.5.5. – Spec Mask Settings.
3.2.1.6 – Measurement Average Display
This section of the Feedback Display Area is an optional display to provide the user with a comparative daily average. A
cumulative daily average is calculated for the current (today) and previous (yesterday) days, displayed as in Figure 32
below. Additional information to add or remove this from the display area is in Section 3.2.1.4 – Reading Menu.
Figure 32: Measurement average display area.
2 Applicable to EX-1000 systems only.

8 Meadowbank Road, Carrickfergus, BT38 8YF, Northern Ireland www.advancedsensors.co.uk
Page 32 of 93
OIW-HBO-0002-EX-005
OIW EX SERIES-SIDE STREAM
OPERATION MANUAL R e v . 0 0 4 M A Y 2 0 1 5
3.2.2 – Middle (and Lower) Panel: Graphical Display
The EX Series software has 2 graphical display areas for measurements: the main upper (in the middle display panel)
and a secondary lower (in the bottom display panel). Available configurations vary with model and are described below.
NOTE: When using a keyboard F2 and F3 keys can be used to toggle between displayed graph types, where F2 applies to the middle panel (upper) graph and F3 applies to the lower panel. Additionally F5, F6 and F7 will open PPM, Logs and WS alarm lists respectively in the upper graphical display.
For EX-100 Models:
Display options for the upper and lower graphical display are accessed when right clicking within the graph area (if
using a mouse) or by selecting the grey menu button below the graph as shown in Figure 33 below. The ‘Graph Menu’
options for the EX-100 allow the user to set values for the reading scale, time intervals, track measurement history
and/or set reference guide lines at specified reading values.
The reading scale for a given value range is selected from the drop down menu (dependent on measurement unit).
The time scale can display values for intervals of 9 minutes, 1.5 hours, 6 hours or 24 hours. Time scale values can be set
independently for the upper and lower graphs; meaning each can display measurements for 2 different time intervals.
Selecting the ‘History’ option will display the previous results, for the same time interval, as a watermark line.
Ticking the Guides box will open two scroll boxes for the user to define the values for upper and lower guide lines to
display on the graph for reference.
Figure 33: Graphical display area for the SA100
Display options for the lower graph include the same ‘Graph Menu’ options as listed above. The Reading Value and Time
scales can be adjusted to display different ranges than those selected for the upper display. The additional drop down
menu, as shown in Figure 33 above, will only allow the user to select the ‘Reading Graph’ option as the display type.

8 Meadowbank Road, Carrickfergus, BT38 8YF, Northern Ireland www.advancedsensors.co.uk
Page 33 of 93
OIW-HBO-0002-EX-005
OIW EX SERIES-SIDE STREAM
OPERATION MANUAL R e v . 0 0 4 M A Y 2 0 1 5
For EX-1000 Models:
Both graphical displays for the EX-1000 have the same basic ‘Graph Menu’ functions as the EX-100. Both graphs,
however, have an additional drop down list which allows the user to select a ‘Reading Graph’ and/or a ‘Spec Graph’ to
display reading values or spectral data respectively. Figure 34 below is a graphical display showing a ‘Reading Graph’ in
the upper graphical display and a ‘Spec Graph’ in the lower display. These displays can show either reading or spectral
data or both depending on the users requirements.
Figure 34: Graphical display for the EX-1000*.
*Example for illustration only actual screen may vary with alarm type.
When the ‘Spec Graph’ is selected for display, graph information is displayed to the right which includes the time and
date of the displayed sample, the active oil type, spectra scaled to mask, a ‘Take Spectra’ button and a grey menu
button, like those from previous displays, to bring up the ‘Spectra Graph Menu’.
Selecting the ‘Take Spectra’ button will display a spectral graph of the current active water line. The time, date and
active oil type for the spectra taken is then displayed.

8 Meadowbank Road, Carrickfergus, BT38 8YF, Northern Ireland www.advancedsensors.co.uk
Page 34 of 93
OIW-HBO-0002-EX-005
OIW EX SERIES-SIDE STREAM
OPERATION MANUAL R e v . 0 0 4 M A Y 2 0 1 5
Select the grey menu button, or right click anywhere in the graphical display area, to open the ‘Spectra Graph Menu’
shown in Figure 35.
Figure 35: Spectra Graph Menu.
The various ‘Spectra Graph Menu’ options are expanded in Figure 36 for reference. From this menu the user can select:
1. ‘Displaying Spectra’, the first drop down list, to display the last 10 spectra.
2. ‘Scale Spectra to Mask’ the user can select a mask for the current spectra.
3. Ticking the ‘Show Delta to Mask’ box enables the user to view the difference, or delta, between the current
displayed spectra and the selected mask. The numerical up / down arrows allow the user to set an
amplification factor or delta scaling value (minimum value of 1 & maximum value of 99).
4. Selecting this expansion arrow will open a list of masks available for the loaded oil type. Tick the box to enable
the required mask.
Figure 36: Spectra Graph menu options.

8 Meadowbank Road, Carrickfergus, BT38 8YF, Northern Ireland www.advancedsensors.co.uk
Page 35 of 93
OIW-HBO-0002-EX-005
OIW EX SERIES-SIDE STREAM
OPERATION MANUAL R e v . 0 0 4 M A Y 2 0 1 5
3.2.3 – Lower Panel: Configuration Options, Login, Overview and Graphical Displays
From this panel the user can view and configure the various system parameters, login/logout of the system, view the
configuration settings or display an additional graph. Users can toggle between each panel display using the F3 button.
A. Config Options & Login/Logout. B. Overview settings. C. Graphical display.
Figure 37: Screen options for the lower panel of the EX Series. Use F3 to toggle between each screen.
NOTE: If an incorrect password is entered more than 3 times then a log will be written to the system log file and (if enabled) an alarm will be raised.
INFORMATION: After changes are made if the unit is powered down or the software shut down all changes will be lost unless the ‘Save Changes & Logout’ button has been selected.
INFORMATION: The user must be logged on to the system in order to make any changes to the configurations and must log out to save the changes.
3.2.3.1 – Configuration Options Panel
To enable configuration of the system parameters the user must first login. The following configuration panel buttons,
each opens a menu of options subdivided under individual tabs, are available for user configuration:
1. General 2. Schedule 3. Alarms 4. Ultrasonics
5. Oil Type 6. Ext. Input & Output 7. System Test
Login/Logout Function:
The left side ‘Configuration Options’ display area in Figure 38 below shows the ‘Login’ prompt for password entry. Once
the user has entered a valid password and successfully logged in, the ‘Login’ box will change to the ‘Save Changes &
Logout’ button, as shown in b on the right side of Figure 38 below. Any configuration changes made will take effect
immediately allowing the user to preview the new configurations. However, the ‘Save Changes & Logout’ button must
be selected for the new configuration(s) to be permanently applied. Otherwise the system will, by default, automatically
logout after 60 minutes saving any changes.
Figure 38: a. Logged OUT and b. Logged IN screens.
a. b.

8 Meadowbank Road, Carrickfergus, BT38 8YF, Northern Ireland www.advancedsensors.co.uk
Page 36 of 93
OIW-HBO-0002-EX-005
OIW EX SERIES-SIDE STREAM
OPERATION MANUAL R e v . 0 0 4 M A Y 2 0 1 5
The following sections will provide information for each button and the functions available to the user for configuration.
3.2.3.1.1 – General Configuration Options Menu
Within this menu are 5 sub menus delineated by individual tabs where the user can access a variety of generic system
functions as shown below in Figure 39. The available options for each of the 5 sub menus will be described in the
following sections.
Figure 39: Tabs for each sub menu in ‘General Configuration’.
INFORMATION: The user must be logged on to the system in order to make any changes to the configurations and must log out to save the changes.
3.2.3.1.1.1 – System Settings
From this menu, in Figure 40, the user can configure basic settings for the routine operation of the analyzer.
Figure 40: System settings menu options.
INFORMATION: The current user is identified by a ‘Current User Logged in: #’ number or ‘View mode only – nobody logged in’ displayed at the bottom of each dialog box.
Temperature Units: temperature units can be displayed in either degrees Celsius (oC) or degrees Fahrenheit (oF). All
instances of temperature will then be displayed for the selected unit.

8 Meadowbank Road, Carrickfergus, BT38 8YF, Northern Ireland www.advancedsensors.co.uk
Page 37 of 93
OIW-HBO-0002-EX-005
OIW EX SERIES-SIDE STREAM
OPERATION MANUAL R e v . 0 0 4 M A Y 2 0 1 5
Custom Tag: this editable field allows users to input a tag number, unit identifier or reference label up to 16 characters
long. This is then displayed under the Advanced Sensors corporate logo in the ‘Configuration Settings’ display area as
circled in the figure below.
Figure 41: Identifying the configuration and display locations of custom tags.
Enable MRM Access: tick to enable when a remote manager in use. When enabled system will send data to the Master
Remote Manager. Disable when an MRM is not in use.
Enable On Screen Keyboard: tick to enable and an on screen keyboard, as below in Figure 42, will open when any
editable field is selected. This will allow the user to input information on the touch screen without an external keyboard.
Deselect when not required.
Figure 42: On screen keyboard, Shift or Caps to toggle between.

8 Meadowbank Road, Carrickfergus, BT38 8YF, Northern Ireland www.advancedsensors.co.uk
Page 38 of 93
OIW-HBO-0002-EX-005
OIW EX SERIES-SIDE STREAM
OPERATION MANUAL R e v . 0 0 4 M A Y 2 0 1 5
Display System Logs on Screen: tick to enable and the multifunction ‘System Logs’ button will appear in the ‘Alarm
Indicators’ section of the ‘Feedback Display Area’. The figures below show the system log display enabled and disabled.
Logs will still be recorded in the System Log file for traceability.
Figure 43: a. System logs display ENABLED b. System logs display DISABLED
Cycle State on Power Up: Users have the choice of 3 options when powering up the analyzer:
1. Power Up in Stopped State: Requires the user to start the analyzer to begin the measurement cycle.
2. Power Up in Started State: The analyzer will start the measurement cycle automatically. A warning message
will open to alert the user that damage could occur if no water is present in the measurement chamber.
3. Power Up in Last Cycle State: The analyzer will power up in the previous operational state; i.e. will
automatically start if a measurement cycle was running prior to the power removal or will start up in a stopped
state if not previously running in a measurement cycle. A warning message will open to alert the user that
damage could occur if no water is present in the measurement chamber.
Auto Save and Logout Options: The system, by default, will remain logged in and idle for up to 1 hour. After 1 hour
the system will automatically save the current configurations and log the user out. An additional option allows the user
to extend the login period for 6 hours if required. The default option is fixed at 1 hour and will revert back to this default
after each logout.

8 Meadowbank Road, Carrickfergus, BT38 8YF, Northern Ireland www.advancedsensors.co.uk
Page 39 of 93
OIW-HBO-0002-EX-005
OIW EX SERIES-SIDE STREAM
OPERATION MANUAL R e v . 0 0 4 M A Y 2 0 1 5
3.2.3.1.1.2 – Water Line Options
The ‘Water line’ refers simply to the process line currently being analyzed. The OIW analyzer has the capacity to analyze
multiple process water lines; in this case each ‘Water Line’ will be numbered and have unique configuration settings
optimized for the oil type being analyzed.
From the Water Line Options menu users can configure averaging time, valve status and trending for a given waterline.
Multiple waterlines, if present, can also be adjusted individually.
The measurement reading by default is not averaged and is normally displayed second by second. From this menu, in
Figure 44, the user can adjust the averaging display time, in seconds, for reading measurements. This will avoid the
appearance of continual fluctuations in the measurement reading display.
Figure 44: Water Line Options menu.
NOTE: Averaging only affects the reading on screen and on the 4-20 mA line, but does not affect the reading sent to the data log file and does not alter the Flu reading on the system display area or within the file.
Flow valves are typically fitted as standard to control the process water flow through the chamber assembly enabling
sample isolation for analysis. Selecting the ‘Valve Present’ box indicates that a flow valve is in use. If the valve is not in
use (deselecting ‘Valve Present’), users can select to ‘Keep Valve Open’, where an electrical signal is sent to maintain the
valve in an open state. However once the measurement cycle is started the valve will close and proceed as normal.
Trending options for measurement data, when enabled, include a trend line connecting data points on the graphical
display and trend compensation. Figure 45 shows when the ‘Trending Enabled’ box is selected the trend line connecting
each measurement data point is displayed on the graph. Once ‘Trending Enabled’ is selected the trend compensation
option becomes available.

8 Meadowbank Road, Carrickfergus, BT38 8YF, Northern Ireland www.advancedsensors.co.uk
Page 40 of 93
OIW-HBO-0002-EX-005
OIW EX SERIES-SIDE STREAM
OPERATION MANUAL R e v . 0 0 4 M A Y 2 0 1 5
Figure 45: Trend line on measurement graph when ‘Trending Enabled’ selected. Trend compensation accounts for variations in oil droplet size. A compensation calculation, obtained during a
scheduled measurement, is applied to measurements in the next flowing phase. During a scheduled measurement, in
the ‘Measurement Phase’ of the cycle, readings are taken after a short settling period following ultrasonic
homogenisation. The readings taken during this phase are averaged to display a ‘true’ reading in the sample chamber.
From this reading a corrective factor is calculated then applied to the next flowing phase measurements. To enable this
feature tick ‘Trend Compensation’ from the ‘Graph Menu’ as shown in Figure 46.
Figure 46: Trend compensation enabled with corresponding graphical display.

8 Meadowbank Road, Carrickfergus, BT38 8YF, Northern Ireland www.advancedsensors.co.uk
Page 41 of 93
OIW-HBO-0002-EX-005
OIW EX SERIES-SIDE STREAM
OPERATION MANUAL R e v . 0 0 4 M A Y 2 0 1 5
3.2.3.1.1.3 – Custom Logs
By default the system logs are generated which registers all activity on the system and automatically saves information
as comma separated value file (.csv file) on the hard drive. In addition to this log file, users can also select customized
log files which contain only information of interest, Figure 47 below. Custom log files are disabled by default as they
require additional disk space therefore must be specifically enabled by users. Users must select the ‘Enable Custom Log
Files’ box to enable this feature. Then the user can select to record the configuration data at the start of the file and
choose data options of interest. Custom logs can be saved as 1 file, saved at midnight, or 2 files, saved at midnight and
noon, each day as the user requires. This allows users to open data log files in third party programs that may have a
limit on the number of lines they can handle.
Figure 47: Custom logs menu.
INFORMATION: The number of data options selected will determine the log file size.

8 Meadowbank Road, Carrickfergus, BT38 8YF, Northern Ireland www.advancedsensors.co.uk
Page 42 of 93
OIW-HBO-0002-EX-005
OIW EX SERIES-SIDE STREAM
OPERATION MANUAL R e v . 0 0 4 M A Y 2 0 1 5
3.2.3.1.1.4 – Passwords
A password is required to make any configuration changes to the system and shutdown. Passwords for up to 7 users
can be created in the ‘Passwords’ menu shown below in Figure 48. A password must be a minimum of 4 characters in
length up to 9 characters. Characters can be any combination of letters, numbers or symbols. Two levels of user
access, selected from the drop down list, are available: Standard or Full. Standard access disables the change password
function and prevents editing of the ultrasonic settings and calibration parameters. Full access provides full
administrative and configuration access. Once the password parameters have been entered, select the ‘Save New
Password’ button and the information will be saved for the given user number. Passwords will be set up at
commissioning or by Advanced Sensors Personnel.
Figure 48: Password set up menu.
NOTE: If an incorrect password is entered more than 3 times then a log will be written to the system log file and (if enabled) an alarm will be raised.
3.2.3.1.1.5 – Help
The OIW Help feature can be enabled or disabled by selecting the ‘Show Help’ button in the ‘Help’ menu shown in Figure
49 below (left side image). Using the F10 key will also toggle the ‘Help’ on and off. When the cursor is held over a menu
option as shown in Figure 49 below (right side image) the help feature will provide basic information about available
features.
Figure 49: Help menu.

8 Meadowbank Road, Carrickfergus, BT38 8YF, Northern Ireland www.advancedsensors.co.uk
Page 43 of 93
OIW-HBO-0002-EX-005
OIW EX SERIES-SIDE STREAM
OPERATION MANUAL R e v . 0 0 4 M A Y 2 0 1 5
3.2.3.1.2 – Schedule Configuration Options Menu
A configurable schedule menu enables cycle phases to be configured for set periods of time. Each phase should be
optimized for user requirements to suit the specific process and oil type. The times are set using the up/down arrows
of the numerical lists shown in Figure 50 below. It is recommended that once ‘Cleaning’ and ‘Homogenizing’ have been
optimized for the specific process that these settings will not require adjustment.
Figure 50: Schedule configuration menu.
CAUTION: Adjustments to the ultrasonic system (for cleaning and homogenization) shall only be performed by Advanced Sensors trained or authorized personnel only. Excessive application of power to the ultrasonic system may over time result in etching the measurement window and reduce the expected working life of the transducer.
INFORMATION: ‘Flowing’ & ‘Measuring’ can be set to a maximum of 23 hours 59 minutes and 59 seconds. ‘Cleaning’ and ‘Homogenizing’ cannot be set to exceed 3 minutes and 55 seconds. ‘Settling’ cannot be set to exceed 59 minutes and 59 seconds.
The configured phase times are displayed in the left side panel of the ‘Configurations Display Area’ within the ‘Measure
Cycle’ box shown below in Figure 51.
Figure 51: Measurement Cycle quick reference window in the Configuration Display.

8 Meadowbank Road, Carrickfergus, BT38 8YF, Northern Ireland www.advancedsensors.co.uk
Page 44 of 93
OIW-HBO-0002-EX-005
OIW EX SERIES-SIDE STREAM
OPERATION MANUAL R e v . 0 0 4 M A Y 2 0 1 5
For EX-1000 Models:
Units that are equipped with Spectrometers will have an additional Schedule tab option available. The ‘Spectrometer’
menu allows the user to save the spectral data at configurable intervals. The user can select between 0 and 300
measurement cycles and the spectral data will be saved at the start of the selected measurement cycle interval.
Figure 52: Spectrometer menu.

8 Meadowbank Road, Carrickfergus, BT38 8YF, Northern Ireland www.advancedsensors.co.uk
Page 45 of 93
OIW-HBO-0002-EX-005
OIW EX SERIES-SIDE STREAM
OPERATION MANUAL R e v . 0 0 4 M A Y 2 0 1 5
3.2.3.1.3 – Alarms Configuration Menu
INFORMATION: See electrical diagram for alarm hardware configuration.
The following sections provide information about the software configuration of system alarms. Please consult the
analyzer wiring diagram for additional details about the alarm hardware configuration.
Configurable alarms allow the user to set lower and upper measurement threshold alarms, allocate alarm limits to relays
and configure alarm timings. All alarms are recorded in the system logs for complete traceability. The following
sections will provide a functional overview of the Alarm Configuration menus. For additional system log information see
Section 4 – System Logs and Troubleshooting p. 61.
The OIW analyzer has 2 configurable alarm types:
1. Measurement alarms (for the selected unit of measurement) and 2. System alarms.
3.2.3.1.3.1 – Measurement Alarms
INFORMATION: Measurement alarms correspond to the user defined measurement unit. Therefore measurement alarms will be displayed in ppm, ppb, % or mg/l units according to user configuration.
Measurement alarms provide the user with warnings to indicate measurement values have exceeded either the upper or
lower set threshold limits. Figure 53 below of the ‘Measurement Alarms’ menu shows the menu options and the ‘Alarm
Settings’ box in the ‘Configurations Setting’ display area. Measurement alarm configuration options (when enabled or
disabled) are displayed in the ‘Configurations Setting’ display area for quick reference.
Figure 53: Measurement Alarms configuration menu and configuration settings display area.
*Example for illustration only actual screen may vary with alarm type.
The ‘Enable Alarm Threshold 1’ box must be ticked to enable and edit this feature. If a second limit is required then the
‘Enable Alarm Threshold 2’ box can be selected (note: ‘Enable Alarm Threshold 1’ must be enabled first before the second
alarm threshold can be selected). Limits are set using the numerical up / down arrows in the threshold box and
displayed in the ‘Configurations Setting’ display area as shown above in Figure 53. Relays can be allocated to trigger
when alarm threshold 1 is crossed. The user can select a relay, all or none from the drop down list at the bottom of the
menu. The dry contact relay can, for example, activate an audible alarm in the control room, open/close a valve to
reroute the process flow or any other user requirement (set up at the time of installation) to indicate an alarm status.

8 Meadowbank Road, Carrickfergus, BT38 8YF, Northern Ireland www.advancedsensors.co.uk
Page 46 of 93
OIW-HBO-0002-EX-005
OIW EX SERIES-SIDE STREAM
OPERATION MANUAL R e v . 0 0 4 M A Y 2 0 1 5
If an alarm threshold is crossed the user can configure a time limit, ‘Alarm Persistence’, before an alarm is raised to
compensate for temporary out of threshold variations in measurement values. The measured value must then exceed
the thresholds for the specified time before an alarm is raised. In Figure 53 , the ‘Alarm Persistence’ time is selected
using the numerical up / down arrows, to a maximum time of 120 seconds. The selected persistence time is then
displayed in the ‘Configurations Setting’ display area as shown in Figure 53 on page 45. A pending alarm message, in
yellow, will be displayed on screen, as well as the alarm panel, during the persistence period until the time is exceeded
when an alarm is issued, shown in Figure 54. Otherwise if the measurement returns to within the threshold range
during the persistence time no alarm is issued.
Figure 54: Alarm pending warning with the alarm panel open.
An alarm clearing feature can be configured if required. The ‘Clearing Persistence’ time is the length of time an alarm is
active before being automatically cleared. Select the ‘Enable Alarm Clearing’ box to enable this feature and set the
‘Lower Alarm Clearing Threshold’ using the numerical up / down arrows (Figure 55 below). This clearing feature occurs
at user configured time intervals, or the ‘Clearing Persistence’ time, selected using the numerical up / down arrows, to a
maximum time of 23 hours and 59 seconds.
Figure 55: Enable alarm clearing.
CAUTION: Enable ‘Alarm Clearing’ with caution. When ‘Alarm Clearing’ is enabled alarms may clear without alerting the user.

8 Meadowbank Road, Carrickfergus, BT38 8YF, Northern Ireland www.advancedsensors.co.uk
Page 47 of 93
OIW-HBO-0002-EX-005
OIW EX SERIES-SIDE STREAM
OPERATION MANUAL R e v . 0 0 4 M A Y 2 0 1 5
3.2.3.1.3.2 – System Alarm Settings
System alarms provide the user with warnings or information regarding system activity, errors or faults. From the
‘System Alarms’ menu the user can assign valve open/close timings to trigger an alarm; a specific relay, all relays or no
relay to trigger when system log alarms are raised and/or when the system cycle is stopped. The relay options are
available from a drop down selection menu as shown below in Figure 56. These settings must be applied individually to
each waterline connected to the analyzer. Otherwise settings will only apply to the current waterline listed at the
bottom of the dialogue box.
Figure 56: System alarms menu.
Time delays can be set for the valve; where a time is allowed for the valve to start moving and another for the valve to
complete the motion. If the valve fails to complete the action within the allotted time an alarm log will be raised in
addition to ‘Valve Anomaly’ reported in the status display.
Once a relay is assigned and a system log alarm is raised, the relay output will close. Only when the system log alarm is
cleared will the relay output return to open. If the same relay is assigned to another alarm type, i.e. measurement alarm,
clearing the primary alarm only will open the output; if the system log alarm is secondary, clearing it will not open the
output. Note that ‘Info’ system log alarms are for information only and will not affect the relay output.
The second available relay option will close the relay output when the measurement cycle is stopped and will only open
the relay when the cycle is started again. As above, if this relay is assigned to another alarm type, then the primary
alarm must be cleared for the relay output to open.

8 Meadowbank Road, Carrickfergus, BT38 8YF, Northern Ireland www.advancedsensors.co.uk
Page 48 of 93
OIW-HBO-0002-EX-005
OIW EX SERIES-SIDE STREAM
OPERATION MANUAL R e v . 0 0 4 M A Y 2 0 1 5
3.2.3.1.4 – Ultrasonics Configuration Menu
NOTE: The information in this section is FOR REFERENCE ONLY. The control and configuration of the ultrasonic unit shall only be undertaken, or supervised, by a trained and authorised Advanced Sensors Ltd Engineer. These settings cannot be accessed by users with Limited or Standard access.
Functions of this menu are view only and can only be modified by an AS authorized Engineer. The following Ultrasonic
menus are for reference only to illustrate menu options, allow the user to view the current ultrasonic configuration and
may be required to assist an Advanced Sensors approved representative with remote diagnosis.
The ‘Ultrasonic Settings’ menu, Figure 57, displays the ‘Cleaning Settings’ for the system. This allows fine-tuning of the
power levels and timings for the ultrasonic’s and should only be configured by authorized Advanced Sensors personnel.
These settings include % power, Pulse Width Modulation (PWM) Period (in ms) and the % PWM Ratio optimized for the
cleaning and homogenizing cycles.
Figure 57: Ultrasonic Settings menu.
The following menu, as shown in Figure 58, lists the optimized cleaning frequencies for set temperature ranges
(increments of 5oC). For every 5oC temperature change the system will automatically adjust the homogenization and
cleaning frequencies to maintain routine operation.
Figure 58: Cleaning temperature auto-tune menu.

8 Meadowbank Road, Carrickfergus, BT38 8YF, Northern Ireland www.advancedsensors.co.uk
Page 49 of 93
OIW-HBO-0002-EX-005
OIW EX SERIES-SIDE STREAM
OPERATION MANUAL R e v . 0 0 4 M A Y 2 0 1 5
The remaining menu option is ‘Auto Tuning’, Figure 59. Auto tuning, as previously described in Section 2.3.4 — Phase
Auto Tuning, is a process that will automatically sweep through a defined frequency range to detect the optimal
operating and cleaning frequencies for the local temperature. Auto Tuning will always occur at the same point in the
measurement cycle. Auto tuning must be enabled and configured by an authorized Advanced Sensors Engineer or
Representative.
Figure 59: Auto tuning menu.
CAUTION: Adjustments to the ultrasonic system (for cleaning and homogenization) shall only be performed by Advanced Sensors trained or authorized personnel only. Excessive application of power to the ultrasonic system may over time result in etching the measurement window and reduce the expected working life of the transducer.

8 Meadowbank Road, Carrickfergus, BT38 8YF, Northern Ireland www.advancedsensors.co.uk
Page 50 of 93
OIW-HBO-0002-EX-005
OIW EX SERIES-SIDE STREAM
OPERATION MANUAL R e v . 0 0 4 M A Y 2 0 1 5
3.2.3.1.5 – Oil Type Configuration Menu
The primary measurement of the OIW-EX Series is fluorescence and individual oils will emit a unique fluorescent
characteristic – like a fingerprint. Consequently the OIW-EX system must be calibrated for each type of oil. These
fluorescent characteristics are defined by a series of settings stored on the analyzer hard drive in a calibration folder
with the designation OIWOilTypes. If an oil sample is provided to Advanced Sensors an oil type file can be created and
supplied (electronically or by email) for the given oil which can be stored on the analyzers hard drive in C:\OIWOilTypes;
see Section 5.2 – Accessing Data Log Files on p.71 for additional information. Please contact your local Advanced
Sensors representative for further information.
Each oil type, and in turn each oil type file, is characterised by four main areas of data:
Oil coefficients (fixed values generated by Advanced Sensors Ltd). Temperature coefficients. Gain values (coarse and fine). Offset values.
The following sections will describe the available menu options for EX-100 and EX-1000 systems including instructions
to load an oil type file. At the bottom of each menu will be the ‘Oil Type displayed is’ drop down selection list, ‘Active Oil
Type’ will be displayed, the current waterline (if more than 1 is in use, but typically will display 1) and a close button.
NOTE: The majority of information in this section is FOR REFERENCE ONLY. The control and configuration of oil type settings shall only be undertaken, or supervised, by a trained and authorised Advanced Sensors personnel. These settings cannot be accessed by users with Limited or Standard access.
3.2.3.1.5.1 – Oil Curve
From this menu the user can upload oil type files stored on the analyzer’s hard drive. Multiple oil type files can be
stored on the system, and uploaded, to simplify oil type switching. Oil type files will contain all the calibration
parameters required for the specific oil type being analyzed. The ‘Oil Curve’ menu allows users to load, add or remove oil
type files, displays reference information and the current waterline.
Loading Oil Type Files:
From the ‘Oil Curve’ menu select the ‘Load Oil Type’ button and the Load Oil Type files selection menu will open as
shown below in Figure 60. Select the required Oil Type file from the selection menu followed by the ‘Load’ button to
upload the file.
Figure 60: Load Oil Type files

8 Meadowbank Road, Carrickfergus, BT38 8YF, Northern Ireland www.advancedsensors.co.uk
Page 51 of 93
OIW-HBO-0002-EX-005
OIW EX SERIES-SIDE STREAM
OPERATION MANUAL R e v . 0 0 4 M A Y 2 0 1 5
Once the required file has been uploaded, the coefficients (Set 1, Set 2, Set 3 or Set 4 as applicable), threshold (if
applicable), out of range value and active oil type are displayed in the ‘Oil Curve’ menu screen as shown below in Figure
61. Select the ‘Close’ button to exit this menu then ‘Save Changes & Logout’ to complete the upload process. For quick
reference the selected file name is displayed at the bottom of each ‘Oil Type Configuration’ menu page and in the ‘Active
Oil Type’ box of the ‘Configurations Setting’ display area for quick reference as shown below in Figure 61.
Figure 61: Oil Curve menu display.
The set of coefficients are data read from the oil type file that relate to the calibration curve.
The threshold value defines the calibration curve limit.
The out of range value defines a measurement value where the oil in water content has exceeded the maximum for the
calibrated measurement range.
Adding Oil Type Files
To enable the analysis of variations in the oil, the OIW system allows users to load additional active oil type calibration
files. Similar to loading oil type files, click on the ‘Add Oil type’ button and the Load Oil Type files selection menu will
open as shown in Figure 62. A list of the available oil type files will be displayed from which the user can select
additional files as required.
Figure 62: Add oil type files.

8 Meadowbank Road, Carrickfergus, BT38 8YF, Northern Ireland www.advancedsensors.co.uk
Page 52 of 93
OIW-HBO-0002-EX-005
OIW EX SERIES-SIDE STREAM
OPERATION MANUAL R e v . 0 0 4 M A Y 2 0 1 5
Once a file has been selected the respective calibration information will be displayed and a ‘Set as Active’ button is
available, see Figure 63 below, for the user to select the new oil type file to replace the active file currently in use.
Figure 63: Addition of new oil type files.
If not this newly loaded file will still remain available for future selection from the ‘Oil Type displayed is’ drop down list
as shown in Figure 64 below. Selecting a file will display the settings for the selected file, settings will not be applied
until the ‘Set as Active’ button is selected. From this list the user can switch between active oil type files as required for
analysis of different respective oil types.
Figure 64: Displayed oil type drop down menu.
INFORMATION: The ‘Oil Type displayed is’ drop down list, as shown in figure 49, is located at the bottom of each ‘Oil Type Configuration’ menu page. This list enables the user to switch between active oil type files as required for analysis of different respective oil types.

8 Meadowbank Road, Carrickfergus, BT38 8YF, Northern Ireland www.advancedsensors.co.uk
Page 53 of 93
OIW-HBO-0002-EX-005
OIW EX SERIES-SIDE STREAM
OPERATION MANUAL R e v . 0 0 4 M A Y 2 0 1 5
Removing Oil Type Files
If an oil type file is no longer required for use, or is no longer applicable, it can be removed from the list of loaded oil
types. An oil type file can only be removed once set as active. From the ‘Oil Type displayed is’ drop down menu select
the oil type file to be removed. Select the ‘Set as Active’ button, as in Figure 65 below, noting the ‘Remove Oil Type’
button above it is currently disabled.
Figure 65: Addition of new oil type files.
The ‘Remove Oil Type’ button is only enabled AFTER a file has been set as active as in Figure 66. Selecting this button
will remove the active oil type file from the current list of available files.
Figure 66: Remove Oil Type file.
NOTE: Removing an Oil Type file from the drop down list does not delete it from the OIW system’s hard drive.

8 Meadowbank Road, Carrickfergus, BT38 8YF, Northern Ireland www.advancedsensors.co.uk
Page 54 of 93
OIW-HBO-0002-EX-005
OIW EX SERIES-SIDE STREAM
OPERATION MANUAL R e v . 0 0 4 M A Y 2 0 1 5
3.2.3.1.5.2 – General Oil Settings
For basic user reference the ‘General Oil Settings’ menu displays only the name, if any, given to the oil type file. This
display name will be for the current active oil type or can display the names of any loaded oil type files from the ‘Oil Type
displayed is’ dropdown list. Figure 67 shows the ‘General Oil Settings’ displayed name for an active oil type and for a
displayed oil type. Additional configurable Oil type functions are available from this menu for trained and authorised
Advanced Sensors personnel.
Figure 67: General Settings menu.

8 Meadowbank Road, Carrickfergus, BT38 8YF, Northern Ireland www.advancedsensors.co.uk
Page 55 of 93
OIW-HBO-0002-EX-005
OIW EX SERIES-SIDE STREAM
OPERATION MANUAL R e v . 0 0 4 M A Y 2 0 1 5
3.2.3.1.5.3 – Oil Calibration
The ‘Oil Calibration’ menu displays the gain and offset controls for the oil type file. Gain and offset controls are used to
‘fine tune’ the sensor for calibration to ensure an accurate oil type calibration. The Gain and Offset values are not
typically adjusted after a calibration. The Flu value is the fluorescence value for the given calibration.
The values in the display will be for the current active oil type or can display the values of any loaded oil type files from
the ‘Oil Type displayed is’ dropdown list. Figure 68 shows the ‘Oil Calibration’ displayed for an active oil type and for a
displayed oil type.
Figure 68: Oil Calibration menu

8 Meadowbank Road, Carrickfergus, BT38 8YF, Northern Ireland www.advancedsensors.co.uk
Page 56 of 93
OIW-HBO-0002-EX-005
OIW EX SERIES-SIDE STREAM
OPERATION MANUAL R e v . 0 0 4 M A Y 2 0 1 5
For EX-1000 Systems:
For units equipped with spectrometers, 3 additional menu options are available to configure spectral measurements.
The following section will give a brief overview mainly for information only.
3.2.3.1.5.4 – Spectrometer Settings
The ‘Spectrometer Settings’ menu contains 3 configurable areas: General Settings, Level Trigger Value and Spectrometer
Measurement as shown in Figure 69. The General Settings and Spectrometer Measurement values should be set by an
authorized Advanced Sensors representative.
Figure 69: Spectrometer Settings menu.
The section under ‘General Settings’ displays the Smoothing and Averaging values for the active oil type.
A specific measurement reading, or ‘Level Trigger Value’, can be set by the user to automatically save a spectrometer
reading to file when readings exceed this defined level. This reading will save to the Spec_Logs files stored on the hard
drive of the analyzer.
The detection range, upper and lower detection wavelengths, optimized for the oil type is input into the Spectrometer
Measurement section.

8 Meadowbank Road, Carrickfergus, BT38 8YF, Northern Ireland www.advancedsensors.co.uk
Page 57 of 93
OIW-HBO-0002-EX-005
OIW EX SERIES-SIDE STREAM
OPERATION MANUAL R e v . 0 0 4 M A Y 2 0 1 5
3.2.3.1.5.5 – Spectrometer Mask Settings
Masking allows a region of interest to be defined for a specific oil type. Selecting the ‘Enable WS Alarm’, as shown in
Figure 70, will generate alarms when the spectral measurements fall outside of the oil type mask ranges. Once this
option is enabled a ‘WS Alarm’ button will appear in the ‘Measurement Reading Display Area’ as shown in Figure 70 (See
Section 3.2.1.5 – Alarm Indicators p.30 and Section 4 – System Logs and Troubleshooting p.61 for more alarm
information). The user can adjust these settings as required to increase the acceptable masking tolerance (as a
percentage ± of the curve), adjust the lower and upper wavelengths and select an above base line percentage.
NOTE: For more information about the Spectrometer Settings & Mask Settings, please refer to the Spectrometer Handbook (OIW-HBO-0005).
Figure 70: Spec Mask Setting menu; enabling WS alarms
3.2.3.1.5.6 – Spectrometer Calibration
Allows the user to create a mask standard by taking the average of a selected series of spectra and stored in the oil type
file.
Figure 71: Oil type configuration menu.
NOTE: For more information about the Spectrometer Settings please refer to the Spectrometer Handbook OIW-HBO-0005-EX-002.
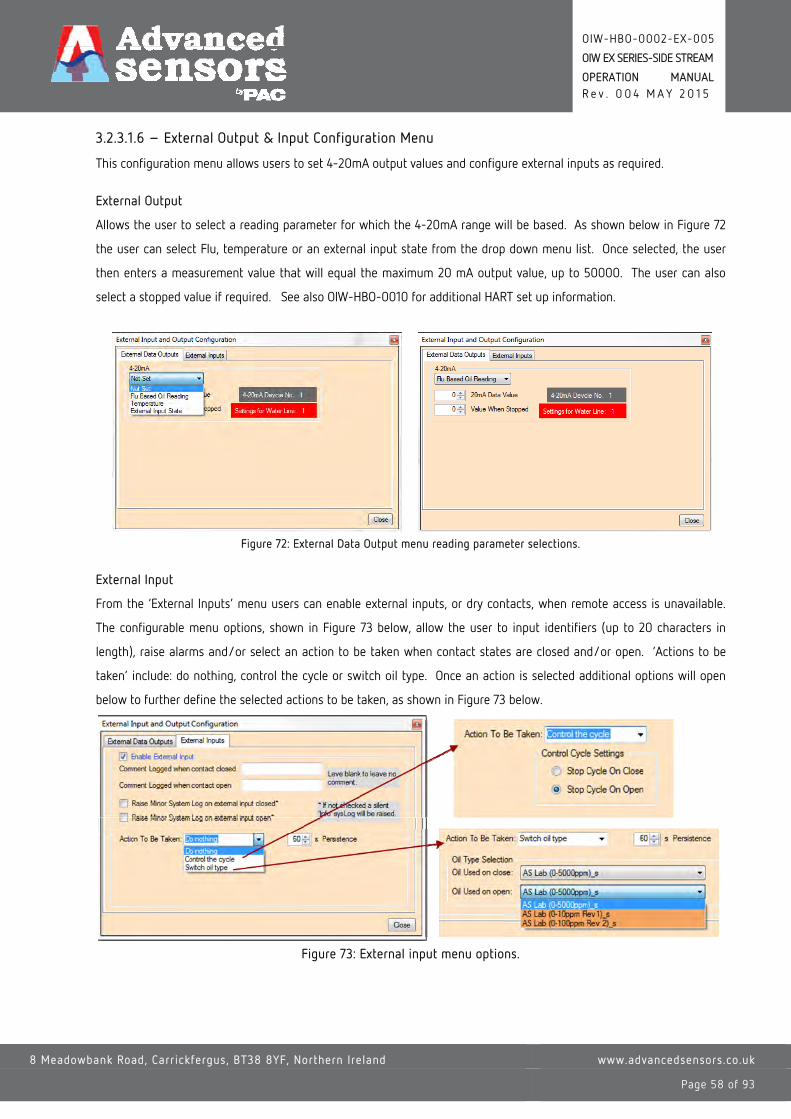
8 Meadowbank Road, Carrickfergus, BT38 8YF, Northern Ireland www.advancedsensors.co.uk
Page 58 of 93
OIW-HBO-0002-EX-005
OIW EX SERIES-SIDE STREAM
OPERATION MANUAL R e v . 0 0 4 M A Y 2 0 1 5
3.2.3.1.6 – External Output & Input Configuration Menu
This configuration menu allows users to set 4-20mA output values and configure external inputs as required.
External Output
Allows the user to select a reading parameter for which the 4-20mA range will be based. As shown below in Figure 72
the user can select Flu, temperature or an external input state from the drop down menu list. Once selected, the user
then enters a measurement value that will equal the maximum 20 mA output value, up to 50000. The user can also
select a stopped value if required. See also OIW-HBO-0010 for additional HART set up information.
Figure 72: External Data Output menu reading parameter selections.
External Input
From the ‘External Inputs’ menu users can enable external inputs, or dry contacts, when remote access is unavailable.
The configurable menu options, shown in Figure 73 below, allow the user to input identifiers (up to 20 characters in
length), raise alarms and/or select an action to be taken when contact states are closed and/or open. ‘Actions to be
taken’ include: do nothing, control the cycle or switch oil type. Once an action is selected additional options will open
below to further define the selected actions to be taken, as shown in Figure 73 below.
Figure 73: External input menu options.

8 Meadowbank Road, Carrickfergus, BT38 8YF, Northern Ireland www.advancedsensors.co.uk
Page 59 of 93
OIW-HBO-0002-EX-005
OIW EX SERIES-SIDE STREAM
OPERATION MANUAL R e v . 0 0 4 M A Y 2 0 1 5
3.2.3.2 – Configuration Settings Display Area
The lower panel of the OIW EX software displays key configuration data for quick reference. The previous sections have
referenced this display area therefore only a brief overview and any additional information will be provided. The system
parameters included in this display area, labeled in Figure 74, are detailed below.
NOTE: The display will change based on individual user configurations of the analyzer.
Figure 74: Configuration Settings display area.
1. Measure Cycle, 2. Alarm Settings (measurement unit), 3. Active Oil Type for Line #, 4. Line # Next Spectra, 5. Averaging and 6. Serial number, software version, corporate logo, asset tag # and start/stop button
3.2.3.2.1 – Measure Cycle
The ‘Measure Cycle’ displays information in 2 columns for the cycle phases and time. The current measurement cycle
phase will be highlighted in white while the Stopped state only is red. The user configured time parameters for each
phase will be displayed in the time column. To configure these items see Section 3.2.3.1.2 – Schedule Configuration
Options Menu p. 43.
3.2.3.2.2 – Alarm Settings
The Alarm Settings will display in brackets the measurement unit along with the user configured alarm parameters.
These include, but not limited to, values for measurements out of range, upper and / or lower thresholds, clearing limit
and alarm persistence. To configure alarms see Section 3.2.3.1.3 – Alarms Configuration Menu p. 45.
3.2.3.2.3 – Active Oil Type
Label 3 in Figure 74 displays the current active oil type for the process line. If more than one line is used this display
would change to reflect the line number. To configure active oil types see Section 3.2.3.1.5 – Oil Type Configuration
Menu p.50.

8 Meadowbank Road, Carrickfergus, BT38 8YF, Northern Ireland www.advancedsensors.co.uk
Page 60 of 93
OIW-HBO-0002-EX-005
OIW EX SERIES-SIDE STREAM
OPERATION MANUAL R e v . 0 0 4 M A Y 2 0 1 5
3.2.3.2.4 – Next Spectra
The ‘Line # Next Spectra’ displays the user defined spectroscopy reading period which takes place at the start of the
cycle. A spectroscopy file is created for each reading and saved in the Spec_Log files.
3.2.3.2.5 – Averaging
The ‘Averaging’ value displays the average measurement readings for a selected time. To configure the averaging time
see Section 3.2.3.1.1.2 – Water Line Options p.39.
3.2.3.2.6 – Serial Number, Software Version, Corporate Logo, Asset Tag and Start/Stop Button
A variety of system information is displayed under label 6 in Figure 74. The first number is the serial number of the unit
and will always take the form SNXXXXX. Below this is the current version of OIW software running on the analyzer and
recorded in all data logs. The serial number and software version are factory set and recorded in the build record.
The Advanced Sensors logo, when clicked, will display for 5 seconds a code required to grant temporary access. To
obtain temporary access this code, along with the unit serial number, are required by Advanced Sensors Service
Personnel. Please contact Advanced Sensors should troubleshoot or assistance required.
Any asset tag number, or other identifier, assigned to the unit can be entered and will display below the Advanced
Sensors corporate logo. A tag number up to 10 characters in length can be entered. See Section 3.2.3.1.1.1 - System
Settings p.36 to edit this display.
At the bottom of this area is the Start & Stop button. When idle, or stopped, the button will be green and read Start.
Once the button has been pressed to start the measurement cycle it will change to red and read Stop. This is accessible
to all users and does not require login access.

8 Meadowbank Road, Carrickfergus, BT38 8YF, Northern Ireland www.advancedsensors.co.uk
Page 61 of 93
OIW-HBO-0002-EX-005
OIW EX SERIES-SIDE STREAM
OPERATION MANUAL R e v . 0 0 4 M A Y 2 0 1 5
SECTION 4 – SYSTEM LOGS AND TROUBLESHOOTING
4.1 – LIST OF SYSTEM LOG MESSAGES AND USER ACTIONS The following section provides a listing, by severity of system log messages that may arise during routine operation of
the analyzer. As previously described alarms and logs are viewed in the middle display area by selecting the alarm / log
button or using the F6 key to toggle between the system logs and graphic display respectively. The Logs Display, shown
in Figure 75, will indicate the alarm status, Log message, Severity and provide a time stamp the log was raised and
acknowledged. Once a system log is raised (1), the corresponding Log message (2) is displayed to inform the user and
that entry is also recorded in the Syslog file. Logs are categorized by ‘Severity (3)’ as Information, Minor, Major or
Critical. Information Logs, as stated, simply convey information to the user with no actions required unless otherwise
stated in the following table; i.e. clearing alarm tables. Minor, Major and Critical Logs are raised to indicate to the user
system issues that require urgent attention which could potentially affect routine operation. Each log is accompanied
by the time it was raised then acknowledged (4 in Figure 75), when hovering the mouse over the time displays the full
time and date of the log.
Figure 75: Sample alarm list where: 1. Alarm Status (Raised, Acknowledged or Cleared), 2. Log message, 3.
Severity Classification and 4. Time the log was raised and acknowledged.
When the list window is full the system prompts users to clear information logs in the first instance. If no information
logs are listed, users are then requested to remove all acknowledged logs. Finally if there are no acknowledged logs, the
system will report the table is full and users should clear the table.
The following table provides users with a list of Log messages (2) sorted by Severity (3) with recommended actions. For
additional information about displaying, clearing and deleting logs see Sections 3.2.1.5 – System Log and Alarm
Indicators p. 30 and 3.2.3.1.3 – Alarms Configuration Menu p. 45.

8 Meadowbank Road, Carrickfergus, BT38 8YF, Northern Ireland www.advancedsensors.co.uk
Page 62 of 93
OIW-HBO-0002-EX-005
OIW EX SERIES-SIDE STREAM
OPERATION MANUAL R e v . 0 0 4 M A Y 2 0 1 5
SEVERITY (3): LOG MESSAGE (2): ACTION:
Critical Config file read error Contact Advanced Sensors for assistance.
Critical Failed to open Us com port Contact Advanced Sensors for assistance.
Critical Us psu config mismatch Contact Advanced Sensors for assistance.
Critical Failed to set gain or offest Contact Advanced Sensors for assistance.
Critical Daughterboard not responding. Contact Advanced Sensors for assistance.
Critical Temperature sensor IO fault Contact Advanced Sensors for assistance.
Critical Failed to find spectrometer Contact Advanced Sensors for assistance.
Information ,SW BOOTED on No action required.
Information Login by user No action required. User ID will be recorded in the system log.
Information Config upgraded successfully No action required.
Information Successfully Loaded Config No action required.
Information Config loaded from data log file No action required.
Information User note: No action required. User comments added to the data log.
Information Start cycle on reboot changed No action required.
Information Alarms table full - log file holds all alarms raised
To clear the alarms table right click in the alarm list and select ‘Delete All’.
Information Invalid UI configuration item Save changes and reboot the system.
Information Temperature below US cut-off If temperature continuously falls below the US cut-off, the US cut-off temperatures require adjustment.
Information Oil Type Auto Switched No action required.
Information Settings Saved No action required.
Information Water Status Alarm Table Full Clear alarms table. Right click in the alarm list and select ‘Delete All’.
Information US Comms Active No action required.
Information System Successfully Restarted No action required.
Information New oil loaded to system No action required.
Information New oil loaded to this water line No action required.
Information UI configuration file read error Select ‘Save Changes and Logout’. Exit and restart the software. If the issue persists contact Advanced Sensors for assistance.
Information Spectrometer measurement range invalid
Check parameters and amend as required. Select to ‘Save Changes and Logout’. Exit and restart the software. If the issue persists contact Advanced Sensors for assistance.
Information Spectrometer control loop opened No action required.
Information Auto START Cycle No action required.
Information START Cycle No action required.

8 Meadowbank Road, Carrickfergus, BT38 8YF, Northern Ireland www.advancedsensors.co.uk
Page 63 of 93
OIW-HBO-0002-EX-005
OIW EX SERIES-SIDE STREAM
OPERATION MANUAL R e v . 0 0 4 M A Y 2 0 1 5
SEVERITY (3): LOG MESSAGE (2): ACTION:
Information STOPPED Cycle No action required.
Information External input started cycle No action required.
Information External input stopped cycle No action required.
Information External IP No action required.
Information US state manually changed No action required.
Minor OIW SW Shutdown Normal., SW SHUTDOWN NORMAL by user
No action required.
Minor Failed to backup Oil Type File Select ‘Save Changes and Logout’. Exit and restart the software. If the issue persists contact Advanced Sensors for assistance.
Minor Can't write to log file - creating new file No action required.
Minor Log File not found - creating new file No action required.
Minor Exit attempt failed Invalid user No action required.
Minor 3 Password attempts failed No action required.
Minor Exit attempt failed for limited user No action required.
Minor Laser life file read error Select to ‘Save Changes and Logout’. Exit and restart the software. If the issue persists contact Advanced Sensors for assistance.
Minor User file read error Select to ‘Save Changes and Logout’. Exit and restart the software. If the issue persists contact Advanced Sensors for assistance.
Minor Custom data log config file read error Contact Advanced Sensors for assistance.
Minor Frequency v Temperature file read error Contact Advanced Sensors for assistance.
Minor Us Feq Out of Range Contact Advanced Sensors for assistance.
Minor Us PSU Freq Drift Contact Advanced Sensors for assistance.
Minor Invalid Us Response Contact Advanced Sensors for assistance.
Minor Invalid Freq Set Response Contact Advanced Sensors for assistance.
Minor Us Comms fail Contact Advanced Sensors for assistance.
Minor Us out of range data response Contact Advanced Sensors for assistance.
Minor An error occurred with a spectrometer file Contact Advanced Sensors for assistance.
Minor External Relay Board Expected but not found Contact Advanced Sensors for assistance.
Minor Spectrometer control loop closed No action required.
Minor External IP Closed No action required.
Minor External IP Open No action required.
Minor Could not start cycle Select to ‘Save Changes and Logout’. Exit and restart the software. If the issue persists contact Advanced Sensors for assistance.

8 Meadowbank Road, Carrickfergus, BT38 8YF, Northern Ireland www.advancedsensors.co.uk
Page 64 of 93
OIW-HBO-0002-EX-005
OIW EX SERIES-SIDE STREAM
OPERATION MANUAL R e v . 0 0 4 M A Y 2 0 1 5
SEVERITY (3): LOG MESSAGE (2): ACTION:
Major Unrecognised system error - report to Advanced Sensors
Contact Advanced Sensors for assistance.
Major Oil type file read error
Reload the Oil Type File. Select to ‘Save Changes and Logout’. Exit and restart the software. If the issue persists contact Advanced Sensors for assistance.
Major Oil Type folder read error Contact Advanced Sensors for assistance.
Major OilType File not saved - no file set
Load the Oil Type File. Select to ‘Save Changes and Logout’. Exit and restart the software. If the issue persists contact Advanced Sensors for assistance.
Major Cycle state read error If alarm persists contact Advanced Sensors for assistance.
Major Flush time file read error Contact Advanced Sensors for assistance.
Major Flow stream read error Contact Advanced Sensors for assistance.
Major Auto tune aborted due to timeout If alarm persists contact Advanced Sensors for assistance.
Major Us unit not on during Tuning Contact Advanced Sensors for assistance.
Major Us tuning invalid response Contact Advanced Sensors for assistance.
Major Us tuning frequency not read Contact Advanced Sensors for assistance.
Major Us tuning aborted due to comms errors Contact Advanced Sensors for assistance.
Major Us tuning failed to start Contact Advanced Sensors for assistance.
Major US Comms, invalid response Contact Advanced Sensors for assistance.
Major Relief valve anomaly - Should not be moving Contact Advanced Sensors for assistance.
Major Relief valve anomaly - Should not be open Contact Advanced Sensors for assistance.
Major Relief valve anomaly - Should not be closed Contact Advanced Sensors for assistance.
Major Relief valve anomaly - Reporting both closed and open
Contact Advanced Sensors for assistance.
Major Relief valve anomaly - Travel time exceeded Contact Advanced Sensors for assistance.
Major Laser maintenance required now Contact Advanced Sensors for to schedule maintenance service.
Major Temperature Sensor Fail Contact Advanced Sensors for assistance.
Major Valve anomaly - Should not be moving Contact Advanced Sensors for assistance.
Major Valve anomaly - Should not be open Contact Advanced Sensors for assistance.
Major Valve anomaly - Should not be closed Contact Advanced Sensors for assistance.
Major Valve anomaly - Reporting both closed and open Contact Advanced Sensors for assistance.
Major Valve anomaly - Travel time exceeded Contact Advanced Sensors for assistance.
Major Flush valve anomaly - Should not be moving Contact Advanced Sensors for assistance.
Major Flush valve anomaly - Should not be open Contact Advanced Sensors for assistance.

8 Meadowbank Road, Carrickfergus, BT38 8YF, Northern Ireland www.advancedsensors.co.uk
Page 65 of 93
OIW-HBO-0002-EX-005
OIW EX SERIES-SIDE STREAM
OPERATION MANUAL R e v . 0 0 4 M A Y 2 0 1 5
SEVERITY (3): LOG MESSAGE (2): ACTION:
Major Flush valve anomaly - Should not be closed Contact Advanced Sensors for assistance.
Major Flush valve anomaly - Reporting both closed and open
Contact Advanced Sensors for assistance.
Major Flush valve anomaly - Travel time exceeded Contact Advanced Sensors for assistance.
Major Flow 2 valve anomaly - Should not be moving Contact Advanced Sensors for assistance.
Major Flow 2 valve anomaly - Should not be open Contact Advanced Sensors for assistance.
Major Flow 2 valve anomaly - Should not be closed Contact Advanced Sensors for assistance.
Major Flow 2 valve anomaly - Reporting both closed and open Contact Advanced Sensors for assistance.
Major Flow 2 valve anomaly - Travel time exceeded Contact Advanced Sensors for assistance.
Major Invalid spectrometer version Contact Advanced Sensors for assistance.
Major Spectrometer failed at read stage 2 Contact Advanced Sensors for assistance.
Major Spectrometer failed at init stage 1 Contact Advanced Sensors for assistance.
Major Spectrometer failed at init stage 2 Contact Advanced Sensors for assistance.
Major Spectrometer failed at read stage 1 Contact Advanced Sensors for assistance.
Major Spectrometer data out of range Contact Advanced Sensors for assistance.
Major Spectrometer timed out Contact Advanced Sensors for assistance.
Major Spectrometer data missing Contact Advanced Sensors for assistance.
Major Spectrometer failed to start Contact Advanced Sensors for assistance.
Major Spectrometer expected data missed Contact Advanced Sensors for assistance.
Major Spectrometer standard started by user Contact Advanced Sensors for assistance.
Major Oil Type Curve mismatch Contact Advanced Sensors for assistance.
Major Spectrometer device mismatch Contact Advanced Sensors for assistance.

8 Meadowbank Road, Carrickfergus, BT38 8YF, Northern Ireland www.advancedsensors.co.uk
Page 66 of 93
OIW-HBO-0002-EX-005
OIW EX SERIES-SIDE STREAM
OPERATION MANUAL R e v . 0 0 4 M A Y 2 0 1 5
4.2 – TROUBLESHOOTING Prior to performing any troubleshooting measures, check all sources of power and pipe connections to ensure power and
process water supplies are being maintained to the analyzer.
CAUTION: Ensure that water is in the measurement chamber at all times during the operational cycle. Insufficient water levels may result in damage to the system.
4.2.1 – Calibration Procedure
NOTE: The OIW analyzer is NOT calibrated to a National Standard. The analyzer is calibrated to the laboratory results. Therefore references to calibration refer to the comparison using laboratory results as the standard rather than a National Standard.
Analyzer measurements may not align with the Laboratory results which could be rectified by fine tuning the unit. The
OIW analyzer is fine tuned using laboratory based results as standard. Using specific oil types allows the system to be
calibrated for a unique oil type to provide measurements on site for every second the analyser is operational.
The following section will outline the Advanced Sensors recommended sampling and tuning procedures in addition to
describing gain adjustments to align the readings. Offsets are factory pre-set and shall only be adjusted by Advanced
Sensors trained personnel.
4.2.1.1 – Sampling Procedure
The following points should be observed to ensure samples sent to the Laboratory are consistent with the OIW Analyzer
measurement reading:
Sample extraction from the sample point shall be during the FLOW cycle.
The sample point, when the analyzer is not fitted with one, shall be fitted adjacent to the outlet of the analyzer
within 1 m of the unit.
When sampling for a calibration a minimum of 4-5 samples should be taken over a 12 hour period. Each
sample shall be labelled with the exact time taken (from the analyzer clock), date and location if applicable.
Sampling Steps:
1. Flush the sample point for 20-30 seconds to remove any accumulated debris from the pipe work.
2. Extract the sample over a of 30-60 second period during the FLOW phase of the cycle.
3. Record the measurement reading (averaged over the sample period if possible) along with the START and STOP
times of the sample extraction on the container or in a log. Use the clock on the OIW software for times
allowing the time to be traced in the SysLogs.
4. Once all samples have been taken, obtain the average reading (i.e. ppm) value for the extraction period using
the SamTrack utility software (see the Data Logging Handbook OIW-HBO-0003-EX-002 for additional
information).
NOTE: START and STOP times shall be taken from the OIW Analyzer clock only.

8 Meadowbank Road, Carrickfergus, BT38 8YF, Northern Ireland www.advancedsensors.co.uk
Page 67 of 93
OIW-HBO-0002-EX-005
OIW EX SERIES-SIDE STREAM
OPERATION MANUAL R e v . 0 0 4 M A Y 2 0 1 5
4.2.1.2 – Calibration Steps:
When all samples for calibration have been analyzed carry out the following:
1. Stop the analyzer cycle.
2. Open the General Configuration menu using the F3 button to toggle through the options. Login with an
Administrator password.
3. Select the ‘System Test’ button and click on the Misc Testing tab. From the ‘Manual Valve Control’ box select
the Open Flow button. Once the valve is open the ‘Open Flow’ button will change to ‘Close Flow’. Close this
dialogue box to continue.
Figure 76: Valve open selection 4. Enable the analyzer to ‘Measure When Stopped’ — from the Oil Type Configuration Menu select the Oil
Calibration tab and select the ‘Measure When Stopped’ option as shown in Figure 77.
Figure 77: Enabling analyzer measurement while stopped to perform calibration.

8 Meadowbank Road, Carrickfergus, BT38 8YF, Northern Ireland www.advancedsensors.co.uk
Page 68 of 93
OIW-HBO-0002-EX-005
OIW EX SERIES-SIDE STREAM
OPERATION MANUAL R e v . 0 0 4 M A Y 2 0 1 5
5. Turn on the ultrasonic power supply using the ‘Turn US On’ button for 5 – 10 seconds to remove any deposits
from the sample chamber. Turn off the ultrasonic power supply and close the menu to continue.
Figure 78: Ultrasonics On/Off button
6. From the ‘System Test’ menu close the flow valve (see Step 3) to isolate a sample in the chamber.
7. Prior to measurement the sample within the chamber must be homogenized. From the Oil Type
Configuration Menu select the Oil Calibration tab and press the ‘Turn US On’ button as shown in Figure 78:.
After 5 seconds press the ‘Turn US Off’ button to turn the ultrasonic power supply off.
8. Allow the sample to settle for 5 seconds then record the measurement reading.
9. Multiply this reading by the Average Difference (see example results below) value obtained during the
sampling procedure. Record this value.
10. Adjust the Gain using the Gain Control under the Oil Calibration Settings Tab of the main menu until the ppm
reading equals the value obtained in step 10.
11. De-select the Enable Measuring checkbox box in the Measure When Stopped group under the Oil Calibration
Tab of the main menu.
12. Select Save Changes & Logout Button to save.
13. Start the analyzer cycle using Start on main menu.

8 Meadowbank Road, Carrickfergus, BT38 8YF, Northern Ireland www.advancedsensors.co.uk
Page 69 of 93
OIW-HBO-0002-EX-005
OIW EX SERIES-SIDE STREAM
OPERATION MANUAL R e v . 0 0 4 M A Y 2 0 1 5
4.2.1.3 – Offset and Integration Time Adjustment
Measurement readings inconsistent with laboratory results may be the result of variations in analyzer hardware.
Adjusting the offset and/or integration time will calibrate the hardware and correlate the measurement readings to the
laboratory results. This is a 2 step process which requires both the measurement readings (i.e. PPM values) from the
analyser and the results from the laboratory for graphic comparison.
4.2.1.3.1 – Setting the Offset
If the measurement readings and laboratory results are higher, or lower, by a consistent value as depicted in Figure 79
below then an adjustment to the offset may be required. All adjustments to the offset shall be done by Advanced
Sensors trained and authorised personnel only. If an adjustment to the offset is required please contact Advanced
Sensors for assistance.
Figure 79: Offset Graph
INFORMATION: Adjustments made to the offset not performed by an Advanced Sensors authorized representative may result in misrepresented results.
4.2.1.3.2 – Setting the Gain
Adjustments to the gain allow an increase, or decrease, in the averaging time of a signal. When the measurement
readings and the laboratory results deviate as shown below in Figure 80 then an adjustment to the gain should be
applied.
Figure 80: Gain graph example

8 Meadowbank Road, Carrickfergus, BT38 8YF, Northern Ireland www.advancedsensors.co.uk
Page 70 of 93
OIW-HBO-0002-EX-005
OIW EX SERIES-SIDE STREAM
OPERATION MANUAL R e v . 0 0 4 M A Y 2 0 1 5
Calculating the correct factor from the laboratory results (as standard) and the measurement readings is described with
the following examples. A correction factor is the calculated as the average difference between the laboratory results
and the analyzer measurement readings. Then this average is used as a multiplication factor to calculate the actual
displayed reading allowing the ‘gain’ settings to be adjusted.
A. If the OIW analyzer is measuring LOWER than the lab
Example Results:
Sample No Lab Reading (ppm) OIW Reading (ppm) (Lab/OIW) 1 3 2 1.50 2 9 4 2.25 3 18 15 1.20 4 27 25 1.08 5 18 14 1.28
Average Difference = 1.46
If the ppm reading = 55
The new adjusted reading should be 55 x 1.46 = 79.7
Now increase the gain to obtain a ppm reading of 79.7. B. If the OIW analyzer is measuring HIGHER than the Lab
Sample No Lab Reading (ppm) OIW Reading (ppm) (Lab/OIW) 1 2 3 0.66 2 4 9 0.44 3 15 18 0.83 4 25 27 0.92 5 14 18 0.77
Average Difference = 0.72
If the ppm reading = 55
The new adjusted reading should be 55 x 0.72 = 39.6
Now decrease the gain to obtain a ppm reading of 39.6
NOTE: If an analysed sample shows a very large difference from all the other samples taken, then this sample should not be included

8 Meadowbank Road, Carrickfergus, BT38 8YF, Northern Ireland www.advancedsensors.co.uk
Page 71 of 93
OIW-HBO-0002-EX-005
OIW EX SERIES-SIDE STREAM
OPERATION MANUAL R e v . 0 0 4 M A Y 2 0 1 5
SECTION 5 – DATA LOGGING
5.1 – INTRODUCTION
INFORMATION: This section describes the data logging features only.
CAUTION: No options should be altered without a full understanding of the change being made.
WARNING: To prevent the risk of injury, the Health and Safety section of this manual and the Installation manual must be read carefully and understood before using this equipment.
This data logging section provides an overview of locating data log files, the log file data and how to view the data
contained in the logs.
The additional Advanced Sensors’ Software described in this section is free to use in conjunction with Advanced Sensors’
Analyzers running Revision 5.0 software and above.
5.2 – ACCESSING DATA LOG FILES Log files are located on the systems hard drive in ‘Shared Documents’ and found in a directory named OIWlogs. Access
to log files may be required for troubleshooting or analytical purposes and can be saved to a USB memory stick.
There are two ways to access the log files for the OIW-EX Series:
1. Direct Access: from the OIW-EX Monitor PC (this will require physical access to the PC within the analyzer for
analyzers NOT fitted with an EX USB port), or
2. Remote Access: from a Desktop/Laptop PC via Ethernet.
5.2.1 – Direct Access
WARNING: Prior to commencing any work on the OIW analyzer, ensure the required ‘hot’ permits have been obtained. The equipment is designed for use in Hazardous Areas therefore shall not be opened without first obtaining the required ‘hot’ permits.
Direct access of data log files requires the user to obtain a ‘hot’ permit as the enclosure door of the analyzer may need
to be opened or, if an EX USB port is fitted, the supplied wired keyboard (non-EX rated) may be used.
When opening the door of the analyzer enclosure loosen off the bolts in the first instance then ensure all the removed
bolts, including IP washers, are stored safely for re-assembly. Note that once all bolts and washers have been removed
that there will be ‘play’ in the door hinges. This is a design feature which allows an even seal along the entire flame-
path. With all bolts removed, open the door fully. The PC is mounted to the door with the spare USB ports on the hinge
facing side. Locate a spare USB port(s) and insert the USB memory stick as shown in Figure 81. If a spare USB port is
not available please contact Advanced Sensors for assistance.

8 Meadowbank Road, Carrickfergus, BT38 8YF, Northern Ireland www.advancedsensors.co.uk
Page 72 of 93
OIW-HBO-0002-EX-005
OIW EX SERIES-SIDE STREAM
OPERATION MANUAL R e v . 0 0 4 M A Y 2 0 1 5
Figure 81: USB drive inserted in spare USB port located on the inside of the analyzer.
Conversely if an EX USB port is fitted externally, as shown below in Figure 82, then remove the dust cap and connect the
supplied keyboard. An external USB can be used with the supplied keyboard.
Figure 82: Externally fitted EX d rated USB connector.

8 Meadowbank Road, Carrickfergus, BT38 8YF, Northern Ireland www.advancedsensors.co.uk
Page 73 of 93
OIW-HBO-0002-EX-005
OIW EX SERIES-SIDE STREAM
OPERATION MANUAL R e v . 0 0 4 M A Y 2 0 1 5
5.2.1.1 – Locating OIW Log Files
Analyzers will run on either Windows XP Pro or Windows 7 operating systems (OS). Locating OIW log files varies
between the two operating systems and is described in the following sections.
5.2.1.1.1 – Windows XP
Users with Windows XP should navigate to the OIW log files as follows; see Figure 83 below for screenshots of file path:
1. Select the ‘Start’ button
2. Select ‘My Computer’
3. Next locate and select the ‘Shared Documents’ folder.
4. The ‘OIWlogs’ folder should be the only folder contained in ‘Shared Documents’
1. Start 2. My Computer 3. Shared Documents 4. OIWlogs Figure 83: Direct Access in Windows XP Pro.

8 Meadowbank Road, Carrickfergus, BT38 8YF, Northern Ireland www.advancedsensors.co.uk
Page 74 of 93
OIW-HBO-0002-EX-005
OIW EX SERIES-SIDE STREAM
OPERATION MANUAL R e v . 0 0 4 M A Y 2 0 1 5
5.2.1.1.2 – Windows 7
Users with Windows 7 should navigate to the OIW log files as follows; see Figure 84 for screenshots of file path:
1. Select the ‘Start’ button
2. Select ‘Documents’ from the start menu.
3. The ‘OIWlogs’ folder should be the only folder contained in ‘Documents’
1. Start 2. Documents OIWlogs Figure 84: Direct Access in Windows 7.

8 Meadowbank Road, Carrickfergus, BT38 8YF, Northern Ireland www.advancedsensors.co.uk
Page 75 of 93
OIW-HBO-0002-EX-005
OIW EX SERIES-SIDE STREAM
OPERATION MANUAL R e v . 0 0 4 M A Y 2 0 1 5
5.3 – OIW LOG FILES - OVERVIEW Log files are structured to distribute all analyzer information and data within discrete folders. Each OIW log file contains
three sub folders, as shown in Figure 85, with additional folders containing specific raw data or information in comma
separated value (.csv) format.
The following sections will describe the layout, content and how to view the data contained within the OIW log file
structure.
Figure 85: OIW log folders: 1. Monthly Data Logs, 2. Oil Type Backups and 3. System Logs
All information and data generated by the analyzer are distributed into Monthly logs, System logs and Oil type backup
files.
1. Monthly Data Logs – these folders contain all data recorded by the analyzer during routine operation. Data is
saved in Monthly folders and displayed in order by year and month.
2. System Logs – contains a complete record of all the analyzer System Logs during operation. Each event, or
system log, is recorded by date and time including the severity and log description.
3. Oil Type Backups – a backup of all parameter information required for each specific oil type used to calibrate
the analyzer. This file may contain information for more than one oil type.

8 Meadowbank Road, Carrickfergus, BT38 8YF, Northern Ireland www.advancedsensors.co.uk
Page 76 of 93
OIW-HBO-0002-EX-005
OIW EX SERIES-SIDE STREAM
OPERATION MANUAL R e v . 0 0 4 M A Y 2 0 1 5
5.3.1 – Monthly OIW Logs
Each monthly log folder contains the analyzer data for every second the unit is powered on and measuring. Within this
folder will be up to 3 subfolders as shown in Figure 86: Monthly OIW log sub folders; one each for data logs,
spectrometer logs (EX-1000 Models only) and ultrasonic logs.
Figure 86: Monthly OIW log sub folders
1. Data Logs – contains logs of the second by second data acquired during routine operation of the analyzer.
2. Spec Logs – logs of all the spectrometer data, acquired second by second. Note this folder will only be
present for OIW EX-1000 analyzers which are fitted with a spectrometer. Additional spectrometer information
can be found in Section 3.2.3.1.5.4 – Spectrometer Settings or in the Spectrometer Handbook (OIW-HBO-0005-
EX-002)
3. US Logs – contains the Ultrasonic unit power and timing information.

8 Meadowbank Road, Carrickfergus, BT38 8YF, Northern Ireland www.advancedsensors.co.uk
Page 77 of 93
OIW-HBO-0002-EX-005
OIW EX SERIES-SIDE STREAM
OPERATION MANUAL R e v . 0 0 4 M A Y 2 0 1 5
5.3.1.1 – Data Log Files
Log files are created to capture a comprehensive record of all analyzer activities and cannot be altered. There are 5
circumstances in which a new data log file is created:
1) At start up
2) At midnight
3) At midday (optional – turned off as default);
4) When the configuration is changed and saved;
5) If the system software cannot for any reason write to the current log file a new file will be created to
ensure that no data is lost; e.g. the file has been deleted, moved during a backup or already opened for
viewing in another programme.
*Custom Data Log Files
To accommodate users with specific data requirements, the OIW software enables users to create a secondary ‘custom’
data log. A ‘Custom Data’ log subfolder will be created in the data log file folder, as shown in Figure 87 A. Custom log
files by default are disabled to reduce usage of disk space and therefore require a user to enable only as required. To
enable custom log generation see Section 3.2.3.1.1.3 – Custom Logs.
5.3.1.1.1 – Filename format
Each data log file filename will start with the Serial Number of the unit being logged, followed by the date and time of
file creation, followed by the day of the week (for quick reference) and ending in file type, as shown below in Figure 87.
For example the file ‘’SN00107-04_Dec_13-10_07_45_Wed_OIW_Data’’:
SN00107 is the serial number of the analyzer;
04_Dec_13 the date when the spectra was taken;
10_07_45 the time the log was created;
Wed the day of the week the log was created;
OIW_Data the type of OIW file.
A. B.
Figure 87: View of log files in A. Windows XP and B. Windows 7.

8 Meadowbank Road, Carrickfergus, BT38 8YF, Northern Ireland www.advancedsensors.co.uk
Page 78 of 93
OIW-HBO-0002-EX-005
OIW EX SERIES-SIDE STREAM
OPERATION MANUAL R e v . 0 0 4 M A Y 2 0 1 5
All data logs are stored in Comma Separated Value (.csv) file format allowing for viewing in Notepad, or other simple text
editor. Data logs can also be viewed in tabulated display format when imported into MS Excel, as shown in Figure 88
and Figure 89. As the OIW is run on a standard Microsoft Windows XP or 7 Pro Operating System the user can display
and arrange the files in a variety of ways.
Figure 88: Data Log Files view in Excel and Notepad.

8 Meadowbank Road, Carrickfergus, BT38 8YF, Northern Ireland www.advancedsensors.co.uk
Page 79 of 93
OIW-HBO-0002-EX-005
OIW EX SERIES-SIDE STREAM
OPERATION MANUAL R e v . 0 0 4 M A Y 2 0 1 5
5.3.1.1.2 – Data File Format and Content
Each data log file is composed of two main data sections – configuration data and measurement data. Each section has
headers to identify the parameter followed by the data values. Figure 89 shows an example of a data log file identifying
section headers and data.
The Configuration header information reflects the current unit configurations. Configurable features of the analyzer
include, but not limited to, data options, custom logs, laser life, system alarms, relays, scheduling, HART, gain and offset
values. The configuration data stored is unique to each analyzer. In the event of a hard drive failure a replacement can
be re-configured quickly from this data, provided the data logs are regularly backed up. Also any changes to the
measurement readings as a result of changes to the systems configuration can be identified from this information.
Figure 89: Typical Log File output in Excel, where 1. Configuration headings 2. Configuration data (parameters) 3. Data headings and 4. Data (actual).

8 Meadowbank Road, Carrickfergus, BT38 8YF, Northern Ireland www.advancedsensors.co.uk
Page 80 of 93
OIW-HBO-0002-EX-005
OIW EX SERIES-SIDE STREAM
OPERATION MANUAL R e v . 0 0 4 M A Y 2 0 1 5
The Data section of the data file contains all the measurement data and any additional system information. The data
values cannot be amended or changed on the analyzer PC. Data
There are 8 different information columns as follows:
1. Time: time the reading was taken in Hours, Mins and Seconds format;
2. ppm: the PPM value for reading time;
3. ppmC: the compensated PPM value (this column will be blank if trending compensation is not enabled);
4. Raw / Flu: the raw florescence data value from which the PPM value was derived;
5. Temp in C/F: the temperature of the sample chamber in degrees Celsius or Farenheight.
6. AvMea: the AVerage MEAsured value – the average data value. A measurement is taken, displayed and
written to the log file for every second during the flowing phase. At the end of the flowing phase the system
latches the last displayed value – the displayed value is fixed at the last measurement value before the valve
closes. During the measurement phase the measured values are written to the log file but only the averaged
value is displayed on screen.
7. State – indicates the phase of the measurement cycle in which the reading was taken. Phases are abbreviated
to three letters as below:
ABBREVIATION: PHASE: ABBREVIATION: PHASE:
HOM Homogenisation FRE Frequency tuning
SET Settling CLO Valve closing
MEA Measuring OPE Valve opening
FLU Flushing FLO Flowing
HOL Holding CLE Cleaning
8. Comments: the last column(s) will provide additional information as required. Comments can be as follows:
Overall Comments: SW START the software was started START the start button was pressed STOPPED the stop button was pressed
Ultrasonics Related Comments: Fset<frequency> the homogenisation frequency was updated to this value ATEnd Frequency tuning has ended ATAbort Frequency Tuning Abort
Measurement Related Comments3: PPMalm ppm alarm raised PPMack ppm alarm was acknowledged PPMclr ppm alarm was cleared PPMOOR ppm value is out of range
3 The Measurement comment reflects the units of measure for which the OIW Monitors has been configured; i.e. if the OIW Monitor has been configure to measure parts per billion then the comments will be PPBalrm, PPBack, PPBclr and PPBOOR respectfully.

8 Meadowbank Road, Carrickfergus, BT38 8YF, Northern Ireland www.advancedsensors.co.uk
Page 81 of 93
OIW-HBO-0002-EX-005
OIW EX SERIES-SIDE STREAM
OPERATION MANUAL R e v . 0 0 4 M A Y 2 0 1 5
Spectrometer Related Comments: PPMalm ppm alarm raised SPEC READ MANUAL a spectrum has been manually generated by the user SPEC TIMED a spectrum is generated after a user defined number of cycles (a time based trigger) PPM SPEC TRIGGERED a spectrum generated after a user defined reading value; the measured reading
value has exceeded a set threshold value to trigger the generation of a spectrum.
System Related Comments: SYSalm a system log alarm was raised SYSack a system log alarm was acknowledged SYSclr a system log alarm was cleared
Water Status Related Comments: WSalm a water status alarm was raised WSack a water status alarm was acknowledged WSclr a water status alarm was cleared
Simulation Related Comments: SIMp ppm value is being simulated SIMf raw flu value is being simulated SIMt temperature is being simulated <R> SPEC READ Spectrometer reading taken. (EX-1000 units only) Where R = the reason for the read (MANUAL, TIMED, or <ppm trigger>-TRIG) SysMsg-<xxx> System Log written to SysLog file with message xxx, where xxx is a number
representing the message written.
More than one of the above messages can occur in any one second; in the event of more than 1 comment, each message
will be placed in a separate column.
When Trending is set to ON then every second of data will be logged to the log file. When Trending is set to OFF then
the log file only stores every second of the measurement phase; for all other phases only the start time of that phase is
captured (see Section 3.2.3.1.1.2 – Water Line Options for details on how to turn Trending On or off).
5.3.2 – Oil Type Backup Files
Oil type files contain all the analyzer parameters for a particular oil type, similar to a calibration file. This folder contains
backup copies of all oil type files loaded on the analyzer.

8 Meadowbank Road, Carrickfergus, BT38 8YF, Northern Ireland www.advancedsensors.co.uk
Page 82 of 93
OIW-HBO-0002-EX-005
OIW EX SERIES-SIDE STREAM
OPERATION MANUAL R e v . 0 0 4 M A Y 2 0 1 5
5.3.3 – System Log Files
INFORMATION: It is strongly recommended that remote Ethernet access is given to Advanced Sensors Ltd so that prompt diagnostics can be performed to minimise downtime.
System log files (referred to as SysLogs) record key events, or system logs, that occur during routine operation of the
analyzer. These log files enable effective troubleshooting and diagnosis of problems should a fault occur.
SysLog files are created under 2 circumstances to ensure that no data is lost:
1. At Start up. 2. If the software is unable to write to the current SysLog file. For example the user has deleted the file, moved
the file during a backup or opened the file to view it during operation while events were being logged.
SysLog files, as shown below in Figure 90, are named as follows: <date of creation>-<time of creation>_SysLog.csv
(note: depending on Microsoft Windows settings the file extension may be hidden).
Figure 90: SysLog folder – a. Windows XP (top) and b. Windows 7 (bottom) containing log files.
a.
b.

8 Meadowbank Road, Carrickfergus, BT38 8YF, Northern Ireland www.advancedsensors.co.uk
Page 83 of 93
OIW-HBO-0002-EX-005
OIW EX SERIES-SIDE STREAM
OPERATION MANUAL R e v . 0 0 4 M A Y 2 0 1 5
5.3.3.1 – System Folder Contents
Problems detected in the routine operation of either the hardware or software will result in a system log which activates
an alarm indicator in Feedback Display (see Section 3.2.1.5 – System Log and Alarm Indicators on p. 30 for display
information). The SysLog files are therefore a record of only these system logs, no other data, which can be viewed in
Excel or Notepad as shown in Figure 91. Unlike the Data Logs, this is a summary file in order to save file size it will not
continually log a recurring alarm during each report log. During normal operation, where the unit is left to run
continuously over a long period of time, the SysLog may span months or even years allowing a long term view of the
operation of the unit.
See Section 4 – System Logs and Troubleshooting on page 61 for addition information.
Figure 91: System logs in Excel

8 Meadowbank Road, Carrickfergus, BT38 8YF, Northern Ireland www.advancedsensors.co.uk
Page 84 of 93
OIW-HBO-0002-EX-005
OIW EX SERIES-SIDE STREAM
OPERATION MANUAL R e v . 0 0 4 M A Y 2 0 1 5
SECTION 6 – DUAL FLOW SYSTEM
6.1 – DUAL SYSTEM OVERVIEW The OIW EX Side Stream series of analyzers may be fitted with 2 flow valves to facilitate the analysis of 2 different
sources of produced water by a single analyzer unit. The inflow pipe on the chamber assembly is fitted with a ‘T’ piece,
as shown in Figure 92, which connects an additional flow valve for the second process line.
Figure 92: Dual side stream unit with stainless steel enclosure
When an additional flow valve is fitted only one stream at a time can be analyzed. The flow valves are controlled by the
OIW software. The software is configured to open and close each valve in turn as required. Figure 93a shows the
process flows when flow valve 1 is open and then, in figure 93b, when flow valve 2 is open.
Figure 93: Process flows when: a. Valve 1 is open and b. Valve 2 open.
NOTE: Both valves cannot be open at the same time.
b.a.

8 Meadowbank Road, Carrickfergus, BT38 8YF, Northern Ireland www.advancedsensors.co.uk
Page 85 of 93
OIW-HBO-0002-EX-005
OIW EX SERIES-SIDE STREAM
OPERATION MANUAL R e v . 0 0 4 M A Y 2 0 1 5
6.2 – SOFTWARE INTERFACE 6.2.1 – Selecting a Water Line for Configuration
When analysis of an additional process line is required, the OIW analyzer can be fitted with a second flow valve. The OIW
software is designed to accommodate this extra process or water line. The second water line must be configured for
the process to be analyzed; this is done in the same way as the first water line. All of the system Configuration Option
Menus will have a Water Line drop down selection box as shown in Figure 94. To apply process specific configurations
users must ensure Water Line 2 is selected for the menu option, configure the items, ‘Close’ and then ‘Save Changes &
Logout’. For complete software information see Section 3 – Overview of Software Operation p.22.
Figure 94: Water line selection from the Configurations Options Menu.
6.2.2 – Display Options for Dual Flow
The main software display maintains the same layout with a few minor adjustments for the second Water Line as shown
below in Figure 95. The following section will highlight the additional information present in the OIW software display
for dual flow systems.
Figure 95: Example of main software display for a dual flow system.
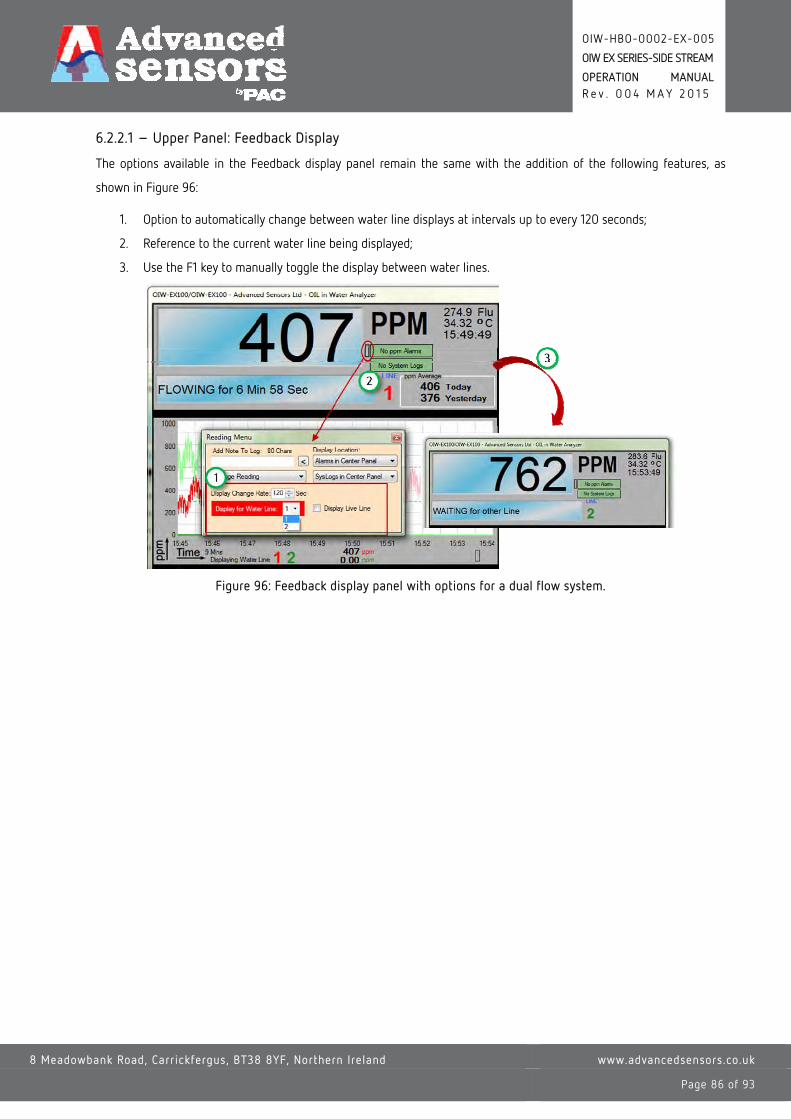
8 Meadowbank Road, Carrickfergus, BT38 8YF, Northern Ireland www.advancedsensors.co.uk
Page 86 of 93
OIW-HBO-0002-EX-005
OIW EX SERIES-SIDE STREAM
OPERATION MANUAL R e v . 0 0 4 M A Y 2 0 1 5
6.2.2.1 – Upper Panel: Feedback Display
The options available in the Feedback display panel remain the same with the addition of the following features, as
shown in Figure 96:
1. Option to automatically change between water line displays at intervals up to every 120 seconds;
2. Reference to the current water line being displayed;
3. Use the F1 key to manually toggle the display between water lines.
Figure 96: Feedback display panel with options for a dual flow system.

8 Meadowbank Road, Carrickfergus, BT38 8YF, Northern Ireland www.advancedsensors.co.uk
Page 87 of 93
OIW-HBO-0002-EX-005
OIW EX SERIES-SIDE STREAM
OPERATION MANUAL R e v . 0 0 4 M A Y 2 0 1 5
6.2.2.2 – Middle (and Lower) Panel: Graphical Display
The Graphical Displays, like with a single water line, can display multiple options. Each graph can display the
measurement data for each water line individually or both at the same time or a combination of water lines and
measurement readings (for EX-1000 models displays include spectral data). The Graph Menu, #1 in Figure 97 below,
includes a ‘Water Line to Display’ option. Users can select to display water line 1, water line 2 or both on the same
graphical display. Water line 1 will be in RED and water line 2 will be in GREEN. Use F2 to toggle between graphs in the
middle panel and use F3 to toggle the lower panel (or use the drop down arrow as shown in #2 in Figure 97).
Figure 97: Upper and lower graphical displays for a dual flow system with water lines 1 & 2 selected for display.
Figure 98: Upper and lower graphical displays for a dual flow system with individual water lines selected for display.

8 Meadowbank Road, Carrickfergus, BT38 8YF, Northern Ireland www.advancedsensors.co.uk
Page 88 of 93
OIW-HBO-0002-EX-005
OIW EX SERIES-SIDE STREAM
OPERATION MANUAL R e v . 0 0 4 M A Y 2 0 1 5
6.2.2.3 – Lower Panel: Configuration Settings Display Area
The configuration data displayed in the lower panel varies from the single flow system. As shown in Figure 99 below
Measurement cycle (1), Active oil type (2) and Averaging (3) for Water line 2 are now displayed.
Figure 99: Configuration settings display for a dual flow system – 1. Measure Cycle, 2. Active Oil Type for Line 2 & 3. Averaging for Line 2

8 Meadowbank Road, Carrickfergus, BT38 8YF, Northern Ireland www.advancedsensors.co.uk
Page 89 of 93
OIW-HBO-0002-EX-005
OIW EX SERIES-SIDE STREAM
OPERATION MANUAL R e v . 0 0 4 M A Y 2 0 1 5
APPENDIX 1 – TECHNICAL DATA
Measurement Performance Measurement principle Laser Induced Fluorescence (LIF)
Range 0 - 20,000ppm
* User may select any desired measurement from 0-100ppb, 0-10ppm, 0-1,00ppm [...] up to 0 - 20,000ppm
Accuracy ±1% of measurement range
Repeatability > 99%
Response time < 1 Second, continuous results
Operating Conditions Process temperature 0°C to 200°C
Process pressure 0-35 barg (180 barg optional)
Process flow 0-25 l/min (0 – 1000 l/min optional)
Operational ambient temperature -20°C to 55°C
Cleaning Ultrasonic (automatic)
Utilities Power supply 110 or 230 VAC (pre configured)
Power frequency 50/60 Hz
Power consumption 60W normal, 300W peak
Instrument air 5-8 barg (for pneumatic valve; electric valve option available)
Certification Ingress protection IP66
Enclosure material SS 316L or Aluminum
Hazardous Areas: Exd II 2 G IIB T4 ATEX, IECEx, Class 1 Div 1 (USA and Canada)
IMO MEPC-107 (49) IMO Certified, ABS, US Coast Guard, BV
Weight & Dimensions Weight (including stand, pneumatic steel valve assembly, Aluminium Enclosure: 93.55Kg termination box & isolation switch) Stainless Steel Enclosure: 141Kg
Dimensions 670W x 640D X 1120H mm (1112H mm for Aluminum enclosure)
Clear space 500mm front and rear
Mounting Optional stand or brackets
Communications 4-20 mA Passive
Ethernet Standard
HART, Modbus, Wireless (Wi-Fi), Extended Ethernet Optional
Remote access Standard
Internal data storage >10 years
Security Multiple level password protection
Additional Information Flange fitting 1” ANSI RF standard (optional flange, sizes available)
Wetted parts SS 316L(option of CR22, CR25, Monel, Inconel, Hastelloy, Titanium) Sample take off point Standard ½” NPT
Viewing window Standard
Sample Conditioning Maintenance None - Automatic Cleaning
Gas removal, solids removal, temp. conditioning, flow control Not Required
Spectrometer Specification (EX-1000 models only)
Emission wavelength range 400-1,100nm
Resolution 0.5nm

8 Meadowbank Road, Carrickfergus, BT38 8YF, Northern Ireland www.advancedsensors.co.uk
Page 90 of 93
OIW-HBO-0002-EX-005
OIW EX SERIES-SIDE STREAM
OPERATION MANUAL R e v . 0 0 4 M A Y 2 0 1 5
APPENDIX 2 – DECLARATION OF CONFORMITY
DECLARATION OF CONFORMITY We, the manufacturer declare under our sole responsibility that the products; Oil-in-Water Analyzer for Hazardous Areas;
Models EX-100, EX-1000, EX-100P, EX-1000P and EX-1000P2, to which this document relates, are in conformity with
the following;
DIRECTIVES:
Low Voltage Directive 72/23/EEC
EMC Directive 89/336EEC and 92/31/EEC STANDARDS:
EN 61010-1: 2010 Electrical Safety Requirements
EN 61326-1: 2006 Electrical Equipment for Measurement, Control & Laboratory use
EN 61000-4-2: 2009 Electromagnetic (EMC)
EN 61000-4-3: 2006 + A1:2007 + A2:2010 Radiated / Immunity tests
EN 61000-4-4: 2004 + A1:2010 Transient/Burst Immunity tests
EN 61000-4-5: 2006 Surge Immunity Tests
EN 61000-4-6: 2009 Conducted Disturbances Immunity
EN 61000-4-8: 2010 Power Frequency Magnetic Immunity
EN 61000-4-11: 2004 Voltage Dips, Variations, Interruptions Immunity. ADDITIONAL NORTH AMERICAN STANDARDS:
UL61010-1
ANSI/NFPA70 (NEC)
CAN / CSA C22.2 & 22.1
We hereby declare that the above named products are in conformity to the declared directives and standards. The
technical documentation is kept at the address below and is available for inspection.
R. Acheson, Quality Manager.

8 Meadowbank Road, Carrickfergus, BT38 8YF, Northern Ireland www.advancedsensors.co.uk
Page 91 of 93
OIW-HBO-0002-EX-005
OIW EX SERIES-SIDE STREAM
OPERATION MANUAL R e v . 0 0 4 M A Y 2 0 1 5
APPENDIX 3 – PRODUCT UPDATES (INSERT ANY UPDATES IN THIS SECTION)
A3.1 – VERSION 5.2 RELEASE NOTES A3.1.1 – Visual Changes
While there are no new features added to the V5.2 release there are some feature enhancements and with that, there
will be a new splash screen at the beginning of the software boot up process.
During the initialisation of the system the splash screen will show device detection messages.
A3.1.2 – Feature Enhancements
Upgrade from a previous V5 software release now requires no manual work around. The upgrade will be done
with the use of an installer. This allows seamless upgrade from any previous V5 software release to V5.2.
Due to the technical challenges involved, V4 software should not be upgraded to V5. Customers currently
running V4 software who wish to upgrade to V5.2 will be required to pay for the upgrade and any ASL technical
support required to resolve issues during upgrade. For more information please contact
In some of the previous V5 software releases the boot up process may have been slow and laboured. This
process is now much faster and with the addition of the “Device Detection Dialogue” the user can now see
what pieces of hardware within the system are currently being initialised. This can also aid in fault diagnosis,
as any piece of configured hardware which fails at the point will be highlighted.
Device Detection Dialogue
V5.2 Splash Screen

8 Meadowbank Road, Carrickfergus, BT38 8YF, Northern Ireland www.advancedsensors.co.uk
Page 92 of 93
OIW-HBO-0002-EX-005
OIW EX SERIES-SIDE STREAM
OPERATION MANUAL R e v . 0 0 4 M A Y 2 0 1 5
A3.1.3 – Issues Addressed
Erroneous log messages created during operation, boot up or upgrade which were misleading and/or incorrect
are now eliminated
In previous V5 releases a dual line system would not trigger a dry contact in a PPM over threshold situation for
Water line 2. Fixed.
In previous V5 releases related to Dual probe systems, both probes would “auto tune” but the frequency
allocated to Probe 1 would be used for both probes during cleaning. Fixed.
In previous V5 releases an independent calibration for each water line on an EX-100 Dual Stream was not
possible. Fixed.
The communication between the software and the spectrometer meant on occasion the system would lose
readings for a short period of time. Fixed.
Some internal code optimisation also carried out.

8 Meadowbank Road, Carrickfergus, BT38 8YF, Northern Ireland www.advancedsensors.co.uk
Page 93 of 93
OIW-HBO-0002-EX-005
OIW EX SERIES-SIDE STREAM
OPERATION MANUAL R e v . 0 0 4 M A Y 2 0 1 5