
User Guide T MAP - TIPS · ITC’s MARKET ANALYSIS SERVICES February 2004 User Guide TRADEMAP Trade...
44
ITC’s MARKET ANALYSIS SERVICES February 2004 User Guide TRADEM AP Trade statistics for international business development Market Analysis Section Division of Product and Market Development
Transcript of User Guide T MAP - TIPS · ITC’s MARKET ANALYSIS SERVICES February 2004 User Guide TRADEMAP Trade...

ITC’s MARKET ANALYSIS SERVICES
February 2004
User Guide TRADEMAP
Trade statistics for international business development
Market Analysis Section Division of Product and Market Development

ITC’S MARKET ANALYSIS SERVICES – TRADEMAP
International Trade Centre UNCTAD/WTO TradeMap Userguide English.doc
i
Table of Contents
I. Introduction ................................................................................................................................1 II. Product Approach ......................................................................................................................3
A. Assess the world market – Hazelnuts from Georgia ..............................................................3 B. Identify new export markets – Fish filets from Uganda ..........................................................7
1. Review exports to present partner countries ............................................................. 8 2. Identify the worlds leading importers .......................................................................10 3. Examine market access barriers in partner countries................................................12 4. Analyze competitor performance.............................................................................14
C. Identify new sources of supply – Refrigerators to Venezuela ............................................... 16 D. Scan potential for product diversification – Apparel from the Morocco.................................. 19
III. Country Approach ................................................................................................................... 22 A. Assess national trade performance – Romania .................................................................. 22 B. Bilateral Trade Potential – between Estonia and Finland..................................................... 30 C. TradeMap now includes regional and economic country groups .......................................... 34
1. Trousers exports from Egypt to the EU....................................................................35 IV. Summary ............................................................................................................................... 38
Tables
Table 1: List of importers for the selected product in 2002 ............................................................... 4 Table 2: List of exporters for the selected product in 2002 ............................................................... 5 Table 3: List of importing markets for a product exported by Uganda in 2002 .................................... 8 Table 4: List of importers for the selected product in 2002 ............................................................. 10 Table 5: List of products for which Information on tariff and non-tariff barriers for the United Kingdom
is available .......................................................................................................................... 12 Table 6: Tariff (2001) and non-tariff (1999) barriers reported by United Kingdom............................. 13 Table 7: List of supplying markets for a product imported by United Kingdom in 2002 ..................... 14 Table 8: List of supplying markets for a product imported by Venezuela in 2002 ............................. 16 Table 9: List of supplying markets for a product imported by Cyprus in 2002................................... 19 Table 10: List of products imported by Cyprus in 2002 .................................................................. 21 Table 11: List of product groups exported by Romania in 2002, HS 2............................................. 23 Table 12: List of products exported by Romania in 2002, HS 4 ...................................................... 24 Table 13: The leading products exported by Romania in 2002, HS 6.............................................. 27 Table 14: Existing and potential trade between Estonia and Finland in 2002, HS 2 ......................... 30 Table 15: Existing and indicative potential trade between Estonia and Finland in 2002, HS 6........... 32 Table 16: Existing and indicative potential trade between Egypt and European Union (EU) in 2002.. 35 Table 17: List of importing markets for a product exported by Slovenia in 2002 ............................... 40 Table 18: List of importing markets for a product exported by Slovenia in 2002, .............................. 40
Charts
Chart 1: Prospects for diversification of suppliers for a product imported by Venezuela in 2002........18 Chart 2: Growth of national supply and international demand for export products of Romania in 2002,
HS 4...................................................................................................................................26 Chart 3: Growth of national supply and international demand for the twenty leading Romanian exports
in 2002 ...............................................................................................................................29 Chart 4: Potential trade between Egypt and European Union (EU) in 2002 .....................................37
Annex
Annex I: Foreign Trade Statistics as a Basis for Strategic Market Research..................................... 39

ITC’S MARKET ANALYSIS SERVICES – TRADEMAP
International Trade Centre UNCTAD/WTO ii
Abbreviations CIF Cost, insurance and freight FOB Free on board HS Harmonized System ITC International Trade Centre UNCTAD/WTO LDCs Least developed countries m. million MFN Most Favored Nation p.a. per annum SACU Southern African Customs Union SITC Standard International Trade Classification TSI Trade Support Institution UNCTAD United Nations Conference on Trade and Development UNSD United Nations Statistics Division WTO World Trade Organization Note: Please note that the statistics in TradeMap undergo annual updates, as well as updates throughout the year as new information becomes available. These updates may generate varying figures or trends from what is seen in this User Guide, however the principles and applications of TradeMap remain the same. Please contact [email protected] for more information or assistance.

ITC’S MARKET ANALYSIS SERVICES – TRADEMAP
International Trade Centre UNCTAD/WTO 1
• What are priority markets and products for trade promotion? • What countries supply the majority of my country’s imports? What alternative sources of supply are available? • In what areas does my country have a competitive advantage? • What is my country’s current trade performance? • For what products is there potential to increase bilateral trade?
• What are the trade flows between my country and a specific regional or
economic group?
• What is the structure of the world market for a product? What are the trends? • With which countries does my country currently trade? • Where are opportunities for market diversification? • What tariff and non-tariff barriers to access exist in a specific market? • Which countries are competing in a specific market and globally?
I. Introduction Understanding the structure and evolution of international markets is essential for both firms and trade support institutions (TSIs). As outwardly oriented firms scan the world market for opportunities to diversify products and markets, as well as suppliers, they are confronted with the following questions:
TSIs need to set priorities in terms of trade promotion, sectoral performance, partner countries and trade development strategies to utilize resources effectively. Strategic market research with detailed statistical information on international trade flows helps them gauge the competitiveness of national and sectoral trade performance and identify priority products and markets for trade development by addressing the following types of questions:
TradeMap was developed by the International Trade Centre UNCTAD/WTO (ITC) to answer these and related questions with the explicit objectives of facilitating strategic market research, monitoring both national and product-specific trade performance, revealing comparative and competitive advantage, identifying the potential for market or product diversification and designing and prioritizing trade development programs for both firms and trade support institutions. By transforming the large volume of primary trade data into an accessible, user-friendly, and interactive Web-based format, TradeMap provides users with indicators on country or product performance, demand, alternative markets and the role of competitors. It presents information in both tables and charts, and allows queries based on product, country, and/or partner country for exports or imports.

ITC’S MARKET ANALYSIS SERVICES – TRADEMAP
International Trade Centre UNCTAD/WTO 2
The information contained in TradeMap is based on the world’s largest database of trade statistics, COMTRADE, maintained by the United Nations Statistics Division (UNSD). COMTRADE covers more than 90% of world trade, allowing TradeMap to include over 200 countries and territories and 5,300 products defined at the 2-, 4- or 6-digit level of the Harmonized System (HS). Data is available not only for countries that report their own trade data, but also for the over one hundred primarily low-income countries that do not report national trade statistics to COMTRADE. The trade of these countries has been reconstructed on the basis of partner country data or mirror statistics. Although using mirror statistics has its shortcomings (see Annex I), it does generate a wealth of information, which would otherwise be unavailable. This mix of direct and mirror statistics gives the best estimation of the worldwide market for all products. In addition, TradeMap contains information on tariff and non-tariff barriers for more than 100 countries (the number is growing, check TradeMap to find out) and provides detailed information on bilateral market access conditions across products and countries, including ad valorem and specific tariffs, tariff quotas and anti-dumping measures. TradeMap is now available to interested uses in a number of countries via local Trade Support Institutions or Export Development Agencies. A full list of countries partners can be found at www.trademap.org. For users in countries not yet served by a partner, TradeMap is available on a subscription basis and a customized version is available for trade support institutions in English, French or Spanish. For customized sites, a special password-protected Internet site for subscribers allows multiple connections by larger user groups. Individual partners can access the application directly on a subscription basis. For further information please email ITC at: [email protected].
TradeMap home page www.trademap.org

ITC’S MARKET ANALYSIS SERVICES – TRADEMAP
International Trade Centre UNCTAD/WTO 3
What is the structure of the world market for a product?
What are the trends?
II. Product Approach The two main approaches to using TradeMap are by product and by country. The product perspective allows users to analyze the market for a specific product including the structure of the market, and trends in supply and demand, the opportunities for diversifying into alternative markets or away from traditional sources of supply, and the potential for product diversification within current product-specific trade promotion strategies. This section describes the product approach by applying it in answering a series of specific questions on products from the perspective of Trade Support Institutions (TSIs) and Exporters.
A. Assess the world market – Hazelnuts from Georgia
A TSI in Azerbaijan assisting exporters of Hazelnuts may begin by viewing the world import market for this product. By choosing Hazelnuts or filberts, fresh or dried, shelled or peeled 080222 (above) as the product under review and selecting ‘Import’, a list of the world’s importers of this product is generated (Table 1).

ITC’S MARKET ANALYSIS SERVICES – TRADEMAP
International Trade Centre UNCTAD/WTO 4
Table 1: List of importers for the selected product in 2002
Product : 080222 Hazelnuts or filberts, fresh or dried, shelled or peeled
Importers Value imported in 2002, in US$
thousand
Quantity imported in
2002 Quantity
unit Unit value (US$/unit)
Annual growth in value between 1998-2002, %
Annual growth in quantity between
1998-2002, %
Annual growth in value between 2001-2002, %
Share in world
imports, %
Information on tariff and non-tariff barriers
World estimation
544,634 222,119 Tons 2,452 -8 6 -11 100
Germany 172,794 72,547 Tons 2,382 -10 3 -12 31 TNTB
Italy 97,672 42,058 Tons 2,322 1 19 27 17 TNTB
France 50,360 20,120 Tons 2,503 -10 3 -9 9 TNTB
Switzerland 33,249 11,399 Tons 2,917 -11 -1 -26 6 TNTB
Belgium-Luxembourg 28,450 11,873 Tons 2,396 -5 9 -46 5 TNTB
United States of America 17,973 6,309 Tons 2,849 -5 6 -3 3 TNTB
Poland 13,209 5,476 Tons 2,412 -1 14 8 2 TNTB
Spain 12,878 5,747 Tons 2,241 -5 9 -19 2 TNTB
Austria 9,219 3,603 Tons 2,559 -16 -9 -18 1 TNTB
Netherlands 8,945 3,486 Tons 2,566 -3 9 -14 1 TNTB
Greece 7,969 3,530 Tons 2,258 -1 14 -30 1 TNTB
United Kingdom 6,596 2,444 Tons 2,699 -17 -7 -13 1 TNTB
Australia 5,801 2,235 Tons 2,596 -6 6 -11 1 TNTB Source: ITC calculations based on COMTRADE statistics
Next List of exporting countries List of importing regions Selection menu Help
One of the unique features of TradeMap is the inclusion of the World estimation, the first line of Table 1, which represents the sum of reporting and non-reporting countries for 080222 Hazelnuts or filberts, fresh or dried, shelled or peeled (abbreviated as Hazelnuts below) and gives an overall impression of the world import market. Table 1 shows the world import market for Hazelnuts has a value of US$ 545 million in 2002 with a decrease in value of 8% p.a. over the 1998 to 2002 period and a decrease in value of 11% over the 2001-2002 period. We can see also that the market is predominantly concentrated in Europe, with European markets representing over 75% of world import demand. The only significant non-European markets are the United States of America and Australia, which together represent less than 5%. The difference between the average growth rate in the value of imports (-8%) and the average growth rate in the quantity of imports (6%) clearly shows a decline in the world price of Hazelnuts. To assess those countries that compete with Georgia in the export of Hazelnuts, the TSI would click on List of exporting countries at the bottom of Table 1, and a list of exporters for Hazelnuts is generated (see Table 2).

ITC’S MARKET ANALYSIS SERVICES – TRADEMAP
International Trade Centre UNCTAD/WTO 5
Table 2: List of exporters for the selected product in 2002
Product : 080222 Hazelnuts or filberts, fresh or dried, shelled or peeled
Exporters Value exported in
2002, in US$ thousand
Quantity exported in
2002 Quantity
unit Unit value (US$/unit)
Annual growth in value between 1998-2002, %
Annual growth in quantity between
1998-2002, %
Annual growth in value between 2001-2002, %
Share in world
exports, %
Report in Comtrade in
2002
World estimation
500,013 212,820 Tons 2,349 -7 7 -16 100
Turkey 369,051 161,181 Tons 2,290 -8 7 -24 73 Y
Italy 64,110 22,925 Tons 2,797 -8 2 59 12 Y
Azerbaijan 13,816 7,131 Tons 1,937 -2 3 44 2 Y
Spain 10,433 4,063 Tons 2,568 -13 -1 4 2 Y
Germany 8,769 3,030 Tons 2,894 -7 2 4 1
France 7,244 2,723 Tons 2,660 23 41 80 1 Y
Netherlands 5,787 2,013 Tons 2,875 8 22 -24 1 Y
Georgia 4,085 2,541 Tons 1,608 9 35 -35 0
United States of America 1,774 526 Tons 3,373 -26 -28 -52 0 Y
Hong Kong (re-exports) 1,130 1,444 Tons 783 69 114 15 0 Y
Austria 924 286 Tons 3,231 -29 -23 108 0 Y
Poland 911 335 Tons 2,719 244 0 Y Source: ITC calculations based on COMTRADE statistics
Next List of importing countries List of exporting regions Selection menu Help
Table 2 shows the world export market for Hazelnuts. The TSI can see that Georgian exporters command slightly less than a 1% share in world exports and the value of those exports has grown 9% p.a., while the world market has experienced a decline in value of 7% p.a. during the period 1998-2002 (See below and Annex 1 for more discussion on why this differs slightly from the import number). We also see that the growth of Georgia’s quantity exported over the period from 1998-2002 increased 35% p.a., faster than its growth in exported value, indicating a fall in average prices in US dollars. Turkey is the largest exporter of Hazelnuts with 73% of the world market. The reduction of 8% p.a. in the value of Turkey’s exports during the 5-year period, contrasted with the increase in quantity of Turkish exports increased by 7% p.a. over the same period, clearly shows a reduction in the price in US dollars of Turkish Hazelnut exports. Another noticeable aspect of the two tables is the significant difference between the World estimation for exports (at the top of Table 2) and the World Estimation for imports (shown at the top of Table 1). This difference is common, and results primarily from the difference between the way countries report exports, generally reported in Free On Board (FOB) terms, and the way countries report imports, generally reported in Cost Insurance and Freight (CIF) terms. For more on how import and export statistics can differ and on the interpretation of trade statistics in general, see Annex I, Foreign Trade Statistics as a Basis for Market Research.

ITC’S MARKET ANALYSIS SERVICES – TRADEMAP
International Trade Centre UNCTAD/WTO 6
Explanatory Notes for Table 1 and Table 2 Importers (Exporters): Country names are sorted by imported (exported) value. Imported (Exported) value in 2002, in US$ thousand: Value imported (exported) in 2002 in current US$ thousand as reported by countries to the COMTRADE database or as calculated with mirror statistics. Quantity imported (exported) 2002: Quantity imported (exported) in 2002. Quantity unit: The unit in which quantities are reported. Unit value: Price in US$ per unit. Annual growth in value between 1998-2002 p.a. of imports (exports) as a percentage: This trend is calculated using the least squares method. If a country does not report trade data in 2002, the trend calculation is based on mirror statistics. No trend is calculated in cases where the reporting country data is not available for at least a four-year period. Annual growth in quantity between 1998-2002 p.a. of imports (exports) as a percentage: This trend is calculated by the same method used in the calculation of the annual value trends. Annual growth in value between 2001-2002 p.a. of imports (exports) as a percentage: This growth rate is a good complement to the 5-year trend, indicating whether growth trends have been stable or volatile over the 5 years and showing the country performance over the last two years. Market share in world imports (exports) as a percentage: Share of import (export) market for 2002. This indicator takes into account all countries, whether or not they have reported. Table 1 Information on tariff and non-tariff barriers: Information on tariff and non-tariff barriers at the tariff-line level (i.e. 6-, 8-, or 10-digits depending on the country). Table 2 Report in COMTRADE: The "Y" for ‘yes’ indicates which countries have reported their trade data to the COMTRADE database in 2002. If there is no entry, that country did not report and the data are based on mirror statistics.
ITC’S MARKET ANALYSIS SERVICES – TRADEMAP
International Trade Centre UNCTAD/WTO 7
What are priority markets for trade promotion?
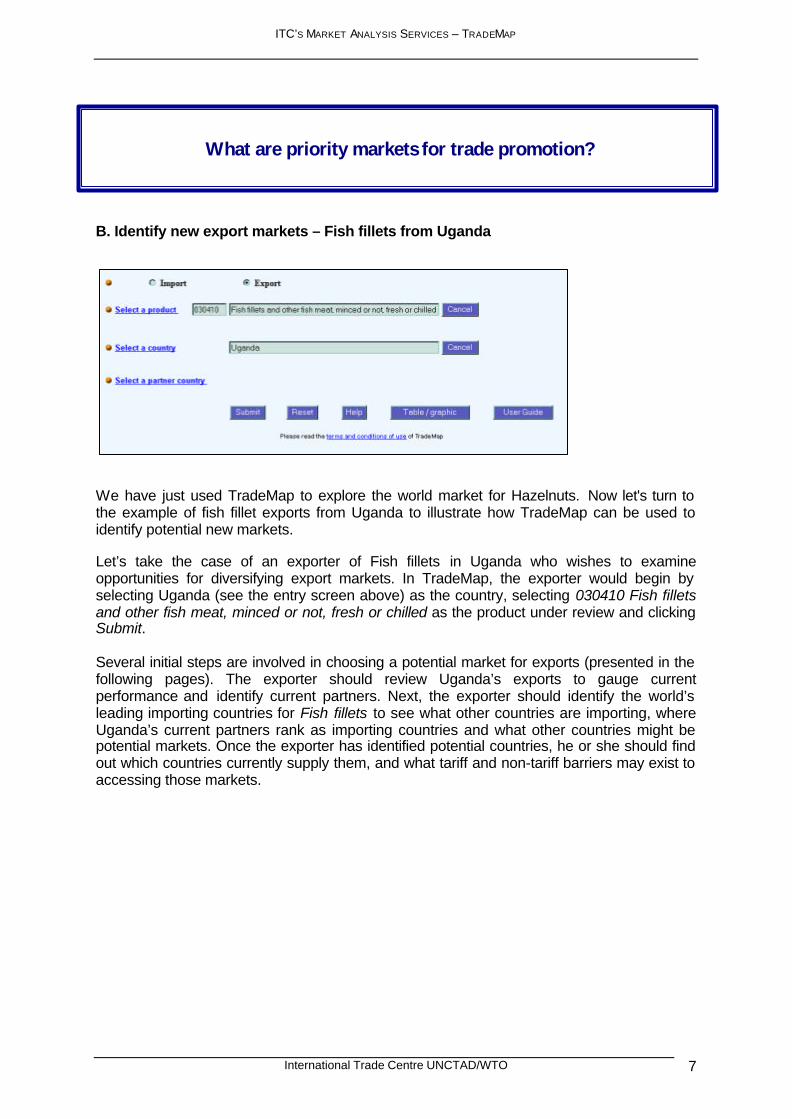
B. Identify new export markets – Fish fillets from Uganda
We have just used TradeMap to explore the world market for Hazelnuts. Now let's turn to the example of fish fillet exports from Uganda to illustrate how TradeMap can be used to identify potential new markets. Let’s take the case of an exporter of Fish fillets in Uganda who wishes to examine opportunities for diversifying export markets. In TradeMap, the exporter would begin by selecting Uganda (see the entry screen above) as the country, selecting 030410 Fish fillets and other fish meat, minced or not, fresh or chilled as the product under review and clicking Submit. Several initial steps are involved in choosing a potential market for exports (presented in the following pages). The exporter should review Uganda’s exports to gauge current performance and identify current partners. Next, the exporter should identify the world’s leading importing countries for Fish fillets to see what other countries are importing, where Uganda’s current partners rank as importing countries and what other countries might be potential markets. Once the exporter has identified potential countries, he or she should find out which countries currently supply them, and what tariff and non-tariff barriers may exist to accessing those markets.

ITC’S MARKET ANALYSIS SERVICES – TRADEMAP
International Trade Centre UNCTAD/WTO 8
With which countries does my country currently trade?
1. Review exports to present partner countries As a first step, the Ugandan exporter of Fish fillets could use TradeMap to see which countries import Fish fillets from Uganda. In order to do so, the exporter would select Uganda as the country, 030410 Fish fillets and other fish meat, minced or not, fresh or chilled (abbreviated Fish fillets below) as the product, and Export. This provides Table 3: List of importing markets for a product exported by Uganda in 2002. From Table 3, the exporter can immediately see that world estimated imports from Uganda of Fish fillets amounted to almost US$ 37 million. Belgium is Uganda’s largest import market consuming 48% of its exports of Fish fillets, but consumes only 5% of total world exports and is ranked 5th among the world’s importers. On the other hand, the United States of America (USA) is only the 5th leading importer from Uganda with a 2% share of Uganda’s Fish fillets exports and yet is the number one importing market in the world commanding a 45% share of world imports. We see also that Uganda’s exports to the USA have declined over the 1998-2002 period by 35% p.a., while the USA’s imports from the world have increased 17% p.a. We also see that for the 7th largest importer, the United Kingdom, imports of Fish fillets from Uganda grew at 66% p.a. over the 1998-2002 period. The United Kingdom consumed 3% of the world’s total imports of Fish fillets, but its imports from Uganda, only US$ 47,000, represented less than 1% of Ugandan exports.
Table 3: List of importing markets for a product exported by Uganda in 2002
Product : 030410 Fish fillets and other fish meat, minced or not, fresh or chilled Uganda's exports represent 2% of world exports for this product, its ranking in world exports is 11
Importers
Exported value 2002
in US$ thousand
Share in Uganda's exports, %
Exported quantity
2002
Quantity unit
Unit value (US$/unit)
Export trend in value between
1998-2002, %, p.a.
Export trend in quantity between
1998-2002, %, p.a.
Export growth in
value between
2001-2002, %, p.a.
Ranking of partner
countries in world
imports
Share of partner
countries in world
imports, %
Total import growth in value
of partner countries
between 1998-2002, %, p.a.
World 36,818 100 9,202 Tons 4,001 10 26 18 9
Belgium-Luxembourg 17,535 48 4,308 Tons 4,070 45 35 78 5 5 6
Netherlands 9,406 26 2,333 Tons 4,032 -5 13 -21 6 4 27
Spain 5,344 15 1,416 Tons 3,774 82 8 3 4
Italy 2,652 7 661 Tons 4,012 -12 4 5 12
United States of America 836 2 228 Tons 3,667 -35 31 -35 1 45 17
United Arab Emirates 619 2 123 Tons 5,033 35 6 50 26 0 47
Germany 88 0 23 Tons 3,826 -84 2 7 -4
Egypt 71 0 30 Tons 2,367 -38 57 0 -33
Australia 68 0 32 Tons 2,125 28 0 2
United Kingdom
47 0 13 Tons 3,615 66 -94 7 3 17
Source: ITC calculations based on COMTRADE statistics Partner regions
Supplying markets
Importing markets (HS4)
Product clusters (HS6) exported by Uganda
Product clusters (HS4) exported by Uganda
World exporters
World importers
Mirror data
Selection menu
Bubble graph Help

ITC’S MARKET ANALYSIS SERVICES – TRADEMAP
International Trade Centre UNCTAD/WTO 9
The selection menu at the bottom of Table 3 gives the option of viewing the data in a variety of other ways including by Partner regions as well as partner countries, by Supplying markets a list of those markets that supply Fish fillets to Uganda, Importing markets (HS4) at the HS 4-digit level, Product clusters (HS6) exported by Uganda at the HS 6-digit level, Product clusters (HS4) exported by Uganda at the HS 4-digit level, or World exporters or World importers of Fish fillets. Finally it also offers the option to view Table 3 as reported by partner country imports (Mirror data) and the ability to create a chart with the data (Bubble graph), which will be described in detail later.
Explanatory Notes for Table 3
Importers: Country names are sorted by exported value. Exported value 2002, in US$ thousand: Value exported in 2002 in US$ thousand as reported by the selected country or as reported by the partner country (when the selected country does not report trade data). Share in Uganda’s exports, %: Share of partner countries in the exports of the target country. Exported quantity, 2002: Quantity exported in 2002. Where mirror statistics are used, quantity may differ among reporting countries. Quantity unit: The unit in which quantities are reported. Unit value (US$/unit): Price in US$ per unit. Export trend in value between 1998-2002, %, p.a.: This trend is calculated using the least squares method. If a country does not report trade data in 2002, the trend calculation is based on mirror statistics. No trend is calculated in cases where the reporting country data is not available for at least a four-year period. Export trend in quantity between 1998-2002, %, p.a.: This trend is calculated by the same method used in the calculation of the annual value trends. It is interesting to compare growth in value and growth in quantity to have an indication of the growth of prices in US$. Export growth in value between 2001-2002, %, p.a.: This growth is a good complement to the 5-year trend, indicating whether growth trends have been stable or volatile over the 5 years and showing the country performance over the last two years. Ranking of partner countries in world imports: This indicates the world ranking of the partner country as an importer in 2002. Share of partner countries world imports, %: This indicates the world share that the partner country represents as an importer of the selected product. Total import growth in value of partner countries between 1998-2002,%, p.a.: This indicates the global import growth of the partner country from the world for the selected product. This indicator is calculated on data as reported by the target market. This combined with the export trend in value, calculated above, allow the analyst to see how the market share of the country under review has changed in the partner country.

ITC’S MARKET ANALYSIS SERVICES – TRADEMAP
International Trade Centre UNCTAD/WTO 10
Where are opportunities for market diversification?
2. Identify the world’s leading importers Now that the Ugandan exporter of Fish fillets has an idea of Uganda’s current partners and how they rank in its exports, he or she can use TradeMap to identify the major importing markets of the world. In order to do so, the exporter would click on World importers at the bottom of Table 3 in order to generate Table 4: List of importers for the selected product in 2002.
Table 4: List of importers for the selected product in 2002
Product : 030410 Fish fillets and other fish meat, minced or not, fresh or chilled
Importers Value imported in
2002, in US$ thousand
Quantity imported in
2002
Quantity unit
Unit value (US$/unit)
Annual growth in value
between 1998-2002, %
Annual growth in quantity
between 1998-2002, %
Annual growth in value
between 2001-2002, %
Share in world
imports, %
Information on tariff and non-tariff barriers
World estimation
1,762,749 340,884 Tons 5,171 9 7 4 100
United States of America 807,765 137,652 Tons 5,868 17 21 8 45 TNTB
Germany 140,607 46,348 Tons 3,034 -4 -6 -21 7 TNTB
France 132,844 24,628 Tons 5,394 -5 -5 7 7 TNTB
Italy 103,355 18,175 Tons 5,687 12 15 18 5 TNTB
Belgium-Luxembourg
91,097 16,484 Tons 5,526 6 8 18 5 TNTB
Netherlands 81,034 16,252 Tons 4,986 27 17 30 4 TNTB
United Kingdom 68,323 10,223 Tons 6,683 17 16 -12 3 TNTB
Spain 59,179 10,744 Tons 5,508 4 3 -1 3 TNTB
Switzerland 56,631 6,708 Tons 8,442 -1 1 2 3 TNTB
Sweden 48,933 10,102 Tons 4,844 13 15 40 2 TNTB
Japan 45,496 5,382 Tons 8,453 -2 -7 -11 2 TNTB
Canada 28,711 5,629 Tons 5,101 30 28 1 1 TNTB Source: ITC calculations based on COMTRADE statistics
Next List of exporting countries List of importing regions Selection menu Help
Table 4 shows those countries in the world that import Fish fillets, the value and quantity imported, unit of measurement, unit value, growth rate, global market share and provides a link to tariff and non-tariff barrier information for each country listed. As the United Kingdom is a growing market, registering 17% growth in value p.a. over the 5-year period, it could be an interesting prospect for the Ugandan exporter. However, in noting the negative growth rate in value (-12%) over the 2001-2002 period, caution should be applied to the interpretation of the 5-year rate, as the 12% p.a. decline may signal either a downturn in the coming year or that the 5-year trend is volatile (see Annex 1). By clicking on the United Kingdom or any other importer on this chart, the exporter can view the list of countries that supply the United Kingdom. This process is not shown here, but is discussed later in the User Guide as Table 7: List of supplying markets for a product imported by United Kingdom in 2002.

ITC’S MARKET ANALYSIS SERVICES – TRADEMAP
International Trade Centre UNCTAD/WTO 11
Explanatory Notes for Table 4 Importers: Country names are sorted by imported value. Value imported in 2002, in US$ thousand: These figures are as reported by countries to the COMTRADE database or as calculated using mirror statistics. Quantity imported in 2002: As labeled. Where mirror statistics are used for a given country, if reporting countries use differing quantities, no value will be shown. Quantity unit: The unit in which quantities are reported. Unit value (US$/unit): Price in US$ per unit. Annual growth in value between 1998-2002, %: This trend is calculated using the least squares method. If a country did not report trade data in 2002, the trend calculation is based on mirror statistics. In cases where reporting country data is not available for at least a four-year period, TradeMap does not calculate the trend and the cell is blank. Annual growth in quantity between 1998-2002, %: This trend is also calculated using the least squares method. Annual growth in value between 2001-2002, %: This growth is a good complement to the 5-year trend, indicating whether growth trends have been stable or volatile over the 5 years and showing country performance over the last two years. Share in World Imports, %: Share in world imports for 2002. This indicator takes into account all countries, whether or not they have reported. Information on tariff and non-tariff barriers: Provides a link to information on tariff and non-tariff barriers at the tariff-line level (i.e. 6-, 8-, or 10-digits depending on the country) for the selected partner country.

ITC’S MARKET ANALYSIS SERVICES – TRADEMAP
International Trade Centre UNCTAD/WTO 12
What tariff and non-tariff barriers to access exist in a specific market?
3. Examine market access barriers in partner countries TradeMap also contains information on tariff and non-tariff barriers at the tariff-line level covering tariffs, para-tariffs, price controls, finance measures, automatic licensing measures, quantity controls, monopolistic measures and technical measures. This information allows the analyst to gauge access conditions for any potential market. In order to access this information, the exporter would first click on TNTB in Table 4 for the desired country, in this case the United Kingdom. This will generate Table 5. Table 5 provides a list of products for which TradeMap contains data on tariff and non-tariff barriers for the selected market. The product codes in this table correspond to the national tariff schedule of the importing country, in this case the European Union tariff schedule as applied in the United Kingdom.
Table 5: List of products for which Information on tariff and non-tariff barriers for the United Kingdom is available
Product Code Product Description 0304101110 Trout (Salmo gairdneri) 0304101190 Other 0304101311 Wild 0304101321 Whole fish fillets, more than 300 g each 0304101329 Other fish fillets or fillet portions, 300 g or less each 0304101390 Other 0304101920 Of eels (Anguilla spp) 0304101930 Of carp 0304101940 Of trout (Oncorhynchus apache and Oncorhynchus chrysogaster)
Next List of supplying markets in United Kingdom World exporters World importers
Selection menu
By selecting product code 030410321 Whole fish fillets, more than 300g each from Table 5, the exporter generates Table 6 showing tariff and non-tariff barriers reported by the United Kingdom for this product. For cases in which the national tariff lines correspond exactly to the HS-6 digit product code, the list appearing in Table 5 is unnecessary, and TradeMap will proceed directly to the information on market access barriers shown below as Table 6. Table 6 indicates that the Ugandan exporter is faced with an MFN duty of 2% on Whole fish fillets, more than 300 g each, but, because Uganda is among the group of African, Caribbean and Pacific (ACP) countries as designated by the European Union, it benefits from a preferential trade agreement and is actually subject to zero tariff. The exporter may also obtain more detailed notes on access barriers in the selected country by selecting Country notes, at the bottom of Table 5. The notes cover all products and give such information as duration of the barrier, country coverage, special provisions, rules of origin and beneficiary countries. Selecting Explanatory notes will give more in-depth definitions of the terminology used in TradeMap to classify access barriers.

ITC’S MARKET ANALYSIS SERVICES – TRADEMAP
International Trade Centre UNCTAD/WTO 13
Table 6: Tariff (2001) and non-tariff (1999) barriers reported by United Kingdom
for product: 0304101321 Whole fish fillets, more than 300 g each
Tariffs and non-tariff measures Tariff ad-valorem
Tariff specific
Agreement with the following countries
Non-tariff measures or product description
MFN duties (Applied) 2%
Preferential tariff for Least Developed Countries 0%
Everything But Arms 0%
Preferential tariff for Overseas Countries and Territories
0%
Preferential tariff for EEA countries 2%
Preferential tariff for ACP countries 0%
Preferential tariff for countries fighting drug 0%
Preferential tariff for Morocco 0%
Preferential tariff for Tunisia 0%
Preferential tariff for Algeria 0%
Preferential tariff for Andorra 0%
Preferential tariff for Cyprus 0%
Preferential tariff for Turkey 0%
Preferential tariff for Macedonia 0%
Preferential tariff for Mexico 0%
Preferential tariff for Croatia 0% Source: National data reported to UNCTAD (TRAINS) and ITC (Market Access Map) Note: Please refer to explanatory notes concerning tariff definitions.
List of supplying markets i n United Kingdom World exporters World importers Selection menu Country notes Explanatory notes

ITC’S MARKET ANALYSIS SERVICES – TRADEMAP
International Trade Centre UNCTAD/WTO 14
Which countries are competing in a specific market and globally?
4. Analyze competitor performance Next, the exporter should proceed to gathering more information on those countries that supply Fish fillets to the United Kingdom market by clicking on List of supplying markets in United Kingdom in Table 6. The resulting list is shown below as Table 7. One can also obtain a list of supplying markets for an importing country by selecting the country name in any of the importer lists produced by TradeMap (for example Table 1 or Table 3). The table of supplying markets for a product imported by a country allows the exporter in Uganda to identify the major providers of this product to the United Kingdom, such as Iceland with 57% of the United Kingdom market. The table will also show if this market is already importing from any of Uganda’s neighbors, which could mean easier penetration for its exporters. In this case, however, it is evident that the top suppliers of Fish fillets to this market are largely neighboring European countries and Asian countries. Once the Ugandan exporter knows in which countries the main competitors operate, he or she should research what sorts of advantages those competitors may have, e.g. logistics, treaties, political ties, etc. In this case, Iceland is the predominant supplier, which can probably be explained by its proximity.
Table 7: List of supplying markets for a product imported by United Kingdom in 2002
Product : 030410 Fish fillets and other fish meat, minced or not, fresh or chilled United Kingdom's imports represent 3% of world imports for this product, its ranking in world imports is 7
Exporters
Imported value 2002 in
US$ thousand
Share in United
Kingdom's imports, %
Imported quantity
2002
Quantity unit
Unit value (US$/unit)
Import trend in value between
1998-2002, %, p.a.
Import trend in quantity between
1998-2002, %, p.a.
Import growth in
value between
2001-2002, %, p.a.
Ranking of partner countries in world exports
Share of partner
countries in world
exports, %
Total export growth in value
of partner countries
between 1998-2002, %, p.a.
World 68,323 100 10,223 Tons 6,683 17 16 -12 9
Iceland 38,609 57 4,838 Tons 7,980 22 25 9 6 5 11
Sri Lanka 9,464 14 1,749 Tons 5,411 64 54 34 88 0
Indonesia 4,051 6 566 Tons 7,157 27 22 14 22 0 13
United States of America 2,230 3 344 Tons 6,483 34 29 8 17 1 15
Maldives 2,136 3 278 Tons 7,683 95 73 23 79 0
Denmark 1,983 3 368 Tons 5,389 75 47 -73 3 10 -1
Norway 1,899 3 425 Tons 4,468 52 34 76 5 6 -5
Faroe Islands 1,521 2 326 Tons 4,666 -38 -37 -34 30 0 -31
Seychelles 1,467 2 179 Tons 8,196 18 19 19
France 1,386 2 248 Tons 5,589 8 27 -61 14 1 -5
Chile 790 1 348 Tons 2,270 13 40 -45 1 23 18
Ecuador 584 1 78 Tons 7,487 -22 -27 -48 12 1 50 Source: ITC calculations based on COMTRADE statistics
Next Trade barriers
Partner regions
Importing markets
Supplying markets (HS4)
Product clusters (HS6) imported by United Kingdom
Product clusters (HS4) imported by United Kingdom
World exporters
World importers
Mirror data
Selection menu
Bubble graph Help

ITC’S MARKET ANALYSIS SERVICES – TRADEMAP
International Trade Centre UNCTAD/WTO 15
Explanatory Notes for Table 7 Exporters: Partner name sorted by exported value. Imported value in 2002 in US$ thousand: This figure is as reported by the selected country or as reported by the partner country, when the selected country does not report trade data. Share in partner country’s imports, %: Share of partner countries in the imports of the target country in 2002. Imported quantity 2002: As labeled. Where mirror statistics are used, units may differ according to unit used by reporting countries. Quantity unit: The unit in which quantities are reported. Unit value (US$/unit): Price in US$ per unit. Import trend in value between 1998-2002, %, p.a.: This trend is calculated using the least squares method. No trend is calculated in cases where the reporting country data is not available for at least a four-year period. Import trend in quantity between 1998-2002 %, p.a.: This trend is also calculated using the least squares method. Import growth in value between 2001-2002 %, p.a.: This growth is a good complement to the 5-year trend, indicating whether growth trends have been stable or volatile over the 5 years. Ranking of partner countries in world exports: The world ranking of the partner country as an exporter in 2002. Share of partner countries in world exports, %: Market share for the partner country in 2002. Total export growth in value of partner countries between 1998-2002 %, p.a.: The growth in value of exports of the partner country to the target country over the period. This should not be confused with an increase in market share.
ITC’S MARKET ANALYSIS SERVICES – TRADEMAP
International Trade Centre UNCTAD/WTO 16
What countries supply the majority of my country’s imports?
What alternative sources of supply are available?
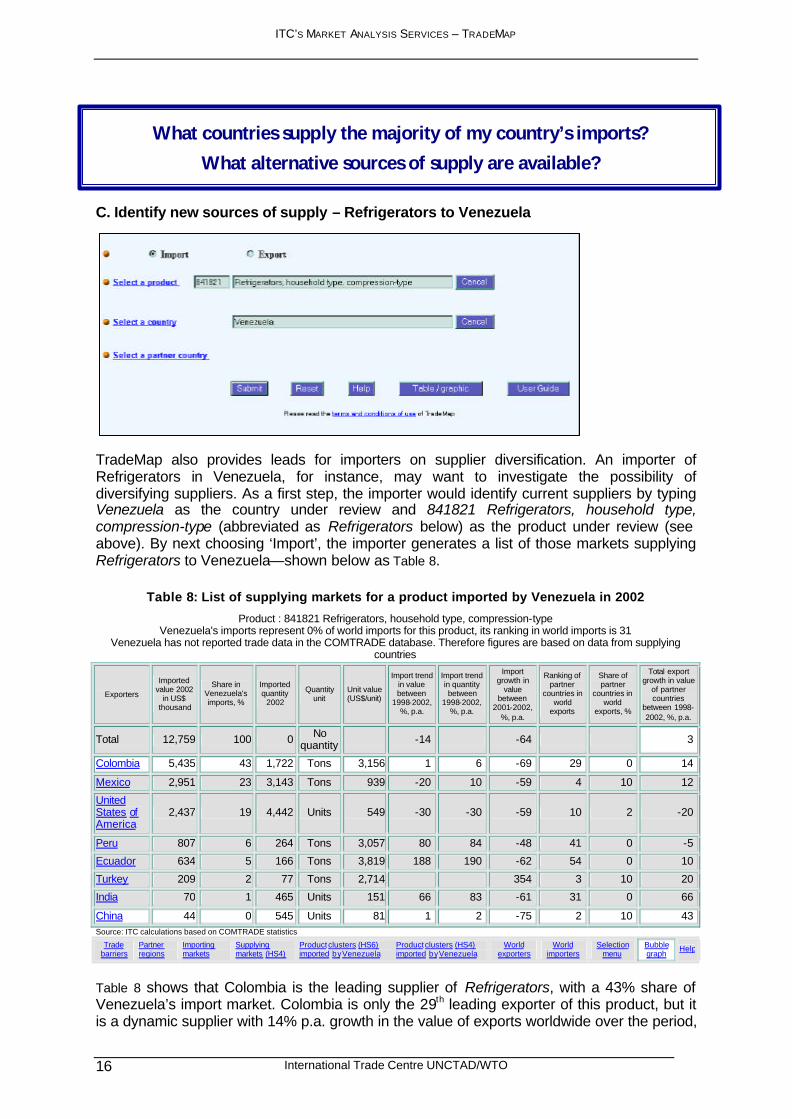
C. Identify new sources of supply – Refrigerators to Venezuela
TradeMap also provides leads for importers on supplier diversification. An importer of Refrigerators in Venezuela, for instance, may want to investigate the possibility of diversifying suppliers. As a first step, the importer would identify current suppliers by typing Venezuela as the country under review and 841821 Refrigerators, household type, compression-type (abbreviated as Refrigerators below) as the product under review (see above). By next choosing ‘Import’, the importer generates a list of those markets supplying Refrigerators to Venezuela—shown below as Table 8.
Table 8: List of supplying markets for a product imported by Venezuela in 2002
Product : 841821 Refrigerators, household type, compression-type Venezuela's imports represent 0% of world imports for this product, its ranking in world imports is 31
Venezuela has not reported trade data in the COMTRADE database. Therefore figures are based on data from supplying countries
Exporters
Imported value 2002
in US$ thousand
Share in Venezuela's imports, %
Imported quantity
2002
Quantity unit
Unit value (US$/unit)
Import trend in value between
1998-2002, %, p.a.
Import trend in quantity between
1998-2002, %, p.a.
Import growth in
value between
2001-2002, %, p.a.
Ranking of partner
countries in world
exports
Share of partner
countries in world
exports, %
Total export growth in value
of partner countries
between 1998-2002, %, p.a.
Total 12,759 100 0 No quantity -14 -64 3
Colombia 5,435 43 1,722 Tons 3,156 1 6 -69 29 0 14
Mexico 2,951 23 3,143 Tons 939 -20 10 -59 4 10 12
United States of America
2,437 19 4,442 Units 549 -30 -30 -59 10 2 -20
Peru 807 6 264 Tons 3,057 80 84 -48 41 0 -5
Ecuador 634 5 166 Tons 3,819 188 190 -62 54 0 10
Turkey 209 2 77 Tons 2,714 354 3 10 20
India 70 1 465 Units 151 66 83 -61 31 0 66
China 44 0 545 Units 81 1 2 -75 2 10 43 Source: ITC calculations based on COMTRADE statistics
Trade barriers
Partner regions
Importing markets
Supplying markets (HS4)
Product clusters (HS6) imported by Venezuela
Product clusters (HS4) imported by Venezuela
World exporters
World importers
Selection menu
Bubble graph Help
Table 8 shows that Colombia is the leading supplier of Refrigerators, with a 43% share of Venezuela’s import market. Colombia is only the 29th leading exporter of this product, but it is a dynamic supplier with 14% p.a. growth in the value of exports worldwide over the period,

ITC’S MARKET ANALYSIS SERVICES – TRADEMAP
International Trade Centre UNCTAD/WTO 17
a rate of growth which far exceeds the growth of the world export market over the same period which was only 3% p.a. The table also shows that China, the second largest exporter in the world, commands less than 1% of Venezuela’s market for Refrigerators. Although Venezuela’s imports from China have experienced growth of only 1% p.a. over the 1998-2002 period, China’s growth in exports to the world have grown at 43% p.a. We can also see that the unit value of Refrigerators from China is significantly lower than those from Colombia. If transportation costs are not prohibitive, China could be a viable alternative supplier. It would also be interesting to investigate why the number one largest exporter in the world is not among Venezuela’s top suppliers (the top world exporter would show up as number “1” in the column marked “Ranking of partner countries in world exports”) and what other Latin American countries export Refrigerators.
Explanatory Notes for Table 8 Exporters: Country names are sorted by imported value. Imported value in 2002, in US$ thousand: Value imported in 2002 in US$ thous and as reported by the selected country or as reported by the partner country (when the selected country does not report trade data). Share in Venezuela’s imports, %: Share of partner countries in the imports of the target country. Imported quantity 2002: Quantity imported in 2002. Where mirror statistics are used, units may differ according to unit used by reporting countries. Quantity unit (US$/unit): The unit in which quantities are reported. Unit value: Price in US$ per unit. Import trend in value between 1998-2002, %, p.a.: This trend is calculated using the least squares method. If a country did not report trade data in 2002, the trend calculation is based on mirror statistics. Where the reporting country data is not available for at least a four-year period, TradeMap does not calculate a trend and the cell is blank. Import trend in quantity between 1998-2002, %, p.a.: This trend is also calculated using the least squares method. Import growth in value between 2001-2002, %, p.a.: This growth is a good complement to the 5-year trend, indicating whether growth trends have been stable or volatile over the 5 years. Ranking of partner countries in world exports: This indicates the world ranking of the partner country as an exporter 2002. With this indicator, it is possible to know if the selected country trades with the leading suppliers of the selected product. Share of partner countries in world exports, %: This indicates the world share that the partner country represents as an exporter of the selected product. Total export growth in value of partner countries between 1998-2002, %, p.a.: This indicates the global export growth of the partner country from the world for the selected product. This indicator is calculated on data as reported by the target market. This combined with the import trend in value, calculated above, allows the analyst to see how the market share of the country under review has changed in the partner country.
The information given in Table 8 is also available in bubble chart format (see Chart 1). This chart presents the growth of Venezuela’s major partner markets for Refrigerators (on the vertical) as compared to those same partner markets’ share in Venezuela’s imports (on the horizontal), providing an overview of the prospects for supplier diversification. It illustrates that Colombia, as mentioned above commands a large portion of Venezuela’s market for Refrigerators, 43%, but has a share of world exports less than 1%, although some export growth to the world (1% p.a.). China is shown as having significant export growth to the world, 43% p.a., but a relatively small share of Venezuela’s imports, again less than 1%.

ITC’S MARKET ANALYSIS SERVICES – TRADEMAP
International Trade Centre UNCTAD/WTO 18
Chart 1: Prospects for diversification of suppliers for a product imported by Venezuela in 2002
Prospects for diversification of suppliers for a product imported by Venezuela in 2002
Product : 841821 Refrigerators, household type, compression-type
-20
-10
0
10
20
30
40
50
60
70
0 5 10 15 20 25 30 35 40 45
Share of partner countries in Venezuela's imports, 2002, %
An
nu
al g
row
th o
f p
artn
er c
ou
ntr
ies
exp
ort
s to
th
e w
orl
d b
etw
een
199
8-20
02, %
Italy
Mexico
Turkey
China
Germany
Scale=5% of world exports
Korea, Rep. of Korea
United States of America
Spain
Costa Rica
Colombia
Peru
Ecuador
India
United States of America (re-exports)
Note: The area of the circles correponds to the share in world exports of supplying markets for the selected product.Source: ITC calculations based on COMTRADE statistics.

ITC’S MARKET ANALYSIS SERVICES – TRADEMAP
International Trade Centre UNCTAD/WTO 19
What are priority products for trade promotion?
D. Scan potential for product diversification – Apparel from the Morocco
Exporters looking for product diversification opportunities could use Trade Map to view similar products with growing demand. An exporter of Men’s/boys trousers of cotton, not knitted in Morocco may be considering opportunities for product diversification in Cyprus and need to know what other related products are in demand. A list of those markets supplying Cyprus is generated by selecting 620342 Men’s/boys trousers of cotton, not knitted in the product selection menu (above), Cyprus as the country under review and ‘Import’ (see Table 9).
Table 9: List of supplying markets for a product imported by Cyprus in 2002
Product : 620342 Mens/boys trousers and shorts, of cotton, not knitted Cyprus's imports represent 0% of world imports for this product, its ranking in world imports is 54
Exporters
Imported value 2002
in US$ thousand
Share in Cyprus's
imports, %
Imported quantity
2002
Quantity unit
Unit value (US$/unit)
Import trend in value between
1998-2002, %, p.a.
Import trend in quantity between
1998-2002, %, p.a.
Import growth in
value between
2001-2002, %, p.a.
Ranking of partner
countries in world
exports
Share of partner
countries in world
exports, %
Total export growth in value
of partner countries
between 1998-2002, %, p.a.
World 8,755 100 910,303 Units 10 8 3 -2 0
Greece 2,645 30 202,007 Units 13 22 33 19 62 0 -8
China 1,271 15 295,273 Units 4 36 50 1 2 11 4
Italy 1,148 13 46,309 Units 25 -7 -11 -21 3 6 1
Spain 501 6 39,174 Units 13 17 30 -12 21 1 -2
Hong Kong (SARC)
453 5 74,031 Units 6 6 14 19 6 4 -10
United Kingdom
385 4 26,589 Units 14 -11 -1 -13 29 0 -15
Sri Lanka 332 4 20,084 Units 17 56 57 50 25 1
Tunisia 323 4 14,081 Units 23 21 16 -4 7 4
India 231 3 34,588 Units 7 18 25 55 20 1 8
Morocco 210 2 11,444 Units 18 4 15 0 12 2 Source: ITC calculations based on COMTRADE statistics
Next Trade barriers
Partner regions
Importing markets
Supplying markets (HS4)
Product clusters (HS6) imported by Cyprus
Product clusters (HS4) imported by Cyprus
World exporters
World importers
Mirror data
Selection menu
Bubble graph
Help

ITC’S MARKET ANALYSIS SERVICES – TRADEMAP
International Trade Centre UNCTAD/WTO 20
Table 9 shows Morocco’s competitors in Cyprus’ market for this product. We can see that in Cyprus, Morocco ranks 10th with a 2% share of the market. While Cyprus’ overall import trend in value grew by 8% p.a. over the 1998-2002 period, the growth trend in quantity was only 3% p.a., suggesting the possibility of an upward trend in prices. Explanatory Notes for Table 9
Exporters: Partner name sorted by exported value. Imported value 2002 in US$ thousand: This figure is as reported by the selected country or as reported by the partner country, when the selected country does not report trade data. Share of Cyprus’ (partner country’s) imports, %: Share of partner countries in the imports of the target country by value in 2002. Imported quantity 2002: As labeled. Where mirror statistics are used, units may differ according to unit used by reporting countries. Quantity unit: The unit in which quantities are reported. Unit value (US$/unit): Price in US$ per unit. Import trend in value between 1998-2002, %, p.a.: This trend is calculated using the least squares method. No trend is calculated in cases where the reporting country data is not available for at least a four-year period. Import trend in quantity between 1998-2002, %, p.a.: This trend is also calculated using the least squares method. Import trend in value between 2001-2002, %, p.a.: This growth is a good complement to the 5-year trend, indicating whether growth trends have been stable or volatile over the 5 years. Import growth in value between 2001-2002 per annum as a percentage: This growth is a good complement to the 5-year trend, indicating whether growth trends have been stable or volatile over the 5 years and showing the country performance over the last two years. Ranking of partner countries in world exports: The world ranking of the partner country as an exporter in 2002. Share of partner countries in world exports %: This provides the world market share of the exporter in 2002. Total export growth in value of partner countries between 1998-2002 per annum as a percentage: The export growth of the partner country to the target country over the period, not to be confused with an increase in market share.
In order to see what complementary products Cyprus imports that are experiencing growth, the exporter would click Product clusters (HS6) imported by Cyprus (see Table 10). According to Table 10, the Moroccan exporter may want to explore opportunities in 620322 Mens/boys ensembles, of cotton, not knitted. Cyprus’ imports of these products grew 30% p.a. in value over the 1998-2002. As world exports actually declined 2% p.a., this may be an opportunity to gain market share in Cyprus.

ITC’S MARKET ANALYSIS SERVICES – TRADEMAP
International Trade Centre UNCTAD/WTO 21
Table 10: List of products imported by Cyprus in 2002
HS rev. 1 Product value 2002
in US$ thousand
Quantity 2002
Quantity unit
Annual growth in value between
1998-2002, %
Annual growth in quantity
between 1998-2002, %
Annual growth in value between
2001-2002, %
World market
share, %
Ranking in world mar ket
Annual growth in value of world
exports between 1998-2002, %
620319 Mens/boys suits, of other textile materials, not knitted
1,719 86,539 Units 20 26 -7 0 26 10
620322 Mens/boys ensembles, of cotton, not knitted
240 30,523 Units 30 27 3 0 52 -2
620329 Mens/boys ensembles, of other textile materials, not knitted
60 8,984 Units -23 -27 94 0 86 9
620332 Mens/boys jackets and blazers, of cotton, not knitted
779 57,663 Units 0 23 2 0 40 1
620339 Mens/boys jackets and blazers, of other textile materials, not knitted
1,157 67,615 Units 9 13 26 0 27 -3
620342 Mens/boys trousers and shorts, of cotton, not knitted
8,755 910,303 Units 8 3 -2 0 54 0
Source: ITC calculations based on COMTRADE statistics Product clusters (HS6) exported by Cyprus
The leading products (HS6) imported by Cyprus
Product clusters (HS4) imported by Cyprus
Selection menu
Bubble graph Help
Explanatory Notes for Table 10 Hs rev. 1: HS 6-digit product code for product imported in 2002. HS. rev. 1 refers to Revision One of the Harmonized System (HS) nomenclature 1996. This distinguishes the codes from other revisions. Product: Abbreviated product description corresponding to the HS 6-digit product code. Value 2002, in US$ thousand: Value of 2002 imports in the selected product. These figures are as reported by countries to the COMTRADE database or as calculated with mirror statistics. Quantity 2002: Quantity imported in 2002. Where mirror statistics are used, if the exporting and importing countries use different units no quantity will be displayed. Quantity unit: The unit in which quantities are reported. Annual growth in value between 1998-2002: Growth in the value of imports. This trend is calculated by the least squares method. If a country did not report trade data in 2002, the trend calculation is based on mirror statistics. No trend is calculated in cases where the reporting country data is not available for at least a four-year period. Annual growth in quantity between 1998-2002, %: This trend is also calculated using the least squares method. Annual growth in value between 2001-2002, %: Growth in value of imports. This growth is a good complement to the 5-year trend, indicating whether growth trends have been stable or volatile over the 5 years. World market share, %: Share of the importing country in the world market in 2002. This indicator takes into account all countries, whether or not they reported. Ranking in world market: The world ranking of the selected country in the import of the product under review. Annual growth in value of world exports between 1998-2002, %: The trend is calculated again using the least squares method.

ITC’S MARKET ANALYSIS SERVICES – TRADEMAP
International Trade Centre UNCTAD/WTO 22
What is my country’s current trade performance?
III. Country Approach The second approach, or country approach, allows analysis using TradeMap from a country perspective. From this angle, a user can assess the national trade performance of a country and also review the potential for bilateral trade with a partner.
A. Assess national trade performance – Romania
The government of Romania may wish to investigate how the country’s exports compete in the world market in order to best prioritize their efforts to attract foreign or domestic investment or to promote trade. By selecting Romania as the country in TradeMap and indicating ‘Export’ (above), a list of Romania’s exports is generated at the HS 2-digit level sorted by product code. By going to the bottom of that list and selecting List of product groups sorted by value, the Romanian analyst can focus on product groups of the greatest interest, shown below as Table 11. The 2-digit level provides a sectoral overview of Romania’s exports.

ITC’S MARKET ANALYSIS SERVICES – TRADEMAP
International Trade Centre UNCTAD/WTO 23
Table 11: List of product groups exported by Romania in 2002, HS 2
HS rev. 1
Product Value 2002 in US$
thousand
Annual growth in value between 1998-2002, %
Annual growth in value between 2001-2002, %
Annual growth of world exports
between 1998-2002, %
Ranking in country exports
Share in world
exports, %
Ranking in world
exports
All products 13,875,709 14 22 4 0.0 54
62 Articles of apparel, accessories, not knit or crochet
2,402,692 12 16 1 1 2.3 11
85 Electrical, electronic equipment 1,431,476 44 44 6 2 0.2 40
64 Footwear, gaiters and the like, parts thereof 1,157,931 18 19 1 3 2.4 8
27 Mineral fuels, oils, distillation products, etc 1,101,060 30 56 16 4 0.2 60
72 Iron and steel 970,752 3 33 1 5 0.8 30
61 Articles of apparel, accessories, knit or crochet
796,909 19 19 3 6 0.9 28
84 Nuclear reactors, boilers, machinery, etc 743,599 14 9 2 7 0.1 47
94 Furniture, lighting, signs, prefabricated buildings
654,529 8 23 4 8 0.8 24
44 Wood and articles of wood, wood charcoal 619,585 11 18 2 9 0.9 25
Source: ITC calculations based on COMTRADE statistics
Next List of product groups sorted by HS code
List of product groups imported
The leading products (HS6) exported
The leading products (HS4) exported
Selection menu Help
From this table the Romanian government can see that overall, Romania ranks 54 among the world’s exporters, with a 14% p.a. growth in exports over the 1998-2002 period and 22% p.a. over the 2001-2002 period. At the same time the 5-year growth trend for the world is only 4% p.a. indicating and overall increase in the competitiveness of Romania’s exporters. Looking at exports at the HS 2-digit level highlights which sectors might be interesting from the perspective of attracting foreign or domestic investment. Sectors such as Electrical, electronic equipment (HS 85) or Articles of apparel, accessories, knit or crochet (HS 61) are experiencing high growth (44% and 19% p.a. respectively), while world exports of these products are only growing at 6% and 3% p.a. respectively. These may be attractive sectors for investment.

ITC’S MARKET ANALYSIS SERVICES – TRADEMAP
International Trade Centre UNCTAD/WTO 24
Explanatory Notes for Table 11
HS rev. 1: Product code for product exported in 2002. HS. rev. 1 refers to Revision One of the Harmonized System (HS) nomenclature 1996. This distinguishes the codes from other revisions. Product: Abbreviated product description corresponding to the HS 2-digit code. Value 2002, in US$ thousand: Value of exports. These figures are as reported by countries to the COMTRADE database or as calculated with mirror statistics. Annual growth in value between 1998-2002, %: Trend in export value for the period shown. This trend is calculated by the least squares method. If a country did not report trade data in 2002, the trend calculation is based on mirror statistics. No trend is calculated in cases where the reporting country data is not available for at least a four-year period. Annual growth in value between 2001-2002, %: Shows export growth 2001-2002. This growth is a good complement to the 5-year trend, indicating whether growth trends have been stable or volatile over the 5 years. Annual growth of world exports between 1998-2002, %: This trend is calculated by the least squares method. If a country did not report trade data in 2002, the trend calculation is based on mirror statistics. No trend is calculated in cases where the reporting country data is not available for at least a four-year period. Ranking in country exports: This indicator shows the importance of the product group in the country's exports or imports 2002. It is especially relevant when this table is sorted by product code rather than value. Share in world exports, %: This indicator takes into account all countries, whether or not they have reported. Ranking in world exports: The world ranking in 2002 of the selected country in the export of the product under review. For a more in depth look at those sectors which may be interesting for targeting investment the 4-digit level should be explored. By clicking on 85 in Table 11, the Romanian government can see in Table 12 what areas within that sector may be interesting. HS 8544 Insulated wire/cable is an area that is showing growth in world imports, 39%, over the 1998-2002 period. This is a sizeable sector for Romania and has shown substantial growth over both the 5- and 2-year period (39% and 80% p.a.), while world imports have grown 3% p.a. from 1998-2002.
Table 12: List of products exported by Romania in 2002, HS 4
HS rev. 1
Product value 2002 in
US$ thousand
Quantity 2002
Quantity unit
Annual growth in value
between 1998-2002, %
Annual growth in quantity
between 1998-2002, %
Annual growth in value
between 2001-2002, %
World market
share, %
Ranking in world market
Annual growth in value of world
imports between 1998-2002, %
8542 Electronic integrated circuits and microassemblies
24,286 0 No
quantity 125 -26 0 45 7
8543 Electrical mach&app having individual function, nes
1,185 0 No
quantity 60 -20 0 64 6
8544 Insulated wire/cable 497,784 0 No quantity 39 80 1 22 3
8545 Carbon electrodes / brushes / lamp carbons
2,899 0 No
quantity -10 -39 0 36 -3
8546 Electrical insulators of any material 19,907 0 No
quantity 83 2031 1 14 -1
Source: ITC calculations based on COMTRADE statistics
First Previous Product clusters (HS4) imported by Romania
The leading products (HS6) exported by Romania
The leading products (HS4) exported by Romania
Selection menu
Bubble graph Help

ITC’S MARKET ANALYSIS SERVICES – TRADEMAP
International Trade Centre UNCTAD/WTO 25
From Table 12, Chart 2 can be generated, which presents Romania’s export performance for all the HS 6-digit product codes within the HS85 Electric, electronic equipment sector. The chart shows the export value of each product (size of the bubbles), and compares Romania’s export growth (horizontal axis) with the growth of international demand (vertical axis). In addition, the diagonal line (the line of constant world market share) divides the chart into two parts. Romania's exports of products to the right of this line have grown faster than world imports thus increasing their share in the world market. Conversely, products to the left of the diagonal line have seen an erosion of their world market share. The diagonal reference line and horizontal axis are particularly interesting in terms of trade development, since they divide the chart into four quadrants with different characteristics:
Champions - winners in growth markets: These are the export products for which Romania has performed very well, such as Insulated wire/cable. This sector contains particularly dynamic products for which the value of world exports is growing faster than world trade in general, and for which Romanian exporters have increased their share. Exporters of these products have proven their international competitiveness over the period. Trade promotion efforts for these products are less risky, as they are national success stories that can serve as benchmarks for other industries. Promotional efforts in these products should aim at broadening supply capacity.
Underachievers - losers in growth markets: These products represent particular challenges for trade promotion efforts in Romania. While international demand has been growing at above-average rates, Romania has been falling behind. Its exports of Electrical apparatus for switching, for example, have either declined or grown at a lower rate than world trade. As a result, Romania has been losing international market share. In general, the bottleneck is not international demand, but rather the supply capacity of Romanian producers. For these products, it is essential to identify and remove the specific bottlenecks that impede a more dynamic expansion of exports. Losers in declining markets: The export prospects for these products tend to be bleak, such as Carbon electrodes/brushes/lamp carbons in the case of Romania. World imports of the product concerned have increased at a below-average rate or actually declined, and the market share of Romania has gone down. Trade promotion efforts for products in this category face difficulty. They need to adopt an integrated approach to take into account bottlenecks on both the supply and demand side. Achievers in adversity - winners in declining markets: World import markets for products in this quadrant, such as Thermonic cold cathode valves , are declining or growing at a below average rate, but the market share of Romanian exporters is growing. From a trade promotion perspective, niche-marketing strategies are required to isolate positive trade performance from the overall decline in these markets.
The chart also provides an overview of the concentration of exports. The appearance of one or a few comparatively large circles in one area shows that exports are highly concentrated. This does not appear to be the case for Romania. The circle labeled scale, in the bottom right-hand corner of Chart 2, serves as reference for the size of the bubbles. The scale varies from US$ 10,000 to US$ 100 million depending on the country under review. Should the government of Romania wish to conduct deeper analysis still, the 6-digit level is accessible for any of the 4-digit codes by clicking on that code.

ITC’S MARKET ANALYSIS SERVICES – TRADEMAP
International Trade Centre UNCTAD/WTO 26
Chart 2: Growth of national supply and international demand for export products of Romania in 2002, HS 4
Growth of national supply and international demand for export products of Romania in 2002
-4
-2
0
2
4
6
8
10
-30 -20 -10 0 10 20 30 40 50 60 70 80 90 100
Annual growth of exports of Romania between 1998-2002, %
An
nu
al g
row
th o
f w
orl
d im
po
rts
bet
wee
n 1
998-
2002
, %
Underachievers
Champions
Achievers in adversity
Diagonal of constantworld market share
Losers indeclining markets
Insulated wire/cable
Part suitable for use solely/princ with televisions, recpt app
Electrical app for switchg (ex fuse,switche,etc) not
exceedg 1000 volt
Electric sound/visual signallg app (e.g. bell/siren, fire alarms)
Electronic integrated circuits and microassemblies
Electrical insulators of any material
Board & panels, equipped with two/more switches, fuses
Electric filament or discharge lamps
Bubble scale = US$ 10 millions
Electrical capacitors, fixed, variable or adjustable (pre-set)
Part suitable for use solely/princ with boards, panels, fuses, switches
Printed circuits
Insulating fitting for elec mach,app/equip (o/t insulator of hd no85.46)
Diodes/transistors&sim semiconductor devices; etc
Carbon electrodes / brushes / lamp carbons
Electrical parts of machinery/app, nes
Electrical resistor (incl rheostats),o/t heatg resistor
Electrical mach&app having individual function, nes
Electrical app for switching (ex fuse,switche,etc) exceeding 1000 volt
Thermionic,cold cathode valves&tube (e.g. tv camera tubes)
Note: The area of the circles corresponds to the export value of the product for RomaniaSource: ITC calculations based on COMTRADE statistics.

ITC’S MARKET ANALYSIS SERVICES – TRADEMAP
International Trade Centre UNCTAD/WTO 27
By next clicking on The leading products (HS6) exported by Romania at the bottom of Table 12, Table 13 is generated which lists Romania’s top 500 exports at the HS 6-digit level. The data in this table shows that Romania’s fifth largest export Footwear, outer soles of rubber/plastics uppers of leather nes (HS 640399), grew 84% p.a. over the 1998-2002 period, while world imports of these products grew 5% p.a., suggesting that Romania’s 1% share of the world market may be growing. Also interesting are Romania’s exports of Men’s\boy’s trousers and shorts of cotton, not knitted which grew at 28% p.a. over the full period (29% p.a. over 2001-2002) while world imports grew at only 1% p.a. These may be interesting sectors in which to focus trade promotion efforts. From Table 13, Chart 3 can be generated, which is similar to Chart 2 but with significant differences. Chart 3 presents the performance of the leading export products of Romania, indicating the average nominal growth of the total exports of Romania for the period 1998 to 2002 (dotted vertical reference line) and the average nominal growth of world imports over the same period (horizontal reference line), which was 4% p.a. In Chart 3 it is the diagonal line, representing constant market share, and the horizontal reference line that divide the chart into four quadrants. It should be noted that the criterion for distinguishing growing and declining products is the average nominal growth rate of total world imports from 1998 to 2002, which was 4% annually. Products, whose world imports have grown below this rate, for instance at 3% annually, are classified as declining products, as their share in world trade is declining.
Table 13: The leading products exported by Romania in 2002, HS 6
HS rev. 1 Product Value 2002 in US$ thousand
Quantity 2002
Quantity unit
Annual growth in
value between
1998-2002, %
Annual growth in quantity between
1998-2002, %
Annual growth in
value between
2001-2002, %
Share in world
exports, %
Ranking in world export
Annual growth in value of
world imports between 1998-
2002, %
TOTAL All products 13,875,709 0 No quantity 14 22 0 54 4
271000
Petroleum oils&oils obtained from bituminous minerals,o/than crude etc
959,770 4,404,981 Tons 30 12 58 0 32 7
854430 Ignition wirg sets&oth wirg sets usd in vehicles,aircraft etc
390,132 30,712 Tons 33 45 76 3 8 5
940360 Furniture, wooden, nes 374,605 231,412 Tons 5 5 19 2 13 6
640610 Uppers and parts thereof, other than stiffeners
361,916 16,982 Tons 14 12 19 16 1 -3
640399 Footwear, outer soles of rubber/plastics uppers of leather, nes
283,269 22,883 Tons 84 93 33 1 13 5
890190
Cargo vessels nes&oth vessels for the transport of both persons&goods
268,373 168,733 Tons 8 -14 93 1 6 -1
620342 Mens/boys trousers and shorts, of cotton, not knitted
204,660 11,796 Tons 28 34 29 1 15 1
Source: ITC calculations based on COMTRADE statistics
Next The leading products (HS6) imported The leading products (HS4) exported List of product groups (HS2) exported Selection menu Bubble graph Help
ITC’S MARKET ANALYSIS SERVICES – TRADEMAP
International Trade Centre UNCTAD/WTO 28
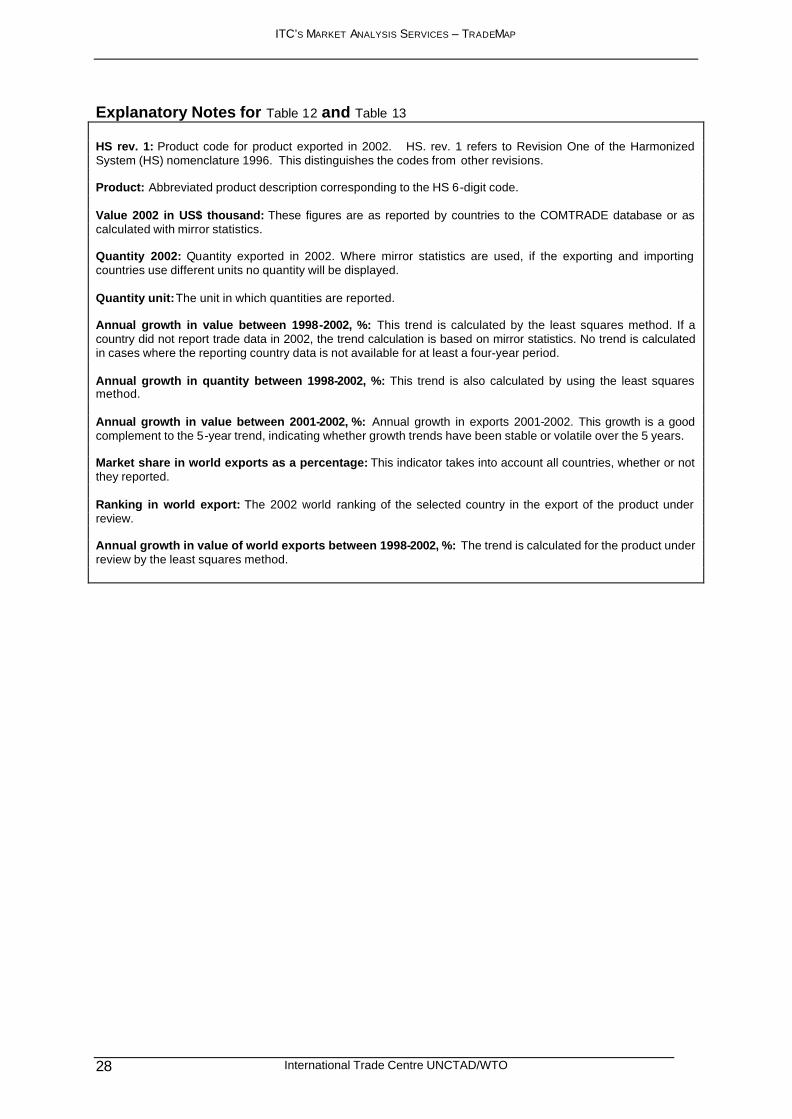
Explanatory Notes for Table 12 and Table 13 HS rev. 1: Product code for product exported in 2002. HS. rev. 1 refers to Revision One of the Harmonized System (HS) nomenclature 1996. This distinguishes the codes from other revisions. Product: Abbreviated product description corresponding to the HS 6-digit code. Value 2002 in US$ thousand: These figures are as reported by countries to the COMTRADE database or as calculated with mirror statistics. Quantity 2002: Quantity exported in 2002. Where mirror statistics are used, if the exporting and importing countries use different units no quantity will be displayed. Quantity unit: The unit in which quantities are reported. Annual growth in value between 1998-2002, %: This trend is calculated by the least squares method. If a country did not report trade data in 2002, the trend calculation is based on mirror statistics. No trend is calculated in cases where the reporting country data is not available for at least a four-year period. Annual growth in quantity between 1998-2002, %: This trend is also calculated by using the least squares method. Annual growth in value between 2001-2002, %: Annual growth in exports 2001-2002. This growth is a good complement to the 5-year trend, indicating whether growth trends have been stable or volatile over the 5 years. Market share in world exports as a percentage: This indicator takes into account all countries, whether or not they reported. Ranking in world export: The 2002 world ranking of the selected country in the export of the product under review. Annual growth in value of world exports between 1998-2002, %: The trend is calculated for the product under review by the least squares method.

ITC’S MARKET ANALYSIS SERVICES – TRADEMAP
International Trade Centre UNCTAD/WTO 29
Chart 3: Growth of national supply and international demand for the twenty leading Romanian exports in 2002
Growth of national supply and international demand for export products of Romania in 2002
-6
-4
-2
0
2
4
6
8
10
12
14
-10 0 10 20 30 40 50 60 70 80 90 100
Annual growth of exports of Romania between 1998-2002, %
Ann
ual g
row
th o
f w
orld
impo
rts
betw
een
1998
-200
2, %
Underachievers
Growth of total world imports
Champions
Achievers in adversity
Diagonal of constantworld market share
Losers indeclining markets
Total export growth ofRomania
Petroleum oils&oils obtained from bituminous minerals,o/than crude etc
Ignition wirg sets&oth wirg sets usd in vehicles,aircraft etc
Furniture, wooden, nes
Uppers and parts thereof, other than stiffeners
Footwear, outer soles of rubber/plastics uppers of leather, nes
Cargo vessels nes&oth vessels for the transport of both persons&goods
Mens/boys trousers and shorts, of cotton, not knitted
Parts suitable f use solely/princ w the app of headings 85.25 to 85.28
Mens/boys shirts, of cotton, not knitted
Lumber, coniferous (softwood) 6 mm and thicker
Womens/girls blouses and shirts, of man-made fibres, not knitted
Ferrous waste and scrap, iron or steel, nes
(1996) Hot roll iron/steel, not coil >600mm x >10mm
Womens/girls trousers and shorts, of synthetic fibres, not knitted
Womens/girls trousers and shorts, of cotton, not knitted
Pullovers, cardigans and similar articles of man-made fibres, knitted
Footwear,outer soles of rubber/plast uppers of leather covg ankle nes
(1996) Hot roll iron/steel nes, coil >600mm x <3mm
Lumber, Beech
Parts and accessories of bodies nes for motor vehicles
Aluminium unwrought, not alloyed
Electrical energy
Womens/girls jackets, of synthetic fibres, not knitted
Mens/boys trousers and shorts, of synthetic fibres, not knitted
Bubble scale = US$ 10 millions
Note: The area of the circles corresponds to the export value of the product for RomaniaSource: ITC calculations based on COMTRADE statistics.

ITC’S MARKET ANALYSIS SERVICES – TRADEMAP
International Trade Centre UNCTAD/WTO 30
For what products is there potential to increase bilateral trade?
B. Bilateral Trade Potential – between Estonia and Finland
A TSI in Estonia may wish to explore the trade potential between Estonia and Finland. The first step is to select Estonia as the country under review, Finland as the partner country and ‘Export’ in the selection menu (above). The resulting table provides bilateral trade data organized by HS 2-digit code. Clicking Bilateral trade (HS2) sorted by potential trade at the bottom of that table will produce the information in Table 14.
Table 14: Existing and potential trade between Estonia and Finland in 2002, HS 2
Estonia's exports have been reported by Estonia Finland's imports have been reported by Finland
Estonia's exports to Finland Finland's imports from world Estonia's exports to world
Product code
Product label Value 2002 in US$
thousand
Annual growth in
value between
1998-2002, %
Value 2002 in US$ thousand
Annual growth in
value between
1998-2002, %
Market share in
world imports %
Value 2002 in US$ thousand
Annual growth in
value between
1998-2002, %
Market share in
world exports %
Indicative potential in US$
thousand
All products 882,943 15 33,440,032 1 0.0 4,336,351 9 0.0 3,453,408
44 Wood and articles of wood, wood charcoal
93,982 6 741,690 5 1.1 523,090 5 0.8 429,108
85 Electrical, electronic equipment
338,141 26 5,781,256 4 0.7 766,531 16 0.1 428,390
94
Furniture, lighting, signs, prefabricated buildings
65,586 18 458,858 5 0.5 303,635 19 0.4 238,049
87 Vehicles other than railway, tramway
13,359 10 2,743,034 -1 0.5 212,005 16 0.0 198,646
48
Paper & paperboard, articles of pulp, paper and board
4,037 -2 486,754 2 0.5 126,018 17 0.1 121,981
73 Articles of iron or steel 30,240 27 591,407 0 0.6 137,856 10 0.2 107,616
Source: ITC calculations based on COMTRADE statistics
Next List of product groups (HS2) exported by Estonia
List of product groups (HS2) imported by Finland
Import side
Bilateral trade (HS4) sorted by potential trade
Bilateral trade (HS6) sorted by potential trade
Selection menu Help

ITC’S MARKET ANALYSIS SERVICES – TRADEMAP
International Trade Centre UNCTAD/WTO 31
From Table 14, the TSI can see actual trade between Estonia and Finland, Finland’s imports from the world, and Estonia’s exports to the world, both for overall trade and for individual product groups listed. On the whole, trade between Estonia and Finland amounted to US$ 883 million in 2002 and grew at 15% p.a. over the 1998-2002 period. Finland’s imports from the world were US$ 33 billion with an annual growth rate of 1% p.a., while Estonia’s exports to the world were US$ 4 billion and grew at a rate of 9% p.a. If we focus on the sector of Paper and paperboard, articles of pulp, paper and board HS48, we see that trade took place between Estonia and Finland valued at just over US$ 4 million but is declining at 2% p.a. Finland’s imports from the world were almost US$ 487 million in 2002 and grew at 2% p.a. over the 1998-2002 period, while Estonia’s exports to the world were just over US$ 126 million and grew at 17% p.a. This brings into question why, with Finland’s import demand growing and Estonia’s supply capacity growing, trade between the two countries is declining. Explanatory Notes for Table 14 Product code: Product code for the product traded between the two countries under review. Product label: Abbreviated product group description corresponding to an HS 2-digit position. Selected country exports to the partner country:
Value 2002, in US$ thousand: The trade between the two selected countries, as reported by the selected country to the COMTRADE database or as reported by the selected partner country to the COMTRADE database if the selected country has not reported trade data.
Annual growth in value between 1998-2002, %: The trend of bilateral trade as a percentage. The trend is calculated using the least squares method. If the selected country does not report trade data in 2002, the trend calculation is based on partner statistics. No trend is calculated in cases where country or partner country data is not available for at least a four-year period. Partner country’s imports from the world:
Value 2002, in US$ thousand: The value imported by the partner country from the world for the product group under review, as reported to the COMTRADE database or as calculated with mirror statistics.
Annual growth in value between 1998-2002, %: The growth of imports from the world for the selected partner country. The trend is calculated using the least squares method. If the selected partner country does not report trade data in 2002, the trend calculation is based on mirror statistics. No trend is calculated in cases where partner country data is not available for at least a four-year period.
Market share in world imports, %: The world import share for the selected partner country and product
group. This indicator takes into account all countries, whether or not they have reported. Selected country exports to world:
Value 2002, in US$ thousand: The value exported by the country to the world for the product group under review, as reported to the COMTRADE database or as calculated with mirror statistics.
Annual growth in value between 1998-2002, %: The growth of exports to the world for the selected
country. The trend is calculated by the least squares method. If the country under review does not report trade data in 2002 the trend calculation is based on mirror statistics. No trend is calculated in cases where country data is not available for at least a four-year period.
Market share in world exports, %: The world export share for the selected country and product group
under review. This indicator takes into account all countries, whether or not they have reported. Indicative potential in US$ thousand: The potential trade between the two selected countries as calculated in 2002. Trade potential is defined as the lower value of the amount a country exports to the world or the amount the partner country imports from the world, minus the existing trade between the two countries under review. In other words, high potential means that the partner country’s imports are significant and the country’s exports are also significant, but the share of the country in the imports of the partner country is small.

ITC’S MARKET ANALYSIS SERVICES – TRADEMAP
International Trade Centre UNCTAD/WTO 32
To know for which specific products potential may exist, the HS 6-digit level should be explored. By clicking on Bilateral trade (HS6) sorted by potential trade at the bottom of Table 14, Table 15 is generated.
Table 15: Existing and indicative potential trade between Estonia and Finland in 2002, HS 6
Estonia's exports have been reported by Estonia Finland's imports have been reported by Finland
Estonia's exports to Finland Finland's imports from world Estonia's exports to world
Product code Product label Value
2002 in US$
thousand
Annual growth in
value between
1998-2002, %
Share in Estonia's exports ,
%
Value 2002 in
US$ thousand
Annual growth in
value between 1998-
2002, %
Quantity 2002
Quantity Unit
Value 2002 in US$
thousand
Annual growth in
value between 1998-
2002, %
Quantity 2002
Quantity Unit
Indicative potential trade in
US$ thousand
852520
Transmission apparatus,for radioteleph incorporatg reception apparatus
90,573 236 37 388,124 23 1,090 Tons 247,926 24 645 Tons 157,353
440320 Logs, poles, coniferous nes 8,800 -5 16 243,869 16 5,411,553 Tons 56,416 -8 1,422,135 Tons 47,616
940360 Furniture, wooden, nes 11,054 8 19 55,680 8 23,487 Tons 59,095 5 33,557 Tons 44,626
730890 Structures&parts of structures,i/s (ex prefab bldgs of headg no.9406)
13,639 47 17 55,492 11 28,841 Tons 81,951 9 56,900 Tons 41,853
870323
Automobiles w reciprocatg piston engine displacg > 1500 cc to 3000 cc
386 -44 1 800,054 -5 106,753 Tons 37,160 3 4,709 Tons 36,774
940600 Prefabricated buildings 3,211 72 6 29,189 65 14,081 Tons 49,696 16 60,909 Tons 25,978
440399 Logs, non-coniferous nes 19,078 -7 44 225,096 -4 6,260,693 Tons 43,804 -7 1,383,198 Tons 24,726
854441
Electric conductors,for a v oltage not exceedg 80 V,fittd w connectors
4,825 0 18 34,536 -2 1,167 Tons 26,547 24 843 Tons 21,722
720449 Ferrous waste and scrap, iron or steel, nes
3,139 36 13 27,139 10 281,091 Tons 24,023 -14 260,019 Tons 20,884
Source: ITC calculations based on COMTRADE statistics Next Import side Bilateral trade (HS2) sorted by potential trade Bilateral trade (HS4) sorted by potential trade Selection menu Bubble graph Help
According to Table 15 there is trade potential between Estonia and Finland in Prefabricated buildings HS940600. Current trade is US$ 3.211 million. Finland imported just over US$ 29 million from the world and those imports grew 65% p.a. indicating increasing demand. Estonia’s exports to the world of just under US$ 50 million grew 16% p.a. indicating increasing supply. If Finland were to obtain its entire import supply from Estonia, the indicative trade potential would be US$ 26 million. Trade potential is defined as the lower of the value a selected country exports to the world or the value the partner country imports from the world (in this case the lower is Finland’s imports, $US 29 million), minus the current trade between the two countries under review (which is US$ 3 million). The trade potential is indicative only and serves as a departure point for further investigation. By clicking on the value of Finland’s imports from the world (column 6), all supplying markets of Prefabricated buildings to Finland are listed. Alternatively, by clicking on the product code in the first column, 940600, the importing markets for Prefabricated buildings from Estonia are listed.
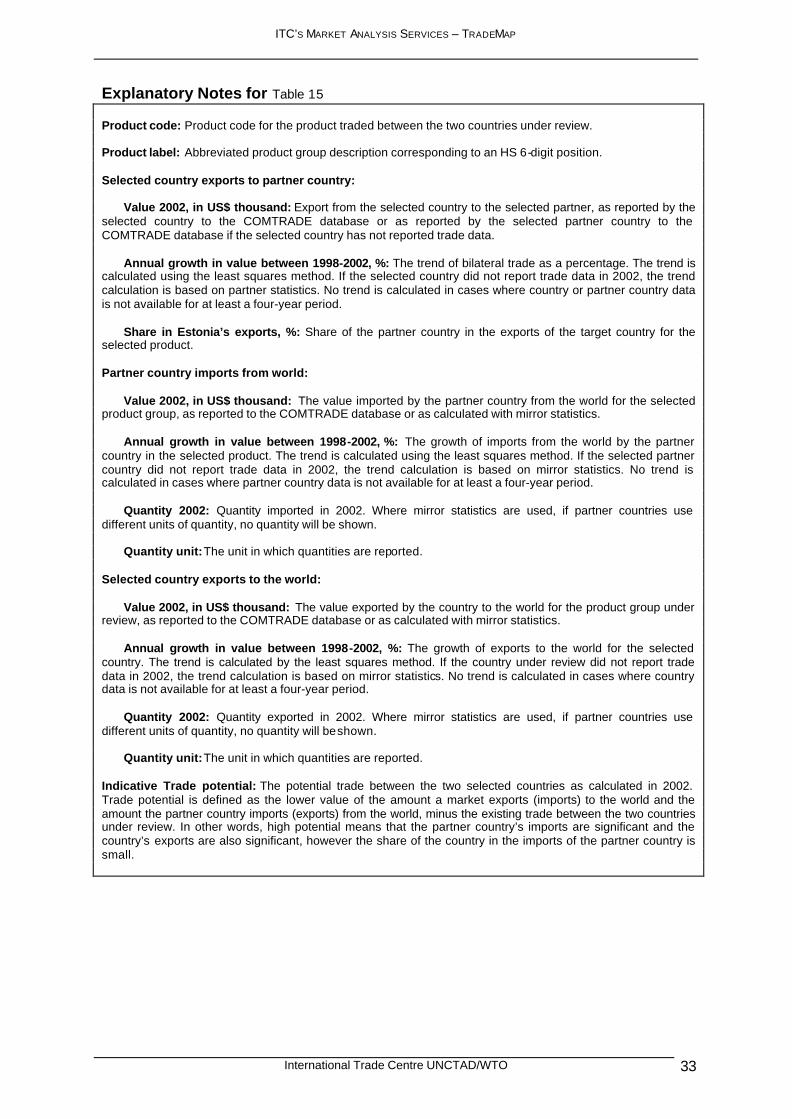
ITC’S MARKET ANALYSIS SERVICES – TRADEMAP
International Trade Centre UNCTAD/WTO 33
Explanatory Notes for Table 15 Product code: Product code for the product traded between the two countries under review. Product label: Abbreviated product group description corresponding to an HS 6-digit position. Selected country exports to partner country:
Value 2002, in US$ thousand: Export from the selected country to the selected partner, as reported by the selected country to the COMTRADE database or as reported by the selected partner country to the COMTRADE database if the selected country has not reported trade data.
Annual growth in value between 1998-2002, %: The trend of bilateral trade as a percentage. The trend is calculated using the least squares method. If the selected country did not report trade data in 2002, the trend calculation is based on partner statistics. No trend is calculated in cases where country or partner country data is not available for at least a four-year period.
Share in Estonia’s exports, %: Share of the partner country in the exports of the target country for the selected product. Partner country imports from world:
Value 2002, in US$ thousand: The value imported by the partner country from the world for the selected product group, as reported to the COMTRADE database or as calculated with mirror statistics.
Annual growth in value between 1998-2002, %: The growth of imports from the world by the partner country in the selected product. The trend is calculated using the least squares method. If the selected partner country did not report trade data in 2002, the trend calculation is based on mirror statistics. No trend is calculated in cases where partner country data is not available for at least a four-year period.
Quantity 2002: Quantity imported in 2002. Where mirror statistics are used, if partner countries use different units of quantity, no quantity will be shown.
Quantity unit: The unit in which quantities are reported. Selected country exports to the world:
Value 2002, in US$ thousand: The value exported by the country to the world for the product group under review, as reported to the COMTRADE database or as calculated with mirror statistics.
Annual growth in value between 1998-2002, %: The growth of exports to the world for the selected country. The trend is calculated by the least squares method. If the country under review did not report trade data in 2002, the trend calculation is based on mirror statistics. No trend is calculated in cases where country data is not available for at least a four-year period.
Quantity 2002: Quantity exported in 2002. Where mirror statistics are used, if partner countries use different units of quantity, no quantity will be shown.
Quantity unit: The unit in which quantities are reported. Indicative Trade potential: The potential trade between the two selected countries as calculated in 2002. Trade potential is defined as the lower value of the amount a market exports (imports) to the world and the amount the partner country imports (exports) from the world, minus the existing trade between the two countries under review. In other words, high potential means that the partner country’s imports are significant and the country’s exports are also significant, however the share of the country in the imports of the partner country is small.

ITC’S MARKET ANALYSIS SERVICES – TRADEMAP
International Trade Centre UNCTAD/WTO 34
What are the trade flows between my country and a specific regional or economic group?
C. TradeMap includes regional and economic country groups
On the TradeMap selection menu, if you enter the “Select a country” or “Select a partner country” options you will have the choice of either viewing individual countries or numerous country groups. For each group, a list of countries included is provided, as well as indications as to whether those countries report trade data to COMTRADE or not. In cases where some countries in a regional group do not report to COMTRADE, their trade statistics are estimated, as in the individual country case, by the use of mirror statistics (estimating exports based on partners’ imports and vice versa).
List of country and economic groups
Region Code Region Name Region
Code Region Name
G07 Africa G27 Economic Cooperation Organization (ECO)
G32 African Growth and Opportunity Act (AGOA) G25 Europe
G29 African, Caribbean and Pacific Group of States (ACP Group) G26 European Union (EU)
G31 America G41 G7
G19 Andean Community G21 Greater China G20 Asia G38 Gulf Cooperation Council (GCC) G39 Asia-Pacific Economic Cooperation (APEC) G15 Latin America and the Carribean
G24 Association of South-East Asian Nations (ASEAN) G16 Latin American Integration Association (LAIA) G13 Bangkok agreement G05 Least Developed Countries (LDCs) G40 Black Sea Economic Cooperation Zone (BSEC) G10 Maghreb G37 Caribbean Community (CARICOM) G22 Middle East
G17 Central American Common Market (CACM) G14 North American Free Trade Agreement (NAFTA) G23 Central Asian Republics G28 Oceania
G03 Central and Eastern Europe (CEE) G04 Organisation for Economic Co-operation and Development (OECD)
G12 Common Market for Eastern & Southern Africa (COMESA) G30 Organization of Petroleum Exporting Countries (OPEC)
G34 Common Market of the South (MERCOSUR) G06 Organization of the Islamic Conference (OIC)
G33 Commonwealth of Independent States (CIS) G18 South Asian Association for Regional Cooperation (SAARC)
G09 Customs and Economic Union of Central Africa (UDEAC) G11 Southern African Customs Union (SACU)
G01 Developed Market Economies G35 Southern African Development Community (SADC)
G02 Developing Market Economies G36 West African Economic and Monetary Union (WAEMU)
G08 Economic Community of West African States (ECOWAS)

ITC’S MARKET ANALYSIS SERVICES – TRADEMAP
International Trade Centre UNCTAD/WTO 35
1. Trousers exports from Egypt to the EU
The government of Egypt might be interested in analysing in which products there is a potential for increased trade between itself and the European Union as a whole. By first selecting Egypt from the country menu and then the European Union from the partner country menu, then sorting the resulting table by clicking Bilateral trade (HS6) sorted by potential trade, Table 16 is generated.
Table 16: Existing and indicative potential trade between Egypt and European Union (EU) in 2002
Egypt's exports have been reported by partners countries Please click on European Union (EU) to see the list of reporting countries in the region
Egypt's exports to European Union (EU)
European Union (EU)'s imports from world Egypt's exports to world
Product code Product label Value
2002 in US$
thousand
Annual growth in
value between
1998-2002, %
Share in
Egypt's exports
, %
Value 2002 in US$
thousand
Annual growth in
value between
1998-2002, %
Quantity 2002
Quantity Unit
Value 2002 in
US$ thousand
Annual growth in
value between
1998-2002, %
Quantity 2002
Quantity Unit
Indicative potential trade in
US$ thousand
520100 Cotton, not carded or combed
50,181 -7 27 769,557 -13 0 No
quantity 186,893 1 92,313 Tons 136,712
270799
Oils&oth products of the distillation of high temp coal tar etc nes
0 0 123,672 0 0 No
quantity 122,218 491,158 Tons 122,218
620462
Womens/girls trousers and shorts, of cotton, not knitted
1,825 -20 2 3,796,936 16 0 No
quantity 96,640 23 0 No
quantity 94,815
620342
Mens/boys trousers and shorts, of cotton, not knitted
14,870 -2 17 4,758,270 1 0 No
quantity 88,568 7 0 No
quantity 73,698
080510 Oranges, fresh or dried 8,807 23 13 1,131,599 0 0 No
quantity 65,607 7 203,495 Tons 56,800
Source: ITC calculations based on COMTRADE statistics
Next Import side Bilateral trade (HS2) sorted by potential trade Bilateral trade (HS4) sorted by potential trade Selection menu Bubble graph Help
We see that Womens/girls trousers and shorts, of cotton, not knitted are experiencing growth both in the value of EU imports (16% p.a.) and in the value of Egypt’s exports (23% p.a.). The trade between the two was also nearly US$ 2 million in 2002. However, trade between the two has declined over the 5-year period by 2% p.a. and the European Union only consumes 2% of Egypt’s exports of these products. Given the growing demand in the European Union and supply from Egypt, this may be an area in which improved marketing or negotiations may help the government of Egypt capitalize on almost US$ 95 million in potential trade. Egyptian analysts should use the same caution applied by Estonians in the case of bilateral trade potential between Estonia and Finland—these data must be complemented with other types of data and analysis.
By clicking the value of the EU’s imports from the world, we can see which individual countries supply the EU with those products. Likewise, by clicking on the value of exports

ITC’S MARKET ANALYSIS SERVICES – TRADEMAP
International Trade Centre UNCTAD/WTO 36
from Egypt to the world, we can see to which countries Egypt currently supplies those products. Chart 4 presents the same information as Table 15. The annual growth of the EU’s imports from the world is plotted on the vertical axis and the share of the EU in Egypt’s exports is plotted on the horizontal, while the size of the bubbles represents the size of the potential trade between the two. Notice that, as in Table 15, Womens/girls trousers and shorts, of cotton is experiencing significant growth in both demand from the EU and the EU’s share of Egypt’s exports suggesting this may be a good area for the government to concentrate efforts to support its exporters of trousers.

ITC’S MARKET ANALYSIS SERVICES – TRADEMAP
International Trade Centre UNCTAD/WTO 37
Chart 4: Potential trade between Egypt and European Union (EU) in 2002
Potential trade between Egypt and European Union (EU) in 2002
-15
-10
-5
0
5
10
15
20
25
30
35
40
45
50
55
60
65
70
0 10 20 30 40 50 60 70 80 90 100
Share of European Union (EU) in Egypt's exports , 2002, %
An
nu
al g
row
th o
f E
uro
pea
n U
nio
n (
EU
)'s im
po
rts
fro
m t
he
wo
rld
bet
wee
n 1
998-
2002
, %
Petroleum oils&oils obtained from bituminous minerals,o/than crude etc
Cotton, not carded or combed
Oils&oth products of the distillation of high temp coal tar etc nes
Womens/girls trousers and shorts, of cotton, not knitted
Mens/boys trousers and shorts, of cotton, not knitted
Oranges, fresh or dried
Pullovers, cardigans and similar articles of cotton, knitted
(1996) Hot roll iron/steel nes, coil >600mm x <3mm
Carbon (carbon blacks and other forms of carbon, nes)
Rice, semi-milled or wholly milled, whether or not polished or glazed
Marble & travertine,merely cut,by sawing or otherwise into blocks etc
Food preparations nes
Urea,wthr/nt in aqueous solution in packages weighg more than 10 kg
Carpets of man-made textile mat,of woven pile construction,made up,nes
(1996) Hot rolled bar/rod, irregular coils, <14mm diam
Petroleum oils and oils obtained from bituminous minerals, crude
Cotton yarn,>/=85%,single,uncombed,714.29 >dtex>/=232.56, not put up
Carpets of nylon or other polyamides, tufted
Bars & rods,i/nas,hr,hd or he,cntg indent,ribs,etc,prod dur rp/tar,nes
Naphthalene
T-shirts, singlets and other vests, of cotton, knitted
Mens/boys shirts, of cotton, not knitted
Rice, husked (brown)
Molasses nes
Bubble scale = US$ 10 millions
Note: The area of the circles correponds to the potential trade value between the two countries under review for the selected products.Source: ITC calculations based on COMTRADE statistics.

ITC’S MARKET ANALYSIS SERVICES – TRADEMAP
International Trade Centre UNCTAD/WTO 38
IV. Summary Whether from the public or business sector, actors in international trade must have the ability to analyze trade flows from both a product and country perspective. TradeMap provides this information in a user friendly and easily accessible format. Users have access to the world’s largest trade database, COMTRADE, containing indicators on national export performance, international demand, alternative markets, and the role of competitors from both the product and country perspective. Users can quickly and easily: • Analyze present export markets. Examine the performance and dynamics of a
country’s export markets for any product, Identifying the number and size of export markets and the concentration of exports and highlights countries where market share has increased.
• View the competitors in the global market. Competing countries, exporting the same
product, are ranked in terms of value, with additional indicators on quantities, growth and market share, highlighting the position of a country in world exports, as well as the position of neighboring countries.
• Pre-select priority markets. View the world’s major importing countries, with indicators illustrating the extent of import concentration in the world’s markets and in which countries’ demand has increased greatly over the period.
• Find information on tariff and non-tariff barriers. Based on the TRAINS database of UNCTAD, this function provides tariff-line information on countries’ major instruments of trade control, such as ad-valorem and specific tariffs, MFN tariffs, tariff quotas, anti-dumping duties, prohibitions and norms at the most detailed level.
• Assess competitors in specific export markets. View a country’s competitors in any leading target market, with information on the export performance of these competitors, showing the number of supplying countries and their performance in the market.
• Identify new sources of supply. Countries exporting a product both to the world and to a specific country are ranked against one another, allowing direct comparisons of current and potential sources of national supply.
• Review opportunities for product diversification in a specific market. Make a comparative assessment of import demand for related products in the market under review and identify whether similar products are imported by the country under review and if synergies are possible.
• Assess national trade performance. Make and overall evaluation of national trade performance and identify priority areas for investment and trade promotion at the sectoral and product level.
• Identify existing and potential bilateral trade with any partner country. Bilateral trade opportunities can be identified by comparing actual bilateral trade, demand in terms of the global imports of partner countries and the global export supply capacity of the home country.
TradeMap can be customized for trade support institutions (TSI TradeMap) via a special password-protected Internet site for subscribers, allowing multiple connections by larger user groups. Alternatively, individual partners can access the application directly on a subscription basis (ITC TradeMap). For further information please contact: [email protected]
ITC’S MARKET ANALYSIS SERVICES – TRADEMAP
International Trade Centre UNCTAD/WTO 39
Annex I: Foreign Trade Statistics as a Basis for Strategic Market Research What Users Should Take into Consideration
Foreign trade statistics provide a differentiated picture of trade flows among countries. They are comprehensive in terms of product coverage (more than 5,300 products under the Harmonized System), geographical coverage (around 100 countries covering 90% of world trade) and time series (data under the Harmonized System are available for the last decade). Moreover, they are readily available at moderate costs. This makes them an attractive source for market research and the assessment of trade performance. Against this background, ITC has developed a number of tools for international marketing and trade promotion based on trade statistics. Country Map, TradeMap and Product Map are all cases in point. All of these tools strive to present trade statistics in an analytical and user-friendly format. Notwithstanding the attractiveness of this comprehensive source of information, users should factor in the following weak points of foreign trade statistics:
In an effort to make some of these discrepancies more transparent, we have included the option of viewing Mirror statistics within TradeMap (See bottom of Table 17). Table 17 presents the data of those countries that import Panty hose from Slovenia as reported by Slovenian exports. While Table 18 presents the same data as reported by the imports of Slovenia’s partner countries.
q Trade data are never complete . Smuggling and non-reporting represent a serious problem in a number of countries. In addition, trade statistics, like any source of information, are not free of mistakes and omissions.
q Most countries include imports for re-exports and re-exports in their trade statistics. A low-
income country may show up as an exporter of airplanes simply because its national airline has sold second-hand planes.
q The export value refers to the total or contract value. According to international conventions for
reporting trade statistics, the export value refers to the total or contract value, which may of course, be very different from local value-added. For many processing activities the local value added remains below 20% of the export value.
q Only merchandise trade is covered. Detailed trade statistics are available only for merchandise
trade and not for services, although the latter may account for a sizeable share of national exports. q Different products are categorized differently. Even at the lowest level of disaggregation,
product groups in the trade nomenclatures do not necessarily reflect trade names and often contain a wide range of different products. Moreover, the product nomenclature is sometimes misleading. The labels of aggregated product groups are often very general and provide at times only limited guidance on the leading items within the group of products concerned.
q Exchange rate fluctuations are not always recorded. Exchange rate fluctuations are not always
properly recorded in international trade statistics. Values are normally aggregated over the period of one year in local currency and converted into US dollars.
q Mirror statistics are sometimes used. For countries that do not report trade data to the United
Nations, ITC uses partner country data, an approach referred to as mirror statistics. Mirror statistics are a second-best solution being better than having no data at all and allow the coverage of the over 100 primarily low-income countries that do not report national trade statistics to COMTRADE. At the same time, they have a number of shortcomings when compared to the first-best solution of nationally reported data. First and foremost, they do not cover trade with other non-reporting countries. As a result, mirror statistics hardly cover South-South trade and would not be a suitable source for an assessment of intra-African trade. Second, there is the problem of transshipments, which may hide the actual source of supply. Third, mirror statistics invert the reporting standards by valuing exports in c.i.f. terms (i.e. including transport cost and insurance) and imports in f.o.b. terms (excluding these items).

ITC’S MARKET ANALYSIS SERVICES – TRADEMAP
International Trade Centre UNCTAD/WTO 40
Table 17: List of importing markets for a product exported by Slovenia in 2002
Product : 611511 Panty hose&tights,of synthetic fibre yarns <67 dtex/single yarn knittd Slovenia's exports represent 1% of world exports for this product, its ranking in world exports is 16
Importers
Exported value 2002
in US$ thousand
Share in Slovenia's exports, %
Exported quantity
2002
Quantity unit
Unit value (US$/unit)
Export trend in value
between 1998-2002,
%, p.a.
Export trend in quantity between
1998-2002, %, p.a.
Export growth in
value between
2001-2002, %, p.a.
Ranking of partner
countries in world
imports
Share of partner
countries in world
imports, %
Total import growth in value of partner
countries between 1998-2002, %, p.a.
World 9,728 100 567 Tons 17,157 -19 -18 -4 -7
Switzerland 2,684 28 127 Tons 21,134 34 38 65 7 2 -6
Croatia 842 9 39 Tons 21,590 3 4 3 26 0 14
Austria 301 3 12 Tons 25,083 49 46 -77 10 2 -10
Yugoslavia 241 2 16 Tons 15,063 42 35 0 27
The former Yugoslav Rep. of Macedonia
187 2 9 Tons 20,778 -2 3 21 66 0 -8
Bosnia and Herzegovina 149 2 10 Tons 14,900 28 40 19 54 0 -3
Netherlands 82 1 3 Tons 27,333 17 1 -23
Italy 69 1 2 Tons 34,500 81 13 60 5 4 20
Portugal 64 1 2 Tons 32,000 -6 0 167 23 0 -14
Gambia 35 0 4 Tons 8,750 92 0
Russian Federation
18 0 1 Tons 18,000 64 20 1 45
Poland 10 0 6 Tons 1,667 -12 -10 -9 14 1 -15 Source: ITC calculations based on COMTRADE statistics Partner regions
Supplying markets
Importing markets (HS4)
Product clusters (HS6) exported by Slovenia
Product clusters (HS4) exported by Slovenia
World exporters
World importers
Mirror data
Selection menu
Bubble graph
Help
Table 18: List of importing markets for a product exported by Slovenia in 2002, Mirror Statistics
Product : 611511 Panty hose&tights,of synthetic fibre yarns <67 dtex/single yarn knittd
Figures are based on data reported to Comtrade by importing countries (Mirror Statistics)
Importers
Exported value 2002
in US$ thousand
Share in Slovenia's exports, %
Exported quantity
2002
Quantity unit
Unit value (US$/unit)
Export trend in value between
1998-2002, %, p.a.
Export trend in quantity between
1998-2002, %, p.a.
Export growth in
value between
2001-2002, %, p.a.
Ranking of partner
countries in world
imports
Share of partner
countries in world
imports, %
Total import growth in value
of partner countries
between 1998-2002, %, p.a.
Total 4,004 100
Switzerland 2,600 65 127 Tons 20,472 39 47 95 7 2 -6
Croatia 844 21 40 Tons 21,100 6 8 7 26 0 14
Austria 323 8 13 Tons 24,846 19 16 -69 10 2 -10
Portugal 68 2 0 No quantity
55 23 0 -14
Italy 66 2 2 Tons 33,000 16 -3 61 5 4 20
Slovakia 26 1 5 Tons 5,200 30 23 44 30 0 -1
Russian Federation
24 1 1 Tons 24,000 0 20 1 45
France 19 0 0 No quantity -26 -14 3 9 -8
Iceland 19 0 0 No quantity -16 27 75 0 -16
Czech Republic 15 0 3 Tons 5,000 -40 -36 -25 22 0 -6
Source: ITC calculations based on COMTRADE statistics Direct data Selection menu Help

ITC’S MARKET ANALYSIS SERVICES – TRADEMAP
International Trade Centre UNCTAD/WTO 41
Note that Yugoslavia, Macedonia, Bosnia and Herzegovina, and Gambia in Table 17 are not shown in Table 18. This is due to the fact that these countries do not report statistics to the COMTRADE database. However, the Netherlands and Poland are not shown in Table 18 and are reporting countries. Perhaps Slovenia re-exports to the Netherlands and Poland and counts it as exports to those countries, while the Netherlands and Poland may not consider Slovenia to be the country of origin and therefore do not include it in their imports. Similarly, in Table 18 we see that Slovakia, France, Iceland and the Czech Republic report imports from Slovenia, whereas Slovenia does not report exports to these countries. Maybe these countries consider Slovenia to be the country of origin, but Slovenia does not export to them directly and therefore does not include them in its export statistics. In view of the above shortcomings, foreign trade statistics should never be the sole source of insight, but need to be complemented by other sources and in particular cross-checked by product specialists and industry insiders. Overall, ITC’s experience suggests that trade statistics represent a very useful source of information and a valid point of departure for strategic market research, if analyzed with a healthy mix of skepticism and pragmatism vis-à-vis their strengths and shortcomings.


