User Guide for Texas Instruments’ - ETH Zürichrolfz/fap/E7/E7info/EW430_UserGuide.pdf · User...
416
MSP430 IAR Embedded Workbench™ IDE User Guide for Texas Instruments’ MSP430 Microcontroller Family
Transcript of User Guide for Texas Instruments’ - ETH Zürichrolfz/fap/E7/E7info/EW430_UserGuide.pdf · User...

U430-2
MSP430 IAR Embedded Workbench™ IDE
User Guide
for Texas Instruments’MSP430 Microcontroller Family

U430-2
COPYRIGHT NOTICE© Copyright 1995–2003 IAR Systems. All rights reserved.
No part of this document may be reproduced without the prior written consent of IAR Systems. The software described in this document is furnished under a license and may only be used or copied in accordance with the terms of such a license.
DISCLAIMERThe information in this document is subject to change without notice and does not represent a commitment on any part of IAR Systems. While the information contained herein is assumed to be accurate, IAR Systems assumes no responsibility for any errors or omissions.
In no event shall IAR Systems, its employees, its contractors, or the authors of this document be liable for special, direct, indirect, or consequential damage, losses, costs, charges, claims, demands, claim for lost profits, fees, or expenses of any nature or kind.
TRADEMARKSIAR, IAR Embedded Workbench, IAR XLINK Linker, IAR XAR Library Builder, IAR XLIB Librarian, IAR MakeApp, and IAR PreQual are trademarks owned by IAR Systems. C-SPY is a trademark registered in Sweden by IAR Systems. IAR visualSTATE is a registered trademark owned by IAR Systems.
Texas Instruments is a registered trademark of Texas Instruments Incorporated.
Microsoft and Windows are registered trademarks of Microsoft Corporation. Adobe and Acrobat Reader are registered trademarks of Adobe Systems Incorporated. CodeWright is a registered trademark of Starbase Corporation.
All other product names are trademarks or registered trademarks of their respective owners.
EDITION NOTICESecond edition: February 2003
Part number: U430-2
This guide describes version 2.x of the IAR Embedded Workbench for Texas Instruments’ MSP430 microcontroller family.

ContentsTables ..................................................................................................................... xix
Figures ................................................................................................................. xxiii
Preface ................................................................................................................. xxix
Who should read this guide ............................................................xxix
How to use this guide ........................................................................xxix
What this guide contains ................................................................... xxx
Other documentation ......................................................................xxxiii
Document conventions ...................................................................xxxiv
Part 1. Product overview ............................................................. 1
Product introduction ........................................................................................ 3
The IAR Embedded Workbench IDE .............................................. 3
An extensible and modular environment ............................................. 4
Features ................................................................................................ 4
Documentation ..................................................................................... 5
IAR C-SPY Debugger .............................................................................. 5
General C-SPY Debugger features ...................................................... 5
IAR C-SPY debugger systems ............................................................. 7
IAR C-SPY Simulator .......................................................................... 7
IAR C-SPY ROM-monitor ................................................................. 8
IAR C-SPY FET debugger .................................................................. 8
RTOS awareness .................................................................................. 9
Documentation ..................................................................................... 9
IAR C/EC++ Compiler ............................................................................ 9
Features .............................................................................................. 10
Runtime libraries ................................................................................ 10
Documentation ................................................................................... 10
IAR Assembler ......................................................................................... 11
Features .............................................................................................. 11
U430-2
iii

iv
Documentation ................................................................................... 11
IAR XLINK Linker .................................................................................. 11
Features .............................................................................................. 12
Documentation ................................................................................... 12
IAR XAR Library Builder and IAR XLIB Librarian .................. 12
Features .............................................................................................. 12
Documentation ................................................................................... 13
Installed files ........................................................................................................ 15
Directory structure ................................................................................ 15
Root directory .................................................................................... 15
The common directory ....................................................................... 16
The 430 directory ............................................................................... 16
File types ..................................................................................................... 17
Documentation ........................................................................................ 19
The user and reference guides ............................................................ 19
Online help and documentation ......................................................... 20
IAR on the web .................................................................................. 20
Part 2. Tutorials .................................................................................... 23
Creating an application project ................................................................. 25
Setting up a new project ..................................................................... 25
Creating a workspace window ........................................................... 26
Creating the new project .................................................................... 27
Adding files to the project .................................................................. 28
Setting project options ....................................................................... 29
Compiling and linking the application ........................................... 31
Compiling the source files ................................................................. 31
Viewing the list file ............................................................................ 32
Linking the application ...................................................................... 34
Viewing the map file .......................................................................... 35
Debugging using the IAR C-SPY™ Debugger ................................... 37
Debugging the application .................................................................. 37
U430-2
MSP430 IAR Embedded Workbench™ IDEUser Guide

Contents
Starting the debugger ......................................................................... 37
Organizing the windows .................................................................... 38
Inspecting source statements .............................................................. 39
Inspecting variables ........................................................................... 40
Setting and monitoring breakpoints ................................................... 42
Debugging in disassembly mode ...................................................... 43
Monitoring registers ........................................................................... 43
Monitoring memory ........................................................................... 44
Viewing terminal I/O ......................................................................... 45
Reaching program exit ....................................................................... 46
Mixing C and assembler modules ............................................................ 47
Examining the calling convention .................................................... 47
Adding an assembler module to the project .............................. 48
Setting up the project ......................................................................... 48
Using Embedded C++ .................................................................................... 51
Creating an Embedded C++ application ...................................... 51
Compiling and linking the EC++ application .................................... 51
Setting a breakpoint and executing to it ............................................. 52
Printing the Fibonacci numbers ......................................................... 54
Simulating an interrupt .................................................................................. 57
Adding an interrupt handler .............................................................. 57
The application—a brief description .................................................. 57
Writing an interrupt handler ............................................................... 58
Setting up the project ......................................................................... 58
Setting up the simulation environment ........................................ 58
Defining a C-SPY setup macro file .................................................... 59
Specifying C-SPY options ................................................................. 61
Building the project ............................................................................ 62
Starting the simulator ......................................................................... 62
Specifying a simulated interrupt ....................................................... 62
Setting an immediate breakpoint ........................................................ 63
Simulating the interrupt ...................................................................... 65
U430-2
v

vi
Executing the application ................................................................... 65
Using macros for interrupts and breakpoints ............................ 66
Working with library modules .................................................................. 67
Using libraries .......................................................................................... 67
Creating a new project ....................................................................... 68
Creating a library project ................................................................... 68
Using the library in the project .......................................................... 69
Part 3. Project management and building ............ 71
The development environment ................................................................. 73
The IAR Embedded Workbench IDE ............................................ 73
Running the IAR Embedded Workbench .......................................... 74
Exiting ................................................................................................ 75
Customizing the environment .......................................................... 75
Customizing the IDE .......................................................................... 75
Communicating with external tools ................................................... 76
Organizing the windows on the screen .............................................. 78
Managing projects ............................................................................................. 79
The project model .................................................................................. 79
How projects are organized ................................................................ 79
Creating and managing workspaces ................................................... 82
Viewing the workspace ........................................................................ 83
Building ................................................................................................................... 85
Building your application ..................................................................... 85
Setting options .................................................................................... 85
Building a project ............................................................................... 87
Correcting errors found during build ................................................. 87
Building from the command line ....................................................... 88
Extending the tool chain ...................................................................... 88
Custom Build ..................................................................................... 88
Editing ..................................................................................................................... 91
U430-2
MSP430 IAR Embedded Workbench™ IDEUser Guide

Contents
Using the IAR Embedded Workbench editor ............................ 91
Editing a file ....................................................................................... 91
Searching ............................................................................................ 94
Customizing the editor environment ............................................ 94
Using an external editor ..................................................................... 94
Part 4. Debugging ................................................................................ 97
The IAR C-SPY Debugger ........................................................................... 99
Debugger concepts ................................................................................ 99
IAR C-SPY Debugger and target systems ......................................... 99
Debugger .......................................................................................... 100
Target system ................................................................................... 100
User application ............................................................................... 100
IAR C-SPY Debugger systems ........................................................ 100
ROM-monitor program .................................................................... 100
Third-party debuggers ...................................................................... 101
The C-SPY environment ................................................................... 101
An integrated environment ............................................................... 101
Customizing the debugger workspace ........................................ 103
Displaying the source code .............................................................. 103
Organizing the windows on the screen ............................................ 104
Redirecting debugger output to a file ............................................... 106
Configuring the debugger ........................................................................... 107
Adapting C-SPY to target hardware ............................................ 107
Device description file ..................................................................... 107
Hardware multiplier ......................................................................... 109
Initializing the IAR C-SPY Debugger ........................................... 109
Selecting debug driver ..................................................................... 109
Executing from reset ....................................................................... 109
Automating the initialization using a setup file ............................... 110
Selecting a device description file ................................................... 110
Executing your application ......................................................................... 111
U430-2
vii

viii
Source and disassembly mode debugging ................................. 111
Executing .................................................................................................. 112
Step ................................................................................................... 112
Go ..................................................................................................... 114
Run to Cursor ................................................................................... 114
Highlighting ..................................................................................... 114
Using breakpoints to stop ................................................................. 114
Using the Break button to stop ......................................................... 115
Stop at program exit ......................................................................... 115
Call stack information ........................................................................ 115
Terminal input and output ............................................................... 116
Working with variables and expressions ............................................ 117
C-SPY expressions ............................................................................... 117
C symbols ......................................................................................... 117
Assembler symbols .......................................................................... 118
Macro functions .............................................................................. 118
Macro variables ............................................................................... 118
Limitations on variable information ............................................. 119
Effects of optimizations ................................................................... 119
Viewing variables and expressions ................................................ 120
Working with the windows .............................................................. 120
Using breakpoints ........................................................................................... 123
The breakpoint system ...................................................................... 123
Defining breakpoints ........................................................................... 123
Toggling a simple code breakpoint .................................................. 124
Setting a data breakpoint in the Memory window ........................... 124
Defining breakpoints using the dialog box ...................................... 125
Defining breakpoints using system macros ..................................... 126
Monitoring memory and registers ........................................................ 129
Using the Memory window .............................................................. 129
Working with registers ...................................................................... 131
Register groups ................................................................................ 131
U430-2
MSP430 IAR Embedded Workbench™ IDEUser Guide

Contents
Using the Stack window .................................................................... 133
Measuring the stack depth ................................................................ 133
Using C-SPY macros ..................................................................................... 135
The macro system ................................................................................ 135
The macro language ......................................................................... 136
The macro file .................................................................................. 136
Setup macro functions ...................................................................... 137
Using C-SPY macros ........................................................................... 137
Using the Macro Configuration dialog box ..................................... 138
Registering and executing using setup macros and setup files ........ 139
Executing macros using Quick Watch ............................................ 140
Executing a macro by connecting it to a breakpoint ........................ 141
Analyzing your application ......................................................................... 143
Function-level profiling ...................................................................... 143
Using the profiler ............................................................................. 143
Code coverage ....................................................................................... 146
Using Code Coverage ...................................................................... 146
Part 5. IAR C-SPY Simulator .............................................. 149
Simulator introduction ................................................................................ 151
The IAR C-SPY Simulator ................................................................ 151
Features ............................................................................................ 151
Selecting the simulator driver .......................................................... 151
Simulator functionality ................................................................................. 153
Driver-specific characteristics ......................................................... 153
Immediate breakpoints ..................................................................... 153
Memory configuration ........................................................................ 154
Memory map .................................................................................... 154
Simulator menu .................................................................................... 156
Simulating interrupts ..................................................................................... 157
U430-2
ix

x
The C-SPY interrupt simulation system .................................... 157
Interrupt characteristics .................................................................... 158
Adapting the interrupt system for MSP430 ..................................... 158
Specifying interrupt characteristics .............................................. 159
Using the dialog box ........................................................................ 160
Using macros .................................................................................... 161
Simulating a simple interrupt ......................................................... 162
Description of interrupt system macros .................................... 164
Part 6. IAR C-SPY ROM-monitor .................................. 167
Introduction to the IAR C-SPY ROM-monitor .............................. 169
The MSP430 C-SPY ROM-monitor .............................................. 169
The ROM-monitor programs ........................................................... 170
Differences between the C-SPY ROM-monitor and simulator ....... 171
Getting started ...................................................................................... 171
C-SPY ROM-monitor functionality ....................................................... 173
Driver-specific characteristics ......................................................... 173
Single-stepping ................................................................................. 173
Breakpoints ...................................................................................... 173
Stopping the user application ........................................................... 173
Reset ................................................................................................. 174
Terminal I/O and program exit ........................................................ 174
Interrupt vector table ........................................................................ 174
Stack space ....................................................................................... 175
Registers ........................................................................................... 175
Memory configuration ........................................................................ 175
Memory map .................................................................................... 175
Modifying the linker command file ................................................. 175
Resolving problems .............................................................................. 176
General problems with target memory ............................................. 176
STOP only works from time to time ................................................ 176
Write failure during load .................................................................. 177
U430-2
MSP430 IAR Embedded Workbench™ IDEUser Guide

Contents
Monitor works, but application does not run ................................... 177
Monitor crashes when running an application ................................. 177
No contact with the monitor ............................................................. 177
Serial communication ......................................................................... 178
Register usage .................................................................................. 179
Downloading a stand-alone application ...................................... 179
The C-SPY ROM-monitor options ....................................................... 181
Setup options .......................................................................................... 181
ROM-monitor options ........................................................................ 182
Verify download .............................................................................. 182
ROM-monitor download control ..................................................... 182
Application download control .......................................................... 182
Serial communication options ........................................................ 183
Log communication ......................................................................... 184
Part 7. IAR C-SPY FET Debugger ................................. 185
Introduction to the IAR C-SPY FET Debugger .............................. 187
The FET C-SPY Debugger ................................................................ 187
Supported devices ............................................................................ 188
Differences between the C-SPY FET and the simulator .................. 188
Hardware installation ......................................................................... 189
Hardware Installation, MSP-FET430X110 ...................................... 189
Hardware Installation, MSP-FET430Pxx0 ...................................... 189
Getting started ...................................................................................... 190
Running a demo application ............................................................ 190
C-SPY FET driver-specific characteristics .......................................... 193
Using breakpoints ................................................................................. 193
Hardware and virtual breakpoints .................................................... 193
System breakpoints .......................................................................... 194
Customizing the use of breakpoints ................................................. 194
Breakpoints and interrupts ............................................................... 195
Stepping .................................................................................................... 196
U430-2
xi

xii
Using state storage .............................................................................. 196
Using sequencer .................................................................................... 198
Memory configuration ........................................................................ 200
C-SPY FET communication ............................................................. 200
Releasing JTAG ............................................................................... 200
Parallel port designators ................................................................... 200
Troubleshooting ............................................................................... 201
C-SPY FET Debugger options and menus ......................................... 203
Setup options .......................................................................................... 203
Flash Emulation Tool .......................................................................... 204
Verify download .............................................................................. 204
Download control ............................................................................. 204
Parallel Port ...................................................................................... 205
Use virtual breakpoints .................................................................... 205
System breakpoints on ..................................................................... 205
Enhanced Emulation Module (EEM) breakpoints ................... 206
Emulator menu ..................................................................................... 209
State Storage dialog box .................................................................. 211
State Storage Window ...................................................................... 213
Sequencer dialog box ....................................................................... 214
Design considerations for in-circuit programming ....................... 217
Bootstrap loader ................................................................................... 217
Device signals ......................................................................................... 217
External power ...................................................................................... 217
Signal connections for in-system programming ..................... 218
MSP-FET430X110 .......................................................................... 218
MSP-FET430Pxx0 (‘P120, ‘P140, ‘P410, ‘P440) ........................... 219
Part 8. Reference information ........................................... 221
IAR Embedded Workbench IDE reference ....................................... 223
Windows ................................................................................................... 223
IAR Embedded Workbench IDE window ....................................... 224
U430-2
MSP430 IAR Embedded Workbench™ IDEUser Guide

Contents
Workspace window .......................................................................... 226
Editor window .................................................................................. 228
Messages window ............................................................................ 230
Menus ......................................................................................................... 231
File menu .......................................................................................... 231
Edit menu ......................................................................................... 233
View menu ....................................................................................... 240
Project menu .................................................................................... 241
Tools menu ....................................................................................... 244
Window menu .................................................................................. 259
Help menu ........................................................................................ 260
C-SPY Debugger IDE reference ............................................................. 261
C-SPY windows ...................................................................................... 261
Editing in C-SPY windows .............................................................. 261
IAR C-SPY Debugger window ........................................................ 262
Disassembly window ....................................................................... 264
Memory window .............................................................................. 266
Register window .............................................................................. 268
Watch window ................................................................................. 269
Locals window ................................................................................. 270
Call Stack window ........................................................................... 271
Log window ..................................................................................... 272
Terminal I/O window ....................................................................... 272
Code Coverage window ................................................................... 273
Profiling window .............................................................................. 274
Trace window ................................................................................... 276
Stack window ................................................................................... 279
C-SPY menus .......................................................................................... 280
Debug menu ..................................................................................... 281
Simulator menu ................................................................................ 286
Emulator menu ................................................................................. 286
General options .............................................................................................. 287
The general options ............................................................................. 287
U430-2
xiii

xiv
Target ........................................................................................................ 288
Device .............................................................................................. 288
Position-independent code ............................................................... 288
Hardware multiplier ......................................................................... 288
Output ....................................................................................................... 289
Output file ........................................................................................ 289
Output directories ............................................................................. 289
Library ....................................................................................................... 290
Compiler options ........................................................................................... 291
The compiler options .......................................................................... 291
Language .................................................................................................. 292
Enable Embedded C++ syntax ......................................................... 292
Require prototypes ........................................................................... 292
Enable IAR migration preprocessor extension ................................ 292
Language conformance .................................................................... 293
Plain 'char' is ................................................................................... 293
Enable multibyte support ................................................................. 293
Code ........................................................................................................... 294
Optimizations ................................................................................... 294
Enabled transformations .................................................................. 295
ROM-monitor-compatible code ...................................................... 296
Output ....................................................................................................... 297
Make library module ........................................................................ 297
Object module name ........................................................................ 297
Generate debug info ......................................................................... 298
List ............................................................................................................... 298
Preprocessor ........................................................................................... 299
Include paths .................................................................................... 299
Defined symbols .............................................................................. 299
Preprocessor output to file ............................................................... 300
Diagnostics .............................................................................................. 300
Enable remarks ................................................................................. 300
Suppress these diagnostics ............................................................... 301
U430-2
MSP430 IAR Embedded Workbench™ IDEUser Guide

Contents
Treat these as remarks ...................................................................... 301
Treat these as warnings .................................................................... 301
Treat these as errors ........................................................................ 301
Treat all warnings as errors .............................................................. 301
Assembler options ......................................................................................... 303
The assembler options ....................................................................... 303
Code generation ................................................................................... 304
Case-sensitive user symbols ............................................................. 304
Disable #ifdef/#endif matching ........................................................ 304
Make a LIBRARY module .............................................................. 304
Max number of errors ...................................................................... 305
Warnings .......................................................................................... 305
Macro quote chars ............................................................................ 305
Debug ......................................................................................................... 306
Generate debug information ............................................................. 306
#define ....................................................................................................... 307
List ............................................................................................................... 308
Include header .................................................................................. 308
Include listing ................................................................................... 308
Include cross-reference .................................................................... 309
Lines/page ........................................................................................ 309
Tab spacing ...................................................................................... 309
#undef ........................................................................................................ 309
#undef ............................................................................................... 310
Include ....................................................................................................... 310
Include ............................................................................................. 310
XLINK options ................................................................................................ 311
The XLINK options ............................................................................. 311
Output ....................................................................................................... 312
Output file ....................................................................................... 312
Format .............................................................................................. 312
#define ....................................................................................................... 314
Define symbol ................................................................................. 314
U430-2
xv

xvi
Diagnostics .............................................................................................. 315
Always generate output .................................................................... 315
Segment overlap warnings ............................................................... 315
No global type checking .................................................................. 315
Range checks .................................................................................... 316
Warnings/Errors ............................................................................... 316
List ............................................................................................................... 317
Generate linker listing ...................................................................... 317
Include ....................................................................................................... 318
Include paths .................................................................................... 318
Library .............................................................................................. 318
XCL filename .................................................................................. 319
Input ........................................................................................................... 319
Module status ................................................................................... 319
Processing ................................................................................................ 321
Fill unused code memory ................................................................. 321
XAR options ..................................................................................................... 323
The XAR options .................................................................................. 323
Custom build options ................................................................................... 325
Custom tool configuration ............................................................... 325
C-SPY options .................................................................................................. 327
C-SPY setup options ........................................................................... 327
Driver ............................................................................................... 327
Run to .............................................................................................. 328
Setup macro ...................................................................................... 328
Device description ........................................................................... 328
C-SPY macros reference ............................................................................ 329
The macro language ............................................................................ 329
Macro functions ............................................................................... 329
Predefined system macro functions ................................................. 329
Macro variables ................................................................................ 330
U430-2
MSP430 IAR Embedded Workbench™ IDEUser Guide

Contents
Macro statements ............................................................................. 330
Setup macro functions summary .................................................. 332
C-SPY system macros summary ................................................... 333
Description of C-SPY system macros .......................................... 334
Glossary .............................................................................................................. 349
Index ..................................................................................................................... 361
U430-2
xvii

xvi
U430-2
iiMSP430 IAR Embedded Workbench™ IDEUser Guide

Tables1: Typographic conventions used in this guide .................................................... xxxiv
2: File types ............................................................................................................... 17
3: General settings for project1 ................................................................................. 29
4: Compiler options for project1 ............................................................................... 30
5: XLINK options for project1 .................................................................................. 34
6: Compiler options for project2 ............................................................................... 48
7: Project options for Embedded C++ tutorial .......................................................... 52
8: Interrupts dialog box ............................................................................................. 63
9: Breakpoints dialog box ......................................................................................... 64
10: XLINK options for project 5 ............................................................................... 68
11: XLINK options fpr library project ..................................................................... 69
12: Command shells .................................................................................................. 77
13: C-SPY assembler symbols expressions ............................................................ 118
14: Handling name conflicts between hardware registers and assembler labels ..... 118
15: Project options for enabling profiling ............................................................... 143
16: Project options for enabling code coverage ...................................................... 146
17: __setSimBreak return values ............................................................................ 154
18: Description of Simulator menu commands ....................................................... 156
19: Timer interrupt settings ..................................................................................... 163
20: __cancelInterrupt return values ......................................................................... 164
21: __disableInterrupts return values ...................................................................... 164
22: __enableInterrupts return values ....................................................................... 165
23: Simulator and ROM-monitor differences ......................................................... 171
24: Registers used by simulated UART .................................................................. 179
25: Serial Port options ............................................................................................. 183
26: Simulator and FET differences ......................................................................... 188
27: Project options for FET assembler example ..................................................... 190
28: Project options for FET C example ................................................................... 191
29: Available hardware breakpoints ........................................................................ 193
30: Sequencer settings - example ............................................................................ 199
31: State storage settings - example ........................................................................ 199
U430-2
xix

xx
32: Break at location types ...................................................................................... 207
33: EEM breakpoint types ....................................................................................... 207
34: EEM breakpoint conditions ............................................................................... 208
35: EEM breakpoint access types ............................................................................ 208
36: Emulator menu commands ................................................................................ 209
37: Columns in State Storage window .................................................................... 213
38: IAR Embedded Workbench IDE menu bar ....................................................... 224
39: Workspace window context menu commands .................................................. 227
40: Editor keyboard commands for insertion point navigation ............................... 229
41: Editor keyboard commands for scrolling .......................................................... 229
42: Editor keyboard commands for selecting text ................................................... 229
43: Pages on Messages window .............................................................................. 230
44: File menu commands ........................................................................................ 232
45: Edit menu commands ........................................................................................ 233
46: Find dialog box options ..................................................................................... 235
47: Replace dialog box options ............................................................................... 235
48: Find in Files dialog box options ........................................................................ 236
49: Breakpoint types ................................................................................................ 238
50: Break at location types ...................................................................................... 238
51: Memory access types ........................................................................................ 239
52: Breakpoint conditions ....................................................................................... 239
53: View menu commands ...................................................................................... 240
54: Project menu commands ................................................................................... 241
55: Argument variables ........................................................................................... 242
56: Project option categories ................................................................................... 243
57: Tools menu commands ..................................................................................... 244
58: External Editor options ..................................................................................... 245
59: Key Bindings page options ............................................................................... 247
60: Editor page options ........................................................................................... 248
61: Editor Colors and Fonts page options ............................................................... 250
62: Project page options .......................................................................................... 251
63: Messages page options ...................................................................................... 252
64: Debugger page options ...................................................................................... 253
65: Register Filter options ....................................................................................... 254
U430-2
MSP430 IAR Embedded Workbench™ IDEUser Guide
Tables
66: Configure Tools dialog box options .................................................................. 255
67: Command shells ................................................................................................ 256
68: Window menu commands ................................................................................. 259
69: Help menu commands ....................................................................................... 260
70: Editing in C-SPY windows ............................................................................... 261
71: C-SPY menu ...................................................................................................... 263
72: Disassembly window operations ....................................................................... 264
73: Disassembly context menu commands ............................................................. 265
74: Memory window operations ............................................................................. 266
75: Fill dialog options ............................................................................................. 267
76: Memory fill operations ...................................................................................... 268
77: Description of each profiling column ............................................................... 275
78: Trace toolbar commands ................................................................................... 277
79: Trace context commands ................................................................................... 278
80: Stack window operations .................................................................................. 279
81: Stack window settings ....................................................................................... 280
82: Description of Debug menu commands ............................................................ 281
83: Log file options ................................................................................................. 285
84: Compiler optimization levels ............................................................................ 294
85: Compiler list file options ................................................................................... 298
86: Assembler list file options ................................................................................. 308
87: XLINK range check options ............................................................................. 316
88: XLINK list file options ..................................................................................... 317
89: XLINK checksum algorithms ........................................................................... 321
90: C-SPY driver options ........................................................................................ 328
91: Examples of C-SPY macro variables ................................................................ 330
92: C-SPY setup macros ......................................................................................... 332
93: Summary of system macros .............................................................................. 333
94: __driverType return values ............................................................................... 336
95: __openFile return values ................................................................................... 336
96: __readFile return values ................................................................................... 337
97: __setCodeBreak return values .......................................................................... 341
98: __setDataBreak return values ........................................................................... 343
U430-2
xxi

xxi
U430-2
iMSP430 IAR Embedded Workbench™ IDEUser Guide

Figures1: Directory structure ................................................................................................ 15
2: New dialog box ..................................................................................................... 26
3: New Workspace dialog box .................................................................................. 26
4: New Project dialog box ......................................................................................... 27
5: Workspace window ............................................................................................... 27
6: Adding files to project1 ......................................................................................... 28
7: Setting General options ......................................................................................... 29
8: Setting compiler options ....................................................................................... 30
9: Compilation message ............................................................................................ 31
10: Workspace window after compilation ................................................................ 32
11: Setting the option Scan for Changed Files .......................................................... 33
12: XLINK options dialog box for project1 .............................................................. 34
13: The C-SPY Debugger ......................................................................................... 38
14: Stepping in C-SPY .............................................................................................. 39
15: Using Step Into in C-SPY ................................................................................... 40
16: Inspecting variables in the Locals window ......................................................... 41
17: Watching variables in the Watch window .......................................................... 41
18: Setting breakpoints .............................................................................................. 42
19: Debugging in disassembly mode ........................................................................ 43
20: Register window .................................................................................................. 44
21: Monitoring memory ............................................................................................ 44
22: Displaying memory contents as 16-bit units ....................................................... 45
23: Output from the I/O operations ........................................................................... 46
24: Reaching program exit in C-SPY ........................................................................ 46
25: Assembler settings for creating a list file ............................................................ 49
26: Setting a breakpoint in CPPtutor.cpp .................................................................. 52
27: Setting the breakpoint condition ......................................................................... 53
28: Inspecting the function calls ................................................................................ 54
29: Printing Fibonacci sequences .............................................................................. 55
30: Specifying setup macro file ................................................................................. 61
31: Inspecting the interrupt settings .......................................................................... 62
U430-2
xxiii

xxi
32: Displaying breakpoint information ..................................................................... 64
33: Printing the Fibonacci values in the Terminal I/O window ................................ 65
34: IAR Embedded Workbench IDE window ........................................................... 74
35: Configure Tools dialog box ................................................................................ 76
36: Customized Tools menu ...................................................................................... 77
37: Examples of workspaces and projects ................................................................. 80
38: Displaying a project in the workspace window .................................................. 83
39: Workspace window—an overview ..................................................................... 84
40: General options ................................................................................................... 86
41: Project menu ........................................................................................................ 87
42: Editor window ..................................................................................................... 91
43: Editor window status bar ..................................................................................... 94
44: Specifying external command-line editor ........................................................... 95
45: External editor DDE settings .............................................................................. 96
46: IAR C-SPY Debugger and target systems .......................................................... 99
47: Embedded Workbench with C-SPY started ...................................................... 102
48: Debugger settings .............................................................................................. 103
49: C-SPY windows layout example 1 ................................................................... 105
50: C-SPY windows layout example 2 ................................................................... 106
51: Zones in C-SPY ................................................................................................. 108
52: Quick Watch dialog box .................................................................................... 121
53: Trace window (Expression page) ...................................................................... 121
54: Trace window (Output page) ............................................................................ 122
55: Breakpoint on a function call ............................................................................ 124
56: Breakpoints dialog box ..................................................................................... 125
57: Memory window ............................................................................................... 129
58: Memory Fill dialog box .................................................................................... 130
59: Register window ................................................................................................ 131
60: Register Filter page ........................................................................................... 132
61: Measuring the stack ........................................................................................... 133
62: Macro Configuration dialog box ....................................................................... 139
63: Quick Watch dialog box .................................................................................... 141
64: Profiling window ............................................................................................... 144
65: Graphs in Profiling window .............................................................................. 145
U430-2
vMSP430 IAR Embedded Workbench™ IDEUser Guide
Figures
66: Function details window ................................................................................... 145
67: Code Coverage window .................................................................................... 147
68: Memory Map dialog box ................................................................................... 155
69: Simulator menu ................................................................................................. 156
70: Simulated interrupt configuration ..................................................................... 158
71: Interrupts dialog box ......................................................................................... 160
72: Communication overview ................................................................................. 170
73: Serial Port page ................................................................................................. 183
74: Communication overview ................................................................................. 188
75: The Used Breakpoints window ......................................................................... 195
76: Flash Emulation Tool options ........................................................................... 204
77: EEM breakpoints dialog box ............................................................................. 206
78: Emulator menu .................................................................................................. 209
79: State Storage dialog box .................................................................................... 211
80: State Storage window ........................................................................................ 213
81: Sequencer dialog box ........................................................................................ 214
82: JTAG signal connection (MSP-FET430X110) ................................................. 219
83: JTAG signal connection (MSP-FET430Pxx0) .................................................. 220
84: IAR Embedded Workbench IDE window ......................................................... 224
85: IAR Embedded Workbench IDE toolbar .......................................................... 225
86: IAR Embedded Workbench IDE window status bar ........................................ 226
87: Project window .................................................................................................. 226
88: Workspace window context menu .................................................................... 227
89: Editor window ................................................................................................... 228
90: Messages window ............................................................................................. 230
91: Messages window context menu ....................................................................... 231
92: File menu ........................................................................................................... 232
93: Edit menu .......................................................................................................... 233
94: Breakpoints dialog box ..................................................................................... 237
95: View menu ........................................................................................................ 240
96: Project menu ...................................................................................................... 241
97: Tools menu ........................................................................................................ 244
98: External Editor page with command line settings ............................................. 245
99: Common Fonts page ......................................................................................... 246
U430-2
xxv

xxv
100: Key Bindings page .......................................................................................... 247
101: Editor page ...................................................................................................... 248
102: Editor Colors and Fonts page .......................................................................... 249
103: Projects page ................................................................................................... 250
104: Messages page ................................................................................................. 252
105: Debugger page ................................................................................................ 253
106: Register Filter page ......................................................................................... 254
107: Configure Tools dialog box ............................................................................ 255
108: Customized Tools menu .................................................................................. 256
109: File Extensions dialog box .............................................................................. 257
110: File Extension Overrides dialog box ............................................................... 258
111: Edit File Extensions dialog box ...................................................................... 258
112: Window menu ................................................................................................. 259
113: Embedded Workbench with C-SPY Simulator started ................................... 262
114: C-SPY debug toolbar ...................................................................................... 263
115: C-SPY Disassembly window .......................................................................... 264
116: Disassembly window context menu ................................................................ 265
117: Memory window ............................................................................................. 266
118: Memory window context menu ...................................................................... 267
119: Fill dialog box ................................................................................................. 267
120: Register window .............................................................................................. 268
121: Watch window ................................................................................................ 269
122: Watch window context menu .......................................................................... 270
123: Locals window ................................................................................................ 270
124: C-SPY Watch window context menu ............................................................. 271
125: Call Stack window .......................................................................................... 271
126: Log window .................................................................................................... 272
127: Terminal I/O window ...................................................................................... 272
128: Code Coverage window .................................................................................. 273
129: Code coverage context menu .......................................................................... 273
130: Profiling window ............................................................................................. 274
131: Profiling context menu .................................................................................... 275
132: Trace window (Expression page) .................................................................... 276
133: Trace window (Output page) .......................................................................... 277
U430-2
iMSP430 IAR Embedded Workbench™ IDEUser Guide

Figures
134: Trace window context menu ........................................................................... 278
135: Stack window .................................................................................................. 279
136: Stack Settings dialog box ................................................................................ 280
137: Debug menu .................................................................................................... 281
138: Quick Watch dialog box .................................................................................. 283
139: Macro Configuration dialog box ..................................................................... 284
140: Log File dialog box ......................................................................................... 285
141: Terminal I/O Log File dialog box ................................................................... 286
142: Setting project options ..................................................................................... 287
143: Target options .................................................................................................. 288
144: Output options ................................................................................................. 289
145: Library options ................................................................................................ 290
146: Compiler options ............................................................................................. 291
147: Compiler language options ............................................................................. 292
148: Compiler code options .................................................................................... 294
149: Compiler output options .................................................................................. 297
150: Compiler list file options ................................................................................. 298
151: Compiler preprocessor options ....................................................................... 299
152: Compiler diagnostics options .......................................................................... 300
153: Assembler options ........................................................................................... 303
154: Assembler code generation options ................................................................ 304
155: Selecting macro quote characters .................................................................... 305
156: Assembler debug options ................................................................................ 306
157: Assembler defined symbols options ................................................................ 307
158: Assembler list file options ............................................................................... 308
159: Assembler undefined symbols options ............................................................ 309
160: Assembler include files options ...................................................................... 310
161: XLINK options ................................................................................................ 311
162: XLINK output file options .............................................................................. 312
163: XLINK defined symbols options .................................................................... 314
164: XLINK diagnostics options ............................................................................. 315
165: XLINK list file options ................................................................................... 317
166: XLINK include files options ........................................................................... 318
167: XLINK input files options .............................................................................. 319
U430-2
xxvii

xxv
168: XLINK processing options ............................................................................. 321
169: XAR output options ........................................................................................ 323
170: Custom tool options ........................................................................................ 325
171: Generic C-SPY options ................................................................................... 327
U430-2
iiiMSP430 IAR Embedded Workbench™ IDEUser Guide

PrefaceWelcome to the MSP430 IAR Embedded Workbench™ IDE User Guide. The purpose of this guide is to help you fully utilize the features in the MSP430 IAR Embedded Workbench with its integrated Windows development tools for the MSP430 microcontroller. The IAR Embedded Workbench is a very powerful Integrated Development Environment that allows you to develop and manage a complete embedded application project.
The user guide includes product overviews and reference information, as well as tutorials that will help you get started. It also describes the processes of editing, project managing, building, and debugging.
Who should read this guideYou should read this guide if you want to get the most out of the features and tools available in the IAR Embedded Workbench. In addition, you should have a working knowledge of the following:
� The C or Embedded C++ programming language� Application development for embedded systems� The architecture and instruction set of the MSP430 microcontroller (refer to the
chip manufacturer's documentation)� The operating system of your host machine.
Refer to the MSP430 IAR C/EC++ Compiler Reference Guide, MSP430 IAR Assembler Reference Guide, and IAR Linker and Library Tools Reference Guide for more information about the other development tools incorporated in the IAR Embedded Workbench IDE.
How to use this guideIf you are new to using this product, we suggest that you start by reading Part 1. Product overview to give you a complete overview of the tools and the functions that the IAR Embedded Workbench can offer.
U430-2
xxix

xxx
What this guide contains
If you already have had some experience using the IAR Embedded Workbench, but need refreshing on how to work with the IAR development tools, Part 2. Tutorials is a good place to begin. The process of managing projects and building, as well as editing, can be found in Part 3. Project management and building, page 71. Whereas information about how to use the C-SPY Debugger can be found in Part 4. Debugging, page 97.
If you are an experienced user and need this guide only for reference information, see the reference chapters in Part 8. Reference information.
Finally, we recommend the Glossary if you should encounter any unfamiliar terms in the IAR Systems user and reference guides.
What this guide containsBelow is a brief outline and summary of the chapters in this guide.
Part 1. Product overview
This section provides a general overview of all the IAR development tools so that you can become familiar with them:
� Product introduction provides a brief summary and lists the features offered in each of the IAR Systems development tools—IAR Embedded Workbench™ IDE, IAR C/EC++ Compiler, IAR Assembler, IAR XLINK Linker™, IAR XAR Library Builder™, IAR XLIB Librarian™, and IAR C-SPY™ Debugger—for the MSP430 microcontroller.
� Installed files describes the directory structure and the type of files it contains. The chapter also includes an overview of the documentation supplied with the IAR development tools.
Part 2. Tutorials
The tutorials give you hands-on training in order to help you get started with using the tools:
� Creating an application project guides you through setting up a new project, compiling the program, examining the list file, and linking the program. The tutorial demonstrates a typical development cycle, which is continued with debugging in the next chapter.
� Debugging using the IAR C-SPY™ Debugger explores the basic facilities of the debugger.
� Mixing C and assembler modules demonstrates how you can easily combine source modules written in C with assembler modules. The chapter also demonstrates how the compiler can be used for examining the calling convention.
U430-2
MSP430 IAR Embedded Workbench™ IDEUser Guide

Preface
� Using Embedded C++ shows how Embedded C++ is used for creating an EC++ class, which creates two independent objects. The application is then built and debugged.
� Simulating an interrupt shows how you can add an interrupt handler to the project and how this interrupt can be simulated using C-SPY facilities for simulated interrupts, breakpoints, and macros.
� Working with library modules demonstrates how to create library modules.
Part 3. Project management and building
This section describes the process of editing and building your application program:
� The development environment introduces you to the IAR Embedded Workbench development environment. The chapter also demonstrates the facilities available for customizing the environment to meet your requirements.
� Managing projects describes how you can create workspaces with multiple projects, build configurations, groups, source files, and options that helps you handle different versions of your applications.
� Building discusses the process of building your application.� Editing contains detailed descriptions about the IAR Embedded Workbench editor,
how to use it, and the facilities related to its usage. The final section also contains information about how to import an external editor of your choice.
Part 4. Debugging
This section gives conceptual information about C-SPY functionality and how to use it:
� The IAR C-SPY Debugger introduces some of the concepts that are related to debugging in general and to the IAR C-SPY Debugger in particular. It also introduces you to the C-SPY environment and the facilities for customizing it.
� Configuring the debugger describes how you can configure the C-SPY debugger to reflect the target hardware.
� Executing your application describes how you initialize the IAR C-SPY Debugger, the conceptual differences between source and disassembly mode debugging, the facilities for executing your application program, and finally, how you can handle terminal input and output.
� Working with variables and expressions defines the syntax of the expressions and variables used in C-SPY, as well as the limitations on variable information. The chapter also demonstrates the different methods for monitoring variables and expressions.
� Using breakpoints describes the breakpoint system and the different ways to define breakpoints.
� Monitoring memory and registers shows how you can examine memory and registers.
U430-2
xxxi

xxx
What this guide contains
� Using C-SPY macros describes the C-SPY macro system, its features, for what purposes these features can be used, and how to use them.
� Analyzing your application presents facilities for analyzing your program.
Part 5. IAR C-SPY Simulator
� Simulator introduction gives a brief introduction to the simulator.� Simulator functionality describes the functionality specific to the simulator.� Simulating interrupts contains detailed information about the C-SPY interrupt
simulation system and how to configure the simulated interrupts to make them reflect the interrupts of your target hardware.
Part 6. IAR C-SPY ROM-monitor
� Introduction to the IAR C-SPY ROM-monitor introduces you to the C-SPY ROM-monitor. The chapter briefly shows the difference in functionality provided by the ROM-monitor and the simulator drivers.
� C-SPY ROM-monitor functionality describes the additional features provided by the C-SPY ROM-monitor.
� The C-SPY ROM-monitor options describes the additional options specific to the C-SPY ROM-monitor.
Part 7. IAR C-SPY FET Debugger
� Introduction to the IAR C-SPY FET Debugger introduces you to the C-SPY Flash Emulation Tool (FET) Debugger. The chapter briefly shows the difference in functionality provided by the FET Debugger and the simulator drivers.
� C-SPY FET Debugger options and menus describes the additional options and menus specific to the C-SPY FET Debugger.
� C-SPY FET driver-specific characteristics describes the additional functionality provided by the FET driver.
� Design considerations for in-circuit programming describes the design considerations related to the bootstrap loader, device signals, and external power if you want to use C-SPY with your own hardware.
Part 8. Reference information
� IAR Embedded Workbench IDE reference contains detailed reference information about the development environment, such as details about the graphical user interface.
� C-SPY Debugger IDE reference provides detailed reference information about the graphical user interface of the IAR C-SPY Debugger.
� General options specifies the runtime, output, and library object file options.� Compiler options specifies compiler options for language, code, output, list file,
preprocessor, and diagnostics.
U430-2
iiMSP430 IAR Embedded Workbench™ IDEUser Guide
Preface
� Assembler options describes the assembler options for code generation, debugging, preprocessor, and list file generation.
� XLINK options describes the XLINK options for output, defining symbols, diagnostics, list generation, setting up the include paths, input, and processing.
� Custom build options describes the options available for custom tool configuration.� C-SPY options gives reference information about generic C-SPY options.� C-SPY macros reference gives reference information about C-SPY macros, such as
a syntax description of the macro language, summaries of the available setup macro functions, and pre-defined system macros. Finally, a description of each system macro is provided.
Glossary
The glossary contains definitions of programming terms.
Other documentationThe complete set of IAR development tools for the MSP430 microcontroller are described in a series of guides. For information about:
� Programming for the MSP430 IAR C/EC++ Compiler, refer to the MSP430 IAR C/EC++ Compiler Reference Guide
� Programming for the MSP430 IAR Assembler, refer to the MSP430 IAR Assembler Reference Guide
� Using the IAR XLINK Linker™, the IAR XAR Library Builder™, and the IAR XLIB Librarian™, refer to the IAR Linker and Library Tools Reference Guide
� Using the IAR CLIB C Library, refer to the IAR C Library Functions Reference Guide, available from the MSP430 IAR Embedded Workbench IDE Help menu.
� Using the IAR DLIB Embedded C++ Library, refer to the C++ Library Reference, available from the MSP430 IAR Embedded Workbench IDE Help menu.
All of these guides are delivered in PDF or HTML format on the installation media. Some of them are also delivered as printed books.
Recommend websites:
� The Texas Instruments website, www.ti.com, contains information and news about the MSP430 microcontrollers.
� The IAR website, www.iar.com, holds application notes and other product information.
� Finally, the Embedded C++ Technical Committee website, www.caravan.net/ec2plus, contains information about the Embedded C++ standard.
U430-2
xxxiii

xxx
Document conventions
Document conventionsThis book uses the following typographic conventions:
Style Used for
computer Text that you enter or that appears on the screen.
parameter A label representing the actual value you should type as part of a command.
[option] An optional part of a command.
{a | b | c} Alternatives in a command.
bold Names of menus, menu commands, buttons, and dialog boxes that appear on the screen.
reference A cross-reference within this guide or to another guide.
Identifies instructions specific to the IAR Embedded Workbench interface.
Identifies instructions specific to the command line interface.
Identifies helpful tips and programming hints.
Table 1: Typographic conventions used in this guide
U430-2
ivMSP430 IAR Embedded Workbench™ IDEUser Guide
Part 1. Product overviewThis part of the MSP430 IAR Embedded Workbench™ IDE User Guide includes the following chapters:
� Product introduction
� Installed files.
U430-2
1

2
U430-2

Product introductionThe IAR Embedded Workbench™ is a very powerful Integrated Development Environment (IDE), that allows you to develop and manage complete embedded application projects. It is a development platform, with all the features you would expect to find in your everyday working place.
This chapter describes the IAR Embedded Workbench IDE and provides a general overview of all the tools that are integrated in this product.
The IAR Embedded Workbench IDEThe IAR Embedded Workbench IDE is the framework where all necessary tools are seamlessly integrated:
� The highly optimized IAR MSP430 C/EC++ compiler� The IAR MSP430 assembler� The versatile IAR XLINK Linker™� The IAR XAR Library Builder™ and the IAR XLIB Librarian™� A powerful editor� A project manager with Make utility� IAR C-SPY™ debugger, a state-of-the-art high-level language debugger.
The IAR Embedded Workbench is available for a large number of microprocessors and microcontrollers in the 8-, 16-, and 32-bit segments, allowing you to stay within a well-known development environment also for your next project. It provides an easy-to-learn and highly efficient development environment with maximum code inheritance capabilities, comprehensive and specific target support. The IAR Embedded Workbench promotes a useful working methodology, and thus a significant reduction of the development time can be achieved by using the IAR tools. We call this concept “Different Architectures. One Solution.”
If you want detailed information about supported target processors, contact your software distributor or your IAR representative, or visit the IAR website www.iar.com for information about recent product releases.
U430-2
Part 1. Product overview 3
4
The IAR Embedded Workbench IDE
AN EXTENSIBLE AND MODULAR ENVIRONMENT
Although the IAR Embedded Workbench IDE provides all the features required for a successful project, we also recognize the need to integrate other tools. Therefore the IAR Embedded Workbench can be easily adapted to work with your editor of choice. The IAR XLINK Linker can produce a large number of output formats, allowing for debugging on most third-party emulators. RTOS support can also be added to the product.
The compiler, assembler, and linker can also be run from a command line environment, if you want to use them as external tools in an already established project environment.
FEATURES
The IAR Embedded Workbench is a flexible integrated development environment, allowing you to develop applications for a variety of different target processors. It provides a convenient Windows interface for rapid development and debugging.
Project management
The IAR Embedded Workbench IDE comes with functions that will help the developer to stay in control of all project modules like C or Embedded C++ source code files, assembler files, include files and other related modules. You create workspaces and let them contain one or several projects. Modules can be grouped, and options can be set on all levels—project, group, or file. Changes are tracked so that a request for rebuild will retranslate all required modules, making sure that no executables contain out-of-date modules.
� Hierarchical project representation� Projects build in the background, allowing simultaneous editing� Options can be set globally, on groups of source files, or on individual source files� The Make utility recompiles, reassembles, and links files only when necessary� Custom Build utility to simplify an expansion of the standard tool chain.
The text editor
The integrated text editor allows editing of multiple files in parallel, and provides all basic editing features expected from a modern editor, including unlimited undo/redo and automatic completion. In addition, it provides functions specific to software development, like coloring of keywords (C/EC++, assembler, and user-defined), block indent, and function navigation within source files. It also recognizes C language elements like matching brackets.
� Syntax of C or Embedded C++ programs shown using text styles and colors� Powerful search and replace commands, including multi-file search� Direct jump to context from error listing
U430-2
MSP430 IAR Embedded Workbench™ IDEUser Guide

Product introduction
� Multi-byte character support� Parenthesis matching� Automatic indentation� Bookmarks� Unlimited undo and redo for each window.
DOCUMENTATION
The MSP430 IAR Embedded Workbench IDE is documented in the MSP430 IAR Embedded Workbench™ IDE User Guide (this guide). There is also help and hypertext versions of the user documentation available online.
IAR C-SPY DebuggerThe IAR C-SPY Debugger is a high-level-language debugger for embedded applications. It is designed for use with the IAR compilers and assemblers, and it is completely integrated in the IAR Embedded Workbench IDE, providing seamless switching between development and debugging. This will give you possibilities such as:
� Editing while debugging. During a debug session, corrections can be made directly into the same source code window that is used to control the debugging. Changes will be included in the next project rebuild.
� Setting source code breakpoints before starting the debugger. Breakpoints in source code will be associated with the same piece of source code even if additional code is inserted.
GENERAL C-SPY DEBUGGER FEATURES
Since IAR Systems provides an entire tool chain, the output provided by the compiler and linker can include extensive debug information for the debugger, resulting in good debugging possibilities for the user. The IAR C-SPY Debugger offers the general features described in this section.
Source and disassembly level debugging
The IAR C-SPY Debugger allows you to switch between source and disassembly debugging as required, for both C or Embedded C++ and assembler source code.
Debugging the C or Embedded C++ source code provides the quickest and easiest way of verifying the program logic of your application whereas disassembly debugging lets you focus on the critical sections of your application, and provides you with precise control over the hardware. In Mixed-Mode display, the debugger also displays the corresponding C/EC++ source code interleaved with the disassembly listing.
U430-2
Part 1. Product overview 5

6
IAR C-SPY Debugger
Single-stepping on a function call level
Compared to traditional debuggers, where the finest granularity for source level stepping is line by line, C-SPY provides a finer level of control by identifying every statement and function call as a step point. This means that each function calls—inside expressions, as well as function calls being part of parameter lists to other functions—can be single-stepped. The latter is especially useful when debugging EC++ code, where numerous extra function calls are made, for example to object constructors.
The debug information also presents inlined functions as if a call were made, making the source code of the inlined function available.
Code and data breakpoints
The C-SPY breakpoint system lets you set breakpoints of various kinds in the application being debugged, allowing you to stop at locations of particular interest. You can set a code breakpoint to investigate whether your program logic is correct. You can also set a data breakpoint, to investigate how and when the data changes. Finally, you can add conditions and connect actions to your breakpoints.
Monitoring variables and expressions
When you work with variables and expressions you get a wide choice of facilities. Any variable and expression can be evaluated in one-shot views. You can easily both monitor and log values of a defined set of expressions during a longer period of time. You have instant control over local variables.
Call stack information
The MSP430 IAR C/EC++ Compiler generates extensive call stack information. This allows C-SPY to show, without any runtime penalty, the complete stack of function calls wherever the program counter is. You can select any function in the call stack, and for each function you get valid information for local variables and registers available.
Powerful macro system
The IAR C-SPY Debugger includes a powerful internal macro system, to allow you to define complex sets of actions to be performed. C-SPY macros can be used solely or in conjunction with complex breakpoints and—if you are using the simulator—the interrupt simulation system to perform a wide variety of tasks.
Additional general C-SPY Debugger features
� A modular and extensible architecture allowing third-party extensions to the debugger
� Threaded execution keeps the IDE responsive while running the target program
U430-2
MSP430 IAR Embedded Workbench™ IDEUser Guide

Product introduction
� Extensive type recognition of variables� Configurable register (CPU and peripherals) and memory windows� Dedicated Stack window� Support for code coverage and function level profiling� Optional terminal I/O emulation� UBROF, Intel-extended, and Motorola input formats supported.
For additional information about the general features of the IAR C-SPY Debugger, refer to Part 4. Debugging in this guide.
IAR C-SPY DEBUGGER SYSTEMS
The IAR C-SPY Debugger consists both of a general part which provides a basic set of C-SPY features, as well as a driver. The C-SPY driver is the part that provides communication with and control of the target system. The driver also provides a user interface—special menus, windows, and dialog boxes—to the functions provided by the target system, for instance, special breakpoints.
At the time of writing this guide, the IAR C-SPY Debugger for the MSP430 microcontroller is available with drivers for the following target systems:
� Simulator� ROM-monitor� Flash Emulation Tool
For further details about the concepts that are related to the IAR C-SPY Debugger, seeDebugger concepts, page 99.
Contact your software distributor or IAR representative for information about available C-SPY drivers. Below are general descriptions of the different drivers.
IAR C-SPY SIMULATOR
The C-SPY simulator driver simulates the functions of the target processor entirely in software. With this driver, the program logic can be debugged long before any hardware is available. Since no hardware is required, it is also the most cost-effective solution for many applications.
Features
In addition to the general features of the C-SPY Debugger the simulator driver also provides:
� Instruction-level simulation� Memory configuration and validation� Interrupt simulation
U430-2
Part 1. Product overview 7

8
IAR C-SPY Debugger
� Peripheral simulation possible through C-SPY macro system in conjunction with immediate breakpoints.
For additional information about the IAR C-SPY Simulator, refer to Part 5. IAR C-SPY Simulator in this guide.
IAR C-SPY ROM-MONITOR
The IAR MSP430 C-SPY ROM-monitor consists of a general C-SPY part, a ROM-monitor driver, and two ROM-monitor programs (firmware), which must be programmed to a non-volatile memory on your target hardware. This firmware runs in parallel with your application software on the target hardware.
The IAR C-SPY ROM-monitor provides real-time debugging to a low cost.
Features
In addition to the general features of the IAR C-SPY Debugger the ROM-monitor driver also provides:
� Execution in real-time� Communication via RS-232 serial cable� Small memory footprint—occupies only 2 Kbytes of non-volatile memory and uses
100 bytes of RAM on your target hardware� Support for real interrupts� Supports the starter kit and evaluation boards from the chip manufacturer, as well as
your own proprietary target hardware as long as it contains an available RS-232 serial connector.
Note: Code coverage and function level profiling is not supported by the C-SPY ROM-monitor.
For additional information about the IAR C-SPY ROM-monitor, refer to Part 6. IAR C-SPY ROM-monitor in this guide.
IAR C-SPY FET DEBUGGER
The IAR C-SPY FET Debugger is a JTAG debugger that supports all Texas Instruments’ FET boards. It provides automatic flash download and takes advantage of on-chip debug facilities.
The IAR C-SPY Flash Emulation Tool provides real-time debugging to a low-cost.
U430-2
MSP430 IAR Embedded Workbench™ IDEUser Guide

Product introduction
Features
In addition to the general features of the IAR C-SPY Debugger the FET driver also provides:
� Execution in real time with full access to the microcontroller� High-speed communication through a JTAG interface� Support for the Enhanced Emulation Module (EEM), which gives you access to
EEM breakpoints, the state storage module, and the sequencer module� Zero memory footprint on target system� Hardware breakpoints for both code and data� Built-in flash down loader.
Note: Code coverage and function level profiling is not supported by the C-SPY FET Debugger. Trace and data breakpoints are available if the device has support for it.
For additional information about the IAR C-SPY FET Debugger, refer to Part 7. IAR C-SPY FET Debugger in this guide.
RTOS AWARENESS
The IAR C-SPY Debugger has functionality for supporting Real-time OS awareness debugging.
RTOS plug-in modules can be provided by IAR, as well as by third-party suppliers. Contact your software distributor or IAR representative, alternatively visit the IAR web site, for information about supported RTOS modules.
DOCUMENTATION
The IAR C-SPY Debugger is documented in the MSP430 IAR Embedded Workbench™ IDE User Guide (this guide). Features generic to the debugger is described in Part 4. Debugging, whereas features specific to each debugger driver is described in the corresponding part. There are also help and hypertext versions of the documentation available online.
IAR C/EC++ CompilerThe MSP430 IAR C/EC++ Compiler is a state-of-the-art compiler that offers the standard features of the C or Embedded C++ language, plus many extensions designed to take advantage of the MSP430-specific facilities.
The compiler is integrated with other IAR Systems software for the MSP430 microcontroller. It is supplied with the MSP430 IAR Assembler, with which it shares linker and librarian tools.
U430-2
Part 1. Product overview 9

10
IAR C/EC++ Compiler
FEATURES
The MSP430 IAR C/EC++ Compiler provides the following features:
Code generation
� Generic and MSP430-specific optimization techniques produce very efficient machine code
� Comprehensive output options, including relocatable object code, assembler source code, and list files with optional assembler mnemonics
� The object code can be linked together with assembler routines� Generation of extensive debug information.
Language facilities
� Support for C or Embedded C++ programming languages� Conformance to the ISO/ANSI C standard for a free-standing environment� Target-specific language extensions, such as: special function types, extended
keywords, #pragma directives, predefined symbols, intrinsic functions, absolute allocation, and inline assembler
� Standard library of functions applicable to embedded systems� IEEE-compatible floating-point arithmetic� Interrupt functions can be written in C or Embedded C++.
Type checking
� External references are type-checked at link time� Extensive type checking at compile time� Link-time inter-module consistency checking of the application.
RUNTIME LIBRARIES
The MSP430 IAR C/EC++ Compiler supports two sets of runtime libraries:
� The IAR CLIB Library, which is a small, efficient library well-suited for 8- and 16-bit processors. This library is not fully compliant with ISO/ANSI C, and does not fully support IEEE 754 floating-point numbers. Embedded C++ is not supported.
� The IAR DLIB Library, which supports ISO/ANSI C and Embedded C++.
Note: CLIB is the default library. However, DLIB must be used if you use the EC++ programming language.
DOCUMENTATION
The MSP430 IAR C/EC++ Compiler is documented in the MSP430 IAR C/EC++ Compiler Reference Guide.
U430-2
MSP430 IAR Embedded Workbench™ IDEUser Guide

Product introduction
IAR AssemblerThe MSP430 IAR Assembler is integrated with other IAR Systems software for the MSP430 microcontroller. It is a powerful relocating macro assembler (supporting the Intel/Motorola style) with a versatile set of directives and expression operators. The assembler features a built-in C language preprocessor and supports conditional assembly.
The MSP430 IAR Assembler uses the same mnemonics and operand syntax as the Texas Instruments MSP430 Assembler, which simplifies the migration of existing code. For detailed information, see the MSP430 IAR Assembler Reference Guide.
FEATURES
The MSP430 IAR Assembler provides the following features:
� C preprocessor� List file with extensive cross-reference output� Number of symbols and program size limited only by available memory� Support for complex expressions with external references� Up to 65536 relocatable segments per module� 255 significant characters in symbol names.
DOCUMENTATION
The MSP430 IAR Assembler is documented in the MSP430 IAR Assembler Reference Guide.
IAR XLINK LinkerThe IAR XLINK Linker links one or more relocatable object files produced by the MSP430 IAR Assembler or MSP430 IAR C/EC++ Compiler to produce machine code for the MSP430 microcontroller. It is equally well suited for linking small, single-file, absolute assembler programs as for linking large, relocatable, multi-module, C/EC++, or mixed C/EC++ and assembler programs.
It can generate one of more than 30 industry-standard loader formats, in addition to the IAR Systems proprietary debug format used by the IAR C-SPY Debugger—UBROF (Universal Binary Relocatable Object Format). An application can be made up of any number of UBROF relocatable files, in any combination of assembler and C or Embedded C++ programs.
U430-2
Part 1. Product overview 11

12
IAR XAR Library Builder and IAR XLIB Librarian
The final output produced by the IAR XLINK Linker is an absolute, target-executable object file that can be downloaded to the MSP430 microcontroller or to a hardware emulator. Optionally, the output file might or might not contain debug information depending on the output format you choose.
The IAR XLINK Linker supports user libraries, and will load only those modules that are actually needed by the program you are linking. Before linking, the IAR XLINK Linker performs a full C-level type checking across all modules as well as a full dependency resolution of all symbols in all input files, independent of input order. It also checks for consistent compiler settings for all modules and makes sure that the correct version and variant of the C or Embedded C++ runtime library is used.
FEATURES
� Full inter-module type checking� Simple override of library modules� Flexible segment commands allow detailed control of code and data placement� Link-time symbol definition enables flexible configuration control� Optional code checksum generation for runtime checking� Removes unused code and data.
DOCUMENTATION
The IAR XLINK Linker is documented in the IAR Linker and Library Tools Reference Guide.
IAR XAR Library Builder and IAR XLIB Librarian A library is a single file that contains a number of relocatable object modules, each of which can be loaded independently from other modules in the file as it is needed. The IAR XAR Library Builder assists you to build libraries easily. In addition the IAR XLIB Librarian enables you to manipulate the relocatable library object files produced by the IAR Systems assembler and compiler.
A library file is no different from any other relocatable object file produced by the assembler or compiler, except that it includes a number of modules of the LIBRARY type. All C or Embedded C++ programs make use of libraries, and the MSP430 IAR C/EC++ Compiler is supplied with a number of standard library files.
FEATURES
The IAR XAR Library Builder and IAR XLIB Librarian both provide the following features:
� Modules can be combined into a library file
U430-2
MSP430 IAR Embedded Workbench™ IDEUser Guide

Product introduction
� Interactive or batch mode operation.
The IAR XLIB Librarian provides the following additional features:
� Modules can be listed, added, inserted, replaced, or deleted� Modules can be changed between program and library type� Segments can be listed� Symbols can be listed.
DOCUMENTATION
The IAR XLIB Librarian and the IAR XAR Library Builder are documented in the IAR Linker and Library Tools Reference Guide.
U430-2
Part 1. Product overview 13

14
IAR XAR Library Builder and IAR XLIB Librarian
U430-2
MSP430 IAR Embedded Workbench™ IDEUser Guide

Installed filesThis chapter describes which directories are created during installation and what file types are used. At the end of the chapter, there is a section that describes what information you can find in the various guides and online documentation.
Refer to the QuickStart Card and the Installation and Licensing Guide, which are delivered with the product, for system requirements and information about how to install and register the IAR products.
Directory structure The installation procedure creates several directories to contain the different types of files used with the IAR Systems development tools. The following sections give a description of the files contained by default in each directory.
ROOT DIRECTORY
The root directory created by the default installation procedure is the x:\Program Files\IAR Systems\Embedded Workbench 3.n\ directory where x is the drive where Microsoft Windows is installed and 3.n is the version number of the IAR Embedded Workbench IDE.
Figure 1: Directory structure
Note: The installation path can be different from the one shown above depending on previously installed IAR products.
U430-2
Part 1. Product overview 15

16
Directory structure
THE COMMON DIRECTORY
The common directory contains subdirectories for components shared by all IAR Embedded Workbench products.
The common\bin directory
The common\bin subdirectory contains executable files for components common to all IAR Embedded Workbench products, such as the IAR XLINK Linker™, the IAR XLIB Librarian™, the IAR XAR Library Builder™, the editor and the graphic user interface components. The executable file for the IAR Embedded Workbench is also located here.
The common\doc directory
The common\doc subdirectory contains readme files with recent additional information about the components common to all IAR Embedded Workbench products, such as the linker and library tools. We recommend that you read these files. The directory also contains an online version in PDF format of the IAR Linker and Library Tools Reference Guide.
The common\src directory
The common\src subdirectory contains source files for components common to all IAR Embedded Workbench products, such as a sample reader of the IAR XLINK Linker output format SIMPLE.
THE 430 DIRECTORY
The 430 directory contains all product-specific subdirectories.
The 430\bin directory
The 430\bin subdirectory contains executable files for MSP430-specific components, such as the MSP430 IAR C/EC++ Compiler, the MSP430 IAR Assembler, and the MSP430 IAR C-SPY drivers.
The 430\config directory
The 430\config subdirectory contains files used for configuring the system, for example:
� Linker command file templates (*.xcl)� Special function register description files (*.sfr)� The C-SPY device description files (*.ddf)� Syntax coloring configuration files (*.cfg).
U430-2
MSP430 IAR Embedded Workbench™ IDEUser Guide

Installed files
The 430\doc directory
The 430\doc subdirectory contains readme files with recent additional information about the MSP430 tools. We recommend that you read all of these files. The directory also contains online versions (PDF format) of this user guide, and of the MSP430 reference guides.
The 430\FET_examples directory
The 430\FET_examples subdirectory contains MSP430-specific example files. It also contains workspace and project files to be built for the Flash Emulation Tool.
The 430\inc directory
The 430\inc subdirectory holds include files, such as the header files for the standard C or Embedded C++ library. There are also specific header files defining special function registers (SFRs); these files are used by both the compiler and the assembler.
The 430\layouts directory
The 430\layouts subdirectory holds one or more layout files (*.lew) that describe how the C-SPY windows are arranged on the screen during a debug session.
The 430\lib directory
The 430\lib subdirectory holds library modules used by the compiler.
The 430\src directory
The 430\src subdirectory holds source files for some configurable library functions, and application code examples.
The 430\tutor directory
The 430\tutor subdirectory contains the files used for the tutorials in this guide.
File typesThe MSP430 versions of the IAR Systems development tools use the following default filename extensions to identify the IAR-specific file types:
Ext. Type of file Output from Input to
a43 Target program XLINK EPROM, C-SPY, etc.
asm Assembler source code Text editor Assembler
Table 2: File types
U430-2
Part 1. Product overview 17

18
File types
c C source code Text editor Compiler
cfg Syntax coloring configuration Text editor IAR Embedded Workbench
cpp Embedded C++ source code Text editor Compiler
d43 Target program with debug information XLINK C-SPY and other symbolic debuggers
ddf Device description file Text editor C-SPY
dep Dependency information
dni Debugger initialization file C-SPY C-SPY
ewd Project settings for C-SPY IAR Embedded Workbench
IAR Embedded Workbench
ewp IAR Embedded Workbench project (current version)
IAR Embedded Workbench
IAR Embedded Workbench
eww Workspace file (current version) IAR Embedded Workbench
IAR Embedded Workbench
h C/EC++ or assembler header source Text editor Compiler or assembler #include
i Preprocessed source Compiler Compiler
inc Assembler header source Text editor Assembler #include
lew Window layout information C-SPY C-SPY
lst List output Compiler and assembler
–
mac C-SPY macro definition Text editor C-SPY
map List output XLINK –
prj IAR Embedded Workbench project (old project format)
IAR Embedded Workbench
IAR Embedded Workbench
r43 Object module Compiler and assembler
XLINK, XAR, and XLIB
s43 MSP430 assembler source code Text editor MSP430 IAR Assembler
sfr Special function register definitions Text editor C-SPY
xcl Extended command line Text editor Assembler, compiler, XLINK
xlb Extended librarian batch command Text editor XLIB
Ext. Type of file Output from Input to
Table 2: File types (Continued)
U430-2
MSP430 IAR Embedded Workbench™ IDEUser Guide

Installed files
You can override the default filename extension by including an explicit extension when specifying a filename.
Files with the extensions ini and dni are created dynamically when you run the IAR Embedded Workbench tools. These files, which contain information about your project configuration and other settings, are located in a settings directory under your project directory.
Note: If you run the tools from the command line, the XLINK listings (maps) will by default have the extension lst, which may overwrite the list file generated by the compiler. Therefore, we recommend that you name XLINK map files explicitly, for example project1.map.
DocumentationThis section briefly describes the information that is available in the MSP430 user and reference guides, in the online help, and on the Internet.
THE USER AND REFERENCE GUIDES
The user and reference guides provided with the IAR Embedded Workbench are as follows:
MSP430 IAR Embedded Workbench™ IDE User Guide
This guide.
MSP430 IAR C/EC++ Compiler Reference Guide
This guide provides reference information about the MSP430 IAR C/EC++ Compiler. You should refer to this guide for information about:
� How to configure the compiler to suit your target processor and application requirements
� How to write efficient code for your target processor� The available data types� The runtime libraries� The IAR language extensions.
MSP430 IAR Assembler Reference Guide
This guide provides reference information about the MSP430 IAR Assembler, including details of the assembler source format, and reference information about the assembler operators, directives, mnemonics, and diagnostics.
U430-2
Part 1. Product overview 19

20
Documentation
IAR Linker and Library Tools Reference Guide
This online PDF guide provides reference information about the IAR linker and library tools:
� The IAR XLINK Linker reference sections provide information about XLINK options, output formats, environment variables, and diagnostics.
� The IAR XAR Library Builder reference sections provide information about XAR options and output.
� The IAR XLIB Librarian reference sections provide information about XLIB commands, environment variables, and diagnostics.
CLIB Library Reference Guide
This online guide in PDF format contains reference information about the IAR CLIB Library. It is available from the Help menu in the IAR Embedded Workbench IDE.
DLIB Library Reference Guide, C part
This online guide in PDF format provides reference information about the ISO/ANSI C part of the IAR DLIB Library. It is available from the Help menu in the IAR Embedded Workbench IDE.
DLIB Library Reference Guide, EC++ part
This online guide in HTML format provides reference information about the Embedded C++ part of the IAR DLIB Library. It is available from the Help menu in the IAR Embedded Workbench IDE.
ONLINE HELP AND DOCUMENTATION
You can access the MSP430 online documentation from the Help menu in the IAR Embedded Workbench. Help is also available via the F1 button in the IAR Embedded Workbench IDE.
We recommend that you read the readme.htm file for recent information that may not be included in the user guides. It is located in the 430\doc directory.
IAR ON THE WEB
The latest news from IAR Systems can be found at the website www.iar.com, available from the Help menu in the Embedded Workbench IDE. Visit it for information about:
� Product announcements� Updates and news about current versions� Special offerings� Evaluation copies of the IAR products
U430-2
MSP430 IAR Embedded Workbench™ IDEUser Guide

Installed files
� Technical Support, including technical notes� Application notes� Links to chip manufacturers and other interesting sites� Distributors; the names and addresses of distributors in each country.
U430-2
Part 1. Product overview 21

22
Documentation
U430-2
MSP430 IAR Embedded Workbench™ IDEUser Guide

Part 2. TutorialsThis part of the MSP430 IAR Embedded Workbench™ IDE User Guide contains the following chapters:
� Creating an application project
� Debugging using the IAR C-SPY™ Debugger
� Mixing C and assembler modules
� Using Embedded C++
� Simulating an interrupt
� Working with library modules.
U430-2
23

24
U430-2
Creating an application projectThis chapter introduces you to the IAR Embedded Workbench™ integrated development environment. The tutorial demonstrates a typical development cycle and shows how you use the compiler and the linker to create a small application for the MSP430 microcontroller.
The following steps will be shown:
� Creating a workspace
� Setting up a project with C source files and specifying project options
� Compiling the application, examining the list file, and linking the application.
The development cycle continues in the next chapter, see Debugging using the IAR C-SPY™ Debugger, page 37.
Setting up a new projectThe IAR Embedded Workbench lets you design advanced project models. You create a workspace to which you add one or several projects. Each project can contain a hierarchy of groups in which you collect your source files. For each project you can define one or several build configurations. For more details about designing project models, see the chapter Managing projects in this guide.
Since the application in this tutorial is a simple program with very few files, the tutorial does not need an advanced project model.
We recommend that you create a specific directory where you can store all your project files. In this tutorial we call the directory projects. You can find all the files needed for the tutorials in the 430\tutor directory.
Before you can create your project you must first create a workspace.
U430-2
Part 2. Tutorials 25

26
Setting up a new project
CREATING A WORKSPACE WINDOW
The first step is to create a new workspace for the tutorial application.
1 Choose File>New and select Workspace in the New dialog box.
Figure 2: New dialog box
The Help button provides access to information about the IAR Embedded Workbench IDE. You can at any time press the F1 key to access the online help.
Click OK to display the New Workspace dialog box.
2 Specify where you want to place your workspace file. In this tutorial, you should place it in your newly created projects directory. Type tutorials in the File name box, and click Save to create the new workspace.
Figure 3: New Workspace dialog box
A workspace window will be displayed.
A workspace file—with the filename extension eww—has now been created in the projects directory. This file contains a list of all projects added to the workspace. Information related to the current session, such as the placement of windows and breakpoints is located in the files created in the project\settings directory.
U430-2
MSP430 IAR Embedded Workbench™ IDEUser Guide

Creating an application project
Now you are ready to create a project and add it to the workspace.
CREATING THE NEW PROJECT
1 To create a new project, choose Project>Add a New Project to the Workspace. The New Project dialog box appears.
2 Set the Tool Chain to MSP430, and specify where you want to place your project files, that is, in your newly created projects directory. Type project1 in the File name box, and click Create to create the new project.
Figure 4: New Project dialog box
The project will appear in the Workspace window.
Figure 5: Workspace window
U430-2
Part 2. Tutorials 27

28
Setting up a new project
By default two build configurations are created: Debug and Release. In this tutorial only Debug will be used. You select the build configuration from the drop-down menu at the top of the window. The asterisk in the project name indicates that these are changes that have not been saved.
A project file—with the filename extension ewp—has now been created in the projects directory. This file contains information about your project-specific settings, such as build options.
ADDING FILES TO THE PROJECT
This tutorial uses the source files Tutor.c and Utilities.c.
� The Tutor.c program is a simple program using only standard features of the C language. It initializes an array with the ten first Fibonacci numbers and prints the result to stdout.
� The Utilities.c program contains utility routines for the Fibonacci calculations.
Creating several groups is a possibility for you to organize your source files logically according to your project needs. However, since there is only two files in this project there is no need for creating a group.
1 In the workspace window, select the destination you want to add a source file to; a group or, as in this case, directly to the project.
2 Choose Project>Add Files to open a standard browse dialog box. Locate the files Tutor.c and Utilities.c, select them in the file selection list, and click Open to add them to the project1 project.
Figure 6: Adding files to project1
U430-2
MSP430 IAR Embedded Workbench™ IDEUser Guide

Creating an application project
SETTING PROJECT OPTIONS
Now you will set the project options. Options can be set on all levels of nodes. First you will set the general options to suit the processor configuration in this tutorial. Since these options must be the same for the whole build configuration they must be set on the project node.
1 Select the project folder icon project1 - Debug in the Project window and choose Project>Options.
The Target options page in the General category is displayed.
Figure 7: Setting General options
Make sure the following options are selected:
Then set up the compiler options for the project.
Page Option/Setting
Target Device: msp430F149
Output Executable
Library IAR CLIB (C library)
Table 3: General settings for project1
U430-2
Part 2. Tutorials 29

30
Setting up a new project
2 Select ICC430 in the Category list to display the compiler option pages.
Figure 8: Setting compiler options
3 Make sure that the following options are selected:
4 Click OK to set the options you have specified.
5 It is possible to specify the amount of information to be displayed in the Messages window. In this tutorial the default setting is not used. If you want the output in the Messages window on your screen to correspond with the screenshots in this tutorial, you should change the default setting. Choose Tools>Options and then click the Messages tab. Change All in the Show build messages drop-down list to Messages.
The project is now ready for building.
Page Setting
Code Optimizations, Size: None
Output Generate debug info
List Output list fileAssembler mnemonics
Table 4: Compiler options for project1
U430-2
MSP430 IAR Embedded Workbench™ IDEUser Guide

Creating an application project
Compiling and linking the applicationYou can now compile and link the application. You should also create a compiler list file and a linker map file and view both of them.
COMPILING THE SOURCE FILES
1 To compile the Utilities.c file, select it in the workspace window.
2 Choose Project>Compile.
Alternatively, click the Compile button in the toolbar or select the Compile command from the context menu that appears when you right-click on the selected file in the workspace window.
The progress will be displayed in the Messages window.
Figure 9: Compilation message
3 Compile the file Tutor.c in the same manner.
The IAR Embedded Workbench has now created new directories in your project directory. Since you have chosen the build configuration Debug, a Debug directory has been created containing the new directories List, Obj, and Exe:
� The List directory is the destination directory for the list files. The list files have the extension lst.
� The Obj directory is the destination directory for the object files from the compiler and the assembler. These files have the extension r43 and will be used as input to the IAR XLINK Linker.
� The Exe directory is the destination directory for the executable file. It has the extension d43 and will be used as input to the IAR C-SPY Debugger. Notice that this directory will be empty until you have linked the object files.
U430-2
Part 2. Tutorials 31

32
Compiling and linking the application
The IAR Embedded Workbench has also created an output folder icon in the workspace window containing any generated output files. All included header files are displayed as well, showing the dependencies between the files.
Figure 10: Workspace window after compilation
VIEWING THE LIST FILE
Now examine the compiler list file and notice how it is automatically updated when you, as in this case, will investigate how different optimization levels affect the generated code size.
1 Open the list file Utilities.lst by double-clicking it in the workspace window. Examine the list file, which contains the following information:
� The header shows the product version, information about when the file was created, and the command line version of the compiler options that were used
� The body of the list file shows the assembler code and binary code generated for each statement. It also shows how the variables are assigned to different segments
� The end of the list file shows the amount of stack, code, and data memory required, and contains information about error and warning messages that may have been generated.
Notice the amount of generated code at the end of the file and keep the file open.
U430-2
MSP430 IAR Embedded Workbench™ IDEUser Guide

Creating an application project
2 Choose Tools>Options to open the IDE Options dialog box and click the Editor tab. Select the option Scan for Changed Files. This option turns on the automatic update of any file open in an editor window, such as a list file.
Figure 11: Setting the option Scan for Changed Files
3 Select the file Utilities.c in the workspace window. Open the ICC430 options dialog box by right-clicking on the selected file in the workspace window. Click the Code tab and select the Override inherited settings option. Choose High from the Optimizations drop-down list. Click OK.
Notice that the options override on the file node is indicated in the workspace window.
4 Compile the file Utilities.c. Now you will notice two things. First notice, the automatic updating of the open list file due to the selected option Scan for Changed Files. Second, look at the end of the list file and notice the effect on the code size due to the increased optimization.
5 For this tutorial, the optimization level None should be used, so before linking the application, restore the default optimization level. Open the ICC430 options dialog box by right-clicking on the selected file in the workspace window. Click the Code tab and choose None from the Optimizations drop-down list. Deselect the Override inherited settings option and click OK. Recompile the Utilities.c file.
U430-2
Part 2. Tutorials 33

34
Compiling and linking the application
LINKING THE APPLICATION
Now you should set up the options for the IAR XLINK Linker™.
1 Select the project folder icon project1 - Debug in the workspace window and choose Project>Options. Then select XLINK in the Category list to display the XLINK option pages.
Figure 12: XLINK options dialog box for project1
2 Make sure that the following options are selected on the appropriate pages:
Page Options
Output Debug info with terminal I/O
List Generate linker listingSegment mapSymbols: Module map
Table 5: XLINK options for project1
U430-2
MSP430 IAR Embedded Workbench™ IDEUser Guide

Creating an application project
Choose the output format that suits your purpose. You might want to load it to a debugger—which means that you need output with debug information. Alternatively, you might want to load the output to a PROM programmer—in which case you need output without debug information, such as Intel-hex or Motorola S-records. In this tutorial you will use the output option Debug info with terminal I/O, which means that some low-level routines will be linked that direct stdin and stdout to the Terminal I/O window in the C-SPY debugger.
If you want to examine the linker command file, use a suitable text editor, such as the IAR Embedded Workbench editor, or print a copy of the file, and verify that the definitions match your requirements.
For more information about linker command files, see the MSP430 IAR C/EC++ Compiler Reference Guide.
3 Click OK to save the XLINK options.
In the linker command file, the XLINK command line options for segment control are used. These options are described in the IAR Linker and Library Tools Reference Guide.
Now you should link the object file, to generate code that can be debugged.
4 Choose Project>Make. The progress will as usual be displayed in the Messages window:
The result of the linking is a code file project1.d43 with debug information and a map file project1.map.
VIEWING THE MAP FILE
Examine the project1.map file to see how the segment definitions and code were placed in memory. These are the main points of interest in a map file:
� The header includes the options used for linking.� The CROSS REFERENCE section shows the address of the program entry.� The RUNTIME MODEL section shows the runtime model attributes that are used.� The MODULE MAP shows the files that are linked. For each file, information about the
modules that were loaded as part of the program, including segments and global symbols declared within each segment, is displayed.
� The SEGMENTS IN ADDRESS ORDER section lists all the segments that constitute the program.
The project1.d43 application is now ready to be run in the IAR C-SPY Debugger.
U430-2
Part 2. Tutorials 35

36
Compiling and linking the application
U430-2
MSP430 IAR Embedded Workbench™ IDEUser Guide

Debugging using the IAR C-SPY™ Debugger This chapter continues the development cycle started in the previous chapter and explores the basic features of the IAR C-SPY Debugger.
Note that, depending on what IAR product package you have installed, the IAR C-SPY Debugger may or may not be included. The tutorials assume that you are using the C-SPY Simulator.
Debugging the applicationThe project1.d43 application, created in the previous chapter, is now ready to be run in the IAR C-SPY Debugger where you can watch variables, set breakpoints, view code in disassembly mode, monitor registers and memory, and print the program output in the Terminal I/O window.
STARTING THE DEBUGGER
Before starting the IAR C-SPY Debugger you must set a few C-SPY options.
1 Choose Project>Options and then the C-SPY category. On the Setup page, make sure that you have chosen Simulator from the Driver drop-down list and that Run to main is selected. Click OK.
2 You can choose between using one source window per file or one common source window for all files during your debug session. Since only two C source files are used in this tutorial it is convenient to have them in one window each.
Choose Tools>Options. Click the Debugger tab and make sure the option Use a dedicated editor window for debugging is not selected.
3 Choose Project>Debug. Alternatively, click the Debugger button in the toolbar. The IAR C-SPY Debugger starts with the project1.d43 program loaded. In addition to the windows already opened in the Embedded Workbench, a set of C-SPY-specific windows are opened.
U430-2
Part 2. Tutorials 37

38
Debugging the application
ORGANIZING THE WINDOWS
The layout of the C-SPY windows is determined by a layout file, with the filename extension lew. The product package is supplied with a default layout file. However, you can modify the layout to suit your needs.
4 Make sure the following windows are open and visible on the screen: tutorials – project1, Tutor.c, Utilities.c, Watch, and Log. Position them neatly before proceeding. Close all other windows.
Figure 13: The C-SPY Debugger
Note: When you open a window for the first time, open it from the View menu, since that opens a new instance of the window. If the window is open already but not visible, use the Window menu instead to make the window active.
5 The current layout is saved automatically when you exit C-SPY. However, to save the layout with a dedicated filename, choose Debug>Save Layout As and write the filename project1.lew. The advantage of saving the layout manually is that you will have a project-specific layout file that will always look the same when you open it.
U430-2
MSP430 IAR Embedded Workbench™ IDEUser Guide

Debugging using the IAR C-SPY™ Debugger
INSPECTING SOURCE STATEMENTS
1 To inspect the source statements, double-click the Tutor.c file in the Workspace window.
2 With the Tutor.c window active, first step over once with the Debug>Step Over command.
Alternatively, click the Step Over button on the toolbar.
The current position should be the call to the init_fib function.
Figure 14: Stepping in C-SPY
3 Select Debug>Step Into to step into the function init_fib.
Alternatively, click the Step Into button on the toolbar.
At source level, the Step Over and Step Into commands allow you to execute the program a statement or instruction at a time. Step Into continues stepping inside function or subroutine calls, whereas Step Over executes each function call in a single step. For further details, see Step, page 112.
When Step Into is executed you will notice that the active window changes to Utilities.c since the function init_fib is located in this file. This is because you deselected the option Use a dedicated editor window for debugging before starting C-SPY.
U430-2
Part 2. Tutorials 39

40
Debugging the application
4 Use the Step Into command twice until you reach the for loop.
Figure 15: Using Step Into in C-SPY
5 Use Step Over until you are back in the header of the for loop. You will notice that the step points are on a function call level, not on a statement level.
You can also step on a statement level. Choose Debug>Next statement to execute one statement at a time. Alternatively, click the Next statement button on the toolbar.
Notice how this command differs from the Step Over and the Step Into commands.
INSPECTING VARIABLES
C-SPY allows you to watch variables or expressions in the source code, so that you can keep track of their values as you execute the program. You can look at a variable in a number of ways; for example by pointing at it in the source window with the mouse pointer, or by opening the Locals window.
Note: When optimization level None is used, all non-static variables will live during their entire scope and thus, the variables are fully debuggable. When higher levels of optimizations are used, variables might not be fully debuggable.
Using the Locals window
1 Choose View>Locals to open the Locals window.
U430-2
MSP430 IAR Embedded Workbench™ IDEUser Guide

Debugging using the IAR C-SPY™ Debugger
The Locals window will show the current value of i.
Figure 16: Inspecting variables in the Locals window
2 Keep stepping to see how the value of i changes. Close the window.
Setting a watchpoint
Next you will use the Watch window to inspect variables.
3 Set a watchpoint on the variable i using the following procedure: Click the dotted rectangle in the Watch window. In the entry field that appears, type i and press the Enter key.
You can also drag a variable from the editor window to the Watch window.
4 Select the root array in the init_fib function, then drag it to the Watch window.
The Watch window will show the current value of i and root. You can expand the root array to watch it in more detail.
Figure 17: Watching variables in the Watch window
5 Execute some more steps to see how the values of i and root change.
U430-2
Part 2. Tutorials 41

42
Debugging the application
6 To remove a variable from the Watch window, select it and press Delete.
SETTING AND MONITORING BREAKPOINTS
The IAR C-SPY Debugger contains a powerful breakpoint system with many features. For detailed information about the different breakpoints, see The breakpoint system, page 123.
The most convenient way is usually to set breakpoints interactively, simply by positioning the cursor in or near a statement and then choosing the Toggle Breakpoint command.
1 Set a breakpoint at the statement get_fib(i) using the following procedure: First click in this statement in the Utilities.c window, to position the cursor. Then choose Edit>Toggle Breakpoint.
Alternatively, click the Toggle Breakpoint button on the toolbar.
A breakpoint will be set at this statement. The statement will be highlighted and there will be an X in the margin to show that there is a breakpoint there.
Figure 18: Setting breakpoints
You can find information about the breakpoint execution in the Log window.
Executing up to a breakpoint
2 To execute the program until it reaches the breakpoint, choose Debug>Go.
Alternatively, click the Go button on the toolbar.
The program will execute up to the breakpoint you set. The Watch window will display the value of the root expression and the Log window will contain information about the breakpoint.
U430-2
MSP430 IAR Embedded Workbench™ IDEUser Guide

Debugging using the IAR C-SPY™ Debugger
DEBUGGING IN DISASSEMBLY MODE
Debugging with C-SPY is usually quicker and more straightforward in C/EC++ source mode. However, if you want to have full control over low-level routines, you can debug in disassembly mode where each step corresponds to one assembler instruction. C-SPY lets you switch freely between the two modes.
1 First reset the program by clicking the Reset button on the toolbar.
2 Choose View>Disassembly to open the Disassembly window.You will see the assembler code corresponding to the current C statement.
Figure 19: Debugging in disassembly mode
Try the different step commands also in the Disassembly window.
MONITORING REGISTERS
The Register window lets you monitor and modify the contents of the processor registers.
1 Make the Disassembly window active.
U430-2
Part 2. Tutorials 43

44
Debugging the application
2 Choose View>Register to open the Register window.
Figure 20: Register window
3 Step Over to execute the next instructions, and watch how the values change in the Register window.
4 Close the Register window.
MONITORING MEMORY
The Memory window lets you monitor selected areas of memory. In the following example the memory corresponding to the variable root will be monitored.
1 Choose View>Memory to open the Memory window.
2 Make the Utilities.c window active and select root. Then drag it from the C source window to the Memory window.
The memory contents in the Memory window corresponding to root will be selected.
Figure 21: Monitoring memory
U430-2
MSP430 IAR Embedded Workbench™ IDEUser Guide

Debugging using the IAR C-SPY™ Debugger
3 To display the memory contents as 16-bit data units, click the x2 button on the Memory window toolbar.
Figure 22: Displaying memory contents as 16-bit units
If not all of the memory units have been initialized by the init_fib function of the C program yet, continue to step over and you will notice how the memory contents will be updated.
You can change the memory contents by editing the values in the Memory window. Just place the insertion point at the memory content that you want to edit and type the desired value.
Close the Memory window.
VIEWING TERMINAL I/O
Sometimes you might need to debug constructions in your application that make use of stdin and stdout without the possibility of having hardware support. C-SPY lets you simulate stdin and stdout by using the Terminal I/O window.
Note: The Terminal I/O window is only available in C-SPY if you have linked your project using the output option Debug info with terminal I/O. This means that some low-level routines will be linked that direct stdin and stdout to the Terminal I/O window, see Linking the application, page 34 in the previous chapter.
U430-2
Part 2. Tutorials 45

46
Debugging the application
1 Choose View>Terminal I/O to display the output from the I/O operations.
Figure 23: Output from the I/O operations
REACHING PROGRAM EXIT
1 To complete the execution of the program, choose Debug>Go.
Alternatively, click the Go button on the toolbar.
Since no more breakpoints are encountered, C-SPY reaches the end of the program and a program exit reached message is printed in the Log window.
Figure 24: Reaching program exit in C-SPY
If you want to start again with the existing program, choose Debug>Reset, or click the Reset button on the toolbar.
2 To exit from C-SPY, choose Debug>Stop Debugging. Alternatively, click the Stop Debugging button on the toolbar. The Embedded Workbench workspace is displayed.
C-SPY also provides many other debugging facilities. Some of these—for example macros and interrupt simulation—are described in the following tutorial chapters.
For further details about how to use C-SPY, see Part 4. Debugging. For reference information about the features of C-SPY, see Part 8. Reference information.
U430-2
MSP430 IAR Embedded Workbench™ IDEUser Guide

Mixing C and assembler modulesIn some projects it may be necessary to write certain pieces of source code in assembler language. The chapter first demonstrates how the compiler can be helpful in examining the calling convention, which you need to be familiar with when calling assembler modules from C/EC++ modules or vice versa. Furthermore, this chapter demonstrates how you can easily combine source modules written in C with assembler modules, but the procedure is applicable to projects containing source modules written in EC++, too.
This tutorial assumes that you are familiar with the basics of the IAR Embedded Workbench™ described in the previous tutorial chapters.
Examining the calling conventionWhen writing an assembler routine that will be called from a C routine, it is necessary to be aware of the calling convention used by the compiler. By creating skeleton code in C and letting the compiler produce an assembler output file from it, you can study the produced assembler output file and find the details of the calling convention.
In this example you will make the compiler create an assembler output file from the file Utilities.c.
1 Add a new project to the workspace tutorials used in previous tutorials, and name the project project2.
2 Add the files Tutor.c and Utilities.c to the project.
To display an overview of the workspace, click the Overview tab available at the bottom of the workspace window. To view only the newly created project, click the project2 tab.
3 To select appropriate device, choose Project>Options, and select the General category. On the Target page, select msp430F149 from the Device drop-down menu.
4 To set options on file level node, in the workspace window, select the file Utilities.c.
Choose Project>Options. You will notice that only the ICC430 and Custom Build categories are available.
U430-2
Part 2. Tutorials 47

48
Adding an assembler module to the project
5 In the ICC430 category, select Override inherited settings and make sure the following options are selected:
:
Note: In this example it is necessary to use a low optimization level when compiling the code to show local and global variable accesses. If a higher level of optimization is used, the required references to local variables could be removed. The actual function declaration is not changed by the optimization level.
6 Click OK and return to the workspace window.
7 Compile the file Utilities.c. You can find the output file Utilities.s43 in the subdirectory projects\debug\list.
8 To examine the calling convention and to see how the C or Embedded C++ code is represented in assembler language, open the file Utilities.s43.
You can now study where and how parameters are passed, how to return to the program location from where a function was called, and how to return a resulting value. You can also see which registers an assembler-level routine must preserve.
To obtain the correct interface for your own application functions, you should create skeleton code for each function that you need.
For more information about the calling convention used in the compiler, see the MSP430 IAR C/EC++ Compiler Reference Guide.
Adding an assembler module to the projectThis tutorial demonstrates how you can easily create a project containing both assembler modules and C modules. You will also compile the project and view the assembler output list file.
SETTING UP THE PROJECT
1 Modify project2 by removing the file Utilites.c and adding the file Utilities.s43 instead.
Note: To view assembler files in the Add files dialog box, choose Project>Add Files and select Assembler Files from the Files of type drop down list.
Page Option
Code Size: None
List Output assembler file Include source
Table 6: Compiler options for project2
U430-2
MSP430 IAR Embedded Workbench™ IDEUser Guide

Mixing C and assembler modules
2 Select the project level node in the workspace window, choose Project>Options. Use the default settings in the General, ICC430, and XLINK categories. Select the A430 category, click the List tab, and select the option List file.
Figure 25: Assembler settings for creating a list file
Click OK.
3 Select the Utilities.s43 file in the workspace window and choose Project>Compile to compile it.
Assuming that the source file was assembled successfully, the Utilities.r43 file will be created, containing the linkable object code.
Viewing the assembler list file
4 Open the list file by double-clicking the file Utilities.lst available in the Output folder icon in the workspace window.
The end of the file contains a summary of errors and warnings that were generated, and a checksum (CRC).
Note: The CRC number depends on the date of assembly.
For further details of the list file format, see MSP430 IAR Assembler Reference Guide.
5 Select Project>Make to relink project2.
U430-2
Part 2. Tutorials 49

50
Adding an assembler module to the project
6 Start C-SPY to run the project2.d43 program and see that it behaves like in the previous tutorial.
U430-2
MSP430 IAR Embedded Workbench™ IDEUser Guide

Using Embedded C++In this chapter, Embedded C++ is used to create an EC++ class. The class is then used for creating two independent objects, and the application is built and debugged.
This tutorial assumes that you are familiar with the basics of the IAR Embedded Workbench™ described in the previous tutorial chapters.
Note that, depending on what IAR product package you have installed, support for Embedded C++ may or may not be included. This tutorial assumes that there is support for it.
Creating an Embedded C++ applicationThis tutorial will demonstrate how to use the MSP430 IAR Embedded Workbench Embedded C++ features. The tutorial consists of two files:
� Fibonacci.cpp creates a class fibonacci that can be used to extract a series of Fibonacci numbers
� CPPtutor.cpp creates two objects, fib1 and fib2, from the class fibonacci and extracts two sequences of Fibonacci numbers using the fibonacci class.
To demonstrate that the two objects are independent of each other, the numbers are extracted at different speeds. A number is extracted from fib1 each turn in the loop while a number is extracted from fib2 only every second turn.
The object fib1 is created using the default constructor while the definition of fib2 uses the constructor that takes an integer as its argument.
COMPILING AND LINKING THE EC++ APPLICATION
1 In the workspace tutorials used in the previous chapters, create a new project, project3.
2 Add the files Fibonacci.cpp and CPPtutor.cpp to project3.
U430-2
Part 2. Tutorials 51

52
Creating an Embedded C++ application
3 Choose Project>Options and make sure the following options are selected:
All you need to do to switch to the Embedded C++ programming language is to select the options IAR DLIB (C/EC++ Library) and Enable Embedded C++ syntax.
4 Choose Project>Make to compile and link the program.
Alternatively, click the Make button on the toolbar. The Make command compiles and links those files that have been modified.
5 Choose Project>Debug to start the IAR C-SPY Debugger.
SETTING A BREAKPOINT AND EXECUTING TO IT
1 Open the CPPtutor.cpp window if it is not already open.
2 To see how the object is constructed, set a breakpoint on the EC++ object fib1 on the line
fibonacci fib1;
Figure 26: Setting a breakpoint in CPPtutor.cpp
Category Page Option
General Target Device: msp430F149
Library IAR DLIB (C/EC++ Library)
ICC430 Language Enable Embedded C++ syntax
Table 7: Project options for Embedded C++ tutorial
U430-2
MSP430 IAR Embedded Workbench™ IDEUser Guide

Using Embedded C++
3 Choose Debug>Go, or click the Go button on the toolbar.
The cursor should now be placed at the breakpoint.
4 To step into the constructor, choose Debug>Step Into or click the Step Into button in the toolbar. Then click Step Out again.
5 Step Over three more times and Step Into once until you are in the function next in the file Fibonacci.cpp.
6 Use the Go to function button in the lower left corner of the editor window to find and go to the function nth by double-clicking the function name. Set a breakpoint on the function call nth(n-1)at the line
value = nth(n-1) + nth(n-2);
7 It can be interesting to backtrace the function calls a few levels down and to examine the value of the parameter for each function call. By adding a condition to the breakpoint, the break will not be triggered until the condition is true, and you will be able to see each function call in the Call Stack window.
To edit the current breakpoint, choose Edit>Breakpoints. In the Breakpoints dialog box, select the breakpoint and set the value in the Skip count text box to 4 and click Apply.
Figure 27: Setting the breakpoint condition
U430-2
Part 2. Tutorials 53

54
Creating an Embedded C++ application
Close the dialog box.
Looking at the function calls
8 Choose Debug>Go to execute the application until the breakpoint condition is fulfilled.
9 When C-SPY stops at the breakpoint, choose View>Call Stack to open the Call Stack window.
Figure 28: Inspecting the function calls
There are five instances of the function nth() displayed on the call stack. Since the Call Stack window displays the values of the function parameters, you can see the different values of n in the different function instances.
You can also open the Register window to see how it is updated as you trace the function calls by double-clicking on the function instances.
PRINTING THE FIBONACCI NUMBERS
1 Open the Terminal I/O window from the View menu.
U430-2
MSP430 IAR Embedded Workbench™ IDEUser Guide

Using Embedded C++
2 Run the program to the end and verify the Fibonacci sequences being printed.
Figure 29: Printing Fibonacci sequences
U430-2
Part 2. Tutorials 55

56
Creating an Embedded C++ application
U430-2
MSP430 IAR Embedded Workbench™ IDEUser Guide

Simulating an interruptIn this tutorial an interrupt handler for a serial port is added to the project. The Fibonacci numbers will be read from an on-chip peripheral communication module (USART0).
This tutorial will show how the MSP430 IAR C/EC++ Compiler interrupt keyword and the #pragma vector directive are used. The tutorial will also show how this interrupt can be simulated using the features that support interrupts, breakpoints, and macros. Notice that this example does not describe an exact simulation; the purpose is to illustrate a situation where C-SPY macros, breakpoints, and the interrupt system can be useful to simulate hardware.
This tutorial assumes that you are familiar with the basics of the IAR Embedded Workbench™ described in the previous tutorial chapters.
Note that interrupt simulation is possible only when you are using the IAR C-SPY Simulator.
Adding an interrupt handlerThis section will demonstrate how to write an interrupt in an easy way. It starts with a brief description of the application used in this project, followed by a description of how to set up the project.
THE APPLICATION—A BRIEF DESCRIPTION
The interrupt handler will read values from the serial communication port receive register (USART0), U0RXBUF. It will then print the value. The main program enables interrupts and starts printing periods (.) in the foreground process while waiting for interrupts.
U430-2
Part 2. Tutorials 57

58
Setting up the simulation environment
WRITING AN INTERRUPT HANDLER
The following lines define the interrupt handler used in this tutorial (the complete source code can be found in the file Interrupt.c supplied in the 430/tutor directory):
// define the interrupt handler#pragma vector=USART0RX_VECTOR__interrupt void uartReceiveHandler( void )
The #pragma vector directive is used for specifying the interrupt vector address—in this case the interrupt vector for the USART0 receive interrupt—and the keyword __interrupt is used to direct the compiler to use the calling convention needed for interrupt functions.
For detailed information about the extended keywords and #pragma directives used in this tutorial, see the MSP430 IAR C/EC++ Compiler Reference Guide.
SETTING UP THE PROJECT
1 Add a new project—project4—to the workspace tutorials used in previous tutorials.
2 Add the files Utilities.c and Interrupt.c to it.
3 In the workspace window, select the project level node, and choose Project>Options. Choose the General category, and click the Target tab. Select msp430F149 from the Device drop-down menu.
In addition, make sure the factory settings are used in the ICC430 and XLINK categories.
Next you will set up the simulation environment.
Setting up the simulation environment The C-SPY interrupt system is based on the cycle counter. You can specify the amount of cycles to pass before C-SPY generates an interrupt.
To simulate the input to USART0, values will be read from the file InputData.txt, which contains the Fibonacci series. You will set an immediate read breakpoint on the USART0 receive register, U0RXBUF, and connect a user-defined macro function to it (in this example the Access() macro function). The macro reads the Fibonacci values from the text file.
Whenever an interrupt is generated, the interrupt routine will read U0RXBUF and the breakpoint will be triggered, the Access() macro function will be executed and the Fibonacci values will be fed into the USART0 receive register.
U430-2
MSP430 IAR Embedded Workbench™ IDEUser Guide

Simulating an interrupt
The immediate read breakpoint will trigger the break before the processor reads the U0RXBUF register, allowing the macro to store a new value in the register that is immediately read by the instruction.
This section will demonstrate the steps involved in setting up the simulator for simulating a serial port interrupt. The steps involved are:
� Defining a C-SPY setup file which will open the file InputData.txt and define the Access() macro function
� Specifying C-SPY options� Building the project� Starting the simulator� Specifying the interrupt request� Setting the breakpoint and associating the Access() macro function to it.
Note: For a simple example of a timer interrupt simulation, see Simulating a simple interrupt, page 162.
DEFINING A C-SPY SETUP MACRO FILE
In C-SPY, you can define setup macros that will be registered during the C-SPY startup sequence. In this tutorial you will use the C-SPY macro file SetupSimple.mac, available in the 430\tutor directory. It is structured as follows:
First the setup macro function execUserSetup() is defined, which is automatically executed during C-SPY setup. Thus, it can be used to set up the simulation environment automatically. A message is printed in the Log window to confirm that this macro has been executed:
execUserSetup(){ __message "execUserSetup() called\n";
Then the InputData.txt file, which contains the Fibonacci series to be fed into USART0, will be opened:
_fileHandle = __openFile( "$TOOLKIT_DIR$\\tutor\\InputData.txt", "r" );
U430-2
Part 2. Tutorials 59

60
Setting up the simulation environment
After that, the Access() macro function is defined. It will read the Fibonacci values from the InputData.txt file, and assign them to the receive register address:
Access(){ __message "Access() called\n"; __var _fibValue; if( 0 == __readFile( _fileHandle, &_fibValue ) ) { U0RXBUF = _fibValue; }}
You will have to connect the Access() macro to an immediate read breakpoint. However, this will be done at a later stage in this tutorial.
Finally, the file contains two macro functions for managing correct file handling at reset and exit.
For detailed information about macros, see the chapters Using C-SPY macros and C-SPY macros reference.
Next you will specify the macro file and set the other C-SPY options needed.
U430-2
MSP430 IAR Embedded Workbench™ IDEUser Guide

Simulating an interrupt
SPECIFYING C-SPY OPTIONS
1 To select C-SPY options, choose Project>Options. In the C-SPY category, click the Setup tab.
Figure 30: Specifying setup macro file
2 Use the Use setup file browse button to specify the macro file to be used:
SetupSimple.mac
Alternatively, use an argument variable to specify the path:
$TOOLKIT_DIR$\tutor\SetupSimple.mac
See Argument variables summary, page 242, for details.
3 Set the Use device description file option to msp430F149.ddf. The information in this file is needed by the interrupt system.
4 Select Run to main and click OK. This will ensure that the debug session will start by running to the main function.
The project is now ready to be built.
U430-2
Part 2. Tutorials 61

62
Setting up the simulation environment
BUILDING THE PROJECT
1 Compile and link the project by choosing Project>Make.
Alternatively, click the Make button on the toolbar. The Make command compiles and links those files that have been modified.
STARTING THE SIMULATOR
1 Start the IAR C-SPY Debugger to run the project4 project.
The Interrupt.c window is displayed (among other windows). Click in it to make it the active window.
2 Examine the Log window. Notice that the macro file has been loaded and that the execUserSetup function has been called.
SPECIFYING A SIMULATED INTERRUPT
Now you will specify your interrupt to make it simulate an interrupt every 2000 cycles.
1 Choose Simulator>Interrupts to display the Interrupts dialog box.
Figure 31: Inspecting the interrupt settings
U430-2
MSP430 IAR Embedded Workbench™ IDEUser Guide

Simulating an interrupt
2 Make the following settings for your interrupt and click Install:
During execution, C-SPY will wait until the cycle counter has passed the activation time. When the current assembler instruction is executed, C-SPY will generate an interrupt which is repeated approximately every 2000 cycles.
3 When you have specified the settings, click Install, and then OK to close the Interrupt dialog box.
To automate the procedure of defining the interrupt you can instead use the system macro __orderInterrupt in a C-SPY setup file. At the end of this chapter we will show how this macro can be used to automate the process.
SETTING AN IMMEDIATE BREAKPOINT
By defining a macro and connecting it to an immediate breakpoint, you can make the macro simulate the behavior of a hardware device, for instance an I/O port, as in this tutorial. The immediate breakpoint will not halt the execution, only temporarily suspend it to check the conditions and execute any connected macro.
In this example, the input to the USART0 is simulated by setting an immediate read breakpoint on the U0RXBUF address and connecting the defined Access() macro to it. The macro will simulate the input to the USART0. These are the steps involved:
1 Choose Edit>Breakpoints to display the Breakpoints dialog box, and click the Immediate tab.
Setting Value Description
Interrupt USART0RX_VECTOR Specifies which interrupt to use; the name is defined in the *.ddf file.
Description As Is The interrupt definition that the simulator uses to be able to simulate the interrupt correctly.
Activation Time 4000 Specifies the activation moment for the first interrupt. The interrupt is activated when the cycle counter has passed this value.
Repeat Interval 2000 Specifies the repeat interval for the interrupt, measured in clock cycles
Hold time 0 Hold time, not used here
Probability 100 Specifies probability. 100% specifies that the interrupt will occur at the given frequency. Another percentage could be used for simulating a more random interrupt behavior.
Variance 0 Time variance, not used here.
Table 8: Interrupts dialog box
U430-2
Part 2. Tutorials 63

64
Setting up the simulation environment
2 Add the following parameters for your breakpoint and click Apply.
Figure 32: Displaying breakpoint information
During execution, when C-SPY detects a read access from the U0RXBUF address, C-SPY will temporarily suspend the simulation and execute the Access() macro. The macro will read a value from the InputData.txt file and write it to U0RXBUF. C-SPY will then resume the simulation by reading the receive buffer value in U0RXBUF.
3 Click OK to close the Breakpoints dialog box.
To automate the breakpoint setting, you can instead use the system macro __setSimBreak in a C-SPY setup file. At the end of this chapter we will also show how this macro can be used to automate the process.
Setting Value Description
Break at U0RXBUF Receive buffer address.
Access Type Read The breakpoint type (Read or Write)
Action Access() The macro connected to the breakpoint.
Table 9: Breakpoints dialog box
U430-2
MSP430 IAR Embedded Workbench™ IDEUser Guide

Simulating an interrupt
Simulating the interruptIn this section you will execute your program and simulate the serial port interrupt.
EXECUTING THE APPLICATION
1 Step through the program and stop when it reaches the while loop, which waits for input.
2 In the Interrupt.c source window, locate the function uartReciveHandler.
3 Place the cursor on the ++callCount; statement in this function and set a breakpoint by choosing Edit>Toggle Breakpoint, or click the Toggle Breakpoint button on the toolbar. Alternatively, use the context menu.
If you want to inspect the details of the breakpoint, choose Edit>Breakpoints.
4 Open the Terminal I/O window and run the program by choosing Debug>Go or clicking the Go button on the toolbar.
The program should stop in the interrupt function.
5 Click Go again in order to see the next number being printed in the Terminal I/O window.
Since the main program has an upper limit on the Fibonacci value counter, the tutorial program will soon reach the exit label and stop.
The Terminal I/O window will display the Fibonacci series.
Figure 33: Printing the Fibonacci values in the Terminal I/O window
U430-2
Part 2. Tutorials 65

66
Using macros for interrupts and breakpoints
Using macros for interrupts and breakpointsTo automate the setting of breakpoints and the procedure of defining interrupts, the system macros __setSimBreak and __orderInterrupt, respectively, can be executed by the setup macro execUserSetup().
The SetupAdvanced.mac file is extended with system macro calls for setting the breakpoint and specifying the interrupt:
SimulationSetup(){... _interruptID = __orderInterrupt( "USART0RX_VECTOR", 4000, 2000, 0, 0, 100 );
if( -1 == _interruptID ) { __message "ERROR: syntax error in interrupt description"; }
_breakID = __setSimBreak( "U0RXBUF", "R", "Access()" ); }
By replacing the SetupSimple.mac file, used in the previous tutorial, with the SetupAdvanced.mac file, setting the breakpoint and defining the interrupt will be automatically performed at C-SPY startup. Thus, you do not need to start the simulation by manually filling in the values in the Interrupts and Breakpoints dialog boxes.
U430-2
MSP430 IAR Embedded Workbench™ IDEUser Guide

Working with library modulesThis tutorial demonstrates how to create library modules and how you can combine an application project with a library project.
This tutorial assumes that you are familiar with the basics of the IAR Embedded Workbench™ described in the previous tutorial chapters.
Using librariesIf you are working on a large project you will soon accumulate a collection of useful routines that are used by several of your programs. To avoid having to assemble a routine each time the routine is needed, you can store such routines as object files, that is, assembled but not linked.
A collection of routines in a single object file is referred to as a library. It is recommended that you use library files to create collections of related routines, such as a device driver.
Use the IAR XAR Library Builder to build libraries. The IAR XLIB Librarian lets you manipulate libraries. It allows you to:
� Change modules from PROGRAM to LIBRARY type, and vice versa� Add or remove modules from a library file� List module names, entry names, etc.
The Main.s43 program
The Main.s43 program uses a routine called r_shift to right-shift the contents of the register R4 the number of times of the value stored in register R5. The result is returned in R4. The EXTERN directive declares r_shift as an external symbol, to be resolved at link time.
A copy of the program is provided in the 430\tutor directory.
U430-2
Part 2. Tutorials 67

68
Using libraries
The library routines
The two library routines will form a separately assembled library. It consists of the r_shift routine called by main, and a corresponding l_shift routine, both of which operate on the contents of the registers A and B and return the result in A. The file containing these library routines is called Shifts.s43, and a copy is provided with the product.
The routines are defined as library modules by the MODULE directive, which instructs the IAR XLINK Linker™ to include the modules only if they are referenced by another module.
The PUBLIC directive makes the r_shift and l_shift entry addresses public to other modules.
For detailed information about the MODULE and PUBLIC directives, see the MSP430 IAR Assembler Reference Guide.
CREATING A NEW PROJECT
1 In the workspace tutorials used in previous chapters, add a new project called project5.
2 Add the file Main.s43 to the new project.
3 To set options, choose Project>Options. Then select XLINK in the Category list and set the following option:
This tutorial uses the default options in the General and A430 categories.
4 To assemble and link the Main.s43 file, choose Project>Make.
Alternatively, click the Make button on the toolbar.
CREATING A LIBRARY PROJECT
Now you are ready to create a library project.
1 In the same workspace tutorials, add a new project called shift_library.
2 Add the file Shifts.s43 to the project.
Page Option
Include LibraryIgnore CSTARTUP in library
Table 10: XLINK options for project 5
U430-2
MSP430 IAR Embedded Workbench™ IDEUser Guide
Working with library modules
3 To set options, choose Project>Options. From the General category, make sure the following option is selected:
Note that the library builder XAR appears in the list of categories. It is not necessary to set any XAR-specific options for this tutorial.
Click OK.
4 Choose Project>Make.
The library output file library.r43 has now been created.
USING THE LIBRARY IN THE PROJECT
You can now add your library containing the shift routine to project5.
1 In the workspace window, click the project5 tab. Choose Project>Add Files and add the file library.r43 located in the projects\Debug\Exe directory. Click Open.
2 Click Make to build your project.
3 You have now combined a library with an executable project, and the application is ready to be executed. For information about how to manipulate the library, see the IAR Linker and Library Tools Reference Guide.
Page Option
Output Output fileLibrary
Table 11: XLINK options fpr library project
U430-2
Part 2. Tutorials 69

70
Using libraries
U430-2
MSP430 IAR Embedded Workbench™ IDEUser Guide

Part 3. Project management and buildingThis part of the MSP430 IAR Embedded Workbench™ IDE User Guide contains the following chapters:
� The development environment
� Managing projects
� Building
� Editing.
U430-2
71

72
U430-2

The development environmentThis chapter introduces you to the IAR Embedded Workbench development environment. The chapter also demonstrates how you can customize the environment to suit your requirements.
The IAR Embedded Workbench IDEThe IAR Embedded Workbench IDE is the framework where all necessary tools are seamlessly integrated: a C/EC++ compiler, an assembler, the IAR XLINK Linker™, the IAR XAR Library Builder™, the IAR XLIB Librarian™, an editor, a project manager with Make utility, and C-SPY™, a high-level language debugger.
The compiler, assembler, and linker can also be run from a command line environment, if you want to use them as external tools in an already established project environment.
U430-2
Part 3. Project management and building 73

74
The IAR Embedded Workbench IDE
The following illustration shows the IAR Embedded Workbench IDE window with different components. The window might look different depending on what additional tools you are using.
Figure 34: IAR Embedded Workbench IDE window
Reference information for each IDE component can be found in the reference part of this book. Information about how to use the different components can be found in parts 3 to 7.
RUNNING THE IAR EMBEDDED WORKBENCH
Click the Start button on the taskbar and choose Programs>IAR Systems>IAR Embedded Workbench for Texas Instruments MSP430>IAR Embedded Workbench.
The IarIdePm.exe file is located in the common\bin directory under your IAR installation, in case you want to start the program from the command line or from within Windows Explorer.
ToolbarMenu bar
Workspace window
Message window
Editorwindow
Status bar
U430-2
MSP430 IAR Embedded Workbench™ IDEUser Guide

The development environment
Double-clicking the workspace filename
The workspace file has the filename extension eww. If you double-click a workspace filename, the IAR Embedded Workbench starts. If you have several versions of IAR Embedded Workbench installed, the workspace file will be opened by the latest version of your Embedded Workbench that uses that file type.
EXITING
To exit the IAR Embedded Workbench, choose File>Exit. You will be asked whether you want to save any changes to editor windows, the projects, and the workspace before closing them.
Customizing the environmentThe IAR Embedded Workbench IDE is a highly customizable environment. This section demonstrates the possibilities for customizing the IDE, communicating with external tools, and for organizing the windows on the screen.
CUSTOMIZING THE IDE
To customize the IDE, choose Tools>Options to get access to a vide variety of commands for:
� Configuring the editor� Configuring the editor colors and fonts� Configuring the project build command� Organizing the windows in C-SPY� Using an external editor� Changing common fonts� Changing key bindings� Configuring the amount of output to the Messages window.
In addition, you can increase the number of recognized filename extensions. By default, each tool in the build tool chain accepts a set of standard filename extensions. If you have source files with a different filename extension, the IAR Embedded Workbench lets you modify the set of accepted filename extensions. Choose Tools>File Extensions to get access to the necessary commands.
For reference information about the commands for customizing the IDE, see Tools menu, page 244. You can also find further information related to customizing the editor in the section Customizing the editor environment, page 94. For further information about customizations related to C-SPY, see Part 4. Debugging.
U430-2
Part 3. Project management and building 75

76
Customizing the environment
COMMUNICATING WITH EXTERNAL TOOLS
The Tools menu is a configurable menu to which you can add external tools for convenient access to these tools from within the IAR Embedded Workbench. For this reason, the menu may look different depending on which tools you have preconfigured to appear as menu commands.
To add an external tool to the menu, choose Tools>Configure Tools to open the Configure Tools dialog box.
Figure 35: Configure Tools dialog box
For reference information about this dialog box, see Configure Tools dialog box, page 255.
U430-2
MSP430 IAR Embedded Workbench™ IDEUser Guide

The development environment
After you have entered the appropriate information and clicked OK, the menu command you have specified is displayed on the Tools menu.
Figure 36: Customized Tools menu
Adding command line commands
Command line commands and calls to batch files must be run from a command shell. You can add command line commands to the Tools menu and execute them from there.
1 To add commands to the Tools menu, you must specify an appropriate command shell.
Type one of the following command shells in the Command text box:
2 Specify the command line command or batch file name in the Argument text box.
The Argument text should be specified as:
/C name
where name is the name of the command or batch file you want to run.
The /C option terminates the shell after execution, to allow the IAR Embedded Workbench IDE to detect when the tool has finished.
Example
To add the command Backup to the Tools menu to make a copy of the entire project directory to a network drive, you would specify Command either as command.cmd or as cmd.exe depending on your host environment, and Argument as:
/C copy c:\project\*.* F:
System Command shell
Windows 98/Me command.com
Windows NT/2000/XP cmd.exe (recommended) or command.com
Table 12: Command shells
U430-2
Part 3. Project management and building 77

78
Customizing the environment
Alternatively, to use a variable for the argument to allow relocatable paths:
/C copy $PROJ_DIR$\*.* F:
ORGANIZING THE WINDOWS ON THE SCREEN
The commands on the Window menu allow you to manipulate the IAR Embedded Workbench windows and change their arrangement on the screen.
The last section of the Window menu lists the windows currently open on the screen, and allows you to switch to one by selecting it.
For reference information about each command, see Window menu, page 259.
U430-2
MSP430 IAR Embedded Workbench™ IDEUser Guide

Managing projectsThis chapter discusses the project model used by the IAR Embedded Workbench. It covers how projects are organized and how you can specify workspaces with multiple projects, build configurations, groups, source files, and options that help you handle different versions of your applications.
The project modelIn a large-scale development project, with hundreds of files, you must be able to organize the files in a structure that is easily navigated and maintained by perhaps several engineers involved.
The IAR Embedded Workbench is a flexible environment for developing projects also with a number of different target processors in the same project, and a selection of tools for each target processor.
HOW PROJECTS ARE ORGANIZED
The IAR Embedded Workbench has been designed to suit the way that software development projects are typically organized. For example, you may need to develop related versions of an application for different versions of the target hardware, and you may also want to include debugging routines into the early versions, but not in the final application.
Versions of your applications for different target hardware will often have source files in common, and you may want to be able to maintain only one unique copy of these files, so that improvements are automatically carried through to each version of the application. Perhaps you also have source files that differ between different versions of the application, such as those dealing with hardware-dependent aspects of the application.
The IAR Embedded Workbench allows you to organize projects in a hierarchical tree structure showing the logical structure at a glance. In the following sections the different levels of the hierarchy are described.
Projects and workspaces
Typically you create a project which contains the source files needed for your embedded systems application. If you have several related projects, you can access and work with them simultaneously. To achieve this, the IAR Embedded Workbench lets you organize related projects in workspaces.
U430-2
Part 3. Project management and building 79

80
The project model
Each workspace you define can contain one or more projects, and each project must be part of at least one workspace.
Consider the following example: two related applications—for instance A and B—will be developed, requiring one development team each (team A and B). Since the two applications are related, parts of the source code can be shared between the applications. The following project model could be applied:
� Three projects—one for each application, and one for the common source code� Two workspaces—one for team A and one for team B.
It is both convenient and efficient to collect the common sources in a library project (compiled but not linked object code), avoiding the need for repeatedly recompiling it.
Figure 37: Examples of workspaces and projects
For an example where a library project has been combined with an application project, see the chapter Working with library modules.
Workspace for team A
� Project for application A
� Project for utility library
Workspace for team B
� Project for application B
� Project for utility library
Development team A
Project for application A
Appl.A
Development team B
Project for application B
Appl.B
Library project for
Utilitylibrary
common sources
U430-2
MSP430 IAR Embedded Workbench™ IDEUser Guide

Managing projects
Projects and build configurations
Often, you need to build several versions of your project. The Embedded Workbench lets you define multiple build configurations for each project. In a simple case, you might need just two, called Debug and Release, where the only difference is, for instance, the options used for optimization, debug information, and output format.
Additional build configurations can be useful, for instance, if you intend to use the application on different target devices. The application is the same, but hardware-related parts of the code differ. Thus, depending on which target device you intend to build for, appropriate source files can be excluded from the build configuration. The following build configurations could fulfil these requirements for Project A:
� Project A - Device 1:Release� Project A - Device 1:Debug� Project A - Device 2:Release� Project A - Device 2:Debug
Groups
Normally, projects contain hundreds of files that are logically related. You can define each project to contain one or more groups, in which you can collect related source files. You can also define multiple levels of subgroups to achieve a logical hierarchy. By default, each group is present in all build configurations of the project, but you can also specify a group to be excluded from a particular build configuration.
Source files
Source files can be located directly under the project node or in a hierarchy of groups. The latter is convenient if the amount of files makes the project difficult to survey. By default, each file is present in all build configurations of the project, but you can also specify a file to be excluded from a particular build configuration.
Only the files that are part of a build configuration will actually be built and linked into the output code.
Once a project has been successfully built, all include files and output files are displayed in the structure below the source file that included or generated them.
Note: The settings for a build configuration can affect which include files that will be used during compilation of a source file. Hence, the set of include files associated with the source file after compilation may differ between the build configurations.
U430-2
Part 3. Project management and building 81

82
The project model
CREATING AND MANAGING WORKSPACES
This section describes the overall procedure for creating the workspace, projects, groups, files, and build configurations.The File menu provides the commands for creating workspaces. The Project menu provides commands for creating projects, adding files to a project, creating groups, specifying project options, and running the IAR Systems development tools on the current projects.
For reference information about these menus, menu commands, and dialog boxes, see the chapter IAR Embedded Workbench IDE reference.
The steps involved for creating and managing a workspace and its contents are:
� Creating a workspace.
An empty workspace window appears, which is the place where you can view your projects, groups, and files.
� Adding new or existing projects to the workspace.� Creating groups.
A group can be added either to the project’s top node or to another group within the project.
� Adding files to the project.
A file can be added either to the project’s top node or to a group within the project.
� Creating new build configurations.
By default, each project you add to a workspace will have two build configurations called Debug and Release.
You can base a new configuration on an already existing configuration. Alternatively, you can choose to create a default build configuration.
Note that you do not have to use the same tool chain for the new build configuration as for other build configurations in the same project.
� Excluding groups and files from a build configuration.
Note that the icon indicating the excluded group or file will change to white in the workspace window.
� Removing items from a project.
Note: It might not be necessary for you to perform all of these steps.
For e detailed example, see Creating an application project, page 25.
U430-2
MSP430 IAR Embedded Workbench™ IDEUser Guide

Managing projects
Source file paths
The IAR Embedded Workbench IDE supports relative source file paths to a certain degree.
If a source file is located in the project file directory or in any subdirectory of the project file directory, the IAR Embedded Workbench IDE will use a path relative to the project file when accessing the source file.
Viewing the workspaceThe workspace window is where you access your projects and files during the application development.
1 Choose which project you want to view by clicking its tab at the bottom of the workspace window, for instance project1.
Figure 38: Displaying a project in the workspace window
For each file that has been built, an Output folder icon appears, containing generated files, such as object files and list files. The latter is generated only if the list file option is enabled.
Also, any included header file will appear, showing dependencies at a glance.
2 To display the project with a different build configuration, choose that build configuration from the drop-down list at the top of the workspace window, for instance project1 – Release.
U430-2
Part 3. Project management and building 83

84
Viewing the workspace
The project and build configuration you have selected are displayed highlighted in the workspace window. It is the project and build configuration that is selected from the drop-down list that will be built when you build your application.
3 To display an overview of all projects in the workspace, click the Overview tab at the bottom of the workspace window.
An overview of all project members is displayed.
Figure 39: Workspace window—an overview
The current selection in the Build Configuration drop-down list is also highlighted when an overview of the workspace is displayed.
U430-2
MSP430 IAR Embedded Workbench™ IDEUser Guide

BuildingThis chapter briefly discusses the process of building your application, and describes how you can extend the tool chain with tools from third-party suppliers.
Building your applicationThe building process consists of the following steps:
� Setting project options� Building the project� Correcting any errors detected during the build procedure.
In addition to using the IAR Embedded Workbench IDE for building an application project, it is also possible to use the command line for building projects.
SETTING OPTIONS
To specify how your application should be built, you must define one or several build configurations. Every build configuration has its own settings, which are independent of the other configurations. All settings are indicated in a separate column in the workspace window.
For example, a configuration that is used for debugging would not be highly optimized, and would produce output that suits the debugging. Conversely, a configuration for building the final application would be highly optimized, and produce output that suits the PROM programmer.
For each build configuration, you can set options on the project level, group level, and file level. On the project level, you can set global and default settings for each configuration. Global settings affect the entire build configuration. Examples of such settings are runtime settings (for example, processor variant and library object file), linker settings, and debug settings.
It is possible to override project level settings by selecting the required item, for instance a specific group of files, and selecting the option Override inherited settings. The new settings will affect all members of that group, that is, files and any groups of files.
To restore all settings to the default factory settings, click on the Factory Settings button.
U430-2
Part 3. Project management and building 85

86
Building your application
Using the Options dialog box
The Options dialog box—available by choosing Project>Options—provides options for the building tools. You set these options for the selected item in the workspace window. Options in the General and C-SPY categories can only be set for the entire build configuration, and not for individual groups and files. However, the options in the other categories can be set for the entire build configuration, a group of files, or an individual file.
Figure 40: General options
The Category list allows you to select which building tool to set options for. The tools available in the Category list depends on which tools are included in your product. When you select a category, one or more pages containing options for that component are displayed.
Click the tab corresponding to the type of options you want to view or change. To restore all settings to the default factory settings, click the Factory Settings button, which is available for all categories except General and Custom Build.
For information about each option and how to set options, see the chapters General options, Compiler options, Assembler options, XLINK options, and C-SPY options in Part 8. Reference information in this guide. For information about options specific to the debugger driver you are using, see the part of this book that corresponds to your driver.
U430-2
MSP430 IAR Embedded Workbench™ IDEUser Guide

Building
Note: If you add to your project a source file with a non-recognized filename extension, you cannot set options on that source file. However, the IAR Embedded Workbench lets you add support for additional filename extensions. For reference information, see File Extensions dialog box, page 257.
BUILDING A PROJECT
You have access to the build commands both from the Project menu and from the context menu that appears if you right-click an item in the workspace window.
The Compile command lets you compile or assemble the files of a project individually. The IAR Embedded Workbench automatically determines whether a source file should be compiled or assembled, based on the filename extension.
Figure 41: Project menu
Alternatively, you can build the entire project using the Make or Rebuild All command. The first command identifies the modified files, and only recompiles or reassembles those files that have been changed before relinking the active project, whereas the second command rebuilds the entire build configuration.
All three commands run in the background, so you can continue editing or working with the IAR Embedded Workbench while your project is being built.
The Clean command lets you erase any intermediate files.
CORRECTING ERRORS FOUND DURING BUILD
The compiler, assembler, and debugger are fully integrated with the development environment. So if there are errors in your source code, you can jump directly to the to the correct position in the appropriate source file by double-clicking the error message in the error listing in the Message window.
U430-2
Part 3. Project management and building 87
88
Extending the tool chain
After you have resolved any problems reported during the build process and rebuilt the project, you can directly start debugging the resulting code at the source level.
To specify the level of output to the Messages window, choose Tools>Options to open the IDE Options dialog box. Click the Messages tab and select the level of output in the Show build messages drop-down list.
BUILDING FROM THE COMMAND LINE
To build a project file from the command line, you can use the application iarbuild.exe located in the common\bin directory. If you run the application from a command shell, you will get a sign-on message describing available commands and their syntax.
Extending the tool chainThe IAR Embedded Workbench provides a feature for executing external tools (not provided by IAR). For the build process, you might need to use other tools, such as:
� Tools that generate files to some kind of specification, for instance Lex and YACC� Tools that convert binary files, for instance files containing image bitmaps or audio
data, to a table of data in an assembler or C source file. This data could then be compiled and linked together with the rest of your application.
The IAR Embedded Workbench contains a Custom Build utility to simplify an expansion of the standard tool chain.
CUSTOM BUILD
To add an external tool to the build process, follow these steps:
1 Add the file you want to work with to your project, for instance foo.lex.
2 Select this file in the Workspace window and choose Project>Options. Select Custom Build from the list of categories.
3 In the Command Line field, type the command line for executing the external tool, for instance:
flex $FILE_PATH$ -o$FILE_BPATH$.c
During the build process, this command line will be expanded to:
flex foo.lex -ofoo.c
Note the usage of argument variables. For further details of these variables, see Argument variables summary, page 242.
U430-2
MSP430 IAR Embedded Workbench™ IDEUser Guide

Building
4 In the Outputs field, describe the output files that are relevant for the building. In this example, the tool Flex would generate two files—one source file and one header file. The text in the Output field for these two files would look like this:
$FILE_BPATH$.c$FILE_BPATH$.h
5 If there are any files used by the external tool during the build, these should be added in the Inputs/Dependencies field: for instance:
$TOOLKIT_DIR$\inc\stdio.h
This is important, because if the definitions in the dependency files change, the conditions would no longer be the same.
6 Click OK.
7 To build your application, select Project>Make.
U430-2
Part 3. Project management and building 89

90
Extending the tool chain
U430-2
MSP430 IAR Embedded Workbench™ IDEUser Guide

EditingThis chapter describes in detail how to use the IAR Embedded Workbench editor. The final section describes how to customize the editor and how to use an external editor of your choice.
Using the IAR Embedded Workbench editorThe integrated text editor allows editing of multiple files in parallel, and provides all basic editing features expected from a modern editor, including unlimited undo/redo, automatic completion, and drag and drop. In addition, it provides functions specific to software development, like coloring of keywords (C/EC++, assembler, and user-defined), block indent, and function navigation within source files. It also recognizes C language elements, like matching brackets.
EDITING A FILE
The editor window is where you write, view, and modify your source code. You can open one or several editor windows, containing one source file each, either from the File menu, or by double-clicking a file in the workspace window.
Figure 42: Editor window
To open a source or include file for editing, double-click its icon in the Project window tree display. Alternatively, you can open a file for editing on the File menu.
Splitter control
Splitter control
Bookmark
Go to function
with modificationTitle bar
indicator
U430-2
Part 3. Project management and building 91

92
Using the IAR Embedded Workbench editor
Editor commands and shortcut keys
The Edit menu provides commands for editing and searching in editor windows. For instance, unlimited undo/redo by using the Edit>Undo and Edit>Redo commands, respectively. You can also find some of these commands on the context menu that appears when you right-click in the editor windows. For reference information about each command, see Edit menu, page 233.
There are also editor shortcut keys for:
� moving the insertion point� scrolling text� selecting text.
For detailed information about these shortcut keys, see Editor key summary, page 229.
To change the default shortcut key bindings, choose Tools>Options, and click the Key Bindings tab. For further details, see Key Bindings page, page 247.
Read-only and modification indicators
The name of the open source file is displayed in the editor window title bar.
If a file is a read-only file, the text (Read Only) appears after the file name, for example Utilities.c (Read Only).
If a file has been modified after it was last saved, an asterisk appears after the window title, for example Utilities.c *.
Bookmarks
Use the Edit>Bookmark command to add bookmarks, for instance to parts of the text for which you have a particular interest. To switch between the marked locations, choose Edit>Go to Bookmark.
Splitting the editor window into panes
You can split the editor window horizontally or vertically into multiple panes, to allow you to look at different parts of the same source file at once, or cut and paste text between two different parts.
To split the window, double-click the appropriate splitter bar, or drag it to the middle of the window. Alternatively, you can split a window into panes using the Window>Split command.
To revert to a single pane, double-click the splitter bar or drag it back to the end of the scroll bar.
U430-2
MSP430 IAR Embedded Workbench™ IDEUser Guide

Editing
Dragging and dropping of text
You can easily move text within an editor window or between different editor windows. Select the text and drag it to the new location.
Syntax coloring
The IAR Embedded Workbench editor automatically recognizes the syntax of assembler and C or Embedded C++ programs, and displays the different components of the program in different text styles.
To change these styles, choose Tools>Options, and click the Editor Colors and Fonts tab in the IDE Options dialog box. For additional information, see Editor Colors and Fonts page, page 249.
Indentation
The editor automatically indents a line to match the previous line. If you want to indent a number of lines, select the lines and press the Tab key. Press Shift-Tab to move a whole block of lines to the left.
To customize the indentation, choose Tools>Options, and click the Editor tab. For additional information, see Editor page, page 248.
Matching brackets
Choose Edit>Match Brackets to select all text between the brackets immediately surrounding the insertion point. Every time you choose Match Brackets after that, the selection will increase to the next hierarchic pair of brackets.
Function navigation
Click the Go to function button in the bottom left corner in an editor window to list all functions defined in the source file displayed in the window. You can then choose to go directly to one of the functions by double-clicking it in the list.
U430-2
Part 3. Project management and building 93

94
Customizing the editor environment
Status information
As you are editing, the status bar—available by choosing View>Status Bar— shows the current line and column number containing the insertion point, and the Caps Lock, Num Lock, and Overwrite status:
Figure 43: Editor window status bar
SEARCHING
There are several standard search functions available in the editor:
� Quick search text box� Find dialog box� Replace dialog box� Find in files dialog box
To use the Quick search text box on the toolbar, type the text you want to search for and press Enter. Press Escape to cancel the search. This is a quick method for searching for text in the active editor window.
To use the Find, Replace, and Find in Files functions, choose the corresponding command from the Edit menu. For reference information about each search function, see Edit menu, page 233.
Customizing the editor environmentThe IAR Embedded Workbench IDE editor can be configured on the IDE Options pages Editor and Editor Colors and Fonts. Choose Tools>Options to access the pages.
For details about these pages, see Tools menu, page 244.
USING AN EXTERNAL EDITOR
The External Editor page—available by choosing Tools>Options—lets you specify an external editor of your choice.
1 Select the option Use External Editor.
2 An external editor can be called in one of two ways, using the Type drop-down menu.
U430-2
MSP430 IAR Embedded Workbench™ IDEUser Guide

Editing
Command Line calls the external editor by passing command line parameters.
DDE calls the external editor by using DDE (Windows Dynamic Data Exchange).
3 If you use the command line, specify the command line to pass to the editor, that is, the name of the editor and its path, for instance:
C:\WINNT\NOTEPAD.EXE.
You can send an argument to the external editor by typing the argument in the Arguments field. For example, type $FILE_PATH$ to start the editor with the active file (in editor, project, or Messages window).
Figure 44: Specifying external command-line editor
4 If you use DDE, specify the editor’s DDE service name in the Service field. In the Command field, specify a sequence of command strings to send to the editor.
The service name and command strings depend on the external editor that you are using. Refer to the user documentation of your external editor to find the appropriate settings.
The command strings should be entered as:
DDE-Topic CommandStringDDE-Topic CommandString
U430-2
Part 3. Project management and building 95

96
Customizing the editor environment
as in the following example, which applies to Codewright®:
Figure 45: External editor DDE settings
The command strings used in this example will open the external editor with a dedicated file activated. The cursor will be located on the current line as defined in the context from where the file is open, for instance when searching for a string in a file, or when double-clicking an error message in the Message window.
5 Click OK.
When you open a file by double-clicking it in the workspace window, the file will be opened by the external editor.
Variables can be used in the arguments. For more information about the argument variables that are available, see Argument variables summary, page 242.
U430-2
MSP430 IAR Embedded Workbench™ IDEUser Guide

Part 4. DebuggingThis part of the MSP430 IAR Embedded Workbench™ IDE User Guide contains the following chapters:
� The IAR C-SPY Debugger
� Configuring the debugger
� Executing your application
� Working with variables and expressions
� Using breakpoints
� Monitoring memory and registers
� Using C-SPY macros
� Analyzing your application.
U430-2
97

98
U430-2

The IAR C-SPY DebuggerThis chapter introduces you to the IAR C-SPY Debugger. First some of the concepts are introduced that are related to debugging in general and to the IAR C-SPY Debugger in particular. Then the debugger environment is presented, followed by a description of how to customize it.
Debugger conceptsThis section introduces some of the concepts that are related to debugging in general and to the IAR C-SPY Debugger in particular. This section does not contain specific conceptual information related to the functionality of the IAR C-SPY Debugger. Instead, such information can be found in each chapter of this part of the guide. The IAR user documentation uses the following terms when referring to these concepts.
IAR C-SPY DEBUGGER AND TARGET SYSTEMS
The IAR C-SPY Debugger can be used for debugging either a software target system or a hardware target system. The figure below shows an overview of C-SPY and possible target systems.
Figure 46: IAR C-SPY Debugger and target systems
EmbeddedWorkbench C-SPY
Simulatordriver
ROM-monitordriver
Emulatordriver
IAR C-SPY DEBUGGER TARGET SYSTEM
Target hardware
Target hardware
simulated by software
JTAG
emulatorTarget
hardware
App
lica
tion
Sof
twar
e
= Provided by IAR
ROM-monitor
U430-2
Part 4. Debugging 99

100
Debugger concepts
For information about which C-SPY drivers are available for the MSP430 C-SPY Debugger, see the chapter Product introduction.
DEBUGGER
The debugger, for instance C-SPY, is the program that you use for debugging your applications on a target system.
TARGET SYSTEM
The target system is the system on which you execute your application when you are debugging it. The target system can consist of hardware, either an evaluation board or your own hardware design. It can also be completely or partially simulated by software. Each type of target system needs a dedicated C-SPY driver.
USER APPLICATION
A user-application is the software you have developed and which you want to debug using the IAR C-SPY Debugger.
IAR C-SPY DEBUGGER SYSTEMS
The IAR C-SPY Debugger consists of both a general part which provides a basic set of C-SPY features, and a driver. The C-SPY driver is the part that provides communication with and control of the target system. The driver also provides the user interface—menus, windows, and dialog boxes—to the functions provided by the target system, for instance, special breakpoints. The following C-SPY drivers are provided:
� Simulator driver� ROM-monitor driver� Emulator driver
If you have more than one C-SPY driver installed on your computer you can easily switch between them just by choosing the appropriate driver from within the IAR Embedded Workbench.
For an overview of the functionality provided by each driver, see IAR C-SPY Debugger, page 5. This chapter also gives an overview of the functionality that is general to the C-SPY Debugger.
ROM-MONITOR PROGRAM
The ROM-monitor program is a piece of firmware that must be loaded to non-volatile memory on your target hardware; it runs in parallel with your application. The ROM-monitor communicates with the debugger and provides services needed for debugging the application, for instance stepping and breakpoints.
U430-2
MSP430 IAR Embedded Workbench™ IDEUser Guide

The IAR C-SPY Debugger
THIRD-PARTY DEBUGGERS
It is possible to use a third-party debugger together with the IAR tool chain as long as the third-party debugger can read any of the output formats provided by XLINK, such as UBROF, Intel-extended, ELF/DWARF, COFF, Motorola, or any other available format. For information about which format to use with third-party debuggers, see the user documentation supplied with that tool.
The C-SPY environmentAN INTEGRATED ENVIRONMENT
The IAR C-SPY Debugger is a high-level-language debugger for embedded applications. It is designed for use with the IAR compiler and assembler, and is completely integrated in the IAR Embedded Workbench IDE, providing development and debugging within the same application.
All windows that are open in the Embedded Workbench workspace will stay open when you start the C-SPY Debugger. In addition, a set of C-SPY-specific windows will be opened. You can read more about how to organize the debugger workspace, see Organizing the windows on the screen, page 104.
When you start the debugger, the editor windows are where you debug your application. You can modify your code in an editor window during the debug session, but changes will not take effect until you exit from the debugger and rebuild your application. Depending on your preferences you can fine-tune the behavior of the editor windows, see Displaying the source code, page 103.
The integration also makes it possible to set breakpoints in the text editor at any point during the development cycle. It is also possible to inspect and modify breakpoint definitions even though the debugger is not running. Breakpoints are highlighted in the editor windows and breakpoint definitions flow with the text as you edit. Your debug settings, such as watch properties, window layouts, and register groups will remain between your debug sessions.
U430-2
Part 4. Debugging 101

102
The C-SPY environment
The following illustration shows the different components of the IAR Embedded Workbench IDE window when you are debugging, using the IAR C-SPY Debugger:
Figure 47: Embedded Workbench with C-SPY started
In addition to the features available in the IAR Embedded Workbench, the debugger environment consists of a set of C-SPY-specific items, such as a debugging toolbar, menus, windows, and dialog boxes.
Reference information about each item specific to C-SPY can be found in the chapter C-SPY Debugger IDE reference, page 261. Conceptual information as well as information about how to use the items can be found in this part of the book.
For specific information about a C-SPY driver, see the part of the book corresponding to the driver.
Menu bar
Toolbar
Status bar
EditorwindowProject
window
Register window
Log windowWatch
window
U430-2
MSP430 IAR Embedded Workbench™ IDEUser Guide

The IAR C-SPY Debugger
Customizing the debugger workspaceThis section describes how you adapt the editor windows for debugging and organize them on the screen, and finally how you can redirect the output in the Log window to a log file.
DISPLAYING THE SOURCE CODE
The editor windows are where you edit your source code while debugging. You can open one or several editor windows, containing one source file each, either from the File menu, or by double-clicking a file in the Project window. The editor window containing the file currently being debugged is the active window.
If your project contains many source files it can be inconvenient to have many concurrent editor windows open during the debug session. Instead, you can decide to use a dedicated editor window for all source code debugging. A special editor window is opened when you start C-SPY, and closed when you exit C-SPY. The dedicated editor window will display any source file currently being debugged. All other editor windows will remain in the background.
Choose Tools>Options. On the Debugger page, select or deselect the option Use a dedicated editor window for debugging according to your preferences.
Figure 48: Debugger settings
For further details of the available options, see Debugger page, page 253.
U430-2
Part 4. Debugging 103

104
Customizing the debugger workspace
ORGANIZING THE WINDOWS ON THE SCREEN
Depending on the type of project and the current focus when you are debugging, you may want to arrange the debugger windows in a particular way on the screen. This is done by using window layouts. The layout commands are available on the Debug menu.
For each new project a default layout file will be created.
When you exit the C-SPY Debugger, the current layout on the screen will automatically be saved with the project. The next time you load that project, the screen layout will be the same as when you last exited, unless you load a specific layout file.
It is also possible to define a layout and save it to a separate file, at any time during a debug session. The advantage of using a dedicated layout is that the workspace will look the same every time you load that file. You can also define the layout with specific requirements in mind. By defining multiple files you can use different layouts for different needs.
U430-2
MSP430 IAR Embedded Workbench™ IDEUser Guide

The IAR C-SPY Debugger
Some examples of when different layouts are useful and what they could look like:
� When you debug the application logic the editor, Watch, Locals and Call Stack windows are probably the most interesting windows.
Figure 49: C-SPY windows layout example 1
U430-2
Part 4. Debugging 105

106
Customizing the debugger workspace
� When you debug the critical parts of your code that control the hardware, typically the Disassembly, Register, and Memory windows are relevant.
Figure 50: C-SPY windows layout example 2
REDIRECTING DEBUGGER OUTPUT TO A FILE
The Log window—available from the View menu—displays debugger output, such as diagnostic messages and trace information. It can sometimes be convenient to log the information to a file where it can be easily inspected. The Log Files dialog box—available from the Debug menu—allows you to log output from C-SPY to a file. The two main advantages are:
� The file can be opened the file in another tool, for instance an editor, so you can navigate and search within the file for particularly interesting parts
� The file provides history about how you have controlled the execution, for instance, what breakpoints have been triggered etc.
The information printed in the file is by default the same as the information listed in the Log window. However, you can choose what you want to log in the file: errors, warnings, system information, user messages, or all of these. For reference information about the Log File options, see Log File dialog box, page 285.
U430-2
MSP430 IAR Embedded Workbench™ IDEUser Guide

Configuring the debuggerThis chapter describes in detail how to configure the IAR C-SPY™ Debugger to reflect the target hardware. In particular it describes the options and their possible settings for initializing the C-SPY Debugger.
In addition to the general target adaptations described in this chapter, there can also be adaptations specific to the debugger system you are using. See each driver-specific supplement for further details.
Adapting C-SPY to target hardwareDEVICE DESCRIPTION FILE
C-SPY handles several of the target-specific adaptations by using device description files provided with the product. They contain device-specific information such as:
� Memory information for device-specific memory zones� Definitions of memory-mapped peripheral units, device-specific CPU registers, and
groups of these� Definitions for interrupt simulation in the simulator.
You can find customized device description files for each MSP430 device in the 430\config directory.
For information about how to load a device description file, see Selecting a device description file, page 110.
U430-2
Part 4. Debugging 107

108
Adapting C-SPY to target hardware
Memory zones
To view memory conveniently, the C-SPY Debugger uses device-specific memory zones. By default there is only one address zone in the debugger, Memory, which covers the whole MSP430 memory range. If you load a device description file, additional zones that adhere better to the specific device memory layout are defined.
Figure 51: Zones in C-SPY
If your hardware does not have the same memory layout as the device description file, you can define customized zones by adding them to the appropriate file. For further details of customizing the file, see Modifying a device description file, page 109.
Memory zones are used in several contexts, perhaps most notably in the Memory and Disassembly windows. The Zone box in these windows allows you to choose which memory zone to display.
Registers
For each device there is a hardwired group of CPU registers. Their contents can be displayed and edited in the Register window. Additional registers are defined in a specific register definition file—with the filename extension sfr—which is included from the register section of the device description file. These registers are the device-specific memory-mapped control and status registers for the peripheral units on the MSP430 microcontrollers.
Due to the large amount of registers it is inconvenient to list all registers concurrently in the Register window. Instead the registers are divided into logical register groups. By default there is one register group in the MSP430 debugger, namely CPU Registers.
SFR
Default zone Memory Additional zones for MSP430F149
0xFFFF
0x0200
0x0000
0xFFFF
0x0000
RAM
0x1100
0x0A00
Flash
U430-2
MSP430 IAR Embedded Workbench™ IDEUser Guide

Configuring the debugger
For details about how to work with the Register window, view different register groups, and how to configure your own register groups to better suit the use of registers in your application, see the section Working with registers, page 131.
Interrupts
Device description files also contain a section that defines all device-specific interrupts, which makes it possible to simulate these interrupts in the C-SPY Simulator. You can read more about how to do this in Simulating interrupts, page 157.
Modifying a device description file
There is normally no need to modify the device description file. If the predefinitions are not sufficient for some reason, you can, however, edit the file. The syntax of the device descriptions is described in the files. Note however that the format of these descriptions may be updated in future upgrade versions of the product.
Make a copy of a device description file that best suits your needs, and modify it according to the descriptions in the file.
HARDWARE MULTIPLIER
The C-SPY Simulator can simulate the MSP430 hardware multiplier peripheral unit. To enable this simulation, choose Project>Options before starting C-SPY. Click the Target tab in the C-SPY category and select the option Hardware multiplier. The option is only enabled when you have chosen a device containing the hardware multiplier from the Device drop-down list.
Initializing the IAR C-SPY DebuggerBefore you start the C-SPY debugger you must set options to initialize the debugger system. These options are available on the Setup page of the C-SPY category, available with the Project>Options command.
SELECTING DEBUG DRIVER
Before starting the C-SPY debugger, you must select a driver for the debugger system from the Driver drop-down list on the Setup page.
Note: You can only choose a driver you have installed on your computer.
EXECUTING FROM RESET
Using the Run to option, you can specify a location to which you want C-SPY to run when you start the debugger as well as after each reset.
U430-2
Part 4. Debugging 109

110
Initializing the IAR C-SPY Debugger
The default location to run to is the main function. Type the name of the location if you want C-SPY to run to a different location. You can specify assembler labels or whatever can be evaluated to such, for instance function names.
If you leave the check box empty, the program counter will then contain the regular hardware reset address at each reset.
AUTOMATING THE INITIALIZATION USING A SETUP FILE
A setup macro file is a standard macro file that you choose to load automatically when C-SPY starts. You can define the setup macro file to perform actions according to your needs, by using setup macro functions and system macros. Thus, by loading a setup macro file you can initialize C-SPY to perform actions automatically.
To register a setup macro file, select Use setup file and type the path and name of your setup macro file, for example Setup.mac. If you do not type a filename extension, the extension mac is assumed. A browse button is available for your convenience.
For detailed information about setup macro files and functions, see The macro file, page 136.
SELECTING A DEVICE DESCRIPTION FILE
If you want to use the device-specific information provided in the device description file during your debug session, you must select an appropriate device description file. Device description files are provided in the 430\config directory and they have the filename extension ddf.
To load a device description file that suits your device, follow these steps:
1 Before you start the C-SPY Debugger, choose Project>Options and click the Target tab in the General category.
2 Select a device from the Device drop-down menu. An appropriate device description file will automatically be used.
3 To override the selection of device description file, select the C-SPY category. On the Setup page, enable the use of a description file and select another file using the Device description browse button.
U430-2
MSP430 IAR Embedded Workbench™ IDEUser Guide

Executing your applicationThe IAR C-SPY™ Debugger provides a flexible range of facilities for executing your application during debugging. This chapter contains information about:
� The conceptual differences between source mode and disassembly mode debugging
� Executing your application
� The call stack
� Handling terminal input and output.
Source and disassembly mode debuggingThe IAR C-SPY Debugger allows you to switch seamlessly between source mode and disassembly mode debugging as required.
Source debugging provides the fastest and easiest way of developing your application, without having to worry about how the compiler or assembler has implemented the code. In the editor windows you can execute the program one statement at a time while monitoring the values of variables and data structures.
Disassembly mode debugging lets you focus on the critical sections of your application, and provides you with precise control over the hardware. You can open a disassembly window which displays a mnemonic assembler listing of your program based on actual memory contents rather than source code, and lets you execute the program exactly one instruction at a time. In Mixed-Mode display, the debugger also displays the corresponding C/EC++ source code interleaved with the disassembly listing.
Regardless of which mode you are debugging in, you can display registers and memory, and change their contents.
For an example of a debug session both in C source mode and disassembly mode, see the chapter Debugging the application, page 37.
U430-2
Part 4. Debugging 111

112
Executing
ExecutingThe IAR C-SPY debugger provides a flexible range of features for executing your application. You can find commands for executing on the Debug menu as well as on the toolbar.
STEP
C-SPY allows more stepping precision than most other debuggers in that it is not line-oriented but statement oriented. The compiler generates detailed stepping information in the form of step points at each statement, as well as at each function call. That is, places in the code where you might consider whether to execute a step into or a step over command. Since the step points are located not only at each statement but also at each function call, the step functionality allows a finer granularity than just stepping on statements. There are four different step commands:
� Step Into� Step Over� Next Statement� Step Out
Consider this example and assume that the previous step has taken you to the f(i) function call (highlighted with bold):
int f(int n){ value = f(n-1) + f(n-2) + f(n-3); return value; }...f(i);value ++;
While stepping, you typically consider whether to step into a function and continue stepping inside the function or subroutine. The Step Into command takes you to the first step point within the subroutine, f(n-1):
int f(int n){ value = f(n-1) + f(n-2) + f(n-3); return value;}...f(i);value ++;
U430-2
MSP430 IAR Embedded Workbench™ IDEUser Guide

Executing your application
The Step Into command executes to the next step point in the normal flow of control, regardless of whether it is in the same or another function.
The Step Over command executes to the next step point in the same function, without stopping inside called functions. The command would take you to the f(n-2) function call, which is not a statement on its own but part of the same statement as f(n-1). Thus, you can skip uninteresting calls which are parts of statements and instead focus on critical parts:
int f(int n){ value = f(n-1) + f(n-2) + f(n-3); return value;}...f(i);value ++;
The Next Statement command executes directly to the next statement return value, allowing faster stepping:
int f(int n){ value = f(n-1) + f(n-2) + f(n-3); return value;}...f(i);value ++;
When inside the function, you have the choice of stepping out of it before reaching the function exit, by using the Step Out command. This will take you directly to the statement immediately after the function call:
int f(int n){ value = f(n-1) + f(n-2) f(n-3); return value; ...}...f(i);value ++;
The possibility of stepping into an individual function that is part of a more complex statement is particularly useful when you use C code containing many nested function calls. It is also very useful for Embedded C++, which tends to have many implicit function calls, such as constructors, destructors, assignment operators, and other user-defined operators.
U430-2
Part 4. Debugging 113

114
Executing
This detailed stepping can in some circumstances be either invaluable or unnecessarily slow. For this reason, it is also possible to step only on statements, which means faster stepping.
GO
The Go command continues execution from the current position until a breakpoint or program exit is reached.
RUN TO CURSOR
The Run to Cursor command executes to the position in the source code where you have placed the cursor. The Run to Cursor command also works in the Disassembly window and in the Call Stack window.
HIGHLIGHTING
At each stop, C-SPY highlights the corresponding C or Embedded C++ source with a green color.
For simple statements without function calls, the whole statement is typically highlighted. When stopping at a statement with function calls, C-SPY highlights the first call since this illustrates more clearly what Step Into and Step Over would mean at that time.
Occasionally, you will notice that a statement in the source window is highlighted using a pale variant of the normal highlight color. This happens when the program counter is at an assembler instruction which is part of a source statement but not exactly at a step point. This is often the case when stepping in the Disassembly window. Only when the program counter is at the first instruction of the source statement, the ordinary highlight color is used.
USING BREAKPOINTS TO STOP
You can set breakpoints in the program to stop at locations of particular interest. These locations can be either at code sections where you want to investigate whether your program logic is correct, or at data accesses to investigate when and how the data is changed. Depending on which debugger solution you are using you might also have access to additional types of breakpoints. For instance, if you are using C-SPY Simulator there is a special kind of breakpoint to facilitate simulation of simple hardware devices. See the chapter Simulator functionality for further details.
For a more advanced simulation, you can stop under certain conditions, which you specify. It is also possible to connect a C-SPY macro to the breakpoint. The macro can be defined to perform actions, which for instance can simulate specific hardware behavior.
U430-2
MSP430 IAR Embedded Workbench™ IDEUser Guide

Executing your application
All these possibilities provide you with a flexible tool for investigating the status on, for example, variables and registers at different stages during the application execution.
For detailed information about the breakpoint system and how to use the different breakpoint types, see the chapter Using breakpoints.
USING THE BREAK BUTTON TO STOP
While the program is executing, the Break button on the debug toolbar is highlighted in red. You can stop the application execution by clicking the Break button, alternatively by choosing the Debug>Break command.
STOP AT PROGRAM EXIT
Typically, the execution of an embedded application is not intended to end, which means that the application will not make use of a traditional exit. However, there are situations where a controlled exit is necessary, such as during debug sessions. You can link your application with a special library that contains an exit label. A breakpoint will be automatically set on that label to stop execution when it gets there, and the application will exit properly. Before you start C-SPY, choose Project>Options, and select the XLINK category. On the Output page, select the output Debug info (-r).
Call stack informationThe MSP430 IAR C/EC++ Compiler generates extensive backtrace information. This allows C-SPY to show, without any runtime penalty, the complete call chain at any time. Typically, this is useful for two purposes:
� Determining in what context the current function has been called� Tracing the origin of incorrect values in variables and incorrect values in
parameters, thus locating the function in the call chain where the problem occurred.
The Call Stack window—available on the View menu—shows a list of function calls, with the current function at the top. When you inspect a function in the call chain, by double-clicking on any function call frame, the contents of all affected windows will be updated to display the state of that particular call frame. This includes the editor, Locals, Register, Watch and Disassembly windows. A function would normally not make use of all registers, so these registers may have undefined states and be displayed as dashes (---).
In the editor and Disassembly windows, a green highlight indicates the topmost, or current, call frame, while a yellow highlight is used when inspecting other frames.
For your convenience, it is possible to select a function in the call stack and click the Run to Cursor button—available on the Debug menu—to execute to that function.
U430-2
Part 4. Debugging 115

116
Terminal input and output
Terminal input and outputSometimes you might need to debug constructions in your application that use stdin and stdout without an actual hardware device for input and output. The Terminal I/O window—available on the View menu—lets you enter input to your program, and display output from it.
This facility can be useful in two different contexts:
� If your application uses stdin and stdout� For producing debug trace printouts.
To use this window, you need to link your program with the option Debug information with terminal I/O. C-SPY will then direct stdin, stdout, and stderr to this window.
For reference information, see Terminal I/O window, page 272.
Directing stdin and stdout to a file
You can also direct stdin and stdout directly to a file. You can then open the file in another tool, for instance an editor, to navigate and search within the file for particularly interesting parts. The Terminal I/O Log Files dialog box—available by choosing Debug>Logging—allows you to select a destination log file, and to log terminal I/O input and output from C-SPY to this file.
For reference information, see Terminal I/O Log File dialog box, page 286.
U430-2
MSP430 IAR Embedded Workbench™ IDEUser Guide

Working with variables and expressionsThis chapter defines the variables and expressions used in C-SPY. It also demonstrates the different methods for examining variables and expressions.
C-SPY expressionsC-SPY lets you examine the C variables, C expressions, and assembler symbols that you have defined in your application code. In addition, C-SPY allows you to define C-SPY macro variables and macro functions and use them when evaluating expressions. Expressions that are built with these components are called C-SPY expressions and there are several methods for monitoring these in C-SPY.
C-SPY expressions can include any type of C expression, except function calls. The following types of symbols can be used in expressions:
� C/EC++ symbols� Assembler symbols (register names and assembler labels)� C-SPY macro functions� C-SPY macro variables
Examples of valid C-SPY expressions are:
i + ji = 42#asm_label#R2#PCmy_macro_func(19)
C SYMBOLS
C symbols are symbols that you have defined in the C source code of your application, for instance variables, constants, and functions. C symbols can be referenced by their names.
U430-2
Part 4. Debugging 117

118
C-SPY expressions
ASSEMBLER SYMBOLS
Assembler symbols can be assembler labels or register names. That is, general purpose registers, such as R4–R15, and special purpose registers, such as the program counter and the status register. If a device description file is used, all memory-mapped peripheral units, such as I/O ports, can also be used as assembler symbols in the same way as the CPU registers. See Device description file, page 107.
Assembler symbols can be used in C-SPY expressions if they are prefixed by #.
In case of a name conflict between a hardware register and an assembler label, hardware registers have a higher precedence. To refer to an assembler label in such a case, you must enclose the label in back quotes ` (ASCII character 0x60). For example:
Which processor-specific symbols are available by default can be seen in the Register window, using the CPU Registers register group. See Register groups, page 131.
MACRO FUNCTIONS
Macro functions consist of C-SPY variable definitions and macro statements which are executed when the macro is called.
For details of C-SPY macro functions and how to use them, see The macro language, page 136.
MACRO VARIABLES
Macro variables are defined and allocated outside your application, and can be used in a C-SPY expression. In case of a name conflict between a C symbol and a C-SPY macro variable, the C-SPY macro variable will have a higher precedence than the C variable. Assignments to a macro variable assigns both its value and type.
For details of C-SPY macro variables and how to use them, see The macro language, page 329.
Example What it does
#pc++ Increments the value of the program counter.
myptr = #label7 Sets myptr to the integral address of label7 within its zone.
Table 13: C-SPY assembler symbols expressions
Example What it does
#pc Refers to the program counter.
#`pc` Refers to the assembler label pc.
Table 14: Handling name conflicts between hardware registers and assembler labels
U430-2
MSP430 IAR Embedded Workbench™ IDEUser Guide

Working with variables and expressions
Limitations on variable informationThe value of a C variable is valid only on step points, that is, the first instruction of a statement and on function calls. This is indicated in the editor window with a bright green highlight color. In practice the value of the variable is accessible and correct more often than that.
When the program counter is inside a statement, but not at a step point, the statement or part of the statement is highlighted with a pale variant of the ordinary highlight color.
EFFECTS OF OPTIMIZATIONS
The compiler is free to optimize the application software as much as possible, as long as the expected behavior remains. Depending on your project settings, a high level of optimization results in smaller or faster code, but also in increased compile time. Debugging may be more difficult since it will be less clear how the generated code relates to the source code. Typically, using a high optimization level can affect the code in a way that will not allow you to view a value of a variable as expected.
Consider this example:
foo(){ int i = 42; ... x = bar(i); //Not until here the value of i is known to C-SPY ...}
From the point where the variable i is declared until it is actually used there is no need for the compiler to waste stack or register space on it. The compiler can optimize the code, which means C-SPY will not be able to display the value until it is actually used. If you try to view a value of a variable that is temporarily unavailable, C-SPY will display the text:
Unavailable
If you need full information about values of variables during your debugging session, you should make sure to use the lowest optimization level during compilation, that is, None.
U430-2
Part 4. Debugging 119

120
Viewing variables and expressions
Viewing variables and expressionsThere are several methods for looking at variables and calculating their values:
� Tooltip watch provides the simplest way of viewing the value of a variable or more complex expressions. Just point at the variable with the pointer. The value will be displayed next to the variable.
� The Locals window—available from the View menu—automatically displays the local variables, that is, auto variables and function parameters for the active function.
� The Watch window—available from the View menu—allows you to monitor the values of C-SPY expressions and variables.
� The Quick Watch dialog box� The Trace window.
For reference information about the Locals window, see Locals window, page 270. For reference information about the Watch window, see Watch window, page 269. For reference information about the Quick Watch dialog box, see Quick Watch dialog box, page 283. For reference information about the Trace window, see Trace window, page 276.
WORKING WITH THE WINDOWS
All the windows are easy to use. You can add, modify, and remove expressions, and change the display format.
A context menu containing useful commands is available in all windows if you right-click in each window. Convenient drag-and-drop between windows is supported, except for in the Locals window and the Quick Watch dialog where it is not applicable.
To add a value you can also click in the dotted rectangle and type the expression you want to examine. To modify the value of an expression, click in the Value field and modify its content. To remove an expression, select it and press the Delete key.
Using the Quick Watch dialog box
The Quick Watch dialog box—available from the Debug menu—lets you watch the value of a variable or expression and evaluate expressions.
The Quick Watch dialog box is different from the Watch window in the following ways:
� The Quick Watch dialog box offers a fast method for inspecting and evaluating expressions. Right-click on the expression you want to examine and choose Quick Watch from the context menu that appears. The expression will automatically appear in the Quick Watch dialog box.
� The Watch window lets you monitor an expression during a longer period of time, whereas Quick Watch provides you with a one-shot view.
U430-2
MSP430 IAR Embedded Workbench™ IDEUser Guide

Working with variables and expressions
� In contrast to the Watch window, the Quick Watch dialog box gives you precise control over when to evaluate the expression. For single variables this might not be necessary, but for expressions with side effects, such as assignments and C-SPY macro functions, it allows you to perform evaluations under controlled conditions.
Figure 52: Quick Watch dialog box
Using the Trace window
The Trace window—available from the View menu—lets you trace the values of C-SPY expressions. You can trace the program flow until a specific state, for instance an application crash, and use the trace information to locate the origin of the problem.
You define the expressions you want to trace on the Expression page.
Figure 53: Trace window (Expression page)
U430-2
Part 4. Debugging 121

122
Viewing variables and expressions
Logging trace information
Click the Output tab to view the Output page, which logs the values of each expression.
Figure 54: Trace window (Output page)
Click the Activate button on the Trace toolbar to activate the trace function. The window will be updated with trace information every time execution in C-SPY stops or when a breakpoint is triggered.
If you want to produce trace information for a longer period of application execution time, click the Go with Trace button. The application is executed and the values of expressions are logged continuously for each PC location. During execution, no C-SPY windows are refreshed.
Viewing the figures
The column PC displays the current value of the program counter at which the expression was evaluated. Each expression you have defined appears in a separate column. Each entry in this column displays, for the current value of the program counter, the value of the expression.
Click the Toggle Mixed-Mode button if you want to display both disassembly and source code in the window. You can double-click a C statement to open the corresponding source file in an editor window.
Click the Find button if you want to examine a value at a specific PC location.
To be able to browse the trace information conveniently in a file, choose File>Save As. A standard Save As dialog box appears.
Click the Clear button to clear the trace buffer.
U430-2
MSP430 IAR Embedded Workbench™ IDEUser Guide

Using breakpointsThis chapter describes the breakpoint system and different ways to define breakpoints.
The breakpoint systemThe C-SPY breakpoint system lets you set various kinds of breakpoints in the application you are debugging, allowing you to stop at locations of particular interest. You can set a breakpoint at a code location to investigate whether your program logic is correct. You can also set a data breakpoint, to investigate how and when the data changes. However, the latter requires that data breakpoints are supported by the target system.
For a more advanced simulation, you can stop under certain conditions, which you specify. It is also possible to let the breakpoint trigger a side effect, for instance executing a C-SPY macro function, without stopping the execution. The macro function can be defined to perform a wide variety of actions, for instance, simulating hardware behavior.
You can set breakpoints while you edit your code even if no debug session is active. The breakpoints will then be validated when the debug session starts. Breakpoints are preserved between debug sessions. C-SPY provides two interfaces for defining breakpoints, either interactively in a dialog box or by using system macros.
All these possibilities provide you with a flexible tool for investigating the status of your application.
For reference information about code and data breakpoints, see Breakpoints dialog box, page 237.
In addition to the breakpoint categories listed above, and depending on which debugger driver you are using, additional breakpoint categories might be available. For instance, if you are using the simulator driver you can also set immediate breakpoints. For details of any additional breakpoint categories, see the driver-specific parts five to seven.
Defining breakpointsThere are different ways of setting breakpoints: using the Toggle Breakpoint command, using the Memory window, using the Breakpoints dialog box, or using predefined system macros. The different methods allow different levels of complexity and automation.
U430-2
Part 4. Debugging 123

124
Defining breakpoints
Toggling a code breakpoint is an unsophisticated but quick method for setting breakpoints.
The advantage of using the dialog box is that it provides you with a graphical interface where you can interactively fine tune the characteristics of the breakpoints. You can set the options and quickly test whether the breakpoint works according to your intentions.
Macros, on the other hand, are useful when you already have specified your breakpoints so that they fully meet your requirements. You can define your breakpoints in a macro file by using built-in system macros and execute the file at C-SPY startup. The breakpoints will then be automatically set each time you start C-SPY. Another advantage is that the debug session will be documented, and that several engineers involved in the development project can share the macro files.
TOGGLING A SIMPLE CODE BREAKPOINT
The easiest way to toggle a breakpoint is to place the cursor on the C source statement, or assembler instruction, where you want the breakpoint and click the Toggle Breakpoint button on the Debug toolbar. Alternatively, you can toggle a breakpoint using the command Edit>Toggle Breakpoint. The breakpoint is marked in the C-SPY editor window with a highlight color:
Figure 55: Breakpoint on a function call
SETTING A DATA BREAKPOINT IN THE MEMORY WINDOW
For information about how to set data breakpoints using the Memory window, see Setting a data breakpoint in the Memory window, page 130.
U430-2
MSP430 IAR Embedded Workbench™ IDEUser Guide

Using breakpoints
DEFINING BREAKPOINTS USING THE DIALOG BOX
The Edit>Breakpoints command displays the following dialog box which shows all currently defined breakpoints. Use it to edit existing breakpoints or to define new breakpoints.
Figure 56: Breakpoints dialog box
To define a new breakpoint, choose the type of breakpoint you want to define by clicking the Code, Data, or Immediate tab. Specify the breakpoint settings according to your needs and click Apply. The breakpoint will appear in the list of breakpoints at the bottom of the dialog box.
For detailed information about the breakpoint settings, see Breakpoints dialog box, page 237.
Tracing incorrect function arguments
If a function with a pointer argument is sometimes incorrectly called with a NULL argument, it is useful to put a breakpoint on the first line of the function with a condition that is true only when the parameter is 0. The breakpoint will then not be triggered until the problematic situation actually occurs.
U430-2
Part 4. Debugging 125

126
Defining breakpoints
Performing a side effect without stopping execution
You can perform a side effect by using the Action text box. When the breakpoint is triggered and execution of your application has stopped, the action is executed.
However, to perform a side effect without stopping execution, you can instead set a condition which returns 0 (false). During execution, the condition will be evaluated and since it is not true the execution will continue.
Consider this example:
The following C-SPY macro function performs a simple action.
__var my_counter;
count(){ my_counter += 1; return 0;}
If you use this function as a condition for the breakpoint the action will be performed at the time when the breakpoint is triggered. In the Expression text box under Conditions, type count(). The execution will then be resumed, thus execution will not stop.
Periodically monitoring data
If you are using a device that does not support the break-on-data capability, in that case you can associate with a code breakpoint an expression that C-SPY evaluates when the breakpoint is triggered. That is, associate a condition to a code breakpoint. If the expression is FALSE, program execution resumes. If the expression is TRUE, C-SPY halts the program execution and displays the machine state. The breakpoint expression can be arbitrarily complex.
DEFINING BREAKPOINTS USING SYSTEM MACROS
You can define breakpoints not only by using the Breakpoints dialog box but also by using built-in C-SPY system macros. When you use macros for defining breakpoints, the breakpoint characteristics are specified as function parameters.
If you use system macros for setting breakpoints it is still possible to view and modify them in the Breakpoints dialog box. In contrast to using the dialog box for defining breakpoints, all breakpoints that are defined using system macros will be removed when you exit the debug session.
This is a list of all available breakpoint macros:
__setCodeBreak__setDataBreak
U430-2
MSP430 IAR Embedded Workbench™ IDEUser Guide

Using breakpoints
__setSimBreak__clearBreak
For details of each breakpoint macro, see the chapter C-SPY macros reference.
Defining breakpoints at C-SPY startup using a setup macro file
You can use a setup macro file to define breakpoints at C-SPY startup. Follow the procedure described in Registering and executing using setup macros and setup files, page 139.
U430-2
Part 4. Debugging 127

128
Defining breakpoints
U430-2
MSP430 IAR Embedded Workbench™ IDEUser Guide

Monitoring memory and registersThis chapter describes how to use the features available in the IAR C-SPY™ Debugger for examining memory and registers:
� The Memory window� The Register window� Predefined and user-defined register groups� The Stack window.
Using the Memory windowThe Memory window—available from the View menu—gives an up-to-date display of a specified area of memory and allows you to edit it. You can open several instances of this window, which is very convenient if you want to monitor different memory or register areas.
Figure 57: Memory window
The window consists of three columns. The left-most part displays the addresses currently being viewed. The middle part of the window displays the memory contents in the format you have chosen. Finally, the right most part displays the memory content in ASCII format. You can edit the contents of the Memory window, both in the hexadecimal part and the ASCII part of the window.
Go to memory address
Zone display
U430-2
Part 4. Debugging 129

130
Using the Memory window
You can easily view the memory contents for a specific variable by dragging the variable to the Memory window. The memory area where the variable is located will appear.
Memory window operations
At the top of the window there are commands for navigation and configuration. These commands are also available on the context menu that appears when you right-click in the Memory window. In addition, commands for editing, opening the Fill dialog box, and setting data breakpoints are available.
For reference information about each command, see Memory window, page 266.
Memory Fill
The Fill dialog box allows you to fill a specified area of memory with a value.
Figure 58: Memory Fill dialog box
Examples when this can be useful:
� For the MSP430 microcontroller it is possible to fill unused memory with the operation code for an exception/trap instruction. This can be useful for tracking any wild jumps.
� In the MSP430 microcontroller, unused memory is filled with 0x00. You can simulate this using the Fill dialog box.
For reference information about the dialog box, see Fill dialog box, page 267.
Setting a data breakpoint in the Memory window
It is possible to set data breakpoints directly on a memory location in the Memory window. Right-click in the window and choose Set Data Breakpoint from the context menu that appears. The breakpoint is not highlighted; you can see, edit, and remove it by using the Breakpoints dialog box, which is available from the Edit menu.
The breakpoints you set in this window will be triggered for both read and write access.
U430-2
MSP430 IAR Embedded Workbench™ IDEUser Guide

Monitoring memory and registers
Working with registersThe Register window—available from the View menu—gives an up-to-date display of the contents of the processor registers, and allows you to edit them.
Figure 59: Register window
Every time C-SPY stops, a value that has changed since the last stop is highlighted. To edit the contents of a register, click it, and modify the value. Some registers are expandable, which means that the register contains interesting bits or sub-groups of bits.
You can change the display format by changing the Base setting on the Register Filter page—available by choosing Tools>Options.
REGISTER GROUPS
Due to the large amount of registers—memory-mapped peripheral unit registers and CPU registers—it is inconvenient to list all registers concurrently in the Register window. Instead you can divide registers into register groups. By default there is only one register group in the MSP430 debugger: CPU Registers.
In addition to the CPU Registers there are additional register groups predefined in the device description files—available in the 430/config directory—that make all SFR registers available in the register window. The device description file contains a section that defines the special function registers and their groups.
You can select which register group to display in the Register window using the drop-down list. You can conveniently keep track of different register groups simultaneously, since you can open several instances of the Register window.
U430-2
Part 4. Debugging 131

132
Working with registers
Enabling predefined register groups
To use any of the predefined register groups, select a device description file that suits your target, see Selecting a device description file, page 110.
The available register groups will be listed on the Register Filter page available if you choose the Tools>Options command when C-SPY is running.
Defining application-specific groups
In addition to the predefined register groups, you can design your own register groups that better suit the use of registers in your application.
To define new register groups, choose Tools>Options and click the Register Filter tab. This page is only available when the IAR C-SPY Debugger is running.
Figure 60: Register Filter page
For reference information about this dialog box, see Register Filter page, page 254.
U430-2
MSP430 IAR Embedded Workbench™ IDEUser Guide

Monitoring memory and registers
Using the Stack windowThe Stack window—available from the View menu—provides an easy access to the memory area where the MSP430 microcontroller stack is located. The window conveniently illustrates the stack usage.
Having a dedicated Stack window can be useful in many contexts, for instance for investigating the stack usage when assembler modules are called from C modules and vice versa, whether correct elements are located on the stack, and whether the stack is restored properly.
Note: You should not treat the result displayed in the Stack window as an absolute value. The generated information should only be considered as an indication of the real amount of required stack depth.
MEASURING THE STACK DEPTH
In the Stack window, click Settings to open the Stack Settings dialog box.
1 aSelect the option Enable usage indicator and type a start value for the stack. Alternatively, click Current; the current stack pointer value will then be used.
2 Click OK.
During application execution the green arrow continuously indicates the top of the stack. The yellow arrow indicates the stack usage; 0x6 bytes in this case.
Figure 61: Measuring the stack
U430-2
Part 4. Debugging 133

134
Using the Stack window
U430-2
MSP430 IAR Embedded Workbench™ IDEUser Guide

Using C-SPY macrosThe IAR C-SPY™ Debugger includes a comprehensive macro system which allows you to automate the debugging process and to simulate peripheral devices. Macros can be used in conjunction with complex breakpoints and interrupt simulation to perform a wide variety of tasks.
This chapter describes the macro system, its features, for what purpose these features can be used, and how to use them.
The macro systemC-SPY macros can be used solely or in conjunction with complex breakpoints and interrupt simulation to perform a wide variety of tasks. Some examples where macros can be useful:
� Automating the debug session, for instance with trace printouts, printing values of variables, and setting breakpoints.
� Hardware configuring, such as initializing hardware registers.� Developing small debug utility functions, for instance calculating the stack depth,
see the provided example stack.mac located in the directory \430\src\.� Simulating peripheral devices, see the chapter Simulating interrupts. This only
applies if you are using the simulator driver.
The macro system has several features:
� The similarity between the macro language and the C language, which lets you write your own macro functions.
� Predefined system macros which perform useful tasks such as opening and closing files, setting breakpoints and defining simulated interrupts.
� Reserved setup macro functions which can be used for defining at which stage the macro function should be executed. You define the function yourself, in a setup macro file.
� The option of collecting your macro functions in one or several macro files.� A dialog box where you can view, register, and edit your macro functions and files.
Alternatively, you can register and execute your macro files and functions using either the setup functionality or system macros.
U430-2
Part 4. Debugging 135
136
The macro system
Many C-SPY tasks can be performed either by using a dialog box or by using macro functions. The advantage of using a dialog box is that it provides you with a graphical interface where you can interactively fine-tune the characteristics of the task you want to perform, for instance setting a breakpoint. You can add parameters and quickly test whether the breakpoint works according to your intentions.
Macros, on the other hand, are useful when you already have specified your breakpoints so that they fully meet your requirements. You can set up your simulator environment automatically by writing a macro file and executing it, for instance when you start C-SPY. Another advantage is that the debug session will be documented, and if there are several engineers involved in the development project you can share the macro files within the group.
THE MACRO LANGUAGE
The syntax of the macro language is very similar to the C language. There are macro statements, which are similar to C statements. You can define macro functions, with or without parameters and return values. You can use built-in system macros, similar to C library functions. Finally, you can define global and local macro variables. For a detailed description of the macro language components, see The macro language, page 329.
Example
Consider this example of a macro function which illustrates the different components of the macro language:
CheckLatest(value){ oldvalue; if (oldvalue != value) { __message "Message: Changed from ", oldvalue, " to ", value; oldvalue = value; }}
Note: Reserved macro words begin with double underscores to prevent name conflicts.
THE MACRO FILE
You collect your macro variables and functions in one or several macro files. To define a macro variable or macro function, first create a text file containing the definition. You can use any suitable text editor, such as the editor supplied with the IAR Embedded Workbench. Save the file with a suitable name using the filename extension mac.
U430-2
MSP430 IAR Embedded Workbench™ IDEUser Guide
Using C-SPY macros
Setup macro file
It is possible to load a macro file at C-SPY startup; such a file is called a setup macro file. This is especially convenient if you want to make C-SPY perform actions before you load your application software, for instance to initialize some CPU registers or memory mapped peripheral units. Other reasons could be if you want to automate the initialization of C-SPY, or if you want to register multiple setup macro files. An example of a C-SPY setup macro file SetupSimple.mac can be found in the 430\tutor directory.
For information about how to load a setup macro file, see Registering and executing using setup macros and setup files, page 139.
SETUP MACRO FUNCTIONS
The setup macro functions are reserved macro function names that will be called by C-SPY at specific stages during execution. The stages to choose between are:
� After communication with the target system has been established but before downloading the application software
� Once after your application software has been downloaded� Each time the reset command is issued� Once when the debug session ends.
To define a macro function to be called at a specific stage, you should define and register a macro function with the name of a setup macro function. For instance, if you want to clear a specific memory area before you load your application software, the macro setup function execUserPreload() is suitable. This function is also suitable if you want to initialize some CPU registers or memory mapped peripheral units before you load your application software. For detailed information about each setup macro function, see Setup macro functions summary, page 332.
As with any macro function, you collect your setup macro functions in a macro file. Since many of the setup macro functions execute before main is reached, you should define these functions in a setup macro file.
Using C-SPY macrosIf you decide to use C-SPY macros, you first need to create a macro file in which you define your macro functions. C-SPY needs to know that you intend to use your defined macro functions, and thus you must register (load) your macro file. During the debug session you might need to list all available macro functions as well as execute them.
U430-2
Part 4. Debugging 137

138
Using C-SPY macros
To list the registered macro functions, you can use the Macro Configuration dialog box. There are various ways to both register and execute macro functions:
� You can register a macro interactively by using the Macro Configuration dialog box.
� You can register and execute macro functions at the C-SPY startup sequence by defining setup macro functions in a setup macro file.
� A file containing macro function definitions can be registered using the system macro __registerMacroFile. This means that you can dynamically select which macro files to register, depending on the runtime conditions. Using the system macro also lets you register multiple files at the same moment. For details about the system macro, see __registerMacroFile, page 340.
� The Quick Watch dialog box lets you evaluate expressions, and can thus be used for executing macro functions.
� A macro can be connected to a breakpoint; when the breakpoint is triggered the macro will be executed.
USING THE MACRO CONFIGURATION DIALOG BOX
The Macro Configuration dialog box—available by choosing Debug>Macros—lets you list, register, and edit your macro files and functions. The dialog offers you an interactive interface for registering your macro functions which is convenient when you develop macro functions and continuously want to load and test them.
U430-2
MSP430 IAR Embedded Workbench™ IDEUser Guide

Using C-SPY macros
Macro functions that have been registered using the dialog box will be deactivated when you exit the debug session, and will not automatically be registered at the next debug session.
Figure 62: Macro Configuration dialog box
For reference information about this dialog box, see Macro Configuration dialog box, page 283.
REGISTERING AND EXECUTING USING SETUP MACROS AND SETUP FILES
It can be convenient to register a macro file during the C-SPY startup sequence, especially if you have several ready-made macro functions. C-SPY can then execute the macros before main is reached. You achieve this by specifying a macro file which you load before starting the debugger. Your macro functions will be automatically registered each time you start the C-SPY Debugger.
If you define the macro functions by using the setup macro function names you can define exactly at which stage you want the macro function to be executed.
U430-2
Part 4. Debugging 139

140
Using C-SPY macros
Follow these steps:
1 Create a new text file where you can define your macro function.
For example:
execUserSetup(){... __orderInterrupt("USART0RX_VECTOR", 4000, 2000, 0, 0, 100);}
This macro function generates a repeating interrupt that is first activated after 4000 cycles and then repeated approximately every 2000th cycle. Since the macro is defined with the execUserSetup() function name, it will be executed directly after your application has been downloaded.
2 Save the file using the filename extension mac.
3 Before you start C-SPY, choose Project>Options and click the Setup tab in the C-SPY category. Select the check box Use Setup file and choose the macro file you just created.
The interrupt macro will now be loaded during the C-SPY startup sequence.
EXECUTING MACROS USING QUICK WATCH
The Quick Watch dialog box—available from the Debug menu—lets you watch the value of any variables or expressions and evaluate them. For macros, the Quick Watch dialog box is especially useful since it is a method which lets you dynamically choose when to execute a macro function.
Consider the following simple macro function which checks the status of the watchdog timer interrupt enable bit:
WDTstatus(){ if (#IE1 & 0x01 != 0) // Checks the status of WDTIE return "Timer enabled"; // C-SPY macro string used else return "Timer disabled"; // C-SPY macro string used}
1 Save the macro function using the filename extension mac. Keep the file open.
2 To register the macro file, choose Debug>Macros. The Macro Configuration dialog box appears. Locate the file, click Add and then Register. The macro function appears in the list of registered macros.
U430-2
MSP430 IAR Embedded Workbench™ IDEUser Guide

Using C-SPY macros
3 In the macro file editor window, select the macro function name WDTstatus(). Right-click, and choose Quick Watch from the context menu that appears.
Figure 63: Quick Watch dialog box
The macro will automatically appear in the Quick Watch dialog box.
Click Close to close the Quick Watch dialog box.
EXECUTING A MACRO BY CONNECTING IT TO A BREAKPOINT
You can connect a macro to a breakpoint. The macro will then be executed at the time when the breakpoint is triggered. The advantage is that you can stop the execution at locations of particular interest and perform specific actions there.
For instance, you can easily produce log reports containing information such as how the values of variables, symbols, or registers changes. To do this you could set a breakpoint on a suspicious location and connect a log macro to the breakpoint. After the execution you can study how the values of the registers have changed.
For an example of how to create a log macro and connect it to a breakpoint, follow these steps:
1 Assume this skeleton of a C function in your application source code:
int fact(int x){ ...}
U430-2
Part 4. Debugging 141

142
Using C-SPY macros
2 Create a simple log macro function like this example:
logfact(){ __message "fact(" ,x, ")";}
The __message statement will log messages to the Log window.
Save the macro function in a macro file, with the filename extension mac.
3 Before you can execute the macro it must be registered. Open the Macro Configuration dialog box—available by choosing Debug>Macros—and add your macro file to the list Selected Macro Files. Click Register and your macro function will appear in the list Registered Macros. Close the dialog box.
4 Next, you should toggle a code breakpoint—using the Toggle Breakpoint button—on the first statement within the function fact() in your application source code. Open the Breakpoint dialog box—available by choosing Edit>Breakpoints—your breakpoint will appear in the list of breakpoints at the bottom of the dialog box. Select the breakpoint.
5 Connect the log macro function to the breakpoint by entering the name of the macro function, logfact(), in the Action field and clicking Apply. Close the dialog box.
6 Now you can execute your application source code. When the breakpoint has been triggered, the macro function will be executed. You can see the result in the Log window.
You can easily enhance the log macro function by, for instance, using the __fmessage statement instead, which will print the log information to a file.
For a complete example where a serial port input buffer is simulated using the method of connecting a macro to a breakpoint, see Simulating an interrupt, page 57.
U430-2
MSP430 IAR Embedded Workbench™ IDEUser Guide

Analyzing your applicationIt is important to locate a program’s bottle-necks and to verify that all parts of an application have been tested. This chapter presents facilities available in the IAR C-SPY™ Debugger for analyzing your program so that you can efficiently spend time and effort on optimizations.
Code coverage and profiling are only supported by the IAR C-SPY Simulator.
Function-level profilingThe profiler will help you find the functions where most time is spent during execution, for a given stimulus. Those functions are the parts you should focus on when spending time and effort on optimizing your code. A simple method of optimizing a function is to compile it using speed optimization. Alternatively, you can move the function into memory which uses the most efficient addressing mode. For detailed information about efficient memory usage, see the MSP430 IAR C/EC++ Compiler Reference Guide.
The Profiling window displays profiling information, that is, timing information for the functions in a program. Profiling must be turned on explicitly using a button on the window’s toolbar, and will stay active until it is turned off.
The profiler measures the time between the entry and return of a function. This means that time consumed in a function is not added until the function returns or another function is called. You will only notice this if you are stepping into a function.
USING THE PROFILER
Before using the Profiling window, you must build your application using the following options:
Category Setting
ICC430 OutputGenerate debug information
XLINK FormatDebug information orDebug information with terminal I/O
Table 15: Project options for enabling profiling
U430-2
Part 4. Debugging 143

144
Function-level profiling
After you have built your application and started C-SPY, choose View>Profiling to open the window, and click Activate to turn on the profiler. This Profiling window displayed.
Figure 64: Profiling window
Click the New measurement button, alternatively use the context menu available by right-clicking in the window, when you want to start a new sampling.
Viewing the figures
Clicking on a column header sorts the complete list according to that column.
An item in the list may be dimmed. This indicates that the function has been called by a function which does not contain source code (compiled without debug information). When a function is called by functions that do not have their source code available, such as library functions, no measurement in time is made.
There is always an item in the list called Outside main. This is time that cannot be placed in any of the functions in the list. That is, code compiled without debug information, for instance, all startup and exit code, and C/EC++ library code.
U430-2
MSP430 IAR Embedded Workbench™ IDEUser Guide

Analyzing your application
Clicking the Graph button toggles the percentage columns to be displayed either as numbers or as bar charts:
Figure 65: Graphs in Profiling window
Clicking the Show details button displays more detailed information about the function selected in the list. A window is opened showing information about callers and callees for the selected function:
Figure 66: Function details window
Producing reports
To produce a report, right-click in the window and choose the Save As command on the context menu. The contents of the Profiling window will be saved to a file.
U430-2
Part 4. Debugging 145

146
Code coverage
Code coverageThe code coverage functionality helps you verify whether all parts of your code have been executed. This is useful when you design your test procedure to make sure that all parts of the code have been executed. It also helps you identify parts of your code that are not reachable.
USING CODE COVERAGE
The Code Coverage window—available from the View menu—reports the status of the current code coverage analysis, that is, what parts of the code have been executed at least once since the start of the analysis. The compiler generates detailed stepping information in the form of step points at each statement, as well as at each function call. The report includes information about all modules and functions. It reports the amount of all step points, in percentage, that have been executed and lists all step points that have not been executed up to the point where the program has been stopped. The coverage will continue until turned off.
Before using the Code Coverage window you must build your application using the following options:
Category Setting
ICC430 OutputGenerate debug information
XLINK FormatDebug information orDebug information with terminal I/O
Table 16: Project options for enabling code coverage
U430-2
MSP430 IAR Embedded Workbench™ IDEUser Guide

Analyzing your application
After you have built your application and started C-SPY, choose View>Code Coverage to open the Code Coverage window and click Activate to switch on the code coverage analyzer. The following window will be displayed:
Figure 67: Code Coverage window
Viewing the figures
The code coverage information is displayed in a tree structure, showing the program, module, function and step point levels. The plus sign and minus sign icons allow you to expand and collapse the structure.
The following icons are used to give you an overview of the current status on all levels:
� A red diamond signifies that 0% of the code has been executed� A green diamond signifies that 100% of the code has been executed� A red and green diamond signifies that some of the code has been executed� A yellow diamond signifies a step point that has not been executed.
The percentage displayed at the end of every program, module and function line shows the amount of code that has been covered so far, that is, the number of executed step points divided with the total number of step points.
For step point lines, the information displayed is the column number range and the row number of the step point in the source window, followed by the address of the step point.
<column start>-<column end>:row.
A step point is considered to be executed when one of its instructions has been executed. When a step point has been executed, it is removed from the window.
U430-2
Part 4. Debugging 147

148
Code coverage
Double-clicking a step point or a function in the Code Coverage window displays that step point or function as the current position in the source window, which becomes the active window. Double-clicking a module on the program level expands or collapses the tree structure.
An asterisk (*) in the title bar indicates that C-SPY has continued to execute, and that the Code Coverage window needs to be refreshed because the displayed information is no longer up to date. To update the information, use the Refresh command.
What parts of the code are displayed?
The window displays only statements that have been compiled with debug information. Thus, startup code, exit code and library code will not be displayed in the window. Furthermore, coverage information for statements in inlined functions will not be displayed. Only the statement containing the inlined function call will be marked as executed.
Producing reports
To produce a report, right-click in the window and choose the Save As command on the context menu. The contents of the Code Coverage window will be saved to a file.
U430-2
MSP430 IAR Embedded Workbench™ IDEUser Guide
Part 5. IAR C-SPY SimulatorThis part of the MSP430 IAR Embedded Workbench™ IDE User Guide contains the following chapters:
� Simulator introduction
� Simulator functionality
� Simulating interrupts.
U430-2
149

150
U430-2

Simulator introductionThis chapter gives a brief introduction to the C-SPY Simulator.
It is assumed that you already have some working knowledge of the IAR Embedded Workbench and the IAR C-SPY Debugger. For a quick introduction, see Part 2. Tutorials.
The IAR C-SPY SimulatorThe IAR C-SPY Simulator simulates the functions of the target processor entirely in software, which means the program logic can be debugged long before any hardware is available. Since no hardware is required, it is also the most cost-effective solution for many applications.
FEATURES
Except for the general features, the IAR C-SPY Simulator also provides:
� Instruction accurate simulated execution� Memory configuration and validation� Interrupt simulation� Immediate breakpoint with resume functionality� Peripheral simulation (using the C-SPY macro system).
SELECTING THE SIMULATOR DRIVER
Before starting the IAR C-SPY Debugger you must select the simulator driver. In the IAR Embedded Workbench, choose Project>Options and click the Setup tab in the C-SPY category. Choose the simulator driver by selecting Simulator in the Driver drop-down list.
Note: You can only choose a driver you have installed on your computer.
U430-2
Part 5. IAR C-SPY Simulator 151

152
The IAR C-SPY Simulator
U430-2
MSP430 IAR Embedded Workbench™ IDEUser Guide
Simulator functionalityThis chapter describes the features specific to the IAR C-SPY Simulator.
You will get information about driver-specific characteristics, such as the immediate breakpoint and memory configuration. Finally, you will get reference information about the Simulator menu.
Driver-specific characteristicsIn addition to the features available in the C-SPY Debugger, the C-SPY Simulator provides some additional characteristics.
IMMEDIATE BREAKPOINTS
In addition to the generic breakpoints, the C-SPY Simulator lets you set immediate breakpoints, which will temporarily halt, but not stop, the instruction execution. It allows a C-SPY macro function to be called when the processor is about to read data from a location or immediately after it has written data. Instruction execution will resume after the action.
This type of breakpoint is useful for simulating memory-mapped devices of various kinds (for instance serial ports and timers). When the processor reads at a memory-mapped location, a C-SPY macro function can intervene and supply appropriate data. Conversely, when the processor writes to a memory-mapped location, a C-SPY macro function can act upon the value that was written.
You can set this type of breakpoint on the Immediate page of the Breakpoints dialog box—available by choosing Edit>Breakpoints—and enter the breakpoint characteristics. For details of the breakpoint settings, see Breakpoints dialog box, page 237.
Alternatively, you can set an immediate breakpoint by using the system macro
__setSimBreak(location, access, action)
U430-2
Part 5. IAR C-SPY Simulator 153

154
Memory configuration
Parameters
Return value
See Simulating an interrupt, page 57, for an example where an immediate breakpoint is used.
Memory configurationThis section describes the facilities for simulating the memory configuration of the target hardware.
MEMORY MAP
C-SPY allows the simulation of different memory access types by means of a memory map.
If a memory access occurs that violates the access type specified for a specific memory area, C-SPY will regard this as an illegal access. Execution will be halted and an error message will be displayed. The purpose of this feature is to help you to identify any memory access violations.
location A string with a location description. This can be either:A source location on the form {filename}.line.col (for example {D:\\src\\prog.c}.12.9), although this is not very useful for simulation breakpointsAn absolute location on the form zone:hexaddress or simply hexaddress (for example Memory:0xE01E)An expression whose value designates a location (for example main).
access The memory access type: "R" for read or "W" for write
action An expression, typically a call to a macro, which is evaluated when the breakpoint is detected
Result Value
Successful An unsigned integer uniquely identifying the breakpoint. This value must be used to clear the breakpoint.
Unsuccessful 0
Table 17: __setSimBreak return values
U430-2
MSP430 IAR Embedded Workbench™ IDEUser Guide

Simulator functionality
A memory map consists of specified memory areas where each memory area has an access type attached to it. The areas can either be the zones predefined in the device description file, or you can define your own memory areas. The access type can be either Read Only or Read & Write. If the simulator tries to access memory outside of the mapped areas or to write to a read-only memory, this will cause the simulation to stop.
The mapping system will strive to limit the number of ranges for efficiency reasons. This means that it will concatenate ranges whenever possible. If you define two ranges 0x0000–0x1FFF and 0x2000–0x2FFF of the same access type and in the same address space, the system will treat them as one range 0x0–0x2FFF.
It is not possible to map two different access types to the same memory area.
Choose Simulator>Memory Map to open the Memory Map dialog box.
Figure 68: Memory Map dialog box
To define a new range, you can either:
� Load settings from a device description file that you specified before starting C-SPY
� Manually enter the characteristics of the memory you want to monitor.
If you manually have defined your own memory areas and then load a device description file, your own defined areas will be cleared before the definitions in the device description file are loaded.
To edit a defined memory area, select it in the list and click Modify to display or edit its properties, or Remove to delete it.
The settings you specify in the Memory Map dialog box are saved between debug sessions.
U430-2
Part 5. IAR C-SPY Simulator 155

156
Simulator menu
Memory Map configurations
For each memory area you can define the following properties:
Simulator menuUsing the simulator driver creates a new menu in the menu bar, the Simulator menu.
Figure 69: Simulator menu
For details about using the Interrupts dialog box, see the chapter Simulating interrupts, page 157.
Address space Select the appropriate address space from the drop-down list. Normally there is one address space available for microcontrollers based on a von Neumann architecture, and two address spaces available for microcontrollers based on a Harvard architecture.
Start address The start address for the address range, in hexadecimal notation.
End address The end address for the address range, in hexadecimal notation.
Access type Select the access type from the drop-down list. Available types are Read Only and Read & Write.
Enable memory mapping Enables or disables memory mapping. When memory mapping is disabled, the definition remains but no memory map checks will be performed.
Menu item Description
Interrupts Displays a dialog box to allow you to configure C-SPY interrupt simulation
Memory map Displays a dialog box to allow you to configure different memory types by specifying a memory map with different access types.
Table 18: Description of Simulator menu commands
U430-2
MSP430 IAR Embedded Workbench™ IDEUser Guide

Simulating interruptsBy being able to simulate interrupts, you can debug the program logic long before any hardware is available. This chapter contains detailed information about the C-SPY interrupt simulation system and how to configure the simulated interrupts to make them reflect the interrupts of your target hardware. Finally, reference information about each interrupt system macro is provided.
For information about the interrupt-specific facilities useful when writing interrupt service routines, see MSP430 IAR C/EC++ Compiler Reference Guide.
The C-SPY interrupt simulation systemThe IAR C-SPY Simulator includes an interrupt simulation system that allows you to simulate the execution of interrupts during debugging. It is possible to configure the interrupt simulation system so that it resembles your hardware interrupt system. By using simulated interrupts in conjunction with C-SPY macros and breakpoints, you can compose a complex simulation of, for instance, interrupt-driven peripheral devices. Having simulated interrupts also lets you test the logic of your interrupt service routines.
The interrupt system has the following features:
� Simulated interrupt support for the MSP430 microcontroller� Single-occasion or periodical interrupts based on the cycle counter� Configuration of hold time, probability, and timing variation� Two interfaces for configuring the simulated interrupts—a dialog box and a C-SPY
system macro—that is, one interactive and one automating interface.
U430-2
Part 5. IAR C-SPY Simulator 157

158
The C-SPY interrupt simulation system
INTERRUPT CHARACTERISTICS
The simulated interrupts consist of a set of characteristics which lets you fine-tune each interrupt to make it resemble the real interrupt on your target hardware. You can specify an activation time, a repeat interval, a hold time, and a variance.
Figure 70: Simulated interrupt configuration
The interrupt simulation system uses the cycle counter as a clock to determine when an interrupt should be raised in the simulator. You specify the activation time, which is based on the cycle counter. C-SPY will generate an interrupt when the cycle counter has passed the specified activation time. However, interrupts can only be raised between instructions, which means that a full assembler instruction must have been executed before the interrupt is generated, regardless of how many cycles an instruction takes.
To define the periodicity of the interrupt generation you can specify the repeat interval which defines the amount of cycles after which a new interrupt should be generated. In addition to the repeat interval, the periodicity depends on the two options probability—the probability, in percent, that the interrupt will actually appear in a period—and variance—a time variation range as a percentage of the repeat interval. These options make it possible to randomize the interrupt simulation. You can also specify a hold time which describes how long the interrupt remains pending until removed if it has not been processed. If the hold time is set to zero, the corresponding pending bit will be set until the interrupt is acknowledged or removed.
The interrupt system is activated by default, but if it is not required it can be turned off to speed up the simulation. You can turn the interrupt system on or off as required either in the Interrupts dialog box, or by using a system macro. Defined interrupts will be preserved until you remove them.
ADAPTING THE INTERRUPT SYSTEM FOR MSP430
The MSP430 interrupt simulation has the same behavior as the hardware. This means that the execution of an interrupt is dependent on the status of the global interrupt enable bit. The execution of maskable interrupts is also dependent on the status of the individual interrupt enable bits.
H H H
R±V
Act - Activation timeR - Repeat intervalH - Hold timeV - Variance
Act±V0
U430-2
MSP430 IAR Embedded Workbench™ IDEUser Guide

Simulating interrupts
To be able to perform these actions for various derivatives, the interrupt system must have detailed information about each available interrupt. Except for default settings, this information is provided in the device description files.You can find pre-configured ddf files in the 430/config directory. The default settings will be used if no device description file has been specified.
1 To load a device description file before you start C-SPY, choose Project>Options and click the Setup tab of the C-SPY category.
2 Choose a device description file that suits your target.
Note: In case you do not find a preconfigured device description file that resembles your device, you can define one according to your needs. For details of device description files, see Device description file, page 107.
Specifying interrupt characteristicsThere are two methods of specifying a simulated interrupt: using the Interrupts dialog box or using predefined system macros.
The Interrupts dialog box provides you with a graphical interface where you interactively can fine tune the interrupt simulation parameters. You can add the parameters and quickly test that the interrupt is generated according to your needs.
Macros, on the other hand, are useful when you already have sorted out the details of the simulated interrupt so that it fully meet your requirements. By writing a macro function containing definitions for the simulated interrupts you can automatically execute the functions when C-SPY starts. Another advantage is that your simulated interrupt definitions will be documented if you use macro files, and if you are several engineers involved in the development project you can share the macro files within the group.
U430-2
Part 5. IAR C-SPY Simulator 159

160
Specifying interrupt characteristics
USING THE DIALOG BOX
Choose Simulator>Interrupts to display the Interrupts dialog box:
Figure 71: Interrupts dialog box
1 Enable interrupt simulation by selecting the Enable simulation check box. Choose the interrupt you want to simulate from the Interrupt drop-down list which specifies all available interrupts.
2 Define the interrupt. Activation time, Repeat interval, and Hold time are all specified in clock cycles. Probability is specified in percent and Variance is specified as a percentage of the repeat interval.
3 Click Install. The interrupt is now added to the list of installed interrupts.
To edit an existing interrupt, select it in the list of installed interrupts, edit its characteristics and click Modify. You can also click Remove to delete it, or Remove All to delete all defined interrupts. Note that deleting an interrupt does not remove any pending interrupts from the system.
U430-2
MSP430 IAR Embedded Workbench™ IDEUser Guide

Simulating interrupts
Interrupts options
The option Enable simulation enables or disables interrupt simulation. If the interrupt simulation is disabled, the definitions remain but no interrupts will be generated. You can also enable and disable installed interrupts individually by using the check box to the left of the interrupt name in the list of installed interrupts.
For each interrupt you can set the following options:
The interrupt specification text in the list of installed interrupts is prefixed with either [S] for a single-shot interrupt or [R] for a repeated interrupt. If the interrupt is activated but pending an additional [P] will be inserted.
USING MACROS
The C-SPY Simulator provides a set of predefined system macros for the interrupt simulation system. The advantage of using the system macros for specifying the simulated interrupts is that it lets you automate the procedure.
Interrupt A drop-down list containing all available interrupts. Your selection will automatically update the Description box.The list is populated with entries from the device description file that you have selected.
Description Contains the description of the selected interrupt, if available. The description is retrieved from the selected device description file.For interrupts specified using the system macro __orderInterrupt the Description field will be empty.
Activation time The value of the cycle counter, after which the specified type of interrupt will be generated.
Repeat interval The periodicity of the interrupt in cycles.
Hold time Describes how long, in cycles, the interrupt remains pending until removed if it has not been processed.
Probability The probability, in percent, that the interrupt will actually occur within the specified period.
Variance A timing variation range, as a percentage of the repeat interval, in which the interrupt may occur for a period. For example, if the repeat interval is 100 and the variance 5%, the interrupt may occur anywhere between T=95 and T=105, to simulate a variation in the timing.
U430-2
Part 5. IAR C-SPY Simulator 161

162
Simulating a simple interrupt
These are the available system macros related to interrupts:
__enableInterrupts()
__disableInterrupts()
__orderInterrupt()
__cancelInterrupt()
__cancelAllInterrupts()
The parameters of each macro corresponds to the equivalent entries of the Interrupts dialog box.
For detailed information of each macro, see Description of interrupt system macros, page 164.
Defining simulated interrupts at C-SPY startup using a setup file
If you want to use a setup file to define simulated interrupts at C-SPY startup, follow the procedure described in Registering and executing using setup macros and setup files, page 139.
Simulating a simple interruptIn this example you will simulate a timer interrupt. However, the procedure can also be used for other types of interrupts.
This simple application contains an interrupt service routine for the BasicTimer, which increments a tick variable. The main function sets the necessary status registers. The application exits when 100 interrupts have been generated.
#include <msp430x41x.h>int ticks = 0;void main (void){ //Timer setup code WDTCTL = WDTPW + WDTHOLD; //Stop WDT IE2 |= BTIE; //Enable BT interrupt BTCTL = BTSSEL+BTIP2+BTIP1+BTIP0; _EINT(); //Enable interrupts while (ticks < 100) printf("Done\n");}
U430-2
MSP430 IAR Embedded Workbench™ IDEUser Guide

Simulating interrupts
// Timer interrupt service routine#pragma vector = BASICTIMER_VECTOR__interrupt void basic_timer(void){ ticks += 1;}
To simulate and debug an interrupt, perform the following steps:
1 Add your interrupt service routine to your application source code and add the file to your project.
2 C-SPY needs information about the interrupt to be able to simulate it. This information is provided in the device description files. The appropriate file will automatically be used when you select a device from the Device drop-down menu; choose Project>Options, click the Setup tab in the C-SPY category, and select appropriate device.
3 Build your project and start the simulator.
4 Choose Simulator>Interrupts to open the Interrupts dialog box. Make sure interrupt simulation is enabled. For the BasicTimer example, add the following settings:
Click OK.
5 Execute your program. If you have enabled the interrupt properly in your application source code, C-SPY will:
� Generate an interrupt when the cycle counter has passed 4000� Continuously repeat the interrupt after approximately 2000 cycles.
Option Settings
Interrupt BASICTIMER_VECTOR
Activation time 4000
Repeat interval 2000
Hold time 0
Probability 100
Variance 0
Table 19: Timer interrupt settings
U430-2
Part 5. IAR C-SPY Simulator 163

164
Description of interrupt system macros
Description of interrupt system macrosThis section gives reference information about each of the C-SPY system macros for interrupts.
__cancelAllInterrupts __cancelAllInterrupts()
Return value
int 0
Description
Cancels all ordered interrupts.
__cancelInterrupt __cancelInterrupt(interrupt_id)
Parameter
Return value
Description
Cancels the specified interrupt.
__disableInterrupts __disableInterrupts()
Return value
interrupt_id The value returned by the corresponding __orderInterrupt macro call (unsigned long)
Result Value
Successful int 0
Unsuccessful Non-zero error number
Table 20: __cancelInterrupt return values
Result Value
Successful int 0
Unsuccessful Non-zero error number
Table 21: __disableInterrupts return values
U430-2
MSP430 IAR Embedded Workbench™ IDEUser Guide

Simulating interrupts
Description
Disables the generation of interrupts.
__enableInterrupts __enableInterrupts()
Return value
Description
Enables the generation of interrupts.
__orderInterrupt __orderInterrupt(specification, activation_time,
repeat_interval, variance, hold_time, probability)
Parameters
Return value
The macro returns an interrupt identifier (unsigned long).
If the syntax of specification is incorrect, it returns -1.
Description
Generates an interrupt.
Result Value
Successful int 0
Unsuccessful Non-zero error number
Table 22: __enableInterrupts return values
specification The interrupt (string). The specification could either be the full specification used in the device description file (ddf) or only the name. In the latter case the interrupt system will automatically get the description from the device description file.
activation_time The activation time in cycles (integer)
repeat_interval The periodicity in cycles (integer)
variance The timing variation range in percent (integer between 0 and 100)
hold_time The hold time (integer)
probability The probability in percent (integer between 0 and 100)
U430-2
Part 5. IAR C-SPY Simulator 165

166
Description of interrupt system macros
Example
The following example generates a repeating interrupt first activated after 4000 cycles:
__orderInterrupt( "USART0RX_VECTOR", 4000, 2000, 0, 0, 100 );
U430-2
MSP430 IAR Embedded Workbench™ IDEUser Guide

Part 6. IAR C-SPY ROM-monitorThis part of the MSP430 IAR Embedded Workbench™ IDE User Guide contains the following chapters:
� Introduction to the IAR C-SPY ROM-monitor
� C-SPY ROM-monitor functionality
� The C-SPY ROM-monitor options.
U430-2
167

168
U430-2
Introduction to the IAR C-SPY ROM-monitorThis chapter introduces you to the IAR C-SPY ROM-monitor as well as to how it differs from the IAR C-SPY Simulator.
The chapters specific to C-SPY ROM-monitor assumes that you already have some working knowledge of the evaluation board you are using, as well as of the IAR C-SPY Debugger. For a quick introduction, see Part 2. Tutorials.
Please note that additional features may have been added to the software after the MSP430 IAR Embedded Workbench™ IDE User Guide was printed. The readme file cs430r.htm contains the latest information.
The MSP430 C-SPY ROM-monitorThe IAR C-SPY ROM-monitor consists of the IAR C-SPY Debugger, the ROM-monitor driver, and two ROM-monitor programs (firmware). To control the execution of your application from C-SPY, you must program one of the ROM-monitor programs in an EEPROM memory, or other non-volatile memory, on your evaluation board.The IAR C-SPY ROM-monitor provides functionality to do that. Your application may be downloaded into RAM, into EPROM, or partially into RAM and partially into EPROM.
U430-2
Part 6. IAR C-SPY ROM-monitor 169

170
The MSP430 C-SPY ROM-monitor
For the MSP430 C-SPY ROM-monitor, the ROM-monitor program is included in the installation.
Figure 72: Communication overview
The IAR C-SPY Debugger uses an RS-232 cable to communicate with the ROM-monitor program via the 8-bit internal timer/counter to simulate a UART.
You should notice that all the parts of your code that you want to debug must be located in RAM. The only way you can set breakpoints and step in your application code is to download it into RAM.
You must set aside some space on the stack to allow for calls to and returns from the ROM-monitor program. Notice also that some restrictions apply to what registers your application may use. See Register usage, page 179.
THE ROM-MONITOR PROGRAMS
The IAR C-SPY ROM-monitor comes with two preconfigured ROM-monitor programs. They both support the Texas Instruments Starter/Evaluation Kit (SDK/EVK boards) and are capable of communicating at 4800 baud. They are in the files mon430_1.txt and mon430_2.txt and the only difference between them is the content of the interrupt vector table area (0xFFE0–0xFFFF). Both files are in MSP430 text format.
Personal computer
Evaluation board
ROM-
Reserved Userapplication
Non-volatile
RAM
RS-232 cable
monitorapplication
IAR C-SPY Debugger
User
for monitor*
memory
* 100 bytes reserved for the ROM-monitor program
ROM-monitor driver
U430-2
MSP430 IAR Embedded Workbench™ IDEUser Guide

Introduction to the IAR C-SPY ROM-monitor
Since the interrupt vector area is located in EPROM, the IAR C-SPY ROM-monitor provides the option to remap the interrupt vector table to a jump table in RAM. If your application uses interrupt vectors and you want to use interrupt vector jumptable in RAM you should use the mon430_1.txt file.
If you instead want to program your application, partially or entirely, in EPROM and you also want to program the interrupt vectors in EPROM, you should use the mon430_2.txt file.
For further details, see Interrupt vector table, page 174.
DIFFERENCES BETWEEN THE C-SPY ROM-MONITOR AND SIMULATOR
The following table summarizes the key differences between the ROM-monitor and simulator versions of C-SPY:
Getting startedYour first task when you have an application that you want to debug, is to program the file containing the ROM-monitor in the EPROM on your evaluation board (see The ROM-monitor programs, page 170). To be able to do this you must use an appropriate programming adapter, typically supplied with the evaluation board. You can also use a separate EPROM programmer. Once the monitor is loaded you can start the Embedded Workbench and load the demo project.
Feature Simulator ROM-monitor
OP-fetch x x
Data breakpoints x
Code breakpoints x x
Execution in real time x
Simulated interrupts x
Real interrupts x
Cycle counter x
Code coverage x
Profiling x
Table 23: Simulator and ROM-monitor differences
U430-2
Part 6. IAR C-SPY ROM-monitor 171

172
Getting started
U430-2
MSP430 IAR Embedded Workbench™ IDEUser Guide

C-SPY ROM-monitor functionalityThis chapter describes the additional features provided by the C-SPY ROM-monitor. You will also find descriptions of how to configure the memory usage and some common troubleshooting tips. Finally you will get information about the serial communication and how to down-load a stand alone application.
Driver-specific characteristicsIn addition to the features available in the C-SPY Debugger, the C-SPY ROM-monitor provides some additional characteristics.
There are certain restrictions and prerequisites you need to know about, to debug your code successfully.
SINGLE-STEPPING
When single-stepping at assembler level, all interrupts except for the software UART are turned off. The monitor temporarily sets a breakpoint where the instruction ends and starts running the user application. Notice that all instructions that have the PC or SR register as their destination are simulated.
BREAKPOINTS
Breakpoints consist of an instruction written to the address, in application source code, where the execution should be stopped. User instructions, overwritten by breakpoints, are kept and stored by C-SPY. The CALL R4 instruction is used as a breakpoint.
Remember that breakpoints can only be set on code downloaded to RAM.
STOPPING THE USER APPLICATION
C-SPY does not send any characters to the ROM-monitor firmware when the user application is running. When you click Stop, C-SPY sends a stop command to the ROM-monitor which will stop the execution and take over the execution control.
U430-2
Part 6. IAR C-SPY ROM-monitor 173

174
Driver-specific characteristics
RESET
The reset vector is by default programmed to point to the start of the ROM-monitor.
It is possible to program the application program without the ROM-monitor and run it stand-alone by using the C-SPY option Stand-alone application. If this option is used the reset vector will instead point to the start of the application program. See also Downloading a stand-alone application, page 179.
TERMINAL I/O AND PROGRAM EXIT
If the CODE segment of your application is programmed in EPROM and you want to debug it with terminal I/O or you want C-SPY to detect and stop the execution when program exit is reached, you must replace the putchar(), getchar(), and exit() functions in the standard library (or the ones in your application) with the functions supplied in the rom_io.s43 file. Add this file to your project and make sure that the RAMCODE segment is defined in your linker command file. The RAMCODE segment must be located in RAM.
If the CODE segment of your application has been programmed in RAM, however, you can use the putchar(), getchar(), and exit() functions supplied in the standard library. Remove your own functions to make sure that the library functions will be used.
INTERRUPT VECTOR TABLE
There are two ways of handling the interrupt vector table; remapping it to the user RAM area or programming it in EPROM.
The interrupt vector table in the target monitor file mon430_1.txt is mapped to a jump table in RAM located at the end of the ROM-monitor RAM area. The exact location is specified in the file cs430r.htm. If you want to download your application in RAM, you must use the Remap interrupt vectors option to create and load the jump table in RAM. This version of the ROM-monitor creates some extra overhead because it must service interrupts first, before jumping to the user interrupt service routine.
If you instead use the mon430_2.txt ROM-monitor file, the interrupt vectors will be programmed into the interrupt vector area when you program your application into EPROM.
Note: The UART interrupt is used by C-SPY and may not be used by your application. See Register usage, page 179.
Tip! To see how the target monitor handles interrupt vectors:
1 Download an application that installs at least one interrupt vector.
2 Look at the interrupt vector table using the Memory window.
3 Find out where the vector you are interested in points.
U430-2
MSP430 IAR Embedded Workbench™ IDEUser Guide

C-SPY ROM-monitor functionality
4 Use the Go to function in the Disassembly window to go to the addresses that the interrupt vector you are interested in point to. If you use the ROM-monitor file with remapped interrupt vectors, mon430_1.txt, you will find the jump table in RAM with a BR (branch) instruction that points to your interrupt handler. If you instead use the ROM-monitor file with interrupt vectors programmed in EPROM, mon430_2.txt, the jump table should be at the beginning of your interrupt handler.
STACK SPACE
Some space must be left on the stack to allow for calls to and returns from the target monitor.
REGISTERS
Register R4 is used by the target monitor to handle breakpoints. This means that the contents of register R4 must not be modified by the application program. You achieve this by using the ROM-monitor compatible code: Exclude R4 option when compiling the application code.
Memory configurationUnderstanding the memory layout is important to avoid conflicts between the ROM-monitor and your own programs. Notice that only the part of your application that resides in RAM is debuggable. Therefore you may have to modify your hardware so that there is enough RAM.
MEMORY MAP
The parts of the code that you want to debug should be downloaded in RAM memory. Application code is by default placed in the CODE segment.
The ROM-monitor is located in the internal EPROM at address F800h to FFFFh. The size of it is about 2 Kbytes, but you should reserve 0.5 Kbytes for future versions.It also uses about 100 bytes of RAM for its internal data beginning at address 200h.
If you use remapped interrupt vectors, the interrupt vectors in EPROM point to an interrupt vector table in the beginning of the user RAM area at 260h.
MODIFYING THE LINKER COMMAND FILE
With the C-SPY ROM-monitor comes a set of pre-defined linker command file templates. If none of these template files correspond with the memory layout of your target, you must modify the file to suit your target configuration.
U430-2
Part 6. IAR C-SPY ROM-monitor 175
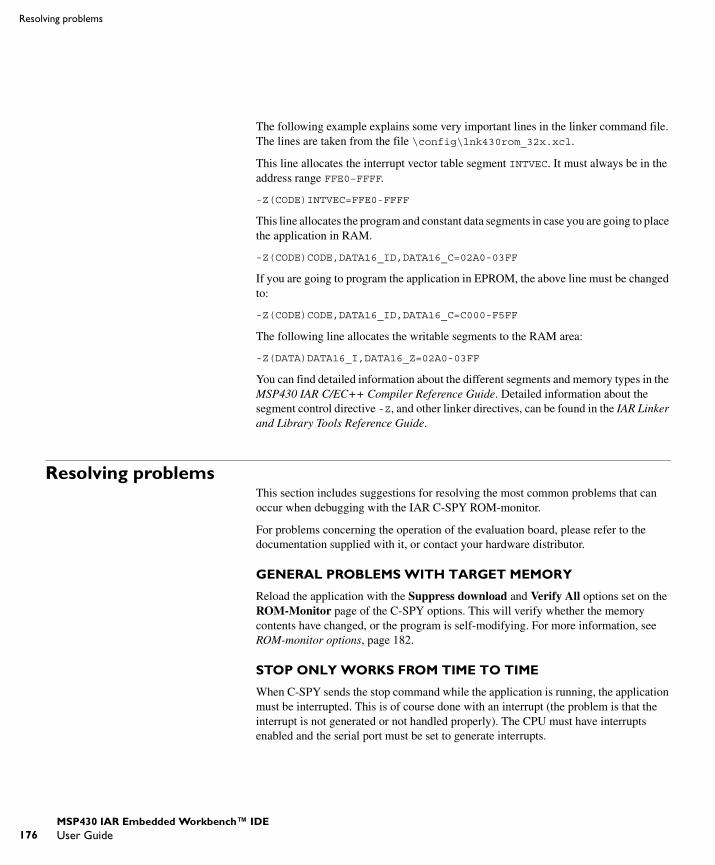
176
Resolving problems
The following example explains some very important lines in the linker command file. The lines are taken from the file \config\lnk430rom_32x.xcl.
This line allocates the interrupt vector table segment INTVEC. It must always be in the address range FFE0–FFFF.
-Z(CODE)INTVEC=FFE0-FFFF
This line allocates the program and constant data segments in case you are going to place the application in RAM.
-Z(CODE)CODE,DATA16_ID,DATA16_C=02A0-03FF
If you are going to program the application in EPROM, the above line must be changed to:
-Z(CODE)CODE,DATA16_ID,DATA16_C=C000-F5FF
The following line allocates the writable segments to the RAM area:
-Z(DATA)DATA16_I,DATA16_Z=02A0-03FF
You can find detailed information about the different segments and memory types in the MSP430 IAR C/EC++ Compiler Reference Guide. Detailed information about the segment control directive -Z, and other linker directives, can be found in the IAR Linker and Library Tools Reference Guide.
Resolving problemsThis section includes suggestions for resolving the most common problems that can occur when debugging with the IAR C-SPY ROM-monitor.
For problems concerning the operation of the evaluation board, please refer to the documentation supplied with it, or contact your hardware distributor.
GENERAL PROBLEMS WITH TARGET MEMORY
Reload the application with the Suppress download and Verify All options set on the ROM-Monitor page of the C-SPY options. This will verify whether the memory contents have changed, or the program is self-modifying. For more information, see ROM-monitor options, page 182.
STOP ONLY WORKS FROM TIME TO TIME
When C-SPY sends the stop command while the application is running, the application must be interrupted. This is of course done with an interrupt (the problem is that the interrupt is not generated or not handled properly). The CPU must have interrupts enabled and the serial port must be set to generate interrupts.
U430-2
MSP430 IAR Embedded Workbench™ IDEUser Guide

C-SPY ROM-monitor functionality
WRITE FAILURE DURING LOAD
There are two possible reasons for this. If only a small number of errors occur, the most probable cause is incorrectly mapped interrupt vectors. On the other hand, if the number of errors is considerable, you have probably linked the whole application incorrectly. In either case you need to examine the linker command file closely.
Incorrectly linked interrupt vector table
If your application is using interrupt vectors and you want to use the target monitor file mon430_1.txt to load the application into RAM, make sure that you have selected the Embedded Workbench options Interrupt vector table in RAM and Remap interrupt vectors. You should also double-check that your application does not use the address space where the target monitor places the jump table. The exact location is specified in the file cs430r.htm.
If you instead want to use the target monitor file mon430_2.txt to program your application (completely or partially) in EPROM together with interrupt vectors, use the option Interrupt vector table in EPROM. You should also make sure that the INTVEC memory segment is linked to the address range 0xFFE0–0xFFFF. See Interrupt vector table, page 174.
Incorrectly linked application
The application may have been linked to a memory area without any RAM. The probable cause is an incorrect linker command file. See Memory configuration, page 33.
MONITOR WORKS, BUT APPLICATION DOES NOT RUN
Your application is probably linked to some illegal code area (like the interrupt table). Examine the linker command file and verify that the start addresses of CODE and DATA segments are correct.
MONITOR CRASHES WHEN RUNNING AN APPLICATION
If the monitor crashes, the board will need a reset. This happens when the application writes data to restricted memory areas (like the monitor’s RAM or the application code).
Stack overflow or interrupt vectors that are not properly installed may also be the problem.
NO CONTACT WITH THE MONITOR
There are several possible reasons for why C-SPY can fail to establish contact with the target monitor.
U430-2
Part 6. IAR C-SPY ROM-monitor 177

178
Serial communication
� A protocol error could have occurred. Try resetting your evaluation board and restart C-SPY.
� Check that the correct options for serial communication have been specified in the IAR Embedded Workbench. See Serial communication options, page 183.
� Verify that the serial cable is properly plugged in and not damaged or of the wrong type.
� Examine the linker command file to make sure that the monitor has not been linked to the wrong address.
� Verify that the target chip is properly mounted on the evaluation board.� Make sure that the evaluation board is supplied with sufficient power. In some cases
the power supplied from the PC’s COM port is not enough, and you have to connect a separate power supply to the evaluation board.
If C-SPY still fails to make contact with the target monitor, you should generate a log file—see Log communication, page 184—and send it to your local distributor or nearest IAR Support office. See the contact information on the IAR website, www.iar.com.
Serial communicationThe ROM-monitor program uses the 8-bit internal timer/counter to simulate the UART as described in the MSP430 Family Architecture Guide and Module Library. The simulated serial port uses the PORT0 register, pins P0.1 and P0.2.
The ROM-monitor program starts as soon as the evaluation board has been reset. The ROM-monitor driver will send the value 0xC0 to set up the communication with the ROM-monitor program, and the target monitor will return 0x41. A log file can be generated to check whether the communication setup values are correct. See Log communication, page 184, for more information.
When the connection is established C-SPY starts controlling the ROM-monitor with commands like Read/Write memory, Read/Write registers, Go, Step and Reset.
All commands and data sent between ROM-monitor driver and the ROM-monitor program are verified using checksum calculation. Bad or lost data is re-transmitted until the receiver acknowledges it. If there are no commands from the driver to the monitor, the driver sends a test command to check if the monitor is still active or if it has been reset.
U430-2
MSP430 IAR Embedded Workbench™ IDEUser Guide

C-SPY ROM-monitor functionality
REGISTER USAGE
The following registers are used by the software-simulated UART. These registers must therefore not be used by the application program
The UART interrupt must be enabled for the ROM-monitor program to function. For that reason you cannot disable the GIE (global interrupt enable) bit. Note also that the UART interrupt vector is used by C-SPY to communicate with the monitor and cannot be used by your application. If the interrupt vector table contains the UART interrupt vector it will be ignored when you start C-SPY, and a warning message will be reported.
Downloading a stand-alone applicationYou can use C-SPY for downloading your application as a stand-alone program. In this case the ROM-monitor program is not used. The application is linked into a MSP430 text format file as before and programmed into EPROM using the Program EPROM part and the Stand-alone application options. The Stand-alone application option must be used to prevent C-SPY from replacing the reset vector for the application program with the reset vector for the target monitor.
In this case the application may use all available ROM and RAM on the board, this is accomplished by modifying the CODE and DATA areas in the linker command file.
Register Address Bits
R4 all
TCDAT 44h all
TCPLD 43h all
TCCTL 42h all
POIES 14h 1, 2
IFG1 02h 3
IE1 00h 3
P0DIR 12h 1, 2
P0IFG 13 2
P0IE 15 2
Table 24: Registers used by simulated UART
U430-2
Part 6. IAR C-SPY ROM-monitor 179

180
Downloading a stand-alone application
U430-2
MSP430 IAR Embedded Workbench™ IDEUser Guide

The C-SPY ROM-monitor optionsThis section describes the additional options specific to the C-SPY ROM-monitor.
Setup optionsOn the Setup page, select the appropriate driver. In this case, select the ROM-Monitor driver:
For information about the options Setup macro and Device description, see C-SPY setup options, page 327.
U430-2
Part 6. IAR C-SPY ROM-monitor 181

182
ROM-monitor options
ROM-monitor optionsThe ROM-monitor page contains all the ROM-monitor-specific options.
VERIFY DOWNLOAD
Verifies that program data has been correctly transferred from the driver to the device. This verification does increase the programming sequence time.
ROM-MONITOR DOWNLOAD CONTROL
You can program the ROM-monitor program into EPROM before the application code is downloaded. Select Interrupt vector table in RAM if you want to map the real interrupt vectors to a jump table loaded in RAM. This option will load the mon430_1.txt program file. This requires that the Remap interrupt vectors option below is used.
Select Interrupt vector table in EPROM if you want to program the real interrupt vector table into EPROM. This option will load the mon430_2.txt program file.
If you already have your ROM-monitor program in EPROM or want to program your application without a ROM-monitor program, select Suppress download.
APPLICATION DOWNLOAD CONTROL
The RAM part of your application will always be downloaded to the evaluation board unless you select the Suppress download option. If you also want to program the EPROM part of your application, select Program EPROM part. Make sure that only Suppress download is selected if you do not want to download any code at all, for example if you have downloaded it already and just want to restart C-SPY.
U430-2
MSP430 IAR Embedded Workbench™ IDEUser Guide

The C-SPY ROM-monitor options
Use the linker command file to configure how your application will be located in the available RAM and EPROM segments on the evaluation board.
Select Remap interrupt vectors if you want to map your interrupt vector table at FFE0–FFFF in EPROM to a jump table loaded at the end of the target monitor RAM area. The exact location is specified in the file cs430r.htm. See Interrupt vector table, page 174. This only works when the ROM-monitor program is downloaded with the interrupt vector table in RAM.
If you want to use C-SPY to program your application in EPROM and run it without the target monitor, you must select the Stand-alone application option to make C-SPY program the start address of the application into the reset vector instead of the address of the ROM-monitor program. See Downloading a stand-alone application, page 37.
Serial communication optionsThen select the Serial Port page which contains all the ROM-monitor communication options:
Figure 73: Serial Port page
Option Setting
Port One of the supported ports: COM1, COM2, COM3, COM4
Baud Currently, the ROM-monitor only supports 4800
Parity Only None is supported.
Data bits Only 8 data bits is supported.
Table 25: Serial Port options
U430-2
Part 6. IAR C-SPY ROM-monitor 183
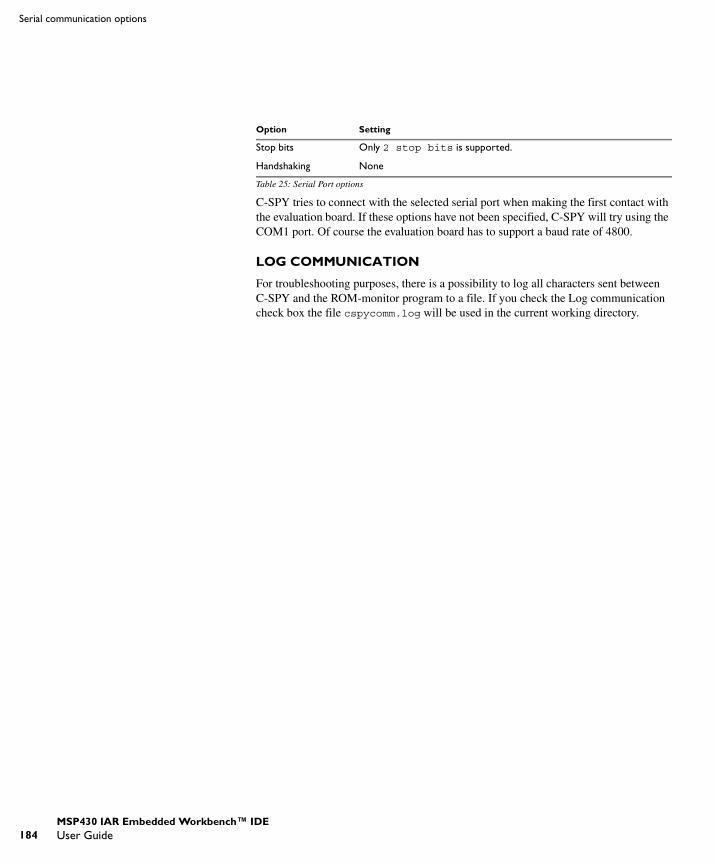
184
Serial communication options
C-SPY tries to connect with the selected serial port when making the first contact with the evaluation board. If these options have not been specified, C-SPY will try using the COM1 port. Of course the evaluation board has to support a baud rate of 4800.
LOG COMMUNICATION
For troubleshooting purposes, there is a possibility to log all characters sent between C-SPY and the ROM-monitor program to a file. If you check the Log communication check box the file cspycomm.log will be used in the current working directory.
Stop bits Only 2 stop bits is supported.
Handshaking None
Option Setting
Table 25: Serial Port options
U430-2
MSP430 IAR Embedded Workbench™ IDEUser Guide

Part 7. IAR C-SPY FET DebuggerThis part of the MSP430 IAR Embedded Workbench™ IDE User Guide contains the following chapters:
� Introduction to the IAR C-SPY FET Debugger
� C-SPY FET driver-specific characteristics
� C-SPY FET Debugger options and menus
� Design considerations for in-circuit programming.
U430-2
185
186
U430-2

Introduction to the IAR C-SPY FET DebuggerThis chapter introduces you to the IAR C-SPY Flash Emulation Tool Debugger (C-SPY FET Debugger), as well as to how it differs from the C-SPY Simulator. This chapter describes how you install the hardware and then run the demo applications. The chapter also briefly describes the communication between the C-SPY FET driver and the target system, and gives some troubleshooting hints.
The chapters specific to the C-SPY FET Debugger assumes that you already have some working knowledge of the flash emulation tool (FET), as well as some working knowledge of the IAR C-SPY Debugger. For a quick introduction, see Part 2. Tutorials.
Please note that additional features may have been added to the software after the MSP430 IAR Embedded Workbench™ IDE User Guide was printed. The readme file cs430f.htm contains the latest information.
The FET C-SPY DebuggerThe MSP430 microcontroller has built-in, on-chip debug support. To make the C-SPY FET Debugger work, a communication driver must be installed on the host PC. This driver is automatically installed during the installation of the IAR Embedded Workbench. Since the hardware debugger kernel is built into the microcontroller, no ordinary ROM-monitor program or extra specific hardware is needed to make the debugging work. It is also possible to use the debugger on your own hardware design.
The C-SPY FET Debugger provides general C-SPY Debugger features, and features specific to the C-SPY FET driver. For detailed information about the general debugger features, see Part 4. Debugging in this guide.
U430-2
Part 7. IAR C-SPY FET Debugger 187

188
The FET C-SPY Debugger
The C-SPY FET driver uses the parallel port to communicate with the FET Interface module. The FET Interface module communicates which the JTAG interface on the hardware.
Figure 74: Communication overview
For more details about the communication, see C-SPY FET communication, page 200.
SUPPORTED DEVICES
For a complete list of supported devices, see the cs430f.htm readme file.
DIFFERENCES BETWEEN THE C-SPY FET AND THE SIMULATOR
The following table summarizes the key differences between the FET and simulator drivers:
Feature Simulator FET
OP-fetch x x
Data breakpoints x x
Execution in real time x
Table 26: Simulator and FET differences
Host computer
C-SPYDebugger
C-SPY driver
Parallelcable
Interfacemodule
JTAG
On-chipemulation CPU
Target board
FLASH RAM
U430-2
MSP430 IAR Embedded Workbench™ IDEUser Guide

Introduction to the IAR C-SPY FET Debugger
Note: Data breakpoints are supported for the devices with the Enhanced Emlation module. For further details, see Using breakpoints, page 193. Cycle counter is supported during single step, you can then view the value of the cycle counter in the Register window.
Hardware installationHARDWARE INSTALLATION, MSP-FET430X110
1 Connect the 25-conductor cable originating from the FET to the parallel port of your PC.
2 Ensure that the MSP430 device is securely seated in the socket, and that its pin 1 (indicated with a circular indentation on the top surface) aligns with the 1 mark on the PCB.
3 Ensure that jumpers J1 (near the non-socketed IC on the FET) and J5 (near the LED) are in place.
HARDWARE INSTALLATION, MSP-FET430PXX0
('P120, 'P140, 'P410, 'P440)
1 Use the 25-conductor cable to connect the FET Interface module to the parallel port of your PC.
2 Use the 14-conductor cable to connect the FET Interface module to the Target Socket module.
3 Ensure that the MSP430 device is securely seated in the socket, and that its pin 1 (indicated with a circular indentation on the top surface) aligns with the 1 mark on the PCB.
4 Ensure that the two jumpers (LED and Vcc) near the 2x7 pin male connector are in place.
Simulated interrupts x
Real interrupts x
Cycle counter x x
Code coverage x
Profiling x
Feature Simulator FET
Table 26: Simulator and FET differences (Continued)
U430-2
Part 7. IAR C-SPY FET Debugger 189
190
Getting started
Getting startedThis section demonstrates two demo applications—one in assembler language and one in C—that flash the LED. The applications are built and downloaded to the FET, and then executed.
There is one demo workspace file supplied with the C-SPY FET Debugger fet_projects.eww. This workspace contains two projects per FET variant—one in C and one in assembler. The files are provided in the directory 430\FET_examples.
The majority of the examples use the various resources of the MSP430 to time the flashing of the LED.
Note: The examples often assume the presence of a 32kHz crystal, and not all FETs are supplied with a 32kHz crystal.
RUNNING A DEMO APPLICATION
Assembler example
1 In the Embedded Workbench, choose File>Open Workspace to open the workspace file fet_projects.eww.
2 To display the assembler project, click the appropriate project tab at the bottom of the workspace window, for instance fet140_1_asm.
If you want to run the application for a different FET, click appropriate project tab.
3 Select the Debug build configuration from the drop-down list at the top of the workspace window.
4 Choose Project>Options. In addition to the factory settings, verify the following settings:
For more information about the C-SPY FET options and how to configure C-SPY to interact with the target board, see C-SPY FET Debugger options and menus, page 203.
Click OK to close the Options dialog box.
5 Choose Project>Make to assemble and link the source code.
Category Page Option/Setting
General Target Device: msp430F149
ICC Output Generate debug information
C-SPY Setup Driver: Flash Emulation Tool
Flash Emulation Tool Suppress download (deselected)
Table 27: Project options for FET assembler example
U430-2
MSP430 IAR Embedded Workbench™ IDEUser Guide

Introduction to the IAR C-SPY FET Debugger
6 Start C-SPY by clicking the Debug button or by choosing Project>Debug. C-SPY will erase the flash memory of the device, and then download the application object file to the target system.
7 In C-SPY, choose Execute>Go or click the Go button to start the program. The LED should flash.
8 Click the Stop button to stop the execution.
C Example
1 In the Embedded Workbench, choose File>Open Workspace to open the workspace file fet_projects.eww.
2 To display the C project, click the appropriate project tab at the bottom of the workspace window, for instance fet140_1_C.
If you want to run the application for a different FET, click appropriate project tab.
3 Select the Debug build configuration from the drop-down list at the top of the workspace window.
4 Choose Project>Options. In addition to the factory settings, verify the following settings:
For more information about the C-SPY FET options and how to configure C-SPY to interact with the target board, see C-SPY FET Debugger options and menus, page 203.
Click OK to close the Options dialog box.
5 Choose Project>Make to compile and link the source code.
6 Start C-SPY by clicking the Debug button or by choosing Project>Debug. C-SPY will erase the flash memory of the device, and then download the application to the target system.
7 In C-SPY, choose Execute>Go or click the Go button to start the program. The LED should flash.
8 Click the Stop button to stop the execution.
Category Page Option/Setting
General Target Device: msp430F149
ICC Output Generate debug information
C-SPY Setup Driver: Flash Emulation Tool
Emulator Suppress download (deselcted)
Table 28: Project options for FET C example
U430-2
Part 7. IAR C-SPY FET Debugger 191

192
Getting started
U430-2
MSP430 IAR Embedded Workbench™ IDEUser Guide

C-SPY FET driver-specific characteristicsThis chapter describes the additional features provided by the C-SPY FET driver. There are certain restrictions and prerequisites you need to know about, to debug your code successfully.
You will also find descriptions of memory configuration and FET communication with some common troubleshooting tips.
Using breakpointsWith the C-SPY FET Debugger you can set code breakpoints. If you are using a device that supports the Enhanced Emulation module you also have access to an extended breakpoint system with support for:
� setting breakpoints on addresses, data, and registers� defining which type of access that should trigger the breakpoint: read, write, or
fetch� setting conditional breakpoints� triggering different actions: stopping the execution, or starting the state storage
module.
The Enhanced Emulation module also gives you access to the sequencer module which is a state machine that uses breakpoints for triggering new states.
HARDWARE AND VIRTUAL BREAKPOINTS
To set breakpoints, the C-SPY FET Debugger uses the hardware breakpoints available on the device. When all hardware breakpoints are used, C-SPY can use virtual breakpoints, which means that you can set an unlimited amount of breakpoints.
The number of available hardware breakpoints for each device is:
Device Breakpoints (N)
MSP430F11x1 2
MSP430F11x2 2
MSP430F12x 2
MSP430F12x2 2
Table 29: Available hardware breakpoints
U430-2
Part 7. IAR C-SPY FET Debugger 193

194
Using breakpoints
If there are N or fewer breakpoints active, C-SPY will always operate at full speed. If there are more than N breakpoints active, and virtual breakpoints are used, C-SPY will be forced to single step between the breakpoints. This means that execution will not be at full speed.
SYSTEM BREAKPOINTS
Sometimes C-SPY must set breakpoints for internal use. These breakpoints are called system breakpoints. C-SPY will set a system breakpoint when:
� the library functions putchar() and getchar() are used (low-level routines used by functions like printf and scanf)
� the application has an exit label.
C-SPY will also set a temporary system breakpoint when:
� the command Edit>Run to Cursor is used� the option Run to is selected
The system breakpoints will use hardware breakpoints when available. When the number of available hardware breakpoints is exceeded, virtual breakpoints will be used instead.
CUSTOMIZING THE USE OF BREAKPOINTS
It is possible to prevent the debugger from executing in single-step mode. You do this by disabling the use of virtual breakpoints and fine-tuning the use of system breakpoints. This will increase the performance of the debugger, but you will only have access to the available number of hardware breakpoints. For further information about the necessary options, see Flash Emulation Tool, page 204.
MSP430F13x 3
MSP430F14x 3
MSP430F41x 2
MSP430F43x 3
MSP430F44x 8
Device Breakpoints (N)
Table 29: Available hardware breakpoints (Continued)
U430-2
MSP430 IAR Embedded Workbench™ IDEUser Guide

C-SPY FET driver-specific characteristics
To monitor all currently used breakpoints, choose Emulator>Show used breakpoints to open the Used Breakpoints window.
Figure 75: The Used Breakpoints window
All used hardware and virtual breakpoints are listed, as well as all currently defined EEM breakpoints.
Periodically monitoring data
If you are using a device that does not support the Enhanced Emulation Module, the break-on-data capability of the MSP430 is not utilized. In that case, breakpoints can only be set to occur during an instruction fetch. However, C-SPY provides a non-realtime data breakpoint mechanism, which lets you periodically monitoring data without using data breakpoints. For a description of the data breakpoint mechanism, see the chapter Using breakpoints.
Using breakpoints when programming flash memory
When programming the flash memory, do not set a breakpoint on the instruction immediately following the write to flash operation. A simple work-around is to follow the write to flash operation with a NOP instruction, and set a breakpoint on the instruction following the NOP instruction.
BREAKPOINTS AND INTERRUPTS
If an interrupt becomes active when C-SPY is processing a breakpoint, C-SPY will stop at the first instruction of the interrupt service routine.
U430-2
Part 7. IAR C-SPY FET Debugger 195

196
Stepping
SteppingMultiple internal machine cycles are required to clear and program the flash memory. When single-stepping over instructions that manipulate the flash, control is given back to C-SPY before these operations are complete. Consequently, C-SPY will update its memory window with erroneous information. A workaround to this behavior is to follow the flash access instruction with a NOP instruction, and then step past the NOP before reviewing the effects of the flash access instruction.
While single-stepping with active and enabled interrupts, it can seem as if only the interrupt service routine (ISR) is active. That is, the non-ISR code never appears to execute, and the single-step operation always stops on the first line of the ISR. However, this behavior is correct because the device will always process an active and enabled interrupt. There is a workaround for this behavior. While within the ISR, disable the GIE bit on the stack so that interrupts will be disabled after exiting the ISR. This will permit the non-ISR code to be debugged (but without interrupts). Interrupts can later be re-enabled by setting GIE in the status register in the Register window.
On devices with Clock Control, it may be possible to suspend a clock between single steps and delay an interrupt request.
Using state storageThe state storage module is a limited variant of a traditional trace module. It can store eight states and can be used for monitoring program states or program flow, without interfering with the execution. The state storage module is only available if you are using a device that supports the Enhanced Emulation Module.
To use the state storage module, you must:
1 Define one or multiple EEM breakpoints that you want to trigger the state storage module. Make sure to select the action Trigger. This means that the breakpoint is defined as a state storage trigger.
Note that depending on the behavior you want to have when the state storage module is triggered, it is useful to consider the combination of the Action options and the options available on the State Storage dialog box. See the examples following immediately after these steps.
2 Choose Emulator>State Storage to open the State Storage dialog box.
3 Select the option Enable state storage. Set the options Buffer wrap around, Trigger action, and Storage action according to your preferences.
In the list State Storage Triggers, all breakpoints defined as state storage triggers are listed.
U430-2
MSP430 IAR Embedded Workbench™ IDEUser Guide

C-SPY FET driver-specific characteristics
For further details about the options, see State Storage dialog box, page 211.
4 Click OK.
5 Choose Debug>Go to execute your application. Before you can view the state storage information, you must stop the execution. You can do this, for instance, by using the Break command.
6 Choose Emulator>State Storage window to open the State Storage window.
For information about the window contents, see State Storage Window, page 213.
Example
Assume the following setup:
� There is an EEM breakpoint which has both of the action options selected—Break and Trigger
� The state storage options Instruction fetch and Buffer wrap around are selected in the State Storage dialog box.
This will start the state storage immediately when you start executing your application. When the breakpoint is triggered, the execution will stop and the last eight states can be inspected in the State Storage window.
However, if you do not want the state storage module to start until a specific state is reached, you would usually not want the execution to stop since no state information has been stored, yet.
In this case, select the Trigger action in the EEM breakpoints dialog box, and deselect the option Buffer wrap around in the State Storage dialog box.
When the breakpoint is triggered, the execution will not stop, but the state storage will start. Since the option Buffer wrap around is deselected you have ensured that the data in the buffer will not be overwritten.
When another breakpoint (which has Break selected) is triggered, or if you stop the execution by clicking the Break button, the State Storage window will show eight states starting with the breakpoint that was used for starting the state storage module.
U430-2
Part 7. IAR C-SPY FET Debugger 197

198
Using sequencer
Using sequencerThe sequencer module lets you break the execution or trigger the state storage module by using a more complex method than a standard breakpoint. This is useful if you want to stop the execution under certain conditions, for instance a specific program flow. You can combine this with letting the state storage module continuously store information. At the time when the execution stops, you will have useful state information logged in the State storage window.
Consider this example:
void my_putchar(char c){ ... //Code suspected to be erroneous ...}
void my_function(void){ ... my_putchar('a'); ... my_putchar('x'); ... my_putchar('@'); ...}
In this example, the customized putchar function my_putchar() has for some reason a problem with special characters. To locate the problem, it could be useful to stop execution when the function is called, but only when it is called with one of the problematic characters as the argument.
To achieve this, you can:
1 Set a breakpoint on the statement my_putchar('@');.
2 Set another breakpoint on the suspected code within the function my_putchar().
3 Define these breakpoints as transition triggers. Choose Emulator>Sequencer to open the Sequencer dialog box. Select the option Enable sequencer.
U430-2
MSP430 IAR Embedded Workbench™ IDEUser Guide

C-SPY FET driver-specific characteristics
4 In this simple example you will only need two transition triggers. Make sure the following options are selected:
The transition trigger 1 depends on the transition trigger 0. This means that the execution will stop only when the function my_putchar() is called by the function call my_putchar('@');
Click OK.
5 Now you should set up the state storage module. Choose Emulator>State Storage to open the State Storage dialog box. Make sure the following options are selected:
Click OK.
6 Start the program execution. The state storage module will continuously store trace information. Execution stops when the function my_putchar() has been called by the function call my_putchar('@');
7 Choose Emulator>State Storage to open the State Storage window. You can now examine the stored trace information. For further details, see State Storage Window, page 213.
8 When the sequencer is in state 3, C-SPY’s breakpoint mechanism—which is used for all breakpoints, not only transition triggers—can be locked. Therefore, you should always end the session with one of these steps:
� Disabling the sequencer module. This will restore all breakpoint actions.� Resetting the state machine by clicking the Reset States button. The sequencer will
still be active and trigger on the defined setup during the program execution.
Option Setting
Transition trigger 0 The breakpoint which is set on the function call my_putchar('@');
Transition trigger 1 The breakpoint which is set on the suspected code within the function my_putchar()
Action Break
Table 30: Sequencer settings - example
Option Setting
Enable state storage Selected
Buffer wrap around Selected
Storage action Instruction fetch
Trigger action None
Table 31: State storage settings - example
U430-2
Part 7. IAR C-SPY FET Debugger 199

200
Memory configuration
Memory configurationNo special considerations regarding memory configuration are needed for the FET C-SPY Debugger. You can download your application into RAM, or non-volatile memory.
Your application will be linked according to the directives specified in the linker command file, and your application will automatically be downloaded to the appropriate memory addresses.
You can find detailed information about the linker command file and the usage of the different segments in the MSP430 IAR C/EC++ Compiler Reference Guide. Detailed information about the segment control directive -Z can be found in the IAR Linker and Library Tools Reference Guide.
C-SPY FET communicationC-SPY uses the JTAG pins of the device to debug the device. On some MSP430 devices, these JTAG pins are shared with the device port pins. Normally, C-SPY maintains the pins in JTAG mode so that the device can be debugged. During this time the port functionality of the shared pins is not available.
RELEASING JTAG
When you choose Emulator>Release JTAG on Go, the JTAG drivers are set to tri-state and the device will be released from JTAG control (the TEST pin is set to GND) when GO is activated. Any active on-chip breakpoints are retained and the shared JTAG port pins revert to their port functions.
At this time, C-SPY has no access to the device and cannot determine if an active breakpoint has been triggered. C-SPY must be manually told to stop the device, at which time the state of the device will be determined (that is, has a breakpoint been reached?).
If you choose Emulator>Release JTAG on Go, the JTAG pins will be released if, and only if, there are N or fewer active breakpoints.
When making current measurements of the device, ensure that the JTAG control signals are released (Emulator>Release JTAG on Go), otherwise the device will be powered by the signals on the JTAG pins and the measurements will be erroneous.
PARALLEL PORT DESIGNATORS
The parallel port designators (LPTx) have the following physical addresses: LPT1: 0x378, LPT2: 0x278, LPT3: 0x3BC. The configuration of the parallel port (ECP, Compatible, Bidirectional, Normal) is not significant; ECP is recommended.
U430-2
MSP430 IAR Embedded Workbench™ IDEUser Guide

C-SPY FET driver-specific characteristics
TROUBLESHOOTING
If establishing communication between the C-SPY FET driver and the target system fails, possible solutions to this problem include:
� Restart your host computer.� Ensure that R6 on the MSP-FET430X110 and the FET Interface module has a value
of 82 ohms. Early units were built using a 330-ohm resistor for R6. The FET Interface module can be opened by inserting a thin blade between the case halves, and then carefully twisting the blade so as to pry the case halves apart.
� Ensure that the correct parallel port has been specified on the options page Flash Emulation Tool available from the Project>Options menu. Check the PC BIOS for the parallel port address (0x378, 0x278, 0x3BC), and the parallel port configuration (ECP, Compatible, Bidirectional, or Normal).
� Ensure that no other software application has reserved/taken control of the parallel port (for instance, printer drivers, ZIP drive drivers, etc.). Such software can prevent the C-SPY’s FET driver from accessing the parallel port, and, hence, communicating with the device.
� Revisions 1.0, 1.1, and 1.2 of the FET Interface module require a hardware modification; a 0.1µF capacitor needs to be installed between U1 pin 1 (signal VCC_MSP) and ground. A convenient (electrically equivalent) installation point for this capacitor is between pins 4 and 5 of U1.
Note: The hardware modification may already have been performed during manufacturing, or your tool may contain an updated version of the FET Interface module.
� Revisions 0.1 and 1.0 of the MSP-TS430PM64 Target Socket module require a hardware modification; the PCB trace connecting pin 6 of the JTAG connector to pin 9 of the MSP430 (signal XOUT) needs to be severed.
Note: The hardware modification may have already been performed during manufacturing, or your tool may contain an updated version of the Target Socket module.
Also note that if the modified Target Socket module is used with the PRGS, Version 1.10 or greater of the PRGS software is required.
For revisions 1.0, 1.1, and 1.2 of the FET Interface module, install a 0.1µF capacitor between the indicated points (pins 4 and 5 of U1).
U430-2
Part 7. IAR C-SPY FET Debugger 201

202
C-SPY FET communication
U430-2
MSP430 IAR Embedded Workbench™ IDEUser Guide

C-SPY FET Debugger options and menusThis section describes the additional options and menus specific to the C-SPY FET Debugger.
Setup optionsOn the Setup page, select the appropriate driver. In this case, select the Flash Emulation Tool driver:
To restore all settings to the default factory settings, click the Factory Settings button.
For information about the options Setup macro and Device description, seeC-SPY setup options, page 327.
U430-2
Part 7. IAR C-SPY FET Debugger 203

204
Flash Emulation Tool
Flash Emulation ToolThe Flash Emulation Tool page contains all the options specific to the C-SPY FET Debugger.
Figure 76: Flash Emulation Tool options
VERIFY DOWNLOAD
The option Verify download verifies that the program data has been correctly transferred from the driver to the device. This verification does increase the programming sequence time.
DOWNLOAD CONTROL
If you already have your application in flash memory, select Suppress download. Select Ask when downloading to make C-SPY prompt for each download whether download should be suppressed or not.
The option Erase main memory erases only the main flash memory before download. The information memory is not erased. Whereas, the option Erase main and Information memory erases both flash memories before download.
When you select the option Retain unchanged main memory the information and main flash memories are read into a buffer. Only the flash segments needed are erased. If data that are to be written into a segment match the data on the target, the data on the target is left as is. No download is performed.
The new data effectively replaces the old data, and unaffected old data is retained.
U430-2
MSP430 IAR Embedded Workbench™ IDEUser Guide

C-SPY FET Debugger options and menus
PARALLEL PORT
The drop-down list Parallel Port lets you select which parallel port to use. Possible settings are LPT1, LPT2, and LPT3.
USE VIRTUAL BREAKPOINTS
The option Use virtual breakpoints allows C-SPY to use virtual breakpoints when all available hardware breakpoints has been used. When virtual breakpoints are used, C-SPY is forced into single step mode.
To prevent C-SPY form entering single step mode, disable this option. In this case C-SPY will not use virtual breakpoints, even though all hardware breakpoints are already used. For further information about how to use breakpoints, see Using breakpoints, page 193.
SYSTEM BREAKPOINTS ON
The option System breakpoints on can be used for fine-tuning the use of system breakpoints. If the C-SPY Terminal I/O window is not required or if you do not need a breakpoint on the exit label, you can save hardware breakpoints by not reserving system breakpoints. Select or deselect the options exit, putchar, and getchar respectively, if you want, or not want, C-SPY to use system breakpoints for these. For further information about breakpoints, see Using breakpoints, page 193.
U430-2
Part 7. IAR C-SPY FET Debugger 205

206
Enhanced Emulation Module (EEM) breakpoints
Enhanced Emulation Module (EEM) breakpointsEEM breakpoints can be set by using the Breakpoints dialog box, which is available from the Edit menu. These breakpoints are only available if you are using a device that supports the Enhanced Emulation Module.
Figure 77: EEM breakpoints dialog box
Defining a breakpoint consists of specifying the options:
� Break At� Type� Condition� Access� Action.
The breakpoints you define appear in the list at the bottom of the dialog box.
U430-2
MSP430 IAR Embedded Workbench™ IDEUser Guide

C-SPY FET Debugger options and menus
Break At location
These are the locations you can choose between and their possible settings:
A browse button is available for your convenience.
Breakpoint type
To choose which breakpoint type to use, select one of the following options:
Location Description/Examples
Expression Any expression that evaluates to a valid address, such as a function or variable name. Setting the location on a function is used for code breakpoints, and setting the location on a variable name is used for data breakpoints.For example, my_var refers to the location of the variable my_var, and arr[3] refers to the third element of the array arr.
Absolute Address An absolute location on the form zone:hexaddress or simply hexaddress. Zone specifies in which memory the address belongs.For example Memory:0x42If you enter a combination of a Zone and address that is not valid, C-SPY will indicate the mismatch.
Source Location A location in the C source program using the syntax {file path}.row.column
File specifies the filename and full path. Row specifies the row in which you want the breakpoint. Column specifies the column in which you want the breakpoint. Note that the Source Location type is only meaningful for code breakpoints.For example, {C:\IAR Systems\xxx\Utilities.c}.22.3 sets a breakpoint on the third character position on line 22 in the source file Utilities.c.
Table 32: Break at location types
Breakpoint type Description
Address Sets a breakpoint on a specified address, or anything that can be evaluated to such. The breakpoint is triggered when the specified location is accessed. If you have set the breakpoint on a specific machine instruction, the breakpoint will be triggered and the execution will stop, exactly before the instruction will be executed.
Data Sets a breakpoint on a specified value. It is the value on the data bus that triggers the breakpoint.
Table 33: EEM breakpoint types
U430-2
Part 7. IAR C-SPY FET Debugger 207

208
Enhanced Emulation Module (EEM) breakpoints
Condition
You can specify one of the following conditions for when the breakpoint should be triggered:
Access type
You can specify the type of access that triggers the selected breakpoint. Select one of the following options:
Action
There are two action options—Break and Trigger.
If you select the option Break, the execution will stop when the breakpoint is triggered.
If you select the option Trigger, the breakpoint is defined as a state storage trigger without stopping the execution. To define the behavior of the state storage module further, use the options in the State Storage dialog box.
Register Sets a breakpoint on a register. In the text box, type the value that should trigger the breakpoint. Specify the register, or anything that can be evaluated to such, in the Break At text box.
Condition Description
== Equal to.
>= Greater than or equal to.
<= Less than or equal to.
Table 34: EEM breakpoint conditions
Access Description
Read Read from location.
Write Write to location.
Fetch At instruction fetch.
Table 35: EEM breakpoint access types
Breakpoint type Description
Table 33: EEM breakpoint types (Continued)
U430-2
MSP430 IAR Embedded Workbench™ IDEUser Guide

C-SPY FET Debugger options and menus
Emulator menuUsing the C-SPY FET driver creates a new menu on the menu bar—the Emulator menu.
Figure 78: Emulator menu
Menu Command Description
Release JTAG on Go Sets the JTAG drivers in tri-state so that the device is released from JTAG control—TEST pin is set to GND—when GO is activated.
Resynchronize JTAG Regains control of the device.It is not possible to Resynchronize JTAG while the device is operating.
Init New Device Initializes the device according to the specified options on the Flash Emulation Tool page. The current program file is downloaded to the device memory, and the device is then reset. This command can be used to program multiple devices with the same program from within the same C-SPY session.It is not possible to choose Init New Device while the device is operating, thus the command will be dimmed.
Show used breakpoints Lists all used hardware and virtual breakpoints, as well as all currently defined EEM breakpoints.
Advanced>General Clock Control
Lets you specify which system clocks that should be stopped when the execution has been stopped by a triggered breakpoint or by the Break command. All system clocks are enabled after a GO or a single step (Step Over/Step Into).
Advanced>Emulation Mode
Specifies the device to be emulated. The device must be reset (or reinitialized by using the menu command Init New Device) following a change to the emulation mode.
Table 36: Emulator menu commands
U430-2
Part 7. IAR C-SPY FET Debugger 209

210
Emulator menu
Note: Not all Emulator->Advanced submenus are available on all MSP430 devices.
Advanced>Memory Dump
Writes the specified device memory contents to a specified file. A dialog box is displayed where you can specify a file name, a memory starting address, and a length. The addressed memory is then written in a text format to the named file. Options permit you to select word or byte text format, and address information and register contents can also be appended to the file. The Dump Memory length specifier is restricted to four hexadecimal digits (0-FFFF). This limits the number of bytes that can be written from 0 to 65535. Consequently, it is not possible to write memory from 0 to 0xFFFF inclusive as this would require a length specifier of 65536 (or 0x10000).
State Storage Opens the State Storage dialog box, which lets you define the use of the state storage module. This is only possible if you are using a device that contains support for the Enhanced Emulation Module.
State Storage Window Opens the State Storage window which contains state storage information according to your definitions.
Sequencer Opens the Sequencer dialog box, which lets you define a state machine.
“Power on” Reset The device is reset by cycling power to the device.
Menu Command Description
Table 36: Emulator menu commands (Continued)
U430-2
MSP430 IAR Embedded Workbench™ IDEUser Guide

C-SPY FET Debugger options and menus
STATE STORAGE DIALOG BOX
Use the State Storage dialog box—available from the Emulator menu—to define how to use the state storage module available on devices that support the Enhanced Emulation Module.
Figure 79: State Storage dialog box
Enable state storage
This option enables the state storage module.
Buffer wrap around
This options controls if the state storage buffer should wrap around. If you select the option Buffer wrap around the state storage buffer is continuously overwritten until the execution is stopped or a breakpoint is triggered. Only the eight last states are stored.
Alternatively, not to overwrite the information in the state storage buffer, deselect this option. To guarantee that the eight first states will be stored, you should also click Reset.
Reset
Resets the state storage module.
U430-2
Part 7. IAR C-SPY FET Debugger 211
212
Emulator menu
Trigger action
This option acts upon the breakpoints that are defined as state storage triggers. The option defines what action should take place when these breakpoints have been triggered. You can choose between the following options:
Storage action on
This option defines when the state information should be collected. You can choose between the following options:
State storage triggers
Lists all the breakpoints that are defined as state storage triggers. That is, the breakpoints that have the action Trigger selected.
Start on trigger State storage starts when the breakpoint is triggered.
Stop on trigger State storage starts immediately when execution starts. State storage stops when the breakpoint is triggered.
None State storage starts immediately when execution starts. State storage does not stop when the breakpoint is triggered. However, if execution stops, state storage also stops but it will resume when execution resumes.
Triggers Stores state information at the time when the state storage trigger is triggered. That is, when the breakpoint defined as a state storage trigger is triggered.
Instruction fetch Stores state information at all instruction fetches.
All cycles Stores state information for all cycles.
U430-2
MSP430 IAR Embedded Workbench™ IDEUser Guide

C-SPY FET Debugger options and menus
STATE STORAGE WINDOW
The State Storage window—available from the Emulator menu—displays state storage information for eight states.
Figure 80: State Storage window
The window contains the following columns:
Column Description
Address bus Displays the stored value of the address buss.
Instruction Displays the instruction.
Mnemonic Displays the mnemonic.
Data bus Displays the stored content of the data bus.
Control signals Displays the stored value of the control signals during storage.Bit 1: Instruction fetchBit 2: Byte/WordBit 3: Interrupt requestBit 4: CPU offBit 5: The value of the Power Up Clear (PUC) signalBit 6:ZERO|HALT (which one depends on the used device)Bit 7: Break trigger
Table 37: Columns in State Storage window
U430-2
Part 7. IAR C-SPY FET Debugger 213

214
Emulator menu
SEQUENCER DIALOG BOX
The Sequencer dialog box—available from the Emulator menu—lets you break the execution or trigger the state storage module by using a more complex method than a standard breakpoint. This is useful if you want to start the state storage module under certain conditions, for instance a specific program flow. The sequencer is only available if you are using a device that supports the Enhanced Emulation Module.
The sequencer works as a state machine. In a simple setup, you can define three transition triggers, where the final triggers an action.
In an advanced setup, the state machine can have four states (0-3). State 0 is the starting state, and state 3 is the state, which triggers a breakpoint. This breakpoint can be designed either to stop execution, or to trigger the state storage module.
For each state you can define up to two different transitions (a-b) to other states. For each transition you define a transition trigger and which the next state should be. For state 3 you must also define an action: stop the execution or start the state storage module.
Figure 81: Sequencer dialog box
To enable the sequencer, select the option Enable Sequencer. From the eight available hardware breakpoints (0-7) of the device, the breakpoint number 7 will be reserved for state 3.
U430-2
MSP430 IAR Embedded Workbench™ IDEUser Guide

C-SPY FET Debugger options and menus
The Transition trigger drop-down lists let you define one breakpoint each, where the breakpoint should act as a transition trigger.
To define an advanced setup, select the option Use advanced setup. This will let you define 4 states (0-3) with two transition triggers each (a and b). For each transition trigger, you can define which state should be the next state after the transition.
Use the following options:
Finally, you must define an action. This option defines the result of the final transition trigger. If you select the option Break, the execution will stop. If you select the option Trigger, the state storage module will be triggered.
The command Reset States will set the state machine to state 0. Current state shows the current state of the state machine.
Trigger Triggers to move the state machine from one state to another. Select a breakpoint from the drop-down list. Note: to do this you must first define the required EEM breakpoints.
Next state Defines which state should be the next state after the transition. Select one state, out of four, from the drop-down list.
U430-2
Part 7. IAR C-SPY FET Debugger 215

216
Emulator menu
U430-2
MSP430 IAR Embedded Workbench™ IDEUser Guide
Design considerations for in-circuit programmingThis chapter describes the design considerations related to the bootstrap loader, device signals, and external power for in-circuit programming. This chapter also describes how you can adapt your own target hardware to be run with C-SPY.
Bootstrap loaderThe JTAG pins provide access to the flash memory of the MSP430F device. On some devices, these pins must be shared with the device port pins, and this sharing of pins can complicate a design (or it may simply not be possible to do so). As an alternative to using the JTAG pins, MSP430F devices contain a program—a bootstrap loader—that permits the flash memory to be easily erased and programmed, using a reduced set of signals.
Device signalsThe following device signals should be made accessible so that the FET and PRGS (serial programming adapter) tools can be utilized:
RST/NMI, TMS, TCK, TDI, TDO, GND, VCC, and TEST (if present).
Note: Connections to XIN and XOUT are not required, and should not be made. PRGS software Version 1.10 or later must be used.
The BSL tool requires the following device signals: RST/NMI, TCK, GND, VCC, P1.1, P2.2, and TEST (if present).
External powerThe PC parallel port is capable of sourcing a limited amount of current. Owing to the ultralow power requirement of the MSP430, a stand-alone FET does exceed the available current. However, if additional circuitry is added to the tool, this current limit could be exceeded. In this case, external power can be supplied to the tool via connections provided on the MSP-FET430X110 and the Target Socket modules. Refer to Figure 82, JTAG signal connection (MSP-FET430X110) to locate the external power connections.
U430-2
Part 7. IAR C-SPY FET Debugger 217

218
Signal connections for in-system programming
When an MSP-FET430X110 is powered from an external supply, an on-board device regulates the external voltage to the level required by the MSP430.
When a Target Socket module is powered from an external supply, the external supply powers the device on the Target Socket module and any user circuitry connected to the Target Socket module, and the FET Interface module continues to be powered from the PC via the parallel port. If the externally supplied voltage differs from that of the FET Interface module, the Target Socket module must be modified so that the externally supplied voltage is routed to the FET Interface module (so that it may adjust its output voltage levels accordingly). For details of the Target Socket module schematic, see the documentation supplied by the chip manufacturer.
Signal connections for in-system programmingWith the proper connections, you can use the C-SPY debugger and the MSP-FET430X110, as well as the MSP-FET430Pxx0 ('P120, 'P140, 'P410, 'P440), to program and debug code on your own target board. In addition, the connections will support the MSP430 Serial Programming Adapter (PRGS), thus providing an easy way to program prototype boards, if desired.
Note: The XLINK linker can be configured to output objects in msp430-txt format for use with the PRGS. Choose Project>Options and click the Output tab in the Xlink category. Select the option Other and then msp430-txt from the Output format drop-down list. Intel and Motorola formats can also be used.
MSP-FET430X110
Figure 82, JTAG signal connection (MSP-FET430X110), shows the connections between the FET and the target device required to support in-system programming and debugging using C-SPY. If your target board has its own “local” power supply, such as a battery, do not connect Vcc to pin 2 of the JTAG header. Otherwise, contention may occur between the FET and your local power supply.
The figure shows a 14-pin header (available from Digi-Key, p/n MHB14K-ND), being used for the connections on your target board. It is recommended that you build a wiring harness from the FET with a connector which mates to the 14-pin header, and mount the 14-pin header on your target board. This will allow you to unplug your target board from the FET as well as use the Serial Programming Adapter to program prototype boards, if desired.
The signals required are routed on the FET to header locations for easy accessibility. Refer to the hardware documentation for more details.
U430-2
MSP430 IAR Embedded Workbench™ IDEUser Guide
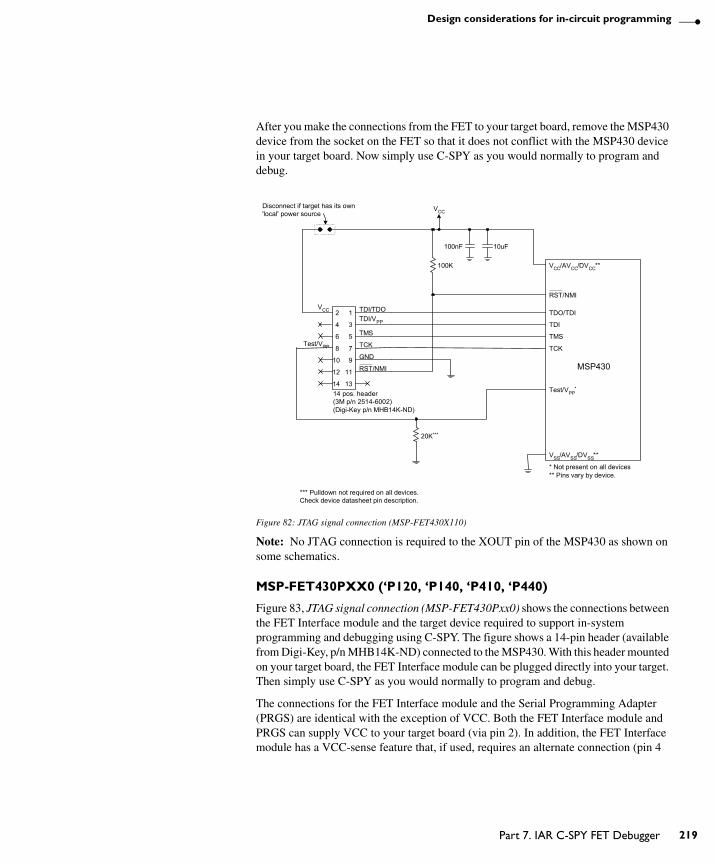
Design considerations for in-circuit programming
After you make the connections from the FET to your target board, remove the MSP430 device from the socket on the FET so that it does not conflict with the MSP430 device in your target board. Now simply use C-SPY as you would normally to program and debug.
Figure 82: JTAG signal connection (MSP-FET430X110)
Note: No JTAG connection is required to the XOUT pin of the MSP430 as shown on some schematics.
MSP-FET430PXX0 (‘P120, ‘P140, ‘P410, ‘P440)
Figure 83, JTAG signal connection (MSP-FET430Pxx0) shows the connections between the FET Interface module and the target device required to support in-system programming and debugging using C-SPY. The figure shows a 14-pin header (available from Digi-Key, p/n MHB14K-ND) connected to the MSP430. With this header mounted on your target board, the FET Interface module can be plugged directly into your target. Then simply use C-SPY as you would normally to program and debug.
The connections for the FET Interface module and the Serial Programming Adapter (PRGS) are identical with the exception of VCC. Both the FET Interface module and PRGS can supply VCC to your target board (via pin 2). In addition, the FET Interface module has a VCC-sense feature that, if used, requires an alternate connection (pin 4
TDI/TDO1
13
11
9
7
5
3
2
14
12
10
8
6
4
VCC
GND
TCK
TMS
TDI/VPP
Test/VPP
RST/NMI
10uF100nF
100K
TDO/TDI
VCC/AVCC/DVCC**
RST/NMI
TCK
TMS
TDI
Test/VPP*
MSP430
VSS/AVSS/DVSS**
VCC
14 pos. header(3M p/n 2514-6002)(Digi-Key p/n MHB14K-ND)
Disconnect if target has its own'local' power source
20K***
* Not present on all devices
*** Pulldown not required on all devices.Check device datasheet pin description.
** Pins vary by device.
U430-2
Part 7. IAR C-SPY FET Debugger 219
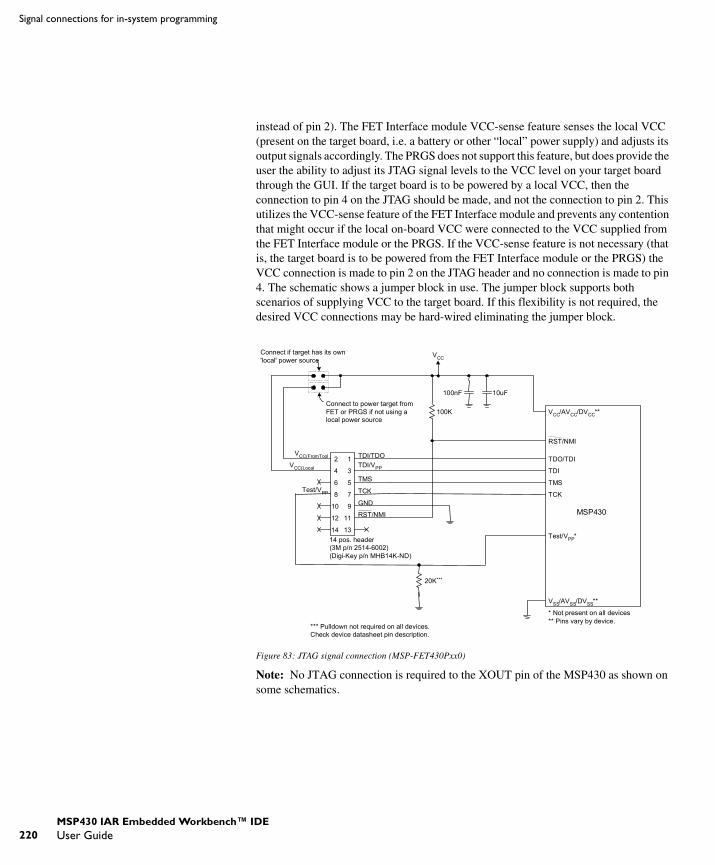
220
Signal connections for in-system programming
instead of pin 2). The FET Interface module VCC-sense feature senses the local VCC (present on the target board, i.e. a battery or other “local” power supply) and adjusts its output signals accordingly. The PRGS does not support this feature, but does provide the user the ability to adjust its JTAG signal levels to the VCC level on your target board through the GUI. If the target board is to be powered by a local VCC, then the connection to pin 4 on the JTAG should be made, and not the connection to pin 2. This utilizes the VCC-sense feature of the FET Interface module and prevents any contention that might occur if the local on-board VCC were connected to the VCC supplied from the FET Interface module or the PRGS. If the VCC-sense feature is not necessary (that is, the target board is to be powered from the FET Interface module or the PRGS) the VCC connection is made to pin 2 on the JTAG header and no connection is made to pin 4. The schematic shows a jumper block in use. The jumper block supports both scenarios of supplying VCC to the target board. If this flexibility is not required, the desired VCC connections may be hard-wired eliminating the jumper block.
Figure 83: JTAG signal connection (MSP-FET430Pxx0)
Note: No JTAG connection is required to the XOUT pin of the MSP430 as shown on some schematics.
TDI/TDO1
13
11
9
7
5
3
2
14
12
10
8
6
4
VCC(FromTool
GND
TCK
TMS
TDI/VPP
Test/VPP
VCC(Local
RST/NMI
10uF100nF
100K
TDO/TDI
RST/NMI
TCK
TMS
TDI
Test/VPP*
MSP430
VCC/AVCC/DVCC**
VSS/AVSS/DVSS**
VCCConnect if target has its own'local' power source
Connect to power target fromFET or PRGS if not using alocal power source
14 pos. header(3M p/n 2514-6002)(Digi-Key p/n MHB14K-ND)
20K***
* Not present on all devices
*** Pulldown not required on all devices.Check device datasheet pin description.
** Pins vary by device.
U430-2
MSP430 IAR Embedded Workbench™ IDEUser Guide

Part 8. Reference informationThis part of the MSP430 IAR Embedded Workbench™ IDE User Guide contains the following chapters:
� IAR Embedded Workbench IDE reference
� C-SPY Debugger IDE reference
� General options
� Compiler options
� Assembler options
� XLINK options
� XAR options
� Custom build options
� C-SPY options
� C-SPY macros reference.
U430-2
221

222
U430-2

IAR Embedded Workbench IDE referenceThis chapter contains reference information about the windows, menus, menu commands, and their components which are found in the IAR Embedded Workbench IDE. Information about how to best use the Embedded Workbench for your purposes can be found in parts 3 to 7 in this book.
The IAR Embedded Workbench IDE is a modular application. What menus are available depends on which components you have installed.
WindowsThese are the available windows:
� IAR Embedded Workbench IDE window� Workspace window� Editor window� Messages window
In addition, a set of C-SPY-specific windows become available when you start the IAR C-SPY Debugger. Reference information about these windows can be found in the chapter C-SPY Debugger IDE reference in this book.
U430-2
Part 8. Reference information 223

224
Windows
IAR EMBEDDED WORKBENCH IDE WINDOW
The figure shows the main window of the IAR Embedded Workbench IDE and its different components. The window might look different depending on which plug-in modules you are using.
Figure 84: IAR Embedded Workbench IDE window
Each window item is explained in greater detail in the following sections.
Menu bar
Gives access to the IAR Embedded Workbench IDE menus.
Status bar
ToolbarMenu bar
Workspace window
Editorwindow
Menu Description
File The File menu provides commands for opening source and project files, saving and printing, and exiting from the IAR Embedded Workbench IDE.
Table 38: IAR Embedded Workbench IDE menu bar
U430-2
MSP430 IAR Embedded Workbench™ IDEUser Guide

IAR Embedded Workbench IDE reference
For reference information for each menu, see Menus, page 231.
Toolbar
The IAR Embedded Workbench IDE toolbar—available from the View menu—provides buttons for the most useful commands on the IAR Embedded Workbench IDE menus, and a text box for entering a string to do a quick search.
You can display a description of any button by pointing to it with the mouse button. When a command is not available, the corresponding toolbar button will be dimmed, and you will not be able to click it.
This figure shows the menu commands corresponding to each of the toolbar buttons:
Figure 85: IAR Embedded Workbench IDE toolbar
Status bar
The Status bar at the bottom of the window—available from the View menu—displays the status of the IAR Embedded Workbench IDE, and the state of the modifier keys.
Edit The Edit menu provides commands for editing and searching in Editor windows and for editing breakpoints in C-SPY.
View The commands on the View menu allow you to change the information displayed in the IAR Embedded Workbench IDE window.
Project The Project menu provides commands for adding files to a project, creating groups, and running the IAR tools on the current project.
Tools The Tools menu is a user-configurable menu to which you can add tools for use with the IAR Embedded Workbench IDE.
Window The commands on the Window menu allow you to manipulate the IAR Embedded Workbench IDE windows and change their arrangements on the screen.
Help The commands on the Help menu provide help about the IAR Embedded Workbench IDE.
Menu Description
Table 38: IAR Embedded Workbench IDE menu bar (Continued)
New Save Cut Paste
Quick search text box Find Go toOpen Print Copy
Redo
Undo
Replace Compile Stop building
Make Debug
U430-2
Part 8. Reference information 225

226
Windows
As you are editing, the status bar shows the current line and column number containing the insertion point, and the Caps Lock, Num Lock, and Overwrite status:
Figure 86: IAR Embedded Workbench IDE window status bar
WORKSPACE WINDOW
The workspace window shows the name of the current workspace and a tree representation of the projects, groups and files included in the workspace.
Figure 87: Project window
The drop-down list at the top of the window lets you choose a build configuration to display in the window for a specific project.
At the bottom of the window you can choose which project to display. Alternatively, you can choose to display an overview of the entire workspace.
U430-2
MSP430 IAR Embedded Workbench™ IDEUser Guide
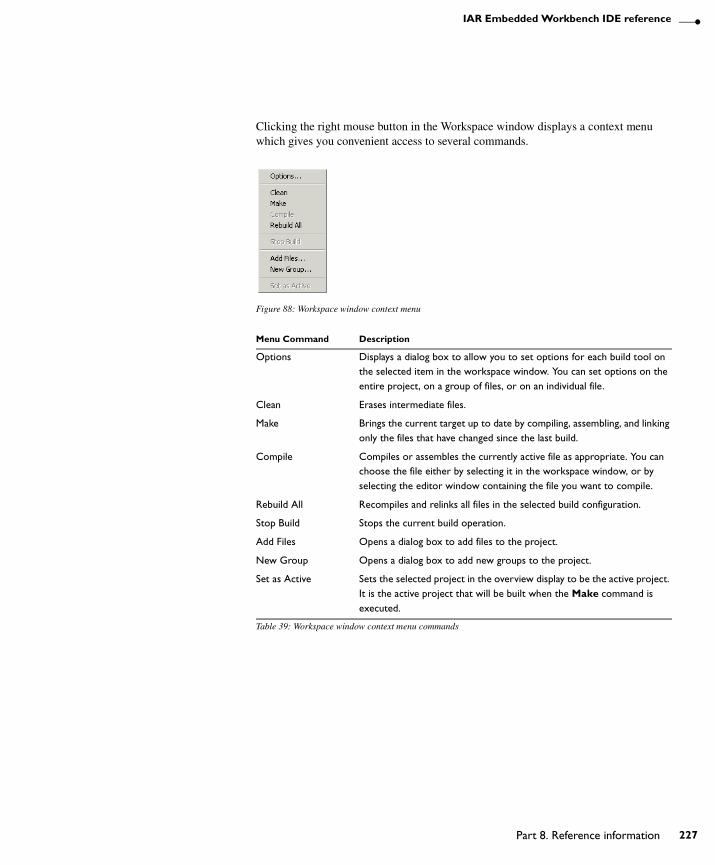
IAR Embedded Workbench IDE reference
Clicking the right mouse button in the Workspace window displays a context menu which gives you convenient access to several commands.
Figure 88: Workspace window context menu
Menu Command Description
Options Displays a dialog box to allow you to set options for each build tool on the selected item in the workspace window. You can set options on the entire project, on a group of files, or on an individual file.
Clean Erases intermediate files.
Make Brings the current target up to date by compiling, assembling, and linking only the files that have changed since the last build.
Compile Compiles or assembles the currently active file as appropriate. You can choose the file either by selecting it in the workspace window, or by selecting the editor window containing the file you want to compile.
Rebuild All Recompiles and relinks all files in the selected build configuration.
Stop Build Stops the current build operation.
Add Files Opens a dialog box to add files to the project.
New Group Opens a dialog box to add new groups to the project.
Set as Active Sets the selected project in the overview display to be the active project. It is the active project that will be built when the Make command is executed.
Table 39: Workspace window context menu commands
U430-2
Part 8. Reference information 227

228
Windows
EDITOR WINDOW
Source files are displayed in Editor windows. The IAR Embedded Workbench IDE editor automatically recognizes the syntax of assembler and C or Embedded C++ programs, and displays the different components of the program in different text styles.
Figure 89: Editor window
For information about how to change these styles, see Customizing the editor environment, page 94.
Title bar
Shows the name of the open source file.
The text (Read Only) appears after the file name if the file is a read-only file
An * after the file name indicates that the file has been modified after it was last saved.
Split commands
The Window>Split command—alternatively the Splitter controls—lets you split the editor window, horizontally or vertically into multiple panes.
Go to function
The Go to function button in the bottom left corner in the editor window lets you display all functions in the C or Embedded C++ editor window. You can then choose to go directly to one of them.
Splitter control
Splitter control
Bookmark
Go to function
with modificationTitle bar
indicator
U430-2
MSP430 IAR Embedded Workbench™ IDEUser Guide

IAR Embedded Workbench IDE reference
Source file paths
The IAR Embedded Workbench IDE supports relative source file paths to a certain degree.
If a source file is located in the project file directory or in any subdirectory of the project file directory, the IAR Embedded Workbench IDE will use a path relative to the project file when accessing the source file.
Editor key summary
The following tables summarize the editor’s keyboard commands.
Use the following keys and key combinations for moving the insertion point:
Use the following keys and key combinations for scrolling text:
Use the following key combinations for selecting text:
To move the insertion point Press
One character left Arrow left
One character right Arrow right
One word left Ctrl+Arrow left
One word right Ctrl+Arrow right
One line up Arrow up
One line down Arrow down
To the start of the line Home
To the end of the line End
To the first line in the file Ctrl+Home
To the last line in the file Ctrl+End
Table 40: Editor keyboard commands for insertion point navigation
To scroll Press
Up one line Ctrl+Arrow up
Down one line Ctrl+Arrow down
Up one page Page Up
Down one page Page Down
Table 41: Editor keyboard commands for scrolling
To select Press
The character to the left Shift+Arrow left
The character to the right Shift+Arrow right
Table 42: Editor keyboard commands for selecting text
U430-2
Part 8. Reference information 229

230
Windows
MESSAGES WINDOW
The Messages window—available from the View menu—shows the output from different IAR Embedded Workbench IDE tools.
Figure 90: Messages window
The window is divided into multiple pages:
One word to the left Shift+Ctrl+Arrow left
One word to the right Shift+Ctrl+Arrow right
To the same position on the previous line Shift+Arrow up
To the same position on the next line Shift+Arrow down
To the start of the line Shift+Home
To the end of the line Shift+End
One screen up Shift+Page Up
One screen down Shift+Page Down
To the beginning of the file Shift+Ctrl+Home
To the end of the file Shift+Ctrl+End
Pages Description
Build The messages generated when building a project. Double-clicking a message in the Build page opens the appropriate file for editing, with the insertion point at the correct position.
Find in Files Displays the output from the Edit>Find in Files command. Double-clicking an entry in the page opens the appropriate file with the insertion point positioned at the correct location.
Table 43: Pages on Messages window
To select Press
Table 42: Editor keyboard commands for selecting text (Continued)
U430-2
MSP430 IAR Embedded Workbench™ IDEUser Guide

IAR Embedded Workbench IDE reference
Pressing the right mouse button in the Messages window displays a context menu which allows you to copy, select, and clear the contents of the window.
Figure 91: Messages window context menu
MenusThe following menus are available in the IAR Embedded Workbench:
� File menu� Edit menu� View menu� Project menu� Tools menu� Window menu� Help menu.
In addition, a set of C-SPY-specific menus become available when you start the IAR C-SPY Debugger. Reference information about these menus can be found in the chapter C-SPY Debugger IDE reference in this book.
FILE MENU
The File menu provides commands for opening workspaces and source files, saving and printing, and exiting from the IAR Embedded Workbench IDE.
Tool Output Displays any messages output by user-defined tools in the Tools menu, provided that you have specified the option Redirect to Output Window in the Configure Tools dialog box; see Configure Tools dialog box, page 255.
Pages Description
Table 43: Pages on Messages window (Continued)
U430-2
Part 8. Reference information 231

232
Menus
The menu also includes a numbered list of the most recently opened files and projects to allow you to open one by selecting its name from the menu.
Figure 92: File menu
Menu command Description
New CTRL+N Displays a dialog box to let you create a new workspace, or a new text file.
Open CTRL+O Displays a dialog box to let you select a text or workspace file to open. Opening a new workspace file automatically saves and closes any currently open workspaces.
Close Closes the active window.You will be warned if a text document has changed since it was last saved, and given the opportunity to save it before closing. You will be prompted whether to save the project. If the workspace has been modified you will be prompted whether to save it.
Open Workspace Displays a dialog box to let you open a workspace file. Opening a new workspace file automatically saves and closes any currently open workspace file.
Save Workspace Saves the current workspace file.
Save CTRL+S Saves the current text file or workspace file.
Save As Displays a dialog box to let you save the current file with a new name.
Save All Saves all open text documents and workspace files.
Page Setup Displays a dialog box to let you set printer options.
Print CTRL+P Displays a dialog box to let you print a text document.
Table 44: File menu commands
U430-2
MSP430 IAR Embedded Workbench™ IDEUser Guide

IAR Embedded Workbench IDE reference
EDIT MENU
The Edit menu provides several commands for editing and searching.
Figure 93: Edit menu
Recent Files Displays a submenu to let you quickly open the most recently opened text documents.
Recent Workspaces
Displays a submenu to let you quickly open the most recently opened workspace files.
Exit Exits from the IAR Embedded Workbench IDE. You will be asked whether to save any changes to text windows before closing them. Changes to the project are saved automatically.
Menu command Description
Undo CTRL+Z Undoes the last edit made to the current editor window.
Redo CTRL+Y Redoes the last Undo in the current editor window.You can undo and redo an unlimited number of edits independently in each editor window.
Table 45: Edit menu commands
Menu command Description
Table 44: File menu commands (Continued)
U430-2
Part 8. Reference information 233
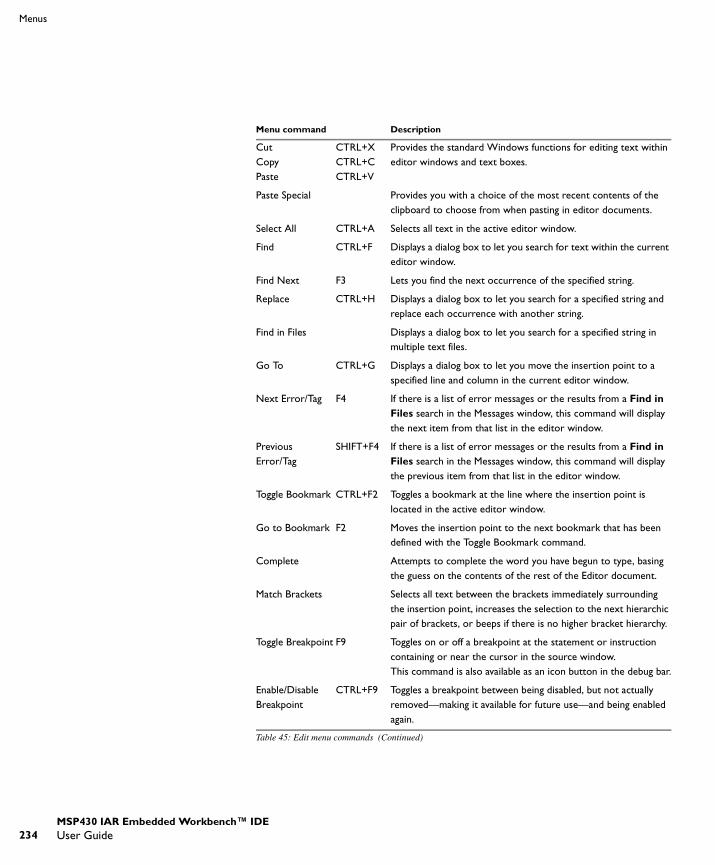
234
Menus
Cut CopyPaste
CTRL+XCTRL+CCTRL+V
Provides the standard Windows functions for editing text within editor windows and text boxes.
Paste Special Provides you with a choice of the most recent contents of the clipboard to choose from when pasting in editor documents.
Select All CTRL+A Selects all text in the active editor window.
Find CTRL+F Displays a dialog box to let you search for text within the current editor window.
Find Next F3 Lets you find the next occurrence of the specified string.
Replace CTRL+H Displays a dialog box to let you search for a specified string and replace each occurrence with another string.
Find in Files Displays a dialog box to let you search for a specified string in multiple text files.
Go To CTRL+G Displays a dialog box to let you move the insertion point to a specified line and column in the current editor window.
Next Error/Tag F4 If there is a list of error messages or the results from a Find in Files search in the Messages window, this command will display the next item from that list in the editor window.
Previous Error/Tag
SHIFT+F4 If there is a list of error messages or the results from a Find in Files search in the Messages window, this command will display the previous item from that list in the editor window.
Toggle Bookmark CTRL+F2 Toggles a bookmark at the line where the insertion point is located in the active editor window.
Go to Bookmark F2 Moves the insertion point to the next bookmark that has been defined with the Toggle Bookmark command.
Complete Attempts to complete the word you have begun to type, basing the guess on the contents of the rest of the Editor document.
Match Brackets Selects all text between the brackets immediately surrounding the insertion point, increases the selection to the next hierarchic pair of brackets, or beeps if there is no higher bracket hierarchy.
Toggle Breakpoint F9 Toggles on or off a breakpoint at the statement or instruction containing or near the cursor in the source window.This command is also available as an icon button in the debug bar.
Enable/Disable Breakpoint
CTRL+F9 Toggles a breakpoint between being disabled, but not actually removed—making it available for future use—and being enabled again.
Menu command Description
Table 45: Edit menu commands (Continued)
U430-2
MSP430 IAR Embedded Workbench™ IDEUser Guide

IAR Embedded Workbench IDE reference
Find dialog box
The Find dialog is available from the Edit menu.
Replace dialog box
The Replace dialog is available from the Edit menu.
Breakpoints Opens a dialog box, where you can create, edit, and remove breakpoints.
Option Description
Find What Selects the text to search for.
Match Whole Word Only To find the specified text only if it occurs as a separate word. Otherwise specifying int will also find print, sprintf etc.
Match Case To find only occurrences that exactly match the case of the specified text. Otherwise specifying int will also find INT and Int.
Incremental Search To gradually fine-tune or expand the search by changing the search string continuously.
Up or Down To specify the direction of the search.
Find Next To find the next occurrence of the selected text.
Table 46: Find dialog box options
Option Description
Find What Selects the text to search for.
Replace With Selects the text to replace each found occurrence in the Replace With box.
Match Whole Word Only To find the specified text only if it occurs as a separate word. Otherwise int will also find print, sprintf etc.
Match Case To find only occurrences that exactly match the case of the specified text. Otherwise specifying int will also find INT and Int.
Find Next To find the next occurrence of the text you have specified.
Replace To replace the searched text with the specified text.
Replace All To replace all occurrences of the searched text in the current editor window.
Table 47: Replace dialog box options
Menu command Description
Table 45: Edit menu commands (Continued)
U430-2
Part 8. Reference information 235

236
Menus
Find in Files dialog box
The Find in Files dialog is available from the Edit menu.
The result of the search appears in the Messages window. You can then go to each occurrence by double-clicking the messages. This opens the corresponding file in an editor window with the insertion point positioned at the start of the specified text. A blue flag in the left-most margin indicates the line.
Option Description
Search String Selects the string to search for.
Match Case To find only occurrences that exactly match the case of the specified text. Otherwise specifying int will also find INT and Int.
Match Whole Word To find the specified text only if it occurs as a separate word. Otherwise int will also find print, sprintf etc.
Look in Standard file navigation.
File name Selects the file to search.
Files of type File type filter.
File Groups Filter for which files to search. If the option Selected Files is chosen, you should manually select the files to search by adding them to the Selected Files list.
Selected Files List of selected files to search.
Add Adds the selected file to the Selected Files list.
Add All Adds multiple files to the Selected Files list.
Remove Removes a selected file from the Selected Files list.
Remove All Removes multiple files from the Selected Files list.
Find Proceed with the search.
Table 48: Find in Files dialog box options
U430-2
MSP430 IAR Embedded Workbench™ IDEUser Guide

IAR Embedded Workbench IDE reference
Breakpoints dialog box
The Breakpoints dialog is available from the Edit menu.
Figure 94: Breakpoints dialog box
To define a breakpoint you should first click a breakpoint tab and then specify a set of options:
� Break At� Access type (only for Data and Immediate breakpoints)� Condition (only for Code and Data breakpoints)� Action (optional).
The breakpoints you define appear in the list at the bottom of the dialog box.
U430-2
Part 8. Reference information 237
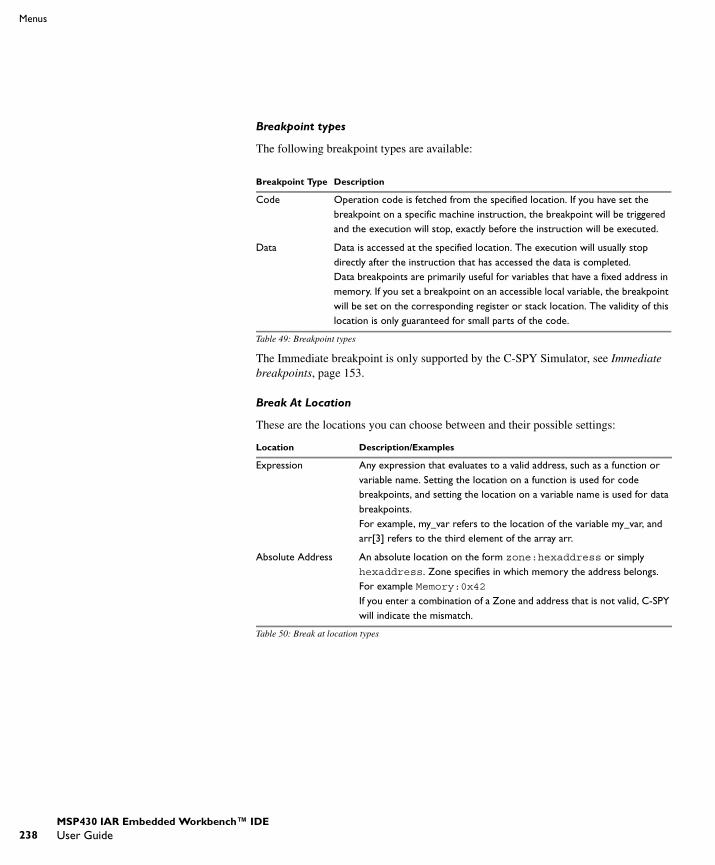
238
Menus
Breakpoint types
The following breakpoint types are available:
The Immediate breakpoint is only supported by the C-SPY Simulator, see Immediate breakpoints, page 153.
Break At Location
These are the locations you can choose between and their possible settings:
Breakpoint Type Description
Code Operation code is fetched from the specified location. If you have set the breakpoint on a specific machine instruction, the breakpoint will be triggered and the execution will stop, exactly before the instruction will be executed.
Data Data is accessed at the specified location. The execution will usually stop directly after the instruction that has accessed the data is completed.Data breakpoints are primarily useful for variables that have a fixed address in memory. If you set a breakpoint on an accessible local variable, the breakpoint will be set on the corresponding register or stack location. The validity of this location is only guaranteed for small parts of the code.
Table 49: Breakpoint types
Location Description/Examples
Expression Any expression that evaluates to a valid address, such as a function or variable name. Setting the location on a function is used for code breakpoints, and setting the location on a variable name is used for data breakpoints.For example, my_var refers to the location of the variable my_var, and arr[3] refers to the third element of the array arr.
Absolute Address An absolute location on the form zone:hexaddress or simply hexaddress. Zone specifies in which memory the address belongs.For example Memory:0x42If you enter a combination of a Zone and address that is not valid, C-SPY will indicate the mismatch.
Table 50: Break at location types
U430-2
MSP430 IAR Embedded Workbench™ IDEUser Guide

IAR Embedded Workbench IDE reference
Access Type
You can specify the type of memory access that triggers data or immediate breakpoints.
Note: Data and Immediate breakpoints never break execution within a single instruction. They are recorded and reported after the instruction is executed.
Conditions
You can specify simple and complex conditions to code and data breakpoints.
Source Location A location in the C source program using the syntax {file path}.row.column
File specifies the filename and full path. Row specifies the row in which you want the breakpoint. Column specifies the column in which you want the breakpoint. Note that the Source Location type is only meaningful for code breakpoints.For example, {C:\IAR Systems\xxx\Utilities.c}.22.3 sets a breakpoint on the third character position on line 22 in the source file Utilities.c.
Memory Access type Description
Read/Write Read or write from location (not available for immediate breakpoints).
Read Read from location.
Write Write to location.
Table 51: Memory access types
Conditions Description
Expression A valid expression conforming to the C-SPY expression syntax.
Condition true The breakpoint is triggered if the value of the expression is true.
Condition changed The breakpoint is triggered if the value of the expression has changed since it was last evaluated.
Skip count The number of times that the breakpoint must be fulfilled before a break occurs (integer).
Table 52: Breakpoint conditions
Location Description/Examples
Table 50: Break at location types (Continued)
U430-2
Part 8. Reference information 239

240
Menus
Action
You can connect an action to a breakpoint. You specify an optional expression, for instance a macro function, which is evaluated when the breakpoint is triggered and the condition is true.
VIEW MENU
The commands on the View menu let you choose what to display in the IAR Embedded Workbench window. During a debug session you can also open debugger-specific windows from the View menu.
Figure 95: View menu
Menu Command Description
Messages Opens the Messages window that displays messages and text output from the IAR Embedded Workbench commands. If the window is already open it becomes the current window.
Toolbars The submenus Main and Debug toggle the two toolbars on and off.
Status bar Toggles the status bar on and off.
Debugger windows During a debugging session, the different debugging windows are also available from the View menu:Dedicated editor windowDisassembly windowMemory windowRegister windowWatch windowLocals windowCall Stack windowLog windowTerminal I/O windowCode Coverage windowProfiling windowTraceStack.For descriptions of these windows, see page 261 and onwards.
Table 53: View menu commands
U430-2
MSP430 IAR Embedded Workbench™ IDEUser Guide

IAR Embedded Workbench IDE reference
PROJECT MENU
The Project menu provides commands for working with workspaces, projects, groups, and files, as well as specifying options for the build tools, and running the tools on the current project.
Figure 96: Project menu
Menu Command Description
Add Files Displays a dialog box that lets you select which files to include to the current project.
New Group Displays a dialog box to let you create a new group. The Group Name text box specifies the name of the new group. The Add to Target list selects the targets to which the new group should be added. By default the group is added to all targets.
Add a New Project to the Workspace
Displays a dialog box to let you create a new project and add it to the workspace.
Insert Project into the Workspace
Displays a dialog box to let you add an existing project to the workspace.
Options Displays a dialog box to let you set options for the build tools on the selected item in the workspace window. You can set options on the entire project, on a group of files, or on an individual file.
Clean Removes any intermediate files.
Make Brings the current build configuration up to date by compiling, assembling, and linking only the files that have changed since the last build.
Table 54: Project menu commands
U430-2
Part 8. Reference information 241

242
Menus
Argument variables summary
Variables can be used for paths and arguments. The following argument variables can be used:
Compile Compiles or assembles the currently active file as appropriate. You can choose the file either by selecting it in the workspace window, or by selecting the editor window containing the file you want to compile.
Rebuild All Rebuilds and relinks all files in the current target.
Configurations Displays a dialog box to let you define new build configurations
Stop Build Stops the current build operation.
Debug Starts the IAR C-SPY Debugger so that you can debug the project object file. If necessary, a make will be performed before running C-SPY to ensure the project is up to date. Depending on your IAR product installation, you can choose which debugger drive to use by selecting appropriate C-SPY driver on the C-SPY Setup page available by using the Project>Options command.
Variable Description
$CUR_DIR$ Current directory
$CUR_LINE$ Current line
$EW_DIR$ Top directory of the IAR Embedded Workbench, for example c:\program files\iar systems\embedded workbench 3.n
$EXE_DIR$ Directory for executable output
$FILE_BNAME$ File name without extension
$FILE_BPATH$ Full path without extension
$FILE_DIR$ Directory of active file, no file name
$FILE_FNAME$ File name of active file without path
$FILE_PATH$ Full path of active file (in Editor, Project, or Message window)
$LIST_DIR$ Directory for list output
$OBJ_DIR$ Directory for object output
$PROJ_DIR$ Project directory
$PROJ_FNAME$ Project file name without path
$PROJ_PATH$ Full path of project file
Table 55: Argument variables
Menu Command Description
Table 54: Project menu commands (Continued)
U430-2
MSP430 IAR Embedded Workbench™ IDEUser Guide

IAR Embedded Workbench IDE reference
Options dialog box
The Options dialog box is available from the Project menu.
The Category list lets you select for which build tool to set options for. The options available in the Category list will depend on the tools installed in your IAR Embedded Workbench IDE, and will typically include the following options:
Selecting a category displays one or more pages of options for that component of the IAR Embedded Workbench IDE.
For detailed information about each option, see the option chapters.
$TARGET_DIR$ Directory of primary output file
$TARGET_FNAME$ Filename without path of primary output file
$TARGET_PATH$ Full path of primary output file
$TOOLKIT_DIR$ Directory of the active product, for example c:\program files\iar systems\embedded workbench 3.n\430
Category Description
General General options
ICC430 MSP430 IAR C/EC++ Compiler options
A430 MSP430 IAR Assembler options
XLINK IAR XLINK Linker™ options
Custom Build Options for extending the tool chain
C-SPY IAR C-SPY™ Debugger options
Table 56: Project option categories
Variable Description
Table 55: Argument variables (Continued)
U430-2
Part 8. Reference information 243

244
Menus
TOOLS MENU
The Tools menu provides commands for customizing the environment, such as changing common fonts and shortcut keys.
It is a user-configurable menu to which you can add tools for use with the IAR Embedded Workbench. Thus, it may look different depending on which tools have been preconfigured to appear as menu items. See Configure Tools dialog box, page 255.
Figure 97: Tools menu
Tools menu commands
Menu command Description
Options Displays a dialog box to allow you to customize the IAR Embedded Workbench IDE. Select the feature you want to customize by clicking the appropriate tab. Which pages that are available in this dialog box depends on your IAR Embedded Workbench IDE configuration, and whether the IDE is in a debugging session or not
Configure Tools Displays a dialog box to allow you to set up the interface to use external tools.
File Extensions Displays a set of dialog boxes to let you define the filename extensions to be accepted by the build tools.
XLIB Starts the IAR XLIB Librarian.
Notepad User-configured.
Table 57: Tools menu commands
U430-2
MSP430 IAR Embedded Workbench™ IDEUser Guide

IAR Embedded Workbench IDE reference
External Editor page
The External Editor page—available by choosing Tools>Options—lets you specify an external editor.
Figure 98: External Editor page with command line settings
Options
Option Description
Use External Editor Enables the use of an external editor.
Type Selects the method for interfacing with the external editor. The type can be either Command Line or DDE (Windows Dynamic Data Exchange).
Editor Enter the file name and path of your external editor. A browse button is available for your convenience.
Arguments Enter any arguments to pass to the editor. Only applicable if you have selected Type as Command Line.
Service Enter the DDE service name used by the editor. Only applicable if you have selected Type as DDE.
Command Enter a sequence of command strings to send to the editor. The command strings should be entered as: DDE-Topic CommandString
DDE-Topic CommandString
Only applicable if you have selected Type as DDE.
Table 58: External Editor options
U430-2
Part 8. Reference information 245

246
Menus
The service name and command strings depend on the external editor that you are using. Refer to the user documentation of your external editor to find the appropriate settings.
Note: Variables can be used in arguments. See Argument variables summary, page 242, for information about the argument variables that are available.
Common fonts page
The Common Fonts page—available by choosing Tools>Options—displays the fonts used for all project windows except for the editor windows.
Figure 99: Common Fonts page
The Font buttons lets you change the fixed and proportional width fonts, respectively.
Any changes to the Fixed Width Font options will apply to the Disassembly, Register, and Memory windows. Any changes to the Proportional Width Font options will apply to all other windows.
None of the settings made on this page applies to the editor windows. For information about how to change the font in the editor windows, see Customizing the editor environment, page 94.
U430-2
MSP430 IAR Embedded Workbench™ IDEUser Guide

IAR Embedded Workbench IDE reference
Key Bindings page
The Key Bindings page—available by choosing Tools>Options—displays the shortcut keys used for each of the menu options, and lets you change them.
Figure 100: Key Bindings page
Options
It is not possible to set or add the shortcut if it is already used by another command.
To remove a shortcut key, select the corresponding menu command in the scroll list and click Clear under Primary or Alias. To revert all command shortcut keys to the factory settings, click Reset All. Click OK to make the new shortcut key bindings take effect.
Option Description
Category Drop-down menu to select the menu you want to edit. Any currently defined shortcut keys are shown in the scroll list below.
Press shortcut key Type the key combination you want to use as shortcut key.
Primary Shortcut key will be displayed next to the command on the menu. Click Set to set the combination, or Clear to remove the shortcut key.
Alias Shortcut key will work but not be displayed on the menu. Click either Add to make the key take effect, or Clear to remove the shortcut key.
Reset All Reverts all command shortcut keys to the factory settings.
Table 59: Key Bindings page options
U430-2
Part 8. Reference information 247

248
Menus
Editor page
The Editor page—available by choosing Tools>Options—lets you change the editor options.
Figure 101: Editor page
Options
Option Description
Tab Size Specifies the number of character spaces corresponding to each tab.
Indent Size Specifies the number of character spaces to be used for indentation.
Tab Key Function Specifies how the tab key is used. Either as Insert Tab or as Indent with Spaces.
EOL character Selects line break character.PC (default) uses Windows and DOS end of line character.Unix uses UNIX end of line characters.Preserve uses the same end of line character as the file had when it was read from the disc drive. The PC format is used by default, and if the read file did not have any breaks, or if there is a mixture of break characters used in the file.
Syntax Highlighting Displays the syntax of C or Embedded C++ programs in different text styles.
Table 60: Editor page options
U430-2
MSP430 IAR Embedded Workbench™ IDEUser Guide

IAR Embedded Workbench IDE reference
For more information about the IAR Embedded Workbench IDE Editor and how it can be used, see the chapter Editing.
Editor Colors and Fonts page
The Editor Colors and Fonts page—available by choosing Tools>Options—allows you to specify the colors and fonts used for text in the Editor windows.
Figure 102: Editor Colors and Fonts page
Auto Indent Ensures that when you insert a line, the new line will automatically have the same indentation as the previous line.
Show Line Numbers Displays line numbers in the Editor window.
Scan for Changed Files Checks if files have been modified by some other tool and automatically reloads them. If a file has been modified in the IAR Embedded Workbench IDE, you will be prompted first.
Show Bookmarks Displays compiler errors, lines found with the Find in Files command, and user bookmarks.
Enable Virtual Space Allows the insertion point to move outside the text area.
Custom Keyword File Lets you select a text file containing keywords for which you want the editor to use a special syntax highlighting.
Use Default Size Lets you set the default size of editor windows.
Option Description
Table 60: Editor page options (Continued)
U430-2
Part 8. Reference information 249

250
Menus
Options
The keywords controlling syntax highlighting for assembler and C or Embedded C++ source code are specified in the files syntax_icc.cfg and syntax_asm.cfg, respectively. These files are located in the config directory.
Project page
The Project page—available by choosing Tools>Options—lets you set options for Make and Build. The following table gives the options, and the alternative settings for each option.
Figure 103: Projects page
Option Description
Font Opens a dialog box to choose font and its size.
Syntax Coloring Lists the possible items for which you can specify font and style of syntax. The elements you can customize are: C or Embedded C++, compiler keywords, assembler keywords, and user-defined keywords.
Color Lets you choose color from a list of colors.
Type Style Lets you choose type style from a drop-down list.
Sample Displays the current setting.
Table 61: Editor Colors and Fonts page options
U430-2
MSP430 IAR Embedded Workbench™ IDEUser Guide

IAR Embedded Workbench IDE reference
Options
Option Description
Stop build operation on Lets you choose when build operation should stop.Never: Do not Stop. Warnings: Stop on warnings and errors.Errors: Stop on errors.
Save editor windows on build Always: Always save before Make or Build.Ask: Prompt before saving.Never: Do not save.
Make before debugging Always: Always Make before debugging. Ask: Always prompt before Making. Never: Do not Make.
Reload las project at startup Select this option if you want the last active project to load automatically the next time you start the IAR Embedded Workbench.
Play a sound after build operations
Plays a sound when the build operations are finished.
Table 62: Project page options
U430-2
Part 8. Reference information 251

252
Menus
Messages page
The Messages page—available by choosing Tools>Options—lets you choose the amount of output in the Messages window.
Figure 104: Messages page
Options
Option Description
Show build messages Lets you choose amount of output in the Messages window.All: Show all messages. Include compiler and linker information.Messages: Show messages, warnings, and errors.Warnings: Show warnings and errors. Errors: Show errors only.
Table 63: Messages page options
U430-2
MSP430 IAR Embedded Workbench™ IDEUser Guide

IAR Embedded Workbench IDE reference
Debugger page
The Debugger page—available by choosing Tools>Options—lets you use a dedicated editor window for debugging purposes. This can be very convenient if your project contains many source files.
Figure 105: Debugger page
Options
Option Description
Use a dedicated editor window for debugging
Lets you choose to have a dedicated editor window, instead of having one editor window per file. The dedicated editor window is closed after leaving the debug session.
Show the same source code in editor window
The source code you saw when stopping the debug session is still visible after leaving the debug session, so that you can edit the source directly.
Just close the dedicated window
Restores the workspace to what it was before the debug session was started
Table 64: Debugger page options
U430-2
Part 8. Reference information 253

254
Menus
Register Filter page
The Register Filter page—available by choosing Tools>Options when the IAR C-SPY Debugger is running—lets you choose to display registers in the Register window in groups you have created yourself. See Register groups, page 131, for more information about how to create register groups.
Figure 106: Register Filter page
Options
Option Description
Use register filter Enables the usage of register filters.
Filter Files Displays a dialog box to let you select or create a new filter file.
Groups Lists available groups in the register filter file, alternatively displays the new register group.
New Group Lets you enter a name for the new register group.
Group members Lists the registers selected from the register scroll bar window.
Base Lets you change default integer base.
Table 65: Register Filter options
U430-2
MSP430 IAR Embedded Workbench™ IDEUser Guide

IAR Embedded Workbench IDE reference
Configure Tools dialog box
The Configure Tools dialog box—available from the Tools menu—lets you specify a user-defined tool to add to the Tools menu.
Figure 107: Configure Tools dialog box
Options
Option Description
Menu Content Lists all available user defined menu commands.
Menu Text Specifies the text for the menu command. By adding the sign &, the following letter, N in this example, will the appear as the mnemonic key for this command. The text you write in this field will be reflected in the Menu Content field.
Command Specifies the command, and its path, to be run when you select the command from the menu. A browse button is available for your convenience.
Argument Optionally enter an argument for the command.
Initial Directory Specifies an initial working directory for the tool.
Table 66: Configure Tools dialog box options
U430-2
Part 8. Reference information 255

256
Menus
Note: Variables can be used in the arguments, allowing you to set up useful tools such as interfacing to a command line revision control system, or running an external tool on the selected file.
You can remove a command from the Tools menu by selecting it in this list and clicking Remove.
Click OK to confirm the changes you have made to the Tools menu.
The menu items you have specified will then be displayed on the Tools menu.
Figure 108: Customized Tools menu
Specifying command line commands or batch files
Command line commands or batch files need to be run from a command shell, so to add these to the Tools menu you need to specify an appropriate command shell in the Command text box. These are the command shells that can be entered as commands:
Redirect to Output window Specifies any console output from the tool to the Tool Output page in the Messages window. Tools that are launched with this option cannot receive any user input, for instance input from the keyboard.Tools that require user input or make special assumptions regarding the console that they execute in, will not work at all if launched with this option.
Prompt for Command Line Displays a prompt for the command line argument when the command is selected from the Tools menu.
Tool Available Lets you decide in which context the tool should be available, only when debugging or only when not debugging.
System Command shell
Windows 98/Me command.com
Windows NT/2000/XP cmd.exe (recommended) or command.com
Table 67: Command shells
Option Description
Table 66: Configure Tools dialog box options (Continued)
U430-2
MSP430 IAR Embedded Workbench™ IDEUser Guide

IAR Embedded Workbench IDE reference
File Extensions dialog box
The File Extensions dialog box—available from the Tools menu—lets you customize the filename extensions recognized by the build tools. This is useful if you have many source files that have a different filename extension.
If you have an IAR Embedded Workbench for a different microcontroller installed on your host computer, it can appear in the Tool Chain box. In that case you should select the tool chain you want to customize.
Figure 109: File Extensions dialog box
Note the * sign which indicates that there are user-defined overrides. If there is no * sign, factory settings are used.
Click Edit to open the File Extension Overrides dialog box.
U430-2
Part 8. Reference information 257
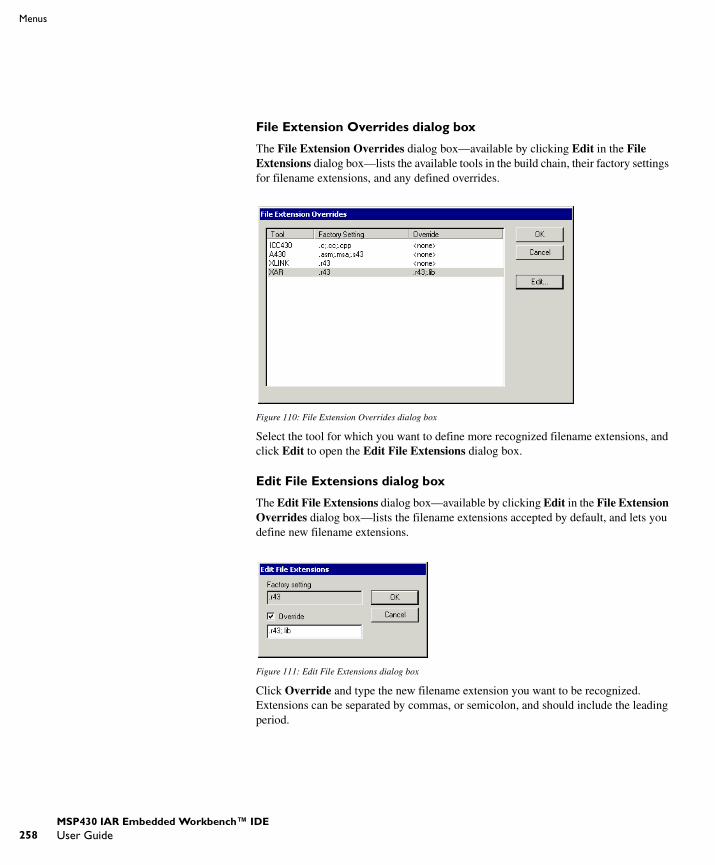
258
Menus
File Extension Overrides dialog box
The File Extension Overrides dialog box—available by clicking Edit in the File Extensions dialog box—lists the available tools in the build chain, their factory settings for filename extensions, and any defined overrides.
Figure 110: File Extension Overrides dialog box
Select the tool for which you want to define more recognized filename extensions, and click Edit to open the Edit File Extensions dialog box.
Edit File Extensions dialog box
The Edit File Extensions dialog box—available by clicking Edit in the File Extension Overrides dialog box—lists the filename extensions accepted by default, and lets you define new filename extensions.
Figure 111: Edit File Extensions dialog box
Click Override and type the new filename extension you want to be recognized. Extensions can be separated by commas, or semicolon, and should include the leading period.
U430-2
MSP430 IAR Embedded Workbench™ IDEUser Guide
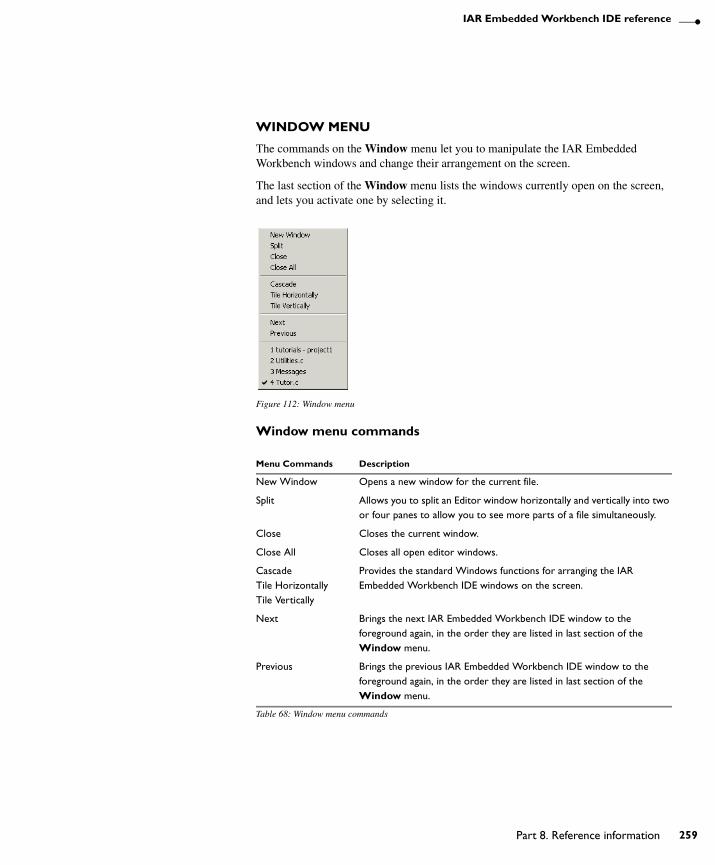
IAR Embedded Workbench IDE reference
WINDOW MENU
The commands on the Window menu let you to manipulate the IAR Embedded Workbench windows and change their arrangement on the screen.
The last section of the Window menu lists the windows currently open on the screen, and lets you activate one by selecting it.
Figure 112: Window menu
Window menu commands
Menu Commands Description
New Window Opens a new window for the current file.
Split Allows you to split an Editor window horizontally and vertically into two or four panes to allow you to see more parts of a file simultaneously.
Close Closes the current window.
Close All Closes all open editor windows.
CascadeTile HorizontallyTile Vertically
Provides the standard Windows functions for arranging the IAR Embedded Workbench IDE windows on the screen.
Next Brings the next IAR Embedded Workbench IDE window to the foreground again, in the order they are listed in last section of the Window menu.
Previous Brings the previous IAR Embedded Workbench IDE window to the foreground again, in the order they are listed in last section of the Window menu.
Table 68: Window menu commands
U430-2
Part 8. Reference information 259

260
Menus
HELP MENU
The Help menu provides help about the IAR Embedded Workbench IDE and displays the version numbers of the user interface and of the MSP430 IAR Embedded Workbench IDE.
Menu Command Description
Help Provides access to the IAR Embedded Workbench IDE online help.
Embedded Workbench User Guide Provides access to an online version of this user guide, available in PDF format.
Assembler Reference Guide Provides access to an online version of the MSP430 IAR Assembler Reference Guide, available in PDF format.
C/EC++ Compiler Reference Guide Provides access to an online version of the MSP430 IAR C/EC++ Compiler Reference Guide, available in PDF format.
Linker and Library Tools Reference Guide
Provides access to the online version of the IAR Linker and Library Tools Reference Guide, available in PDF format.
CLIB Library Reference Guide Provides access to the IAR CLIB library documentation, available in PDF format.
DLIB Library Reference Guide, C part Provides access to the ISO/ANSI C library documentation, available in PDF format.
DLIB Library Reference Guide, EC++ part
Provides access to the EC++ library documentation, available in HTML format.
IAR on the Web Allows you to browse the home page, the news page, and the technical notes search page of the IAR website, and to contact IAR Technical Support.
About Clicking the Product info button in the dialog box that opens displays detailed information about the installed IAR products. Copy this information (using the Ctrl+C keyboard shortcut) and include it in your message if you contact IAR Technical Support via electronic mail.
Table 69: Help menu commands
U430-2
MSP430 IAR Embedded Workbench™ IDEUser Guide
C-SPY Debugger IDE referenceThis chapter contains detailed reference information about the windows, menus, menu commands, and their components that are specific for the IAR C-SPY™ Debugger.
C-SPY windowsThe following windows specific to C-SPY are available in the IAR C-SPY debugger:
� IAR C-SPY Debugger window� Dedicated editor window� Disassembly window� Memory window� Register window� Watch window� Locals window� Call Stack window� Log window� Terminal I/O window� Code Coverage window� Profiling window� Trace� Stack window.
EDITING IN C-SPY WINDOWS
The content of the Memory, Register, Watch, and Locals windows is editable.
Use the following keys to edit the contents of the Register and Watch windows:
Key Description
Tab Selects an item.
Return Makes an item editable and saves the new value.
Esc Cancels a new value.
Table 70: Editing in C-SPY windows
U430-2
Part 8. Reference information 261

262
C-SPY windows
IAR C-SPY DEBUGGER WINDOW
The following figure shows the main IAR Embedded Workbench IDE window when you are debugging, using the IAR C-SPY Simulator. The window might look different depending on which components you are using.
Figure 113: Embedded Workbench with C-SPY Simulator started
Each window item is explained in greater detail in the following sections.
Status bar
Project window
Editorwindow
Menu bar
Toolbar
Register window
Log windowWatch
window
U430-2
MSP430 IAR Embedded Workbench™ IDEUser Guide

C-SPY Debugger IDE reference
Menu bar
In addition to the menus available in the development environment, the following menus are available when C-SPY is running:
Debug toolbar
The debug toolbar provides buttons for the most frequently-used commands on the Debug menu.
You can display a description of any button by pointing to it with the mouse pointer. When a command is not available the corresponding button will be dimmed and you will not be able to select it.
The following diagram shows the command corresponding to each button:
Figure 114: C-SPY debug toolbar
Menu Description
Debug The Debug menu provides commands for executing and debugging the source program. Most of the commands are also available as icon buttons in the debug toolbar.
Simulator The Simulator menu provides access to the dialog boxes for setting up interrupt simulation and memory maps. Only available when the C-SPY Simulator is used.
Emulator The Emulator menu provides access to commands specific to the C-SPY FET Debugger.
Table 71: C-SPY menu
Reset
Break
Step over
Step Into
Step Out
Next Statement
Run to Cursor
Go
Toggle Breakpoint
Stop Debugging
U430-2
Part 8. Reference information 263

264
C-SPY windows
DISASSEMBLY WINDOW
The C-SPY Disassembly window—available from the View menu—shows the program being debugged as disassembled program code.
The current position—highlighted in green—indicates the next assembler instruction to be executed. You can move the cursor to any line in the Disassembly window by clicking on the line. Alternatively, you can move the cursor using the navigation keys.
Figure 115: C-SPY Disassembly window
Disassembly window operations
At the top of the window you can find a set of useful text boxes, drop-down lists and command buttons:
Go to memory address
Current position
Breakpoint
Zone display
Toggledisassembly
mode
Operation Description
Go to The memory location you want to view.
Zone display Lists the available memory or register zones to display. Read more about Zones in section Memory zones, page 108.
Disassembly mode Toggles between showing only disassembly or disassembly together with the corresponding source code. Source code requires that the corresponding source file has been compiled with debug information.
Table 72: Disassembly window operations
U430-2
MSP430 IAR Embedded Workbench™ IDEUser Guide

C-SPY Debugger IDE reference
Disassembly context menu
Clicking the right mouse button in the Disassembly window displays a context menu which gives you access to some extra commands.
Figure 116: Disassembly window context menu
Operation Description
Move to PC Displays code at the current program counter location.
Run to Cursor Executes the program from the current position up to the line containing the cursor.
Toggle Breakpoint Toggles a code breakpoint. Assembler instructions at which code breakpoints have been set are highlighted in red.
Enable/Disable Breakpoint Enables and Disables a breakpoint.
Set Next Statement Sets program counter to the location of the insertion point.
Copy Window Contents Copies the selected contents of the Disassembly window to the clipboard.
Table 73: Disassembly context menu commands
U430-2
Part 8. Reference information 265
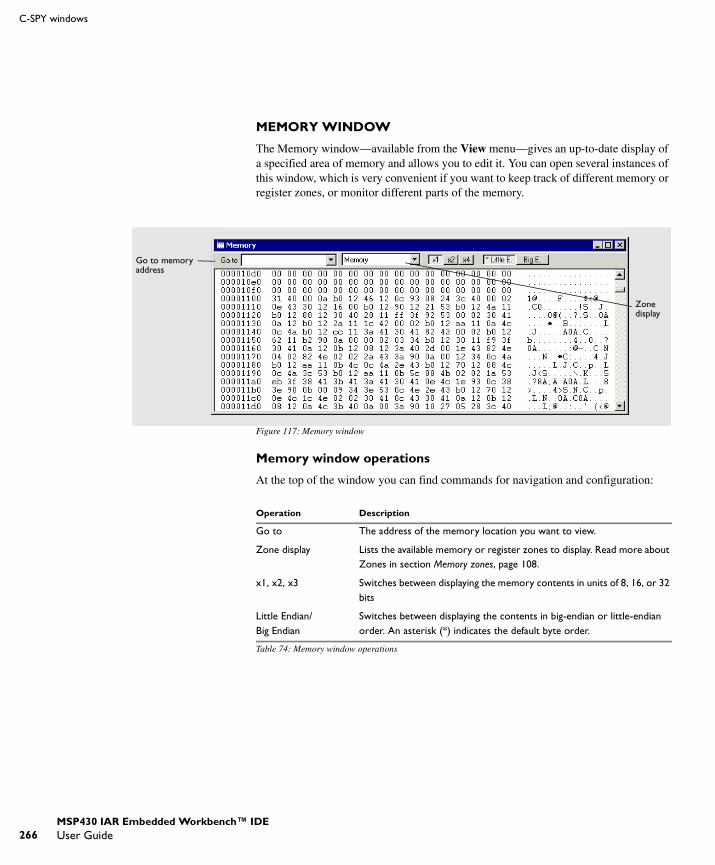
266
C-SPY windows
MEMORY WINDOW
The Memory window—available from the View menu—gives an up-to-date display of a specified area of memory and allows you to edit it. You can open several instances of this window, which is very convenient if you want to keep track of different memory or register zones, or monitor different parts of the memory.
Figure 117: Memory window
Memory window operations
At the top of the window you can find commands for navigation and configuration:
Go to memory address
Zone display
Operation Description
Go to The address of the memory location you want to view.
Zone display Lists the available memory or register zones to display. Read more about Zones in section Memory zones, page 108.
x1, x2, x3 Switches between displaying the memory contents in units of 8, 16, or 32 bits
Little Endian/Big Endian
Switches between displaying the contents in big-endian or little-endian order. An asterisk (*) indicates the default byte order.
Table 74: Memory window operations
U430-2
MSP430 IAR Embedded Workbench™ IDEUser Guide

C-SPY Debugger IDE reference
Memory window context menu
The context menu available in the Memory window provides above commands, edit commands, and a command for opening the Fill dialog box.
Figure 118: Memory window context menu
Fill dialog box
The Fill dialog box—available from the context menu available in the Window memory —lets you fill a specified area of memory with a value.
Figure 119: Fill dialog box
Options
Option Description
Start Address Type the start address—in binary, octal, decimal, or hexadecimal notation.
Length Type the length—in binary, octal, decimal, or hexadecimal notation.
Table 75: Fill dialog options
U430-2
Part 8. Reference information 267

268
C-SPY windows
These are the available memory fill operations:
REGISTER WINDOW
The Register window—available from the View menu—gives an up-to-date display of the contents of the processor registers, and allows you to edit them. When a value changes it becomes highlighted. Some registers are expandable, which means that the register contains interesting bits or sub-groups of bits.
You can open several instances of this window, which is very convenient if you want to keep track of different register groups.
Figure 120: Register window
Zone Select memory zone.
Value Type the value to be used for filling each memory location.
Operation Description
Copy The Value will be copied to the specified memory area.
AND An AND operation will be performed between the Value and the existing contents of memory before writing the result to memory.
XOR An XOR operation will be performed between the Value and the existing contents of memory before writing the result to memory.
OR An OR operation will be performed between the Value and the existing contents of memory before writing the result to memory.
Table 76: Memory fill operations
Option Description
Table 75: Fill dialog options (Continued)
U430-2
MSP430 IAR Embedded Workbench™ IDEUser Guide

C-SPY Debugger IDE reference
You can select which register group to display in the Register window using the drop-down list. To define application-specific register groups, see Defining application-specific groups, page 132.
WATCH WINDOW
The Watch window—available from the View menu—allows you to monitor the values of C-SPY expressions or variables. You can view, add, modify, and remove expressions in the Watch window. Tree structures of arrays, structs, and unions are expandable, which means that you can study each item of these.
Figure 121: Watch window
Every time execution in C-SPY stops, a value that has changed since last stop is highlighted. In fact, every time memory changes, the values in the Watch window are recomputed, including updating the red highlights.
At the bottom of the window there are three tabs which allow you to use three pages for your expressions, which is convenient if there are several expressions you want to monitor.
U430-2
Part 8. Reference information 269

270
C-SPY windows
Watch window context menu
The context menu available in the Watch window provides commands for changing the display format of expressions, as well as commands for adding and removing expressions.
Figure 122: Watch window context menu
The display format setting affects different types of expressions in different ways:.
Your selection of display format is saved between debug sessions.
LOCALS WINDOW
The Locals window—available from the View menu—automatically displays the local variables and function parameters.
Figure 123: Locals window
Variables The display setting affects only the selected variable, not other variables.
Array elements The display setting affects the complete array, that is, same display format is used for each array element.
Structure fields All elements with the same definition—the same field name and C declaration type—are affected by the display setting.
U430-2
MSP430 IAR Embedded Workbench™ IDEUser Guide

C-SPY Debugger IDE reference
Locals window context menu
The context menu available in the Locals window provides commands for changing the display format of expressions.
Figure 124: C-SPY Watch window context menu
Your selection of display format is saved between debug sessions.
CALL STACK WINDOW
The Call stack window—available from the View menu—displays the C function call stack with the current function at the top. To inspect a function call, double click it. C-SPY now focuses on that call frame instead.
Figure 125: Call Stack window
Each entry has the format:
function(values)
where (values) is a list of the current value of the parameters, or empty if the function does not take any parameters.
U430-2
Part 8. Reference information 271

272
C-SPY windows
LOG WINDOW
The Log window—available from the View menu—displays debugger output, such as diagnostic messages and trace information.
Figure 126: Log window
TERMINAL I/O WINDOW
The Terminal I/O window—available from the View menu—lets you enter input to your program, and display output from it. To use this window, you need to link the program with the option Debug info with terminal I/O. C-SPY will then direct stdin, stdout and stderr to this window. If the Terminal I/O window is closed, C-SPY will open it automatically when input is required, but not for output.
Figure 127: Terminal I/O window
Clicking the Input Mode button opens a dialog box that lets you choose whether to input data from the keyboard or from a text file. When a file is used for input, the Terminal I/O window will read one line from the file every time that input is requested. If the program requests more input than the file can provide, the mode will automatically switch to keyboard input when the end of file is reached.
U430-2
MSP430 IAR Embedded Workbench™ IDEUser Guide

C-SPY Debugger IDE reference
CODE COVERAGE WINDOW
The Code Coverage window—available from the View menu—reports the status of the current code coverage analysis, that is, what parts of the code that have been executed at least once since the start of the analysis. The compiler generates detailed stepping information in the form of step points at each statement, as well as at each function call. The report includes information about all modules and functions. It reports the amount of all step points, in percentage, that have been executed and lists all step points that have not been executed up to the point where the program has been stopped. The coverage will continue until turned off.
Figure 128: Code Coverage window
Code coverage commands
In addition to the commands available as icon buttons in the toolbar, clicking the right mouse button in the Code Coverage window displays a context menu that gives you access to these and some extra commands.
Figure 129: Code coverage context menu
Activate Switches code coverage on and off during execution.
Clear Clears the code coverage information. All step points are marked as not executed.
U430-2
Part 8. Reference information 273

274
C-SPY windows
The following icons are used to give you an overview of the current status on all levels:
� A red diamond signifies that 0% of the code has been executed� A green diamond signifies that 100% of the code has been executed� A red and green diamond signifies that some of the code has been executed� A yellow diamond signifies a step point that has not been executed.
For step point lines, the information displayed is the column number range and the row number of the step point in the source window, followed by the address of the step point.
<column start>-<column end>:<row>.
PROFILING WINDOW
The Profiling window—available from the View menu—displays profiling information, that is, timing information for the functions in a program. Profiling must be turned on explicitly using a button in the window’s toolbar, and will stay active until it is turned off.
The profiler measures time at the entry and return of a function. This means that time consumed in a function is not added until the function returns or another function is called. You will only notice this if you are stepping into a function.
Figure 130: Profiling window
Refresh Updates the code coverage information and refreshes the window. All step points that has been executed since the last refresh are removed from the tree.
Auto-refresh Toggles the automatic reload of code coverage information on and off. When turned on, the code coverage information is reloaded automatically when C-SPY stops at a breakpoint, at a step point, and at program exit.
Save As Saves the current code coverage information in a text file.
U430-2
MSP430 IAR Embedded Workbench™ IDEUser Guide

C-SPY Debugger IDE reference
Profiling commands
In addition to the toolbar buttons, the context menu available in the Profiling window gives you access to these and some extra commands:
Figure 131: Profiling context menu
Profiling columns
The Profiling window contains the following columns:
Activate Toggles profiling on and off during execution.
New measurement Starts a new measurement. By clicking the button, the values displayed are reset to zero.
Graph Displays the percentage information for Flat Time and Accumulated Time as graphs (bar charts) or numbers.
Show details Shows more detailed information about the function selected in the list. A window is opened showing information about callers and callees for the selected function.
Refresh Updates the profiling information and refreshes the window.
Auto refresh Toggles the automatic update of profiling information on and off. When turned on, the profiling information is updated automatically when C-SPY stops at a breakpoint, at a step point, and at program exit.
Save As Saves the current profiling information in a text file.
Column Description
Function The name of each function.
Calls The number of times each function has been called.
Flat Time The total time spent in each function in cycles or as a percentage of the total number of cycles, excluding all function calls made from that function.
Table 77: Description of each profiling column
U430-2
Part 8. Reference information 275
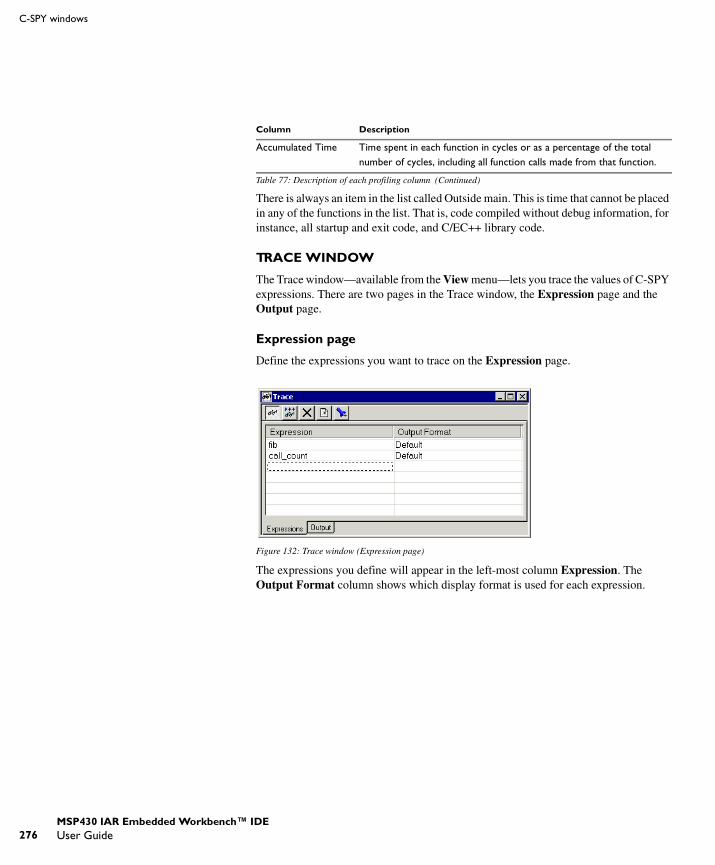
276
C-SPY windows
There is always an item in the list called Outside main. This is time that cannot be placed in any of the functions in the list. That is, code compiled without debug information, for instance, all startup and exit code, and C/EC++ library code.
TRACE WINDOW
The Trace window—available from the View menu—lets you trace the values of C-SPY expressions. There are two pages in the Trace window, the Expression page and the Output page.
Expression page
Define the expressions you want to trace on the Expression page.
Figure 132: Trace window (Expression page)
The expressions you define will appear in the left-most column Expression. The Output Format column shows which display format is used for each expression.
Accumulated Time Time spent in each function in cycles or as a percentage of the total number of cycles, including all function calls made from that function.
Column Description
Table 77: Description of each profiling column (Continued)
U430-2
MSP430 IAR Embedded Workbench™ IDEUser Guide

C-SPY Debugger IDE reference
Output page
The Output page displays the trace buffer which contains the generated trace information. C-SPY generates trace information based on the location of the program counter.
Figure 133: Trace window (Output page)
The column PC displays the current location of the program counter at which the expression was evaluated. Each expression you have defined appears in a separate column. Each entry in this column displays, for the current location of the program counter, the value of the expression.
You can save the trace information to a file and there browse the information conveniently.
Trace toolbar
Command Description
Activate/Deactivate Activates and deactivates the trace function.
Go with Trace The application is executed and the values of expressions are logged continuously for each PC location. During execution, the usual updates of C-SPY windows are suppressed.
Clear Clears the trace buffer.
Toggle Mixed-Mode Displays C and assembler source on the Output page together with values of expressions.Toggles between showing only PC locations and the calculated values, or disassembly together with corresponding source code.
Find Opens the Find dialog box to let you search for PC locations within the trace information.
Table 78: Trace toolbar commands
U430-2
Part 8. Reference information 277

278
C-SPY windows
Trace window context menu
The context menu—available in the Trace window—gives you access to these commands.
Figure 134: Trace window context menu
Your expression definitions and selection of display format are saved between debug sessions.
Command Description
Add Adds an expression.
Modify Modifies an expression.
Remove Removes the selected expression.
Display format Can be one of Default, Binary, Octal, Decimal, Hexadecimal, and Char format.
Remove All Removes all expressions.
Table 79: Trace context commands
U430-2
MSP430 IAR Embedded Workbench™ IDEUser Guide

C-SPY Debugger IDE reference
STACK WINDOW
The Stack window—available from the View menu—displays the MSP430 microcontroller stack.
Figure 135: Stack window
The Stack column displays the value of the stack pointer.
� A green arrow indicates the top of the stack contents� A yellow arrow indicates the stack usage
If the displayed stack depth is smaller than the used stack. The number of bytes that have passed the end of the stack will be indicated.
Operation Description
Stack depth Displays the stack address range, always at least one element before the stack pointer.
Update To make changes take effect or to force a refresh of the window contents.
SP Displays the starting value. SP is the stack pointer name, which can be any known register or symbol name; depends on the selected stack pointer name.
Settings Opens the Stack Settings dialog box
Table 80: Stack window operations
U430-2
Part 8. Reference information 279

280
C-SPY menus
Stack Settings dialog box
The Stack Settings dialog is available from the Stack window.
Figure 136: Stack Settings dialog box
These are the available settings:
C-SPY menusThe following C-SPY specific menus are available in the IAR C-SPY Debugger:
� Debug menu� Simulator menu� Emulator menu.
Settings Description
Stack pointer name The symbol name of the stack pointer. Possible stack pointer names are any available register.
Override default zone Lets you override default zone in case the stack is not located there. This option requires that other zones than the default are defined.
Stack width Width of stack displayed in the Stack window.
Format Selects the display format of the stack contents in the Stack window.
Growing direction Selects the direction in which the stack grows.
Stack usage:Enable usage indicator To be able to track the stack usage, the starting value of the stack
pointer must be entered. Requires data breakpoints in the target system.
Current Selects current stack pointer value.
Table 81: Stack window settings
U430-2
MSP430 IAR Embedded Workbench™ IDEUser Guide

C-SPY Debugger IDE reference
DEBUG MENU
The Debug menu provides commands for executing and debugging your application. Most of the commands are also available as toolbar buttons.
Figure 137: Debug menu
Menu Command Description
Go F5 Executes from the current statement or instruction until a breakpoint or program exit is reached.
Break Stops program execution.
Reset Resets the target processor.
Stop Debugging Stops the debugging session and returns you to the project manager.
Step Over F10 Executes the next statement or instruction, without entering C or Embedded C++ functions or assembler subroutines.
Step Into F11 Executes the next statement or instruction, entering C or Embedded C++ functions or assembler subroutines.
Step Out SHIFT+F11 Executes from the current statement up to the statement after the call to the current function.
Table 82: Description of Debug menu commands
U430-2
Part 8. Reference information 281

282
C-SPY menus
Next Statement If stepping into and out of functions is unnecessarily slow, use this command to step directly to the next statement.
Run to Cursor Executes from the current statement or instruction up to a selected statement or instruction.
Quick Watch Displays a dialog box to allow you to watch the value of a variable or expression and to execute macros.
Refresh Refreshes the contents of the Memory, Register, Watch, and Locals windows.
Set Next Statement Moves the program counter directly to where the cursor is, without executing any source code. Note, however, that this creates an anomaly in the program flow and may have unexpected effects.
Macros Displays the Macro Configuration dialog box to allow you to list, register, and edit your macro files and functions.
Logging>Set Log file Displays a dialog box to allow you to log input and output from C-SPY to a file. You can select the type and the location of the log file. You can choose what you want to log: errors, warnings, system information, user messages, or all of these.
Logging>Set Terminal I/O Log file
Displays a dialog box to allow you to log terminal input and output from C-SPY to a file. You can select the destination of the log file.
Load Layout Loads the specified arrangement of debugger windows from a layout file (*.lew) in the msp430\layouts directory.
Save Layout As Saves the current arrangement of debugger windows in a layout file (*.lew) in the msp430\layouts directory.
Load Default Layout Loads the default arrangement of debugger windows.
Save Current Layout As Default
Saves the current arrangement of debugger windows as the default layout.
Menu Command Description
Table 82: Description of Debug menu commands (Continued)
U430-2
MSP430 IAR Embedded Workbench™ IDEUser Guide

C-SPY Debugger IDE reference
Quick Watch dialog box
The Quick Watch dialog box—available from the Debug menu—lets you watch the value of a variable or expression and evaluate expressions.
Figure 138: Quick Watch dialog box
Type the expression you want to examine in the Expressions text box. Click Recalculate to calculate the value of the expression.
Macro Configuration dialog box
The Macro Configuration dialog box—available by choosing Debug>Macros—lets you list, register, and edit your macro files and functions.
U430-2
Part 8. Reference information 283

284
C-SPY menus
Macro functions that have been registered using the dialog box will be deactivated when you exit the debug session, and will not automatically be registered at the next debug session.
Figure 139: Macro Configuration dialog box
Registering macro files
Select the macro files you want to register in the file selection list, and click Add or Add All to add them to the Selected Macro Files list. Conversely, you can remove files from the Selected Macro Files list using Remove or Remove All.
Once you have selected the macro files you want to use click Register to register them, replacing any previously defined macro functions or variables. Registered macro functions are displayed in the scroll window under Registered Macros. Note that system macros cannot be removed from the list, they are always registered.
Listing macro functions
Selecting All displays all macro functions, selecting User displays all user-defined macros, and selecting System displays all system macros.
U430-2
MSP430 IAR Embedded Workbench™ IDEUser Guide

C-SPY Debugger IDE reference
Clicking on either Name or File under Registered Macros displays the column contents sorted by macro names or by file. Clicking a second time sorts the contents in the reverse order.
Modifying macro files
Double-clicking a user-defined macro function in the Name column automatically opens the file in which the function is defined, allowing you to modify it, if needed.
Log File dialog box
The Log File dialog box—available by choosing Debug>Logging>Set Log File —allows you to log output from C-SPY to a file.
Figure 140: Log File dialog box
Enable or disable logging to the file with the Enable Log file check box.
The information printed in the file is by default the same as the information listed in the Log window. To change the information logged, use the Include options:.
Click the browse button, to override the default file type and location of the log file. Click Save to select the specified file—the default filename extension is log.
Option Description
Errors C-SPY has failed to perform an operation.
Warnings A suspected error.
Info Progress information about actions C-SPY has performed.
User Printouts from C-SPY macros, that is, your printouts using the __message statement.
Table 83: Log file options
U430-2
Part 8. Reference information 285

286
C-SPY menus
Terminal I/O Log File dialog box
The Terminal I/O Log Files dialog box—available by choosing Debug>Logging—allows you to select a destination log file, and to log terminal I/O input and output from C-SPY to this file.
Figure 141: Terminal I/O Log File dialog box
Click the browse button to open a standard Save As dialog box. Click Save to select the specified file—the default filename extension is log.
SIMULATOR MENU
For details of the Simulator menu, see Simulator menu, page 156.
EMULATOR MENU
For details of the Emulator menu, see the section Emulator menu, page 209.
U430-2
MSP430 IAR Embedded Workbench™ IDEUser Guide

General optionsThis chapter describes the general options in the IAR Embedded Workbench™.
The general optionsTo set general options in the IAR Embedded Workbench, choose Project>Options to display the Options dialog box. The Target page in the General category is displayed.
Figure 142: Setting project options
Click the tab corresponding to the type of options you want to view or change. For information about how options can be set, see Setting options, page 85.
The following sections describe each general option.
U430-2
Part 8. Reference information 287

288
Target
TargetThe Target options specify the options Device, Position-independent code, and Hardware multiplier.
Figure 143: Target options
DEVICE
Use the drop-down list to select the device for which you will build your application. The choice of device controls which linker command file and device description file that will be used.
POSITION-INDEPENDENT CODE
Select normal or position-independent code generation. Note that position-independent code will lead to a rather large overhead in code size. For more details of position-independent code, see MSP430 IAR C/EC++ Compiler Reference Guide.
HARDWARE MULTIPLIER
Generates code for the MSP430 hardware multiplier peripheral unit. The option is only enabled when you have chosen a device containing the hardware multiplier from the Device drop-down list.
U430-2
MSP430 IAR Embedded Workbench™ IDEUser Guide

General options
OutputThe Output options let you specify the type of output file—Executable or Library. You can also specify the destination directories for executable files, object files, and list files.
Figure 144: Output options
OUTPUT FILE
The two options Executable and Library lets you decide the type of output file.
If you select the option Executable, XLINK options will be available in the Options dialog box. As a result of the build process, the XLINK Linker will create an application, that is, an executable output file. Before you create the output you should set XLINK options.
If you select the Library option, XAR options will be available in the Options dialog box, and XLINK will disappear from the list of categories. As a result of the build process, the XAR Library Builder will create a library output file. Before you create the library you can set XAR options.
OUTPUT DIRECTORIES
Use these options to specify paths to destination directories. Note that incomplete paths are relative to your project directory.
Executables libraries
Use this option to override the default directory for executable files. Type the name of the directory where you want to save executable files for the project.
U430-2
Part 8. Reference information 289

290
Library
Object files
Use this option to override the default directory for object files. Type the name of the directory where you want to save object files for the project.
List files
Use this option to override the default directory for list files. Type the name of the directory where you want to save list files for the project.
Library
Figure 145: Library options
Use the options IAR DLIB (C/EC++ Library) and IAR CLIB (C Library) to select a runtime library type. Your choice of library will affect a few other options such as include paths for the MSP430 IAR C/EC++ Compiler and IAR XLINK Linker™.
For Embedded C++ projects you must use the IAR DLIB library.
The default is IAR CLIB (C Library). The options Compact math library, Formatted write, and Formatted read lets you configure the IAR CLIB library.
For information about the two libraries and how they can be configured, see MSP430 IAR C/EC++ Compiler Reference Guide.
U430-2
MSP430 IAR Embedded Workbench™ IDEUser Guide

Compiler optionsThis chapter describes how to set compiler options from the IAR Embedded Workbench™, and describes each option.
The compiler optionsTo set compiler options in the IAR Embedded Workbench, choose Project>Options to display the Options dialog box. Then select ICC430 in the Category list to display the compiler options pages:
Figure 146: Compiler options
Click the tab corresponding to the type of options you want to view or change. To restore all settings to the default factory settings, click on the Factory Settings button.
For information about how options can be set, see Setting options, page 85.
The following sections describe each compiler option.
U430-2
Part 8. Reference information 291

292
Language
LanguageThe Language options enable the use of target-dependent extensions to the C or Embedded C++ language.
Figure 147: Compiler language options
ENABLE EMBEDDED C++ SYNTAX
In Embedded C++ mode, the compiler treats the source code as Embedded C++. If Embedded C++ is disabled, the compiler runs in ISO/ANSI C mode, in which features specific to Embedded C++, such as classes and overloading, cannot be utilized.
Embedded C++ requires that the option C/EC++library (DLIB) has been selected.
REQUIRE PROTOTYPES
This option forces the compiler to verify that all functions have proper prototypes. Using this option means that code containing any of the following will generate an error:
� A function call of a function with no declaration, or with a Kernighan & Ritchie C declaration
� A function definition of a public function with no previous prototype declaration� An indirect function call through a function pointer with a type that does not include
a prototype.
ENABLE IAR MIGRATION PREPROCESSOR EXTENSION
If you need to migrate code from an earlier IAR C or C/EC++ compiler, you may want to use this option. With this option, the following can be used in preprocessor expressions:
� Floating-point expressions
U430-2
MSP430 IAR Embedded Workbench™ IDEUser Guide
Compiler options
� Basic type names and sizeof� All symbol names (including typedefs and variables).
Note: If you use this option, not only will the compiler accept code that is not standard conformant, but it will also reject some code that does conform to standard.
Important! Do not depend on these extensions in newly written code. Support for them may be removed in future compiler versions.
For further information about migrating from earlier versions, see the MSP430 IAR C/EC++ Compiler Reference Guide.
LANGUAGE CONFORMANCE
Language extensions must be enabled for the MSP430 IAR C/EC++ Compiler to be able to accept MSP430-specific keywords as extensions to the standard C or Embedded C++ language. In the IAR Embedded Workbench, the option Allow IAR extensions is enabled by default.
The option Relaxed ISO/ANSI disables IAR extensions, but does not adhere to strict ISO/ANSI.
Select the option Strict ISO/ANSI to adhere to the strict ISO/ANSI C standard.
For details about language extensions, see the MSP430 IAR C/EC++ Compiler Reference Guide.
PLAIN 'CHAR' IS
Normally, the compiler interprets the char type as unsigned char. Use this option to make the compiler interpret the char type as signed char instead, for example for compatibility with another compiler.
Note: The runtime library is compiled with unsigned plain characters. If you select the radio button Signed, you may get type mismatch warnings from the linker since the library uses unsigned char.
ENABLE MULTIBYTE SUPPORT
By default, multibyte characters cannot be used in C or Embedded C++ source code. If you use this option, multibyte characters in the source code are interpreted according to the host computer’s default setting for multibyte support.
Multibyte characters are allowed in C and C++ style comments, in string literals, and in character constants. They are transferred untouched to the generated code.
U430-2
Part 8. Reference information 293

294
Code
CodeThe Code options determine the type and level of optimization for generation of object code.
Figure 148: Compiler code options
OPTIMIZATIONS
Size and speed
The MSP430 IAR C/EC++ Compiler supports two optimization models—size and speed—at different optimization levels.
Select the optimization model using either the Size or Speed radio button. Then select the optimization level—None, Low, Medium, or High—from the drop-down list next to the radio buttons.
By default, a debug project will have a size optimization that is fully debuggable, while a release project will have a size optimization that generates an absolute minimum of code.
The following table describes the optimization levels:
Optimization level Description
None Variables live through their entire scope.(Best debug support)
Low Dead code elimination.Redundant label elimination.Redundant branches elimination.
Table 84: Compiler optimization levels
U430-2
MSP430 IAR Embedded Workbench™ IDEUser Guide

Compiler options
ENABLED TRANSFORMATIONS
The MSP430 IAR C/EC++ Compiler supports the following types of transformations:
� Common sub-expression elimination� Loop unrolling� Function inlining� Code motion.
In a debug project, the transformations are by default disabled. You can enable a transformation by selecting its check box. The compiler will then determine if this transformation is feasible.
In a release project, the transformations are by default enabled. You can disable a transformation by deselecting its check box.
Common sub-expression elimination
Redundant re-evaluation of common sub-expressions is by default eliminated at optimization levels Medium and High. This optimization normally reduces both code size and execution time. The resulting code may however be difficult to debug.
Note: This option has no effect at optimization level Low and None.
Loop unrolling
It is possible to duplicate the loop body of a small loop, whose number of iterations can be determined at compile time, to reduce the loop overhead.
This optimization, which can be performed at optimization level High, normally reduces execution time, but increases code size. The resulting code may also be difficult to debug.
The compiler heuristically decides which loops to unroll. Different heuristics are used when optimizing for speed and size.
Medium Live-dead analysis and optimization.Code hoisting.Register content analysis and optimization.Instruction scheduler (when optimizing for speed).
High (Maximum optimization)Peephole optimization.Cross jumping.Cross call (when optimizing for size).
Optimization level Description
Table 84: Compiler optimization levels (Continued)
U430-2
Part 8. Reference information 295

296
Code
Select the Loop unrolling checkbox to enable loop unrolling.
Note: This option has no effect at optimization levels None, Low and Medium.
Function inlining
Function inlining means that a simple function, whose definition is known at compile time, is integrated into the body of its caller to eliminate the overhead of the call. This optimization, which is performed at optimization level High, normally reduces execution time, but increases code size. The resulting code may also be difficult to debug.
The compiler decides which functions to inline. Different heuristics are used when optimizing for speed and size.
Note: This option has no effect at optimization levels None, Low and Medium.
Code motion
Evaluation of loop-invariant expressions and common sub-expressions are moved to avoid redundant reevaluation. This optimization, which is performed at optimization level High, normally reduces code size and execution time. The resulting code may however be difficult to debug.
Note: This option has no effect at optimization levels None, Low and Medium.
ROM-MONITOR-COMPATIBLE CODE
Exclude R4 locks the register R4 for use.
Exclude R5 locks the register R5 for use.
U430-2
MSP430 IAR Embedded Workbench™ IDEUser Guide

Compiler options
OutputThe Output options determine the output format of the compiled file, including the level of debugging information in the object code.
Figure 149: Compiler output options
MAKE LIBRARY MODULE
By default the compiler generates program modules, which are always included during linking. Use this option to make a library module that will only be included if it is referenced in your program.
Select the Make library module option to make the object file be treated as a library module rather than as a program module.
For information about working with libraries, see the XLIB and XAR chapters in the IAR Linker and Library Tools Reference Guide, available from the Help menu.
OBJECT MODULE NAME
Normally, the internal name of the object module is the name of the source file, without a directory name or extension. Use this option to set the object module name explicitly.
First select the Object module name check box, then enter a name in the entry field.
This option is particularly useful when several modules have the same filename, since the resulting duplicate module name would normally cause a linker error; for example, when the source file is a temporary file generated by a preprocessor.
U430-2
Part 8. Reference information 297

298
List
GENERATE DEBUG INFO
This option causes the compiler to include additional information in the object modules that is required by C-SPY™ and other symbolic debuggers.
The Generate debug info option is specified by default. Deselect this option if you do not want the compiler to generate debug information.
Note: The included debug information increases the size of the object files.
ListThe List options determine whether a list file is produced, and the information included in the list file.
Figure 150: Compiler list file options
Normally, the compiler does not generate a list file. Select one of the following options to generate a list file:
The list file will be saved in the List directory, and its filename will consist of the source filename, plus the filename extension lst.
Option Description
Output list file Generates a list file
Assembler mnemonics Includes assembler mnemonics in the list file
Diagnostics Includes diagnostic information in the list file
Output assembler file Generates an assembler list file
Include source Includes source code in the assembler list file
Table 85: Compiler list file options
U430-2
MSP430 IAR Embedded Workbench™ IDEUser Guide

Compiler options
PreprocessorThe Preprocessor options allow you to define symbols and include paths for use by the compiler.
Figure 151: Compiler preprocessor options
INCLUDE PATHS
The Include paths option adds a path to the list of #include file paths. The paths required by the product are specified by default depending on your choice of runtime library.
Enter the full file path of your #include files.
To make your project more portable, use the argument variable $TOOLKIT_DIR$ for the subdirectories of the active product and $PROJ_DIR$ for the directory of the current project. For an overview of the argument variables, see Argument variables summary, page 242.
DEFINED SYMBOLS
The Defined symbols option is useful for conveniently specifying a value or choice that would otherwise be specified in the source file.
Enter the symbols that you want to define for the project.
This option has the same effect as a #define statement at the top of the source file.
U430-2
Part 8. Reference information 299

300
Diagnostics
For example, you could arrange your source to produce either the test or production version of your program depending on whether the symbol TESTVER was defined. To do this you would use include sections such as:
#ifdef TESTVER... ; additional code lines for test version only
#endif
You would then define the symbol TESTVER in the Debug target but not in the Release target.
PREPROCESSOR OUTPUT TO FILE
By default the compiler does not generate preprocessor output.
Select the Preprocessor output to file option if you want to generate preprocessor output. You can also choose to preserve comments and/or to generate #line directives.
DiagnosticsThe Diagnostics options determine how diagnostics are classified and displayed. Use the diagnostics options to override the default classification of the specified diagnostics.
Note: The diagnostics cannot be suppressed for fatal errors, and fatal errors cannot be reclassified.
Figure 152: Compiler diagnostics options
ENABLE REMARKS
The least severe diagnostic messages are called remarks. A remark indicates a source code construct that may cause strange behavior in the generated code.
U430-2
MSP430 IAR Embedded Workbench™ IDEUser Guide

Compiler options
By default remarks are not issued. Select the Enable remarks option if you want the compiler to generate remarks.
SUPPRESS THESE DIAGNOSTICS
This option suppresses the output of diagnostics for the tags that you specify.
For example, to suppress the warnings Pe117 and Pe177, type:
Pe117,Pe177
TREAT THESE AS REMARKS
A remark is the least severe type of diagnostic message. It indicates a source code construct that may cause strange behavior in the generated code. Use this option to classify diagnostics as remarks.
For example, to classify the warning Pe177 as a remark, type:
Pe177
TREAT THESE AS WARNINGS
A warning indicates an error or omission that is of concern, but which will not cause the compiler to stop before compilation is completed. Use this option to classify diagnostic messages as warnings.
For example, to classify the remark Pe826 as a warning, type:
Pe826
TREAT THESE AS ERRORS
An error indicates a violation of the C or Embedded C++ language rules, of such severity that object code will not be generated, and the exit code will not be 0. Use this option to classify diagnostic messages as errors.
For example, to classify the warning Pe117 as an error, type:
Pe117
TREAT ALL WARNINGS AS ERRORS
Use this option to make the compiler treat all warnings as errors. If the compiler encounters an error, object code is not generated.
U430-2
Part 8. Reference information 301

302
Diagnostics
U430-2
MSP430 IAR Embedded Workbench™ IDEUser Guide

Assembler optionsThis chapter first explains how to set the options from the IAR Embedded Workbench™ and then describes each assembler option.
The assembler optionsTo set assembler options in the IAR Embedded Workbench, select Project>Options to display the Options dialog box. Then select A430 in the Category list to display the assembler options pages:
Figure 153: Assembler options
For information about how options can be set, see Setting options, page 85.
The following sections describe each assembler option.
U430-2
Part 8. Reference information 303

304
Code generation
Code generationThe Code generation options control the assembler output.
Figure 154: Assembler code generation options
CASE-SENSITIVE USER SYMBOLS
By default, case-sensitivity is on. This means that, for example, LABEL and label refer to different symbols. You can deselect Case sensitive user symbols to turn case sensitivity off, in which case LABEL and label will refer to the same symbol.
Deselect the Case sensitive user symbols option to turn case sensitivity off.
DISABLE #IFDEF/#ENDIF MATCHING
Use this option to disable the matching between #ifdef and #endif.
MAKE A LIBRARY MODULE
By default, the assembler produces program modules, which are always included during linking. Use this option to make a library module that will only be included if it is referenced in your program.
Select the Make a LIBRARY module option to make the object file be treated as a library module rather than as a program module.
Note: If the NAME directive is used in the source code (to specify the name of the program module), the Make a LIBRARY module option is ignored. This means that the assembler produces a program module regardless of the Make a LIBRARY module option.
U430-2
MSP430 IAR Embedded Workbench™ IDEUser Guide

Assembler options
For information about working with libraries, see the XLIB and XAR chapters in the IAR Linker and Library Tools Reference Guide, available from the Help menu.
MAX NUMBER OF ERRORS
By default, the maximum number of errors reported by the assembler is 100. This option allows you to decrease or increase this number, for example, to see more errors in a single assembly.
WARNINGS
The assembler displays a warning message when it finds an element of the source code that is legal, but probably the result of a programming error.
By default, all warnings are enabled. The Warnings option allows you to enable only some warnings, or to disable all or some warnings.
Use the Warnings radio buttons and entry fields to specify which warnings you want to enable or disable.
For additional information about assembler warnings, see the MSP430 IAR Assembler Reference Guide.
MACRO QUOTE CHARS
The Macro quote chars option sets the characters used for the left and right quotes of each macro argument.
By default, the characters are < and >. This option allows you to change the quote characters to suit an alternative convention or simply to allow a macro argument to contain < or >.
From the drop-down list, select one of four types of brackets to be used as macro quote characters:
Figure 155: Selecting macro quote characters
U430-2
Part 8. Reference information 305

306
Debug
DebugGENERATE DEBUG INFORMATION
The Generate debug information option must be selected if you want to use a debugger with the program. By default, this option is selected in a Debug project, but not in a Release project.
Select File references to generate an object file without source information; symbol information will be available. Select Embedded source to include the full source into the object file.
Figure 156: Assembler debug options
U430-2
MSP430 IAR Embedded Workbench™ IDEUser Guide

Assembler options
#defineThe #define option allows you to define symbols in addition to the predefined symbols in the IAR Assembler.
Figure 157: Assembler defined symbols options
The #define option provides a convenient way of specifying a value or choice that you would otherwise have to specify in the source file.
Enter the symbols you want to define in the #define page, one per line.
For example, you could arrange your source to produce either the test or production version of your program depending on whether the symbol TESTVER was defined. To do this you would use include sections such as:
#ifdef TESTVER... ; additional code lines for test version only#endif
Then, you would select the version required by defining TESTVER as a symbol when specifying assembler options for the project.
Alternatively, your source might use a variable that you need to change often, for example FRAMERATE. You would leave the variable undefined in the source and use the #define option to specify a value for the project, for example FRAMERATE=3.
To remove a defined symbol, select it in the Defined symbols list and press the Delete key.
U430-2
Part 8. Reference information 307

308
List
ListThe List options are used for making the assembler generate a list file, for selecting the list file contents, and generating other listing-type output.
Figure 158: Assembler list file options
By default, the assembler does not generate a list file. Selecting List file causes the assembler to generate a listing and send it to the file sourcename.lst.
Note: If you want to save the list file in another directory than the default directory for list files, use the Output Directories option in the General category; see Output, page 289, for additional information.
INCLUDE HEADER
The header of the assembler list file contains information about the product version, date and time of assembly, and the command line equivalents of the assembler options that were used. Use this option to include the list file header in the list file.
INCLUDE LISTING
Use the suboptions under Include listing to specify which type of information to include in the list file:
Option Description
#included text Includes #include files in the list file.
Active lines only Includes active lines only.
Macro definitions Includes macro definitions in the list file.
Macro expansions Includes macro expansions in the list file.
Table 86: Assembler list file options
U430-2
MSP430 IAR Embedded Workbench™ IDEUser Guide

Assembler options
INCLUDE CROSS-REFERENCE
The Include cross reference option causes the assembler to generate a cross-reference table at the end of the list file. See the MSP430 IAR Assembler Reference Guide for details.
LINES/PAGE
The default number of lines per page is 80 for the assembler list file. Use the Lines/page option to set the number of lines per page, within the range 10 to 150.
TAB SPACING
By default, the assembler sets eight character positions per tab stop. Use the Tab spacing option to change the number of character positions per tab stop, within the range 2 to 9.
#undefThe #undef option allows you to undefine the predefined symbols of the assembler.
Figure 159: Assembler undefined symbols options
Macro execution info Prints macro execution information on every call of a macro.
Assembled lines only Excludes lines in false conditional assembler sections from the list file.
Multiline code Lists the code generated by directives on several lines if necessary.
Option Description
Table 86: Assembler list file options (Continued)
U430-2
Part 8. Reference information 309

310
Include
#UNDEF
By default, the assembler provides certain predefined symbols; see the MSP430 IAR Assembler Reference Guide for more information. The #undef option allows you to undefine such a predefined symbol to make its name available for your own use through a subsequent #define option or source definition.
To undefine a symbol, deselect it in the Predefined symbols list.
IncludeThe Include option allows you to define the include path for the assembler.
Figure 160: Assembler include files options
INCLUDE
The Include option adds paths to the list of #include file paths. The path required by the product is specified by default. Enter the full path of the directories that you want the assembler to search for #include files.
To make your project more portable, use the argument variable $TOOLKIT_DIR$ for the subdirectories of the active product and $PROJ_DIR$ for the directory of the current project. For an overview of the argument variables, see Argument variables summary, page 242.
See the MSP430 IAR Assembler Reference Guide for information about the #include directive.
Note: By default the assembler also searches for #include files in the paths specified in the A430_INC environment variable. We do not, however, recommend the use of environment variables in the IAR Embedded Workbench.
U430-2
MSP430 IAR Embedded Workbench™ IDEUser Guide

XLINK optionsThis chapter describes how to set XLINK options and gives reference information about the options available in the IAR Embedded Workbench. Note that the XLINK command line options that are used for defining segments in a linker command file are described in the IAR Linker and Library Tools Reference Guide.
The XLINK optionsTo set XLINK options in the IAR Embedded Workbench, choose Project>Options to display the Options dialog box. Then select XLINK in the Category list to display the XLINK options pages:
Figure 161: XLINK options
Click the tab corresponding to the type of options you want to view or change. To restore all settings to the default factory settings, click on the Factory Settings button.
For information about how options can be set, see Setting options, page 85.
U430-2
Part 8. Reference information 311

312
Output
The following sections describe each XLINK option.
OutputThe Output options are used for specifying the output format and the level of debugging information included in the output file.
Figure 162: XLINK output file options
OUTPUT FILE
Use Output file to specify the name of the XLINK output file. If a name is not specified the linker will use the name project.d43. If a name is supplied without a file type, the default file type for the selected output format (see Other, page 313) will be used.
Note: If you select a format that generates two output files, the file type that you specify will only affect the primary output file (first format).
Override default
Use this option to specify a filename or filename extension other than the default.
FORMAT
The output options determine the format of the output file generated by the IAR XLINK Linker. The output file is used as input to either a debugger or as input for programming the target system. The IAR Systems proprietary output format is called UBROF, Universal Binary Relocatable Object Format.
U430-2
MSP430 IAR Embedded Workbench™ IDEUser Guide

XLINK options
The default output settings are:
� In a debug project, Debug info with terminal I/O is selected by default� In a release project, msp430-text is selected by default
Note: For debuggers other than C-SPY, check the user documentation supplied with that debugger for information about which format/variant should be used.
Debug info
This option creates a UBROF output file, with a d43 filename extension, to be used with the IAR C-SPY Debugger. Debug information for stop at program exit and support for long jump instructions are included in this output file.
Debug info with terminal I/O
This option is equivalent to the Debug info option but also includes debugging information for terminal I/O when running C-SPY, which means that stdin and stdout are redirected to the Terminal I/O window.
Other
Use this option to generate output other than those generated by the options Debug info and Debug info with terminal I/O.
Use the Output format drop-down list to select the appropriate output. If applicable, use Format variant to select variants available for some of the output formats. The alternatives depend on the output format chosen.
When you specify the Other>Output format option as either debug (ubrof), or ubrof, a UBROF output file with the filename extension dbg will be created. The generated output file will not contain debugging information for simulating facilities such as stop at program exit, long jump instructions, and terminal I/O. If you need support for these facilities during debugging, use the Debug info or Debug info with terminal I/O options instead.
For more information, see the IAR Linker and Library Tools Reference Guide.
Module-local symbols
Use this option to specify whether local (non-public) symbols in the input modules should be included or not by the IAR XLINK Linker. If suppressed, the local symbols will not appear in the listing cross-reference and they will not be passed on to the output file.
You can choose to ignore just the compiler-generated local symbols, such as jump or constant labels. Usually these are only of interest when debugging at assembler level.
U430-2
Part 8. Reference information 313

314
#define
Note: Local symbols are only included in files if they were compiled or assembled with the appropriate option to specify this.
#defineThe #define option allows you to define symbols.
Figure 163: XLINK defined symbols options
DEFINE SYMBOL
Use Define symbol to define absolute symbols at link time. This is especially useful for configuration purposes.
Any number of symbols can be defined in a linker command file. The symbol(s) defined in this manner will be located in a special module called ?ABS_ENTRY_MOD, which is generated by the linker.
XLINK will display an error message if you attempt to redefine an existing symbol.
U430-2
MSP430 IAR Embedded Workbench™ IDEUser Guide

XLINK options
DiagnosticsThe Diagnostics options determine the error and warning messages generated by the IAR XLINK Linker.
Figure 164: XLINK diagnostics options
ALWAYS GENERATE OUTPUT
Use Always generate output to generate an output file even if a non-fatal error was encountered during the linking process, such as a missing global entry or a duplicate declaration. Normally, XLINK will not generate an output file if an error is encountered.
Note: XLINK always aborts on fatal errors, even when this option is used.
The Always generate output option allows missing entries to be patched in later in the absolute output image.
SEGMENT OVERLAP WARNINGS
Use Segment overlap warnings to reduce segment overlap errors to warnings, making it possible to produce cross-reference maps, etc.
NO GLOBAL TYPE CHECKING
Use No global type checking to disable type checking at link time. While a well-written program should not need this option, there may be occasions where it is helpful.
By default, XLINK performs link-time type checking between modules by comparing the external references to an entry with the PUBLIC entry (if the information exists in the object modules involved). A warning is generated if there are mismatches.
U430-2
Part 8. Reference information 315

316
Diagnostics
RANGE CHECKS
Use Range checks to specify the address range check. The following table shows the range check options in the IAR Embedded Workbench:
If an address is relocated outside address range of the target CPU —code, external data, or internal data address—an error message is generated. This usually indicates an error in an assembly language module or in the segment placement.
WARNINGS/ERRORS
By default, the IAR XLINK Linker generates a warning when it detects that something may be wrong, although the generated code may still be correct. The Warnings/Errors options allow you to suppress or enable all warnings, and to change the severity classification of errors and warnings.
Refer to the IAR Linker and Library Tools Reference Guide for information about the different warning and error messages.
Use the following options to control the generation of warning and error messages:
Suppress all warnings
Use this option to suppress all warnings.
Suppress these diagnostics
This option suppresses the output of diagnostics for the tags that you specify.
For example, to suppress the warnings w117 and w177, type w117,w177.
Treat these as warnings
Use this option to specify errors that should be treated as warnings instead. For example, to make error 106 become treated as a warning, enter e106.
Treat these as errors
Use this option to specify warnings that should be treated as errors instead. For example, to make warning 26 become treated as an error, enter w26.
IAR Embedded Workbench Description
Generate errors An error message is generated
Generate warnings Range errors are treated as warnings
Disabled Disables the address range checking
Table 87: XLINK range check options
U430-2
MSP430 IAR Embedded Workbench™ IDEUser Guide

XLINK options
ListThe List options determine the generation of an XLINK cross-reference listing.
Figure 165: XLINK list file options
GENERATE LINKER LISTING
Causes the linker to generate a listing and send it to the file project.map.
Segment map
Use Segment map to include a segment map in the XLINK listing file. The segment map will contain a list of all the segments in dump order.
Symbols
The following options are available:
Lines/page
Sets the number of lines per page for the XLINK listings to lines, which must be in the range 10 to 150.
Option Description
None Symbols will be excluded from the linker listing.
Symbol listing An abbreviated list of every entry (global symbol) in every module. This entry map is useful for quickly finding the address of a routine or data element.
Module map A list of all segments, local symbols, and entries (public symbols) for every module in the program.
Table 88: XLINK list file options
U430-2
Part 8. Reference information 317

318
Include
IncludeThe Include options allow you to set the include path for linker command files, and specify the linker command file.
Figure 166: XLINK include files options
INCLUDE PATHS
The Include paths option specifies the names of the directories which XLINK will search if it fails to find the object files to be linked in the current working directory. Add the full paths of any further directories that you want XLINK to search.
The paths required by the product are specified by default, depending on your choice of runtime library. If the box is left empty, XLINK searches for object files only in the current working directory.
Enter the full file path of your #include files. To make your project more portable, use the argument variable $TOOLKIT_DIR$ for the subdirectories of the active product and $PROJ_DIR$ for the directory of the current project. For an overview of the argument variables, see Argument variables summary, page 242.
LIBRARY
A default library file is selected automatically, based on your choice of IAR CLIB or IAR DLIB runtime library. You can override this by selecting Override default library name, and then specifying an alternative library file.
Ignore CSTARTUP in library
When you select the option Ignore CSTARTUP in library, all modules in the library will be treated as library modules, even if they have not been assembled or compiled as library modules.
U430-2
MSP430 IAR Embedded Workbench™ IDEUser Guide

XLINK options
If you want to include your own version of cstartup.s43 in a project, use this option to prevent the CSTARTUP module in the library from being linked.
You should use this option also when linking projects containing only assembler source files, since the functionality of CSTARTUP only applies to projects containing C/EC++ source files.
XCL FILENAME
A default linker command file is selected automatically for the chosen Target settings in the General category. You can override this by selecting Override default, and then specifying an alternative file.
The argument variables $TOOLKIT_DIR$ or $PROJ_DIR$ can be used here too, to specify a project-specific or predefined linker command file.
InputThe Input options allow you to specify explicitly how input modules are treated when linked.
Figure 167: XLINK input files options
MODULE STATUS
The default status of the input files, whether they are specified as PROGRAM or LIBRARY, is defined in the files themselves.
Inherent
When you select this option, the file will use the status defined in the file itself. Use Inherent to link files normally, and generate output code.
U430-2
Part 8. Reference information 319

320
Input
Inherent, no object code
Use Inherent, no object code to empty-load specified input files; they will be processed normally in all regards by the linker but output code will not be generated for these files.
One potential use for this feature is in creating separate output files for programming multiple EPROMs. This is done by empty-loading all input files except the ones that you want to appear in the output file.
Load as PROGRAM
Use Load as PROGRAM to temporarily force all of the modules within the specified input files to be loaded as if they were all program modules, even if some of the modules have the LIBRARY attribute.
This option is particularly suited for testing library modules before they are installed in a library file, since this option will override an existing library module with the same entries. In other words, XLINK will load the module from the specified input file rather than from the original library.
Load as LIBRARY
Use Load as LIBRARY to temporarily cause all of the modules within the specified input files to be treated as if they were all library modules, even if some of the modules have the PROGRAM attribute. This means that the modules in the input files will be loaded only if they contain an entry that is referenced by another loaded module.
If you have made modifications to CSTARTUP, this option is particularly useful when testing CSTARTUP before you install it in the library file, since this option will override the existing program module CSTARTUP.
U430-2
MSP430 IAR Embedded Workbench™ IDEUser Guide

XLINK options
ProcessingThe Processing options allow you to specify details about how the code is generated.
Figure 168: XLINK processing options
FILL UNUSED CODE MEMORY
Use Fill unused code memory to fill all gaps between segment parts introduced by the linker with the value you enter. The linker can introduce gaps either because of alignment restriction, or at the end of ranges given in segment placement options.
The default behavior, when this option is not used, is that these gaps are not given a value in the output file.
Fill pattern
Use this option to specify size, in hexadecimal notation, of the filler to be used in gaps between segment parts.
Generate checksum
Use Generate checksum to checksum all generated raw data bytes. This option can only be used if the Fill unused code memory option has been specified.
Size specifies the number of bytes in the checksum, which can be 1, 2, or 4.
One of the following algorithms can be used:
Algorithms Description
Arithmetic sum Simple arithmetic sum.
CRC16 CRC16, generating polynomial 0x11021 (default)
Table 89: XLINK checksum algorithms
U430-2
Part 8. Reference information 321

322
Processing
You may also specify that the one’s complement or two’s complement should be used.
By default it is the most significant 1, 2, or 4 bytes (MSB) of the result that will be output, in the natural byte order for the processor. Select LSB from the Bit order drop-down list if you want the least significant bytes to be output.
The CRC checksum is calculated as if the following code was called for each bit in the input, starting with a CRC of 0:
unsigned longcrc(int bit, unsigned long oldcrc){ unsigned long newcrc = (oldcrc << 1) ^ bit; if (oldcrc & 0x80000000) newcrc ^= POLY; return newcrc;}
POLY is the generating polynomial. The checksum is the result of the final call to this routine. If the complement is specified, the checksum is the one’s or two’s complement of the result.
The linker will place the checksum byte(s) at the label __checksum in the segment CHECKSUM. This segment must be placed using the segment placement options like any other segment.
For additional information about segment control, see the IAR Linker and Library Tools Reference Guide.
CRC32 CRC32, generating polynomial 0x104C11DB7.
Crc polynomial CRC with a generating polynomial of the value you enter.
Algorithms Description
Table 89: XLINK checksum algorithms (Continued)
U430-2
MSP430 IAR Embedded Workbench™ IDEUser Guide

XAR optionsThis chapter describes how to set XAR options and gives reference information about the options available in the IAR Embedded Workbench.
The XAR optionsXAR options are not available by default. Before you can set XAR options in the IAR Embedded Workbench, you must add the tool XAR Library Builder to the list of categories. Choose Project>Options to display the Options dialog box, and select the General category. On the Output page, select the option Library.
If you select the Library option, XAR appears as a category in the options dialog box. As a result of the build process, the XAR Library Builder will create a library output file. Before you create the library you can set XAR options.
To set XAR options, select XAR from the category list to display the XAR options.
Figure 169: XAR output options
To restore all settings to the default factory settings, click on the Factory Settings button.
U430-2
Part 8. Reference information 323

324
The XAR options
The option Output file lets you override the default name of the output file. Type a new name in the Override default text box.
For information about how options can be set, see Setting options, page 87.
U430-2
MSP430 IAR Embedded Workbench™ IDEUser Guide

Custom build optionsThis chapter describes how to set custom build options and gives reference information about the options available in the IAR Embedded Workbench.
Custom tool configurationTo set custom build options in the IAR Embedded Workbench, choose Project>Options to display the Options dialog box. Then select Custom Build in the Category list to display the option page:
Figure 170: Custom tool options
The Extensions text box lets you specify what type of files should follow the defined build configuration.
In the Command Line text box, type the command line for executing the external tool.
In the Outputs field, describe the output files that are relevant for the continued building.
U430-2
Part 8. Reference information 325

326
Custom tool configuration
In case there are any files used by the external tool during the build, these should be added in the Inputs/Dependencies field. If the dependency files are modified, the need for a rebuild is sensed.
For an example, see Extending the tool chain, page 88.
U430-2
MSP430 IAR Embedded Workbench™ IDEUser Guide

C-SPY optionsThis chapter describes how to set C-SPY options in the IAR Embedded Workbench™, as well as reference information about the options.
In addition, options specific to the C-SPY FET Debugger are described in the chapter C-SPY FET Debugger options and menus. For information about options specific to the C-SPY ROM-monitor, see the chapter The C-SPY ROM-monitor options.
C-SPY setup optionsTo set C-SPY options in the IAR Embedded Workbench, choose Project>Options to display the Options dialog box. Then select C-SPY in the Category list. The Setup page contains the generic C-SPY options.
Figure 171: Generic C-SPY options
To restore all settings to the default factory settings, click on the Factory Settings button.
The Setup options specify the C-SPY driver, the setup macro file, and device description file to be used, and which default source code location to run to.
DRIVER
Selects the appropriate driver for use with C-SPY, for example a simulator or an emulator.
U430-2
Part 8. Reference information 327

328
C-SPY setup options
The following drivers are currently available:
Contact your distributor or IAR representative, or visit the IAR website at www.iar.com for the most recent information about the available C-SPY drivers.
RUN TO
Use this option to specify a location you want C-SPY to run to when you start the debugger and after a reset.
The default location to run to is the main function. Enter the name of the location if you want C-SPY to run to a different location. You can specify assembler labels or whatever can be evaluated to such, for instance function names.
If you leave the check-box empty the program counter will then contain the regular hardware reset address at each reset.
SETUP MACRO
To register the contents of a setup macro file in the C-SPY startup sequence, select Use setup file and enter the path and name of your setup file, for example, SetupSimple.mac. If no extension is specified, the extension mac is assumed. A browse button is available for your convenience.
DEVICE DESCRIPTION
Use this option to load a device description file that contains various device-specific information such as:
� Memory information for device-specific memory zones� Definitions of memory mapped peripheral units, device-specific CPU registers, and
groups of these� Interrupt definitions, which make interrupt simulation available in the simulator.
Device description files for each MSP430 device are provided in the directory 430\config and have the filename extension ddf.
C-SPY driver Filename
Simulator 430sim.dll
ROM-monitor 430rom.dll
Emulator 430fet.dll
Table 90: C-SPY driver options
U430-2
MSP430 IAR Embedded Workbench™ IDEUser Guide

C-SPY macros referenceThis chapter gives reference information about the C-SPY macros. First a syntax description of the macro language is provided. Then, the available setup macro functions and the pre-defined system macros are summarized. Finally, each system macro is described in detail.
The macro languageThe syntax of the macro language is very similar to the C language. There are macro statements, which are similar to C statements. You can define macro functions, with or without parameters and return value. You can use built-in system macros, similar to C library functions. Finally, you can define global and local macro variables. You can collect your macro functions in a macro file (filename extension mac).
MACRO FUNCTIONS
C-SPY macro functions consist of C-SPY variable definitions and macro statements which are executed when the macro is called. An unlimited number of parameters can be passed to a macro function, and macro functions can return a value on exit.
A C-SPY macro has the following form:
macroName (parameterList){ macroBody}
where parameterList is a list of macro parameters separated by commas, and macroBody is any series of C-SPY variable definitions and C-SPY statements.
Type checking is neither performed on the values passed to the macro functions nor on the return value.
PREDEFINED SYSTEM MACRO FUNCTIONS
The macro language also includes a wide set of predefined system macro functions (built-in functions), similar to C library functions. For detailed information about each system macro, see Description of C-SPY system macros, page 334
U430-2
Part 8. Reference information 329

330
The macro language
MACRO VARIABLES
A macro variable is a variable defined and allocated outside your application space. It can then be used in a C-SPY expression. For detailed information about C-SPY expressions, see the chapter C-SPY expressions, page 117.
The syntax for defining one or more macro variables is:
__var nameList;
where nameList is a list of C-SPY variable names separated by commas.
A macro variable defined outside a macro body has global scope, and keeps its value and type through the whole debugging session. A macro variable defined within a macro body is created when its definition is executed and destroyed on return from the macro.
By default, macro variables are treated as signed integers and initialized to 0. When a C-SPY variable is assigned a value in an expression, it also acquires the type of that expression. For example:
In case of a name conflict between a C symbol and a C-SPY macro variable, C-SPY macro variables have a higher precedence than C variables.
MACRO STATEMENTS
Statements are expected to behave in the same way as the corresponding C statements would do. The following C-SPY macro statements are accepted:
Expressions
expression;
For detailed information about C-SPY expressions, see C-SPY expressions, page 117.
Conditional statements
if (expression) statement
if (expression) statementelse statement
Expression What it means
myvar = 3.5; myvar is now type float, value 3.5.
myvar = (int*)i; myvar is now type pointer to int, and the value is the same as i.
Table 91: Examples of C-SPY macro variables
U430-2
MSP430 IAR Embedded Workbench™ IDEUser Guide

C-SPY macros reference
Loop statements
for (init_expression; cond_expression; update_expression) statement
while (expression) statement
do statementwhile (expression);
Return statements
return;
return expression;
If the return value is not explicitly set, signed int 0 is returned by default.
Blocks
Statements can be grouped in blocks.
{ statement1 statement2 . . . statementN}
Printing messages
The __message statement allows you to print messages while executing a macro function. The value of expression arguments or strings are printed to the Log window. Its definition is as follows:
__message argList;
where argList is a list of C-SPY expressions or strings separated by commas, as in the following example:
var1 = 42;var2 = 37;__message "This line prints the values ", var1, " and ", var2, " in the Log window.";
U430-2
Part 8. Reference information 331

332
Setup macro functions summary
This should produce the following message in the Log window:
This line prints the values 42 and 37 in the Log window.
Overriding default display format of arguments
It is possible to override the default display format of a scalar argument (number or pointer) in argList by suffixing it with a : followed by a format specifier. Available specifiers are %b for binary, %o for octal, %d for decimal, %x for hexadecimal and %c for character. These match the formats available in the Watch and Locals windows, but number prefixes and quotes around strings and characters are not printed. Another example:
__message "The character '", cvar:%c, "' has the decimal value ", cvar;
This could produce:
The character 'A' has the decimal value 65
Note: A character enclosed in single quotes (a character literal) is an integer constant and is not automatically formatted as a character. For example:
__message 'A', " is the numeric value of the character ", 'A':%c;
would produce:
65 is the numeric value of the character A
Writing to a file
There is also a statement __fmessage which is similar to __message, except that the first argument must be a file handle. The output is written to the designated file. For example:
__fmessage myfile, "Result is ", res, "!\n";
Setup macro functions summaryThe following table summarizes the available setup macro functions:
Macro Description
execUserPreload() Called after communication with the target system is established but before downloading the target program. Implement this macro to initialize memory locations and/or registers which are vital for loading data properly.
Table 92: C-SPY setup macros
U430-2
MSP430 IAR Embedded Workbench™ IDEUser Guide

C-SPY macros reference
Note: If you define interrupts or breakpoints in a macro file that is executed at system start (using execUserSetup) we strongly recommend that you also make sure that they are removed at system shutdown (using execUserExit); an example is available in SetupSimple.mac, see Simulating interrupts, page 157.
The reason for this is that the simulator saves breakpoint and interrupt settings between sessions and if they are not removed they will get duplicated every time execUserSetup is executed again. This seriously affects the execution speed.
C-SPY system macros summaryThe following table summarizes the pre-defined system macros:
execUserSetup() Called once after the target program is downloaded.Implement this macro to set up the memory map, breakpoints, interrupts, register macro files, etc.
execUserReset() Called each time the reset command is issued.Implement this macro to set up and restore data.
execUserExit() Called once when the debug session ends. Implement this macro to save status data etc.
Macro Description
Table 92: C-SPY setup macros (Continued)
Macro Description
__cancelAllInterrupts Cancels all ordered interrupts.
__cancelInterrupt Cancels an interrupt.
__clearBreak Clears a breakpoint.
__closeFile Closes a file that was open by __openFile.
__disableInterrupts Disables generation of interrupts.
__driverType Verifies the driver type.
__enableInterrupts Enables generation of interrupts.
__openFile Opens a file for I/O operations.
__orderInterrupt Generates an interrupt.
__readFile Reads from the specified file.
__readFileByte Reads one byte from the specified file.
__readMemoryByte Reads one byte from the specified memory location.
__readMemory8 Reads one byte from the specified memory location.
__readMemory16 Reads two bytes from the specified memorylocation.
Table 93: Summary of system macros
U430-2
Part 8. Reference information 333

334
Description of C-SPY system macros
Description of C-SPY system macros
This section gives reference information about each of the C-SPY system macros.
__cancelAllInterrupts __cancelAllInterrupts()
For details of this macro function, see Description of interrupt system macros, page 164.
__cancelInterrupt __cancelInterrupt(interrupt_id)
For details of this macro function, see Description of interrupt system macros, page 164.
__readMemory32 Reads four bytes from the specified memory location.
__registerMacroFile Registers macros from the specified file.
__resetFile Rewinds a file opened by __openFile.
__setCodeBreak Sets a code breakpoint.
__setDataBreak Sets a data breakpoint.
__setSimBreak Sets a simulation breakpoint.
__strFind Searches a given string for the occurrence of another string.
__subString Extracts a substring from another string.
__toLower Returns a copy of the parameter string where all the characters have been converted to lower case.
__toUpper Returns a copy of the parameter string where all the characters have been converted to upper case.
__writeFile Writes to the specified file.
__writeFileByte Writes one byte to the specified file.
__writeMemoryByte Writes one byte to the specified memory location.
__writeMemory8 Writes one byte to the specified memory location.
__writeMemory16 Writes two bytes to the specified memory location.
__writeMemory32 Writes four bytes to the specified memory location.
Macro Description
Table 93: Summary of system macros (Continued)
U430-2
MSP430 IAR Embedded Workbench™ IDEUser Guide

C-SPY macros reference
__clearBreak __clearBreak(break_id)
Parameter
Return value
int 0
Description
Clears a user-defined breakpoint. For additional information, see Defining breakpoints, page 123.
__closeFile __closeFile(filehandle)
Parameter
Return value
int 0.
Description
Closes a file previously opened by __openFile.
__disableInterrupts __disableInterrupts()
For details of this macro function, see Description of interrupt system macros, page 164.
__driverType __driverType(driver_id)
Parameter
break_id The value returned by any of the set breakpoint macros
filehandle The macro variable used as filehandle by the __openFile macro
driver_id A string corresponding to the driver you want to check for; one of the following:"sim" corresponds to the simulator driver"fet" corresponds to the emulator driver"rom" corresponds to the ROM-monitor driver
U430-2
Part 8. Reference information 335

336
Description of C-SPY system macros
Return value
Description
Checks to see if the current IAR C-SPY Debugger driver is identical to the driver type of the driver_id parameter.
Example
__driverType("sim")
If a simulator is the current driver, the value 1 is returned. Otherwise 0 is returned.
__enableInterrupts __enableInterrupts()
For details of this macro function, see Description of interrupt system macros, page 164.
__openFile __openFile(file, access)
Parameters
Return value
Result Value
Successful 1
Unsuccessful 0
Table 94: __driverType return values
file The filename as a string
access The access type (string); one of the following:"r" ASCII read"w" ASCII write
Result Value
Successful The file handle
Unsuccessful An invalid file handle, which tests as False
Table 95: __openFile return values
U430-2
MSP430 IAR Embedded Workbench™ IDEUser Guide

C-SPY macros reference
Description
Opens a file for I/O operations. The default base directory of this macro is where the currently open project file (*.pew or *.prj) is located. The argument to __openFile can specify a location relative to this directory. In addition, you can use argument variables such as $PROJ_DIR$ and $TOOLKIT_DIR$ in the path argument; see Argument variables summary, page 242.
Example
__var filehandle; /* The macro variable to contain */ /* the file handle */filehandle = __openFile("Debug\\Exe\\test.tst", "r");if (filehandle){ /* successful opening */}
__orderInterrupt __orderInterrupt(specification, activation_time,
repeat_interval, variance, hold_time, probability)
For details of this macro function, see Description of interrupt system macros, page 164.
__readFile __readFile(file, value)
Parameters
Return value
Description
Reads a sequence of hexadecimal digits from the given file and converts them to an unsigned long which is assigned to the value parameter, which should be a pointer to a macro variable.
file A file handle
value A pointer to a macro variable
Result Value
Successful 0
Unsuccessful Non-zero error number
Table 96: __readFile return values
U430-2
Part 8. Reference information 337

338
Description of C-SPY system macros
Example
__var number;if (__readFile(myFile, &number) == 0){ // Do something with number}
__readFileByte __readFileByte(file)
Parameter
Return value
-1 upon error or end-of-file, otherwise a value between 0 and 255.
Description
Reads one byte from the file file.
Example
__var byte;while ( (byte = __readFileByte(myFile)) != -1 ){ // Do something with byte}
__readMemoryByte __readMemoryByte(address, zone)
Parameters
Return value
The macro returns the value from memory.
Description
Reads one byte from a given memory location.
file A file handle
address The memory address (integer)
zone The memory zone name (string); select it from the Memory window drop-down menu
U430-2
MSP430 IAR Embedded Workbench™ IDEUser Guide

C-SPY macros reference
Example
__readMemoryByte(0x0108, "Memory");
__readMemory8 __readMemory8(address, zone)
Parameters
Return value
The macro returns the value from memory.
Description
Reads one byte from a given memory location.
Example
__readMemory8(0x0108, "Memory");
__readMemory16 __readMemory16(address, zone)
Parameters
Return value
The macro returns the value from memory.
Description
Reads two bytes from a given memory location.
Example
__readMemory16(0x0108, "Memory");
address The memory address (integer)
zone The memory zone name (string); select it from the Memory window drop-down menu
address The memory address (integer)
zone The memory zone name (string); select it from the Memory window drop-down menu
U430-2
Part 8. Reference information 339

340
Description of C-SPY system macros
__readMemory32 __readMemory32(address, zone)
Parameters
Return value
The macro returns the value from memory.
Description
Reads four bytes from a given memory location.
Example
__readMemory32(0x0108, "Memory");
__registerMacroFile __registerMacroFile(filename)
Parameter
Return value
int 0
Description
Registers macros from a setup macro file. This function lets you register multiple macro files during C-SPY startup.
For additional information, see Registering and executing using setup macros and setup files, page 139.
Example
__registerMacroFile("c:\\testdir\\macro.mac");
address The memory address (integer)
zone The memory zone name (string); select it from the Memory window drop-down menu
filename A file containing the macros to be registered (string)
U430-2
MSP430 IAR Embedded Workbench™ IDEUser Guide

C-SPY macros reference
__resetFile __resetFile(filehandle)
Parameter
Return value
int 0
Description
Rewinds the file previously opened by __openFile.
__setCodeBreak __setCodeBreak(location, count, condition, cond_type, action)
Parameters
Return value
filehandle The macro variable used as filehandle by the __openFile macro
location A string with a location description. This can be either:A source location on the form {filename}.line.col (for example {D:\\src\\prog.c}.12.9)An absolute location on the form zone:hexaddress or simply hexaddress (for example Memory:0x42)An expression whose value designates a location (for example main)
count The number of times that a breakpoint condition must be fulfilled before a break occurs (integer)
condition The breakpoint condition (string)
cond_type The condition type; either “CHANGED” or “TRUE” (string)
action An expression, typically a call to a macro, which is evaluated when the breakpoint is detected
Result Value
Successful An unsigned integer uniquely identifying the breakpoint. This value must be used to clear the breakpoint.
Unsuccessful 0
Table 97: __setCodeBreak return values
U430-2
Part 8. Reference information 341

342
Description of C-SPY system macros
Description
Sets a code breakpoint, that is, a breakpoint which is triggered just before the processor fetches an instruction at the specified location.
Examples
__setCodeBreak("{D:\\src\\prog.c}.12.9", 3, "d>16", "TRUE", "ActionCode()");
The following example sets a code breakpoint on the label main in your assembler source:
__setCodeBreak("#main", 0, "1", "TRUE", "");
For additional information, see Defining breakpoints, page 123.
__setDataBreak __setDataBreak(location, count, condition, cond_type, access,
action)
Parameters
location A string with a location description. This can be either:A source location on the form {filename}.line.col (for example {D:\\src\\prog.c}.12.9), although this is not very useful for data breakpoints
An absolute location on the form zone:hexaddress or simply hexaddress (for example Memory:0x42)
An expression whose value designates a location (for example my_global_variable).
count The number of times that a breakpoint condition must be fulfilled before a break occurs (integer)
condition The breakpoint condition (string)
cond_type The condition type; either “CHANGED” or “TRUE” (string)
access The memory access type: "R" for read, "W" for write, or "RW" for read/write
action An expression, typically a call to a macro, which is evaluated when the breakpoint is detected
U430-2
MSP430 IAR Embedded Workbench™ IDEUser Guide

C-SPY macros reference
Return value
Description
Sets a data breakpoint, that is, a breakpoint which is triggered directly after the processor has read or written data at the specified location.
This macro is only applicable to the simulator version of C-SPY.
Example
__var brk;brk = __setDataBreak("Memory:0x4710", 3, "d>6", "TRUE", "W", "ActionData()");...__clearBreak(brk);
For additional information, see Defining breakpoints, page 123.
__setSimBreak __setSimBreak(location, access, action)
For details of this macro function, see Immediate breakpoints, page 153.
__strFind __strFind(string, pattern, position)
Parameters
Return value
The position where the pattern was found or -1 if the string is not found.
Description
This macro searches a given string for the occurrence of another string.
Result Value
Successful An unsigned integer uniquely identifying the breakpoint. This value must be used to clear the breakpoint.
Unsuccessful 0
Table 98: __setDataBreak return values
string The string to search in
pattern The string pattern to search for
position The position where to start the search. The first position is 0
U430-2
Part 8. Reference information 343
344
Description of C-SPY system macros
Example
__strFind("Compiler", "pile", 0) = 3__strFind("Compiler", "foo", 0) = -1
__subString __subString(string, position, length)
Parameters
Return value
A substring extracted from the given string.
Description
This macro extracts a substring from another string.
Example
__subString("Compiler", 0, 2) = "Co"__subString("Compiler", 3, 4) = "pile"
__toLower __toLower(string)
Parameter
string is any string.
Return value
The converted string.
Description
This macro returns a copy of the parameter string where all the characters have been converted to lower case.
Example
__toLower("IAR") = "iar"__toLower("Mix42") = "mix42"
string The string from which to extract a substring
position The start position of the substring
length The length of the substring
U430-2
MSP430 IAR Embedded Workbench™ IDEUser Guide

C-SPY macros reference
__toUpper __toUpper(string)
Parameter
string is any string.
Return value
The converted string.
Description
This macro returns a copy of the parameter string where all the characters have been converted to upper case.
Example
__toUpper("string") = "STRING"
__writeFile __writeFile(file, value)
Parameters
Return value
int 0
Description
Prints the integer value in hexadecimal format (with a trailing space) to the file file.
Note: The __fmessage statement can do the same thing. The __writeFile macro is provided for symmetry with __readFile.
__writeFileByte __writeFileByte(file, value)
Parameters
file A file handle
value An integer
file A file handle
value An integer in the range 0-255
U430-2
Part 8. Reference information 345

346
Description of C-SPY system macros
Return value
int 0
Description
Writes one byte to the file file.
__writeMemoryByte __writeMemoryByte(value, address, zone)
Parameters
Return value
int 0
Description
Writes one byte to a given memory location.
Example
__writeMemoryByte(0x2F, 0x1F, "Memory");
__writeMemory8 __writeMemory8(value, address, zone)
Parameters
Return value
int 0
value The value to be written (integer)
address The memory address (integer)
zone The memory zone name (string); select it from the Memory window drop-down menu
value The value to be written (integer)
address The memory address (integer)
zone The memory zone name (string); select it from the Memory window drop-down menu
U430-2
MSP430 IAR Embedded Workbench™ IDEUser Guide
C-SPY macros reference
Description
Writes one byte to a given memory location.
Example
__writeMemory8(0x2F, 0x8020, "Memory");
__writeMemory16 __writeMemory16(value, address, zone)
Parameters
Return value
int 0
Description
Writes two bytes to a given memory location.
Example
__writeMemory16(0x2FFF, 0x8020, "Memory");
__writeMemory32 __writeMemory32(value, address, zone)
Parameters
Return value
int 0
value The value to be written (integer)
address The memory address (integer)
zone The memory zone name (string); select it from the Memory window drop-down menu
value The value to be written (integer)
address The memory address (integer)
zone The memory zone name (string); select it from the Memory window drop-down menu
U430-2
Part 8. Reference information 347

348
Description of C-SPY system macros
Description
Writes four bytes to a given memory location.
Example
__writeMemory32(0x5555FFFF, 0x8020, "Memory");
U430-2
MSP430 IAR Embedded Workbench™ IDEUser Guide

Glossary
Glossary
A Absolute location. A specific memory address for an object specified in the source code, as opposed to the object being assigned a location by the IAR XLINK Linker.
Absolute segments. Segments that have fixed locations in memory before linking.
Address expression. An expression which has an address as its value.
Application. The application program developed by the user of the IAR toolkit and which will be run as an embedded application on a target chip.
Architecture. A term used by computer designers to designate the structure of complex information-processing systems. It includes the kinds of instructions and data used, the memory organization and addressing, and the methods by which the system is implemented. The two main architecture types used in processor design are Harvard and von Neumann.
Assembler directives. The set of commands that control how the assembler operates.
Assembler options. Parameters you can specify to change the default behavior of the assembler.
Assembler language. A machine-specific set of mnemonics used to specify operations to the target processor and input or output registers or data areas. Assembler language may sometimes be preferred over C/Embedded C++ to save memory or to enhance the execution speed of the application.
Auto variables. The term refers to the fact that each time the function in which the variable is declared is called, a new instance of the variable is created automatically. This can be compared with the behavior of local variables in systems using static overlay, where a local variable only exists in one instance, even if the function is called recursively. Also called local variables. Compare Register variables.
BBacktrace. Information that allows the IAR C-SPY™ Debugger to show, without any runtime penalty, the complete stack of function calls wherever the program counter is, provided that the code comes from compiled C functions.
Bank. See Memory bank.
Bank switching. Switching between different sets of memory banks. This software technique is used to increase a computer's usable memory by allowing different pieces of memory to occupy the same address space.
Banked code. Code that is distributed over several banks of memory. Each function must reside in only one bank.
Banked data. Data that is distributed over several banks of memory. Each data object must fit inside one memory bank.
Banked memory. Has multiple storage locations for the same address. See also Memory bank.
Bank-switching routines. Code that selects a memory bank.
Batch files. A text file containing operating system commands which are executed by the command line interpreter. In Unix, this is called a “shell script” since it is the Unix shell which includes the command line interpreter. Batch files can be used as a simple way to combine existing commands into new commands.
Bitfield. A group of bits considered as a unit.
Breakpoint. 1. Code breakpoint. A point in a program that, when reached, triggers some special behavior useful to the process of debugging. Generally, breakpoints are used for stopping program execution or dumping the values of some or all of the program variables. Breakpoints may be part of the program itself, or they may be set by the programmer as part of an interactive session with a debugging tool for scrutinizing the program's execution.
U430-2
349

350
2. Data breakpoint. A point in memory that, when accessed, triggers some special behavior useful to the process of debugging. Generally, data breakpoints are used to stop program execution when an address location is accessed either by a read operation or a write operation.
3. Immediate breakpoint. A point in memory that, when accessed, trigger some special behavior useful in the process of debugging. Immediate breakpoints are generally used for halting the program execution in the middle of a memory access instruction (before or after the actual memory access depending on the access type) while performing some user-specified action. The execution is then resumed. This feature is only available in the simulator version of C-SPY.
CCalling convention. A calling convention describes the way one function in a program calls another function. This includes how register parameters are handled, how the return value is returned, and which registers that will be preserved by the called function. The compiler handles this automatically for all C and C++ functions. All code written in assembler language must conform to the rules in the calling convention in order to be callable from C or C++, or to be able to call C and C++ functions. The C calling convention and the C++ calling conventions are not necessarily the same.
Cheap. As in cheap memory access. A cheap memory access either requires few cycles to perform, or few bytes of code to implement. A cheap memory access is said to have a low cost. See Memory access cost.
Checksum. A computed value which depends on the contents of a block of data and which is stored along with the data in order to detect corruption of the data. Compare CRC.
Code banking. See Banked code.
Code model. The code model controls how code is generated for an application. All object files of a system must be compiled using the same code model.
Code pointers. A code pointer is a function pointer. As many microcontrollers allow several different methods of calling a function, compilers for embedded systems usually provide the users with the ability to use all these methods.
Do not confuse code pointers with data pointers.
Compilation unit. See Translation unit.
Compiler function directives. The compiler function directives are generated by the compiler to pass information about functions and function calls to the IAR XLINK Linker. To view these directives, you must create an assembler list file. These directives are primarily intended for compilers that support static overlay, a feature which is useful in smaller microcontrollers.
Compiler options. Parameters you can specify to change the default behavior of the compiler.
Cost. See Memory access cost.
CRC (cyclic redundancy checking). A number derived from, and stored with, a block of data in order to detect corruption. A CRC is based on polynomials and is a more advanced way of detecting errors than a simple arithmetic checksum. Compare Checksum.
C-SPY options. Parameters you can specify to change the default behavior of the IAR C-SPY Debugger.
Cstartup. Code that sets up the system before the application starts executing.
C-style preprocessor. A preprocessor is either a stand-alone application or an integrated part of a compiler, that performs preprocessing of the input stream before actual compilation takes place. A C-style preprocessor follows the rules set up in the ANSI specification of the C language and implements commands like #define, #if, and #include, which are used to handle textual macro substitution, conditional compilation, and inclusion of other files.
DData banking. See Banked data.
U430-2
MSP430 IAR Embedded Workbench™ IDEUser Guide
Glossary
Data pointers. Many microcontrollers have different addressing modes in order to access different memory types or address spaces. Compilers for embedded systems usually have a set of different data pointer types so they can access the available memory efficiently.
Data representation. How different data types are laid out in memory and what value ranges they represent.
Declaration. A specification to the compiler that an object, a variable or function, exists. The object itself must be defined in exactly one translation unit (source file). An object must either be declared or defined before it is used. Normally an object that is used in many files is defined in one source file. A declaration is normally placed in a header file that is included by the files that use the object.
For example:
/* Variable "a" exists somewhere. Function "b" takes two int parameters and returns an int. */
extern int a; int b(int, int);
Definition. The variable or function itself. Only one definition may exist for each variable or function in an application. See also Tentative definition.
For example:
int a;int b(int x, int y){ return x + y;}
Derivative. One of two or more processor variants in a series or family of microprocessors or microcontrollers.
Device description file. A file used by the IAR C-SPY Debugger that contains various device-specific information such as I/O registers (SFR) definitions, interrupt vectors, and control register definitions.
Device driver. Software that provides a high-level programming interface to a particular peripheral device.
Digital signal processor (DSP). A device that is similar to a microprocessor, except that the internal CPU has been optimized for use in applications involving discrete-time signal processing. In addition to standard microprocessor instructions, digital signal processors usually support a set of complex instructions to perform common signal-processing computations quickly.
Disassembly window. A C-SPY window that shows the memory contents disassembled as machine instructions, interspersed with the corresponding C source code (if available).
Dynamic initialization. Variables in a program written in C are initialized during the initial phase of execution, before the main function is called. These variables are always initialized with a static value, which is determined either at compile-time or at link-time. This is called static initialization. In Embedded C++, variables may require initialization to be performed by executing code, e.g. running the constructor of global objects, or performing dynamic memory allocation.
Dynamic memory allocation. There are two main strategies for storing variables: statically at link-time, or dynamically at runtime. Dynamic memory allocation is often performed from the heap and it is the size of the heap that determines how much memory that can be used for dynamic objects and variables. The advantage of dynamic memory allocation is that several variables or objects that are not active at the same time may be stored in the same memory, thus reducing the memory need of an application. See also Heap memory.
Dynamic object. An object that is allocated, created, destroyed, and released at runtime. Dynamic objects are almost always stored in memory that is dynamically allocated. Compare Static objects.
U430-2
351

352
EEEPROM. Electrically Erasable, Programmable Read-Only Memory. A type of ROM that can be erased electronically, and then be re-programmed.
EPROM. Erasable, Programmable Read-Only Memory. A type of ROM that can be erased by exposing it to ultraviolet light, and then be re-programmed.
Embedded C++. A subset of the C++ programming language, which is intended for embedded systems programming. The fact that performance and portability are particularly important in embedded systems development was considered when defining the language.
Embedded system. A combination of hardware and software, designed for a specific purpose. Embedded systems are often part of a larger system or product.
Emulator. An emulator is a hardware device that performs emulation of one or more derivatives of a microcontroller family. An emulator can often be used instead of the actual microcontroller chip and connects directly to the printed circuit board—where the chip would have been connected—via a connecting device. An emulator always behaves exactly as the microcontroller it emulates, and is used when debugging requires all systems actuators, or when debugging device drivers.
Enumeration. A type which includes in its definition an exhaustive list of possible values for variables of that type. Common examples include Boolean, which takes values from the list [true, false], and day-of-week which takes values [Sunday, Monday, Tuesday, Wednesday, Thursday, Friday, Saturday]. Enumerated types are a feature of typed languages, including C and Ada.
Characters, (fixed-size) integers, and even floating-point types could be (but are not usually) considered to be (large) enumerated types.
Exceptions. An exception is an interrupt initiated by the processor hardware, or hardware that is tightly coupled with the processor, e.g. a memory management unit (MMU). The exception signals a violation of the rules of the architecture (access to protected memory), or an extreme error condition (division by zero).
Do not confuse this use of the word exception with the term exception used in the C++ language (but not in Embedded C++!).
Expensive. As in expensive memory access. An expensive memory access either requires many cycles to perform, or many bytes of code to implement. An expensive memory access is said to have a high cost. See Memory access cost.
Extended keywords. Non-standard keywords in C and C++. These usually control the definition and declaration of objects (i.e. data and functions). See also Keywords.
FFormat specifiers. Used to specify the format of strings sent by library functions such as printf. In the following example, the function call contains one format string with one format specifier, %c, that prints the value of a as a single ASCII character:
printf("a = %c", a);
GGeneral options. Parameters you can specify to change the default behavior of all tools that are included in the IAR Embedded Workbench IDE.
Generic pointers. Pointers that have the ability to point to all different memory types in for instance a microcontroller based on the Harvard architecture
U430-2
MSP430 IAR Embedded Workbench™ IDEUser Guide

Glossary
HHarvard architecture. A microcontroller based on the Harvard architecture has separate data and instruction buses. This allows execution to occur in parallel. As an instruction is being fetched, the current instruction is executing on the data bus. Once the current instruction is complete, the next instruction is ready to go. This theoretically allows for much faster execution than a von Neumann architecture, but there is some added silicon complexity. Compare von Neumann architecture.
Heap memory. The heap is a pool of memory in a system that is reserved for dynamic memory allocation. An application may request parts of the heap for its own use; once memory has been allocated from the heap it remains valid until it is explicitly released back to the heap by the application. This type of memory is useful when the number of objects is not known until the application executes. Note that this type of memory is risky to use in systems with a limited amount of memory or systems that are expected to run for a very long time.
Heap size. Total size of memory that can be dynamically allocated.
Host. The computer that communicates with the target chip. The term is used to distinguish the computer on which the debugger is running from the microcontroller the embedded application you develop runs on.
IIDE (integrated development environment). A programming environment with all necessary tools integrated into one single application.
Include file. A text file which is included into a source file. This is often performed by the preprocessor.
Inline assembler. Assembler language code that is inserted directly between C statements.
Inlining. An optimization that replaces function calls with the body of the called function. This optimization increases the execution speed and may even reduce the size of the generated code.
Instruction mnemonics. A word or acronym used in assembler language to represent a machine instruction. Different processors have different instruction sets and therefore use a different set of mnemonics to represent them, such as, ADD, BR (branch), BLT (branch if less than), MOVE, LDR (load register).
Interrupt vector. A small piece of code that will be executed, or a pointer that points to code that will be executed when an interrupt occurs.
Interrupt vector table. A table containing interrupt vectors, indexed by interrupt type. This table contains the processor's mapping between interrupts and interrupt service routines and must be initialized by the programmer.
Interrupts. In embedded systems, the use of interrupts is a method of detecting external events immediately, for example a timer overflow or the pressing of a button.
Interrupts are asynchronous events that suspend normal processing and temporarily divert the flow of control through an “interrupt handler” routine. Interrupts may be caused by both hardware (I/O, timer, machine check) and software (supervisor, system call or trap instruction). Compare Trap.
Intrinsic. An adjective describing native compiler objects, properties, events, and methods.
Intrinsic functions. 1. Function calls that are directly expanded into specific sequences of machine code. 2. Functions called by the compiler for internal purposes (i.e. floating point arithmetic etc.).
KKey bindings. Key shortcuts for menu commands used in the IAR Embedded Workbench IDE.
U430-2
353

354
Keywords. A fixed set of symbols built into the syntax of a programming language. All keywords used in a language are reserved—they may not be used as identifiers (i.e. user-defined objects such as variables or procedures). See also Extended keywords.
LL-value. A value that can be found on the left side of an assignment and thus be changed. This includes plain variables and de-referenced pointers. Expressions like (x + 10) can not be assigned a new value and are therefore not L-values.
Language extensions. Target-specific extensions to the C language.
Library. See Runtime library.
Linker command file. A file used by the IAR XLINK Linker. It contains command line options which specify the locations where the memory segments can be placed, thereby assuring that your application fits on the target chip.
Since many of the chip-specific details are specified in the linker command file and not in the source code, the linker command file also helps to make the code portable.
In particular, the linker specifies the placement of segments, the stack size, and the heap size.
Local variable. See Auto variables.
Location counter. See Program location counter.
Logical address. See Virtual address.
MMAC (Multiply and accumulate). A special instruction, or on-chip device, that performs a multiplication together with an addition. This is very useful when performing signal processing where many filters and transforms have the form:
The accumulator of the MAC usually has a higher precision (more bits) than normal registers. See also Digital signal processor.
Macro. 1. Assembler macros are user-defined sets of assembler lines that can be expanded later in the source file by referring to the given macro name. Parameters will be substituted if referred to.
2. C macro. A text substitution mechanism used during preprocessing of source files. Macros are defined using the #define preprocessing directive. The replacement text of each macro is then substituted for any occurrences of the macro name in the rest of the translation unit.
3. C-SPY macros are programs that you can write to enhance the functionality of the IAR C-SPY Debugger. A typical application of C-SPY macros is to associate them with breakpoints; when such a breakpoint is hit, the macro is run and can for example be used to simulate peripheral devices, to evaluate complex conditions, or to output a trace.
The C-SPY macro language is like a simple dialect of C, but is less strict with types.
Mailbox. A mailbox in an RTOS is a point of communication between two or more tasks. One task can send messages to another task by placing the message in the mailbox of the other task. Mailboxes are also known as message queues or message ports.
U430-2
MSP430 IAR Embedded Workbench™ IDEUser Guide

Glossary
Memory access cost. The cost of a memory access may be in clock cycles, or in the number of bytes of code needed to perform the access. A memory which requires large instructions or many instructions is said to have a higher access cost than a memory which can be accessed with few, or small instructions.
Memory area. A region of the memory.
Memory bank. The smallest unit of continuous memory in banked memory. One memory bank at a time is visible in a microcontroller’s physical address space.
Memory map. A map of the different memory areas available to the microcontroller.
Memory model. Specifies the memory hierarchy and how much memory the system can handle. Your program must use only one memory model at a time, and the same model must be used by all user modules and all library modules. Most default behaviors originating from the selected memory model can be altered by the use of extended keywords and #pragma directives.
Microcontroller. A microprocessor on a single integrated circuit intended to operate as an embedded system. As well as a CPU, a microcontroller typically includes small amounts of RAM, PROM, timers, and I/O ports.
Microprocessor. A CPU contained on one (or a small number of) integrated circuits. A single-chip microprocessor may include other components such as memory, memory management, caches, floating-point unit, I/O ports and timers. Such devices are also known as microcontrollers.
Module. The basic unit of linking. A module contains definitions for symbols (exports) and references to external symbols (imports). When compiling C/C++, each translation unit produces one module. In assembler, each source file can produce more than one module.
NNested interrupts. A system where an interrupt may be interrupted by another interrupt is said to have nested interrupts.
Non-banked memory. Has a single storage location for each memory address in a microcontroller’s physical address space.
Non-initialized memory. Memory that can contain any value at reset, or in the case of a soft reset, can remember the value it had before the reset.
Non-volatile storage. Memory devices such as battery-backed RAM, ROM, magnetic tape and magnetic disks that can retain data when electric power is shut off. Compare Volatile storage.
NOP. No operation. This is an instruction that does not perform anything, but is used to create a delay. In pipelined architectures, the NOP instruction can be used for synchronizing the pipeline. See also Pipeline.
OOperator. A symbol used as a function, with infix syntax if it has two arguments (e.g. +) or prefix syntax if it has only one (e.g. bitwise negation, ~). Many languages use operators for built-in functions such as arithmetic and logic.
Operator precedence. Each operator has a precedence number assigned to it that determines the order in which the operator and its operands are evaluated. The highest precedence operators are evaluated first. Use parentheses to group operators and operands to control the order in which the expressions are evaluated.
PParameter passing. See Calling convention.
U430-2
355

356
Peripheral. A hardware component other than the processor, for example memory or an I/O device.
Pipeline. A structure that consists of a sequence of stages through which a computation flows. New operations can be initiated at the start of the pipeline even though other operations are already in progress through the pipeline.
Pointer. An object that contains an address to another object of a specified type.
#pragma directive. During compilation of a C/C++ program, #pragma directives cause the compiler to behave in an implementation-defined manner. This can include, for example, producing output on the console, changing the declaration of a subsequent object, changing the optimization level, or enabling/disabling language extensions.
Pre-emptive multitasking. An RTOS task is allowed to run until a higher priority process is activated. The higher priority task may become active as the result of an interrupt. The term preemptive indicates that although a task is allotted to run a given length of time (a timeslice), it may lose the processor at any time. Each time an interrupt occurs, the task scheduler looks for the highest priority task that is active and switches to that task. If the located task is different from the task that was executing before the interrupt, the previous task is suspended at the point of interruption.
Compare Round Robin.
Preprocessing directives. A set of directives that are executed before the parsing of the actual code is started.
Preprocessor. See C-style preprocessor.
Processor variant. The different chip setups that the compiler supports. See Derivative.
Program counter (PC). A special processor register that is used to address instructions. Compare Program location counter.
Program location counter (PLC). Used in the IAR Assembler to denote the code address of the current instruction. The PLC is represented by a special symbol (typically $) that can be used in arithmetic expressions. Also called simply location counter (LC).
PROM. Programmable Read-Only Memory. A type of ROM that can be programmed only once.
Project. The user application development project.
Project options. General options that apply to an entire project, for example the target processor that the application will run on.
QQualifiers. See Type qualifiers.
RR-value. A value that can be found on the right side of an assignment. This is just a plain value. See also L-Value.
Real-time operating system (RTOS). An operating system which guarantees the latency between an interrupt being triggered and the interrupt handler starting, as well as how tasks are scheduled. An RTOS is typically much smaller than a normal desktop operating system. Compare Real-time system.
Real-time system. A computer system whose processes are time-sensitive. Compare Real-time operating system.
Register constant. A register constant is a value that is loaded into a dedicated processor register when the system is initialized. The compiler can then generate code that assumes that the constants are present in the dedicated registers.
Register. A small on-chip memory unit, usually just one or a few bytes in size, which is particularly efficient to access and therefore often reserved to function as a temporary storage area during program execution.
U430-2
MSP430 IAR Embedded Workbench™ IDEUser Guide

Glossary
Register locking. Register locking means that the compiler can be instructed that some processor registers shall not be used during normal code generation. This is useful in a number of situations. For example, some parts of a system could be written in assembler language to gain speed. These parts could be given dedicated processor registers. Or the register could be used by an operating system, or by other third-party software.
Register variables. Typically, register variables are local variables that have been placed in registers instead of on the (stack) frame of the function. Register variables are much more efficient than other variables because they do not require memory accesses, so the compiler can use shorter/faster instructions when working with them. See also Auto variables.
Relocatable segments. Segments that have no fixed location in memory before linking.
Reset. A reset is a restart from the initial state of a system. A reset can originate from hardware (hard reset), or from software (soft reset). A hard reset can usually not be distinguished from the power-on condition, which a soft reset can be.
ROM-monitor. A piece of embedded software that has been designed specifically for use as a debugging tool. It resides in the ROM of the evaluation board chip and communicates with a debugger via a serial port or network connection. The ROM-monitor provides a set of primitive commands to view and modify memory locations and registers, create and remove breakpoints, and execute your program. The debugger combines these primitives to fulfill higher-level requests like program download and single-step.
Round Robin. Task scheduling in an operating system, where all tasks have the same priority level and are executed in turn, one after the other. Compare Preemptive multitasking.
RTOS. See Real-time operating system.
Runtime library. A collection of useful routines, stored as an object file, that can be linked into any program.
Runtime model attributes. A mechanism that is designed to prevent modules that are not compatible to be linked into an application. A runtime attribute is a pair constituted of a named key and its corresponding value.
Two modules can only be linked together if they have the same value for each key that they both define.
SSaturated mathematics. Most, if not all, C and C++ implementations use mod–2N 2-complement-based mathematics where an overflow wraps the value in the value domain, i.e. (127 + 1) = -128. Saturated mathematics, on the other hand, does not allow wrapping in the value domain, e.g. (127 + 1) = 127, if 127 is the upper limit. Saturated mathematics is often used in signal processing, where an overflow condition would have been fatal if value wrapping had been allowed.
Scheduler. The part of an RTOS that performs task-switching. It is also responsible for selecting which task that should be allowed to run. There are many different scheduling algorithms, but most of them are either based on static scheduling (performed at compile-time), or on dynamic scheduling (where the actual choice of which task to run next is taken at runtime, depending on the state of the system at the time of the task-switch). Most real-time systems use static scheduling, because it makes it possible to prove that the system will not violate the real-time requirements.
Scope. The section of an application where a function or a variable can be referenced by name. The scope of an item may be limited to file, function, or block.
Segment. A chunk of data or code that should be mapped to a physical location in memory. The segment could either be placed in RAM (read-and-writeable memory) or in ROM (read-only memory).
Segment map. A set of segments and their locations.
U430-2
357

358
Semaphore. A semaphore is a type of flag that is used for guaranteeing exclusive access to resources. The resource can be a hardware port, a configuration memory, or a set of variables. If several different tasks have to access the same resource, the parts of the code (the critical sections) that access the resource have to be made exclusive for every task. This is done by obtaining the semaphore that protects that resource, thus blocking all other tasks from it. If another task wishes to use the resource, it also has to obtain the semaphore. If the semaphore is already in use, the second task has to wait until the semaphore is released. After the semaphore is released, the second task is allowed to execute and can obtain the semaphore for its own exclusive access.
Severity level. The level of seriousness of the diagnostic response from the assembler, compiler, or debugger, when it notices that something is wrong. Typical severity levels are remarks, warnings, errors, and fatal errors. A remark just points to a possible problem, while a fatal error means that the programming tool exits without finishing.
Short addressing. Many microcontrollers have special addressing modes for efficient access to internal RAM and memory mapped I/O. Short addressing is therefore provided as an extended feature by many compilers for embedded systems. See also Data pointers.
Side effect. An expression in C or C++ is said to have a side-effect if it changes the state of the system. Examples are assignments to a variable, or using a variable with the post-increment operator. The C and C++ standards state that a variable that is subject to a side-effect should not be used more that once in an expression. As an example, this statement violates that rule:
*d++ = *d;
Signal. Signals provide event-based communication between tasks. A task can wait for one or more signals from other tasks. Once a task receives a signal it waits for, execution continues. A task in an RTOS that waits for a signal does not use any processing time, which allows other tasks to execute.
Simulator. A debugging tool that runs on the host and behaves as similar to the target processor as possible. A simulator is used to debug the application when the hardware is unavailable, or not needed for proper debugging. A simulator is usually not connected to any physical peripheral devices. A simulated processor is often slower, or even much slower, than the real hardware.
Single stepping. Executing one instruction or one C statement at a time in the debugger.
Skeleton code. An incomplete code framework that allows the user to specialize the code.
Special function register (SFR). A register that is used to read and write to the hardware components of the microcontroller.
Stack frames. Data structures containing data objects as preserved registers, local variables, and other data objects that need to be stored temporary for a particular scope (usually a function).
Earlier compilers usually had a fixed size and layout on a stack frame throughout a complete function, while modern compilers may have a very dynamic layout and size that can change anywhere and anytime in a function.
Stack segments. The segment or segments that reserve space for the stack(s). Most processors use the same stack for calls and parameters, but some have separate stacks.
Statically allocated memory. This kind of memory is allocated once and for all at link-time, and remains valid all through the execution of the application. Variables that are either global or declared static are allocated this way.
Static objects. An object whose memory is allocated at link-time and is created during system startup (or at first use). Compare Dynamic objects.
U430-2
MSP430 IAR Embedded Workbench™ IDEUser Guide

Glossary
Static overlay. Instead of using a dynamic allocation scheme for parameters and auto variables, the linker allocates space for parameters and auto variables at link time. This generates a worst-case scenario of stack usage, but may be preferable for small chips with expensive stack access or no stack access at all.
Structure value. A collecting names for structs and unions. A struct is a collection of data object placed sequentially in memory (possibly with pad bytes between them). A union is a collection of data sharing the same memory location.
Symbol. A name that represents a register, an absolute value, or a memory address (relative or absolute).
Symbolic location. A location that uses a symbolic name because the exact address is unknown.
TTarget. 1. An architecture. 2. A piece of hardware. The particular embedded system you are developing the application for. The term is usually used to distinguish the system from the host system.
Target monitor. 1. A small application that is added to an embedded system to allow maintenance when the system is operational. The monitor has access to the main application’s variables and statistics.
2. A small application that allows a debugger to interface with the hardware, thus allowing simple debugging to be performed in a “live” system. See also ROM-monitor.
Task (thread). A task is an execution thread in a system. Systems that contain many tasks that execute in parallel are called multitasking systems. Since a processor only executes one instruction stream at the time, most systems implement some sort of task-switch mechanism (often called context switch) so that all tasks get their share of processing time. The process of determining which task that should be allowed to run next is called scheduling. Two common scheduling methods are preemptive multitasking and Round Robin.
Tentative definition. A variable that can be defined in multiple files, provided that the definition is identical and that it is an absolute variable.
Terminal I/O. A simulated terminal window in the IAR C-SPY Debugger.
Timeslice. The (longest) time an RTOS allows a task to run without running the task-scheduling algorithm. It is possible that a task will be allowed to execute during several consecutive timeslices before being switched out. It is also possible that a task will not be allowed to use its entire time slice, e.g. if, in a preemptive system, a higher priority task is activated by an interrupt.
Timer. A peripheral that counts independent of the program execution.
Translation unit. A source file together with all the header files and source files included via the preprocessor directive #include, with the exception of the lines skipped by conditional preprocessor directives such as #if and #ifdef.
Trap. A trap is an interrupt initiated by inserting a special instruction into the instruction stream. Many systems use traps to call operating system functions. Another name for trap is software interrupt.
Type qualifiers. In standard C/C++, const or volatile. IAR compilers usually add target-specific type qualifiers for memory and other type attributes.
UUBROF (Universal Binary Relocatable Object Format). File format produced by the IAR programming tools.
U430-2
359

360
VVirtual address (logical address). An address that needs to be translated by the compiler, linker or the runtime system into a physical memory address before it is used. The virtual address is the address seen by the application, which can be different from the address seen by other parts of the system.
Virtual space. An IAR Embedded Workbench Editor feature which allows you to place the insertion point outside of the area where there are actual characters.
Volatile storage. Data stored in a volatile storage device is not retained when the power to the device is turned off. In order to preserve data during a power-down cycle, you should store it in non-volatile storage. This should not be confused with the C keyword volatile. Compare Non-volatile storage.
von Neumann architecture. A computer architecture where both instructions and data are transferred over a common data channel. Compare Harvard architecture.
WWatchpoints. Watchpoints keep track of the values of C variables or expressions in the C-SPY Watch window as the program is being executed.
XXAR options. The set of commands that control how the IAR XAR Library Builder™ operates.
XLIB options. The set of commands that control how the IAR XLIB Librarian™ operates.
XLINK options. Parameters you can specify to change the default behavior of the IAR XLINK Linker.
ZZero-overhead loop. A loop in which the loop condition, including branching back to the beginning of the loop, does not take any time at all. This is usually implemented as a special hardware feature of the processor and is not available in all architectures.
Zone. Different processors have widely differing memory architectures. Zone is the term C-SPY uses for a named memory area. For example, on processors with separately addressable code and data memory there would be at least two zones. A processor with an intricate banked memory scheme may have several zones.
U430-2
MSP430 IAR Embedded Workbench™ IDEUser Guide
Index
Index
Aabsolute location, definition of . . . . . . . . . . . . . . . . . . . . . 349absolute segments, definition of . . . . . . . . . . . . . . . . . . . . 349Access Type (Breakpoints dialog). . . . . . . . . . . . . . . . . . . 239Action (Breakpoints dialog) . . . . . . . . . . . . . . . . . . . . . . . 240Activation time, definition of . . . . . . . . . . . . . . . . . . . . . . 158address expression, definition of . . . . . . . . . . . . . . . . . . . . 349address range check, specifying in XLINK. . . . . . . . . . . . 316Always generate output (XLINK option) . . . . . . . . . . . . . 315application
definition of . . . . . . . . . . . . . . . . . . . . . . . . . . . . . . . . . 349hardware-dependent aspects. . . . . . . . . . . . . . . . . . . . . . 79testing . . . . . . . . . . . . . . . . . . . . . . . . . . . . . . . . . . . . . . 87
architecture, definition of . . . . . . . . . . . . . . . . . . . . . . . . . 349argument variables . . . . . . . . . . . . . . . . . . . . . . . . . . . . . . 255
in #include file paths . . . . . . . . . . . . . . . . . . 299, 310, 318summary . . . . . . . . . . . . . . . . . . . . . . . . . . . . . . . . . . . 242
asm (filename extension) . . . . . . . . . . . . . . . . . . . . . . . . . . 17assembler
diagnostics . . . . . . . . . . . . . . . . . . . . . . . . . . . . . . . . . . 305documentation . . . . . . . . . . . . . . . . . . . . . . . . . . . . . . . . 19
on the Help menu . . . . . . . . . . . . . . . . . . . . . . . . . . 260features . . . . . . . . . . . . . . . . . . . . . . . . . . . . . . . . . . . . . 11
assembler directives . . . . . . . . . . . . . . . . . . . . . . . . . . . . . . 68definition of . . . . . . . . . . . . . . . . . . . . . . . . . . . . . . . . . 349
assembler language, definition of . . . . . . . . . . . . . . . . . . . 349assembler list files
conditional information, specifying . . . . . . . . . . . . . . . 308cross-references, generating. . . . . . . . . . . . . . . . . . . . . 309format . . . . . . . . . . . . . . . . . . . . . . . . . . . . . . . . . . . . . . 49generating . . . . . . . . . . . . . . . . . . . . . . . . . . . . . . . . . . 308header, including . . . . . . . . . . . . . . . . . . . . . . . . . . . . . 308in compiler, generating . . . . . . . . . . . . . . . . . . . . . . . . 298lines per page, specifying. . . . . . . . . . . . . . . . . . . . . . . 309tab spacing, specifying. . . . . . . . . . . . . . . . . . . . . . . . . 309
Assembler mnemonics (compiler option) . . . . . . . . . . . . . 298assembler options . . . . . . . . . . . . . . . . . . . . . . . . . . . . . . . 303
Case-sensitive user symbols. . . . . . . . . . . . . . . . . . . . . 304
Code generation . . . . . . . . . . . . . . . . . . . . . . . . . . . . . . 304Cross-reference . . . . . . . . . . . . . . . . . . . . . . . . . . . . . . 309Debug . . . . . . . . . . . . . . . . . . . . . . . . . . . . . . . . . . . . . 306Define symbol . . . . . . . . . . . . . . . . . . . . . . . . . . . . . . . 307definition of . . . . . . . . . . . . . . . . . . . . . . . . . . . . . . . . . 349Disable #ifdef/#endif matching . . . . . . . . . . . . . . . . . . 304Generate debug information. . . . . . . . . . . . . . . . . . . . . 306Include . . . . . . . . . . . . . . . . . . . . . . . . . . . . . . . . . . . . . 310Include header . . . . . . . . . . . . . . . . . . . . . . . . . . . . . . . 308Include listing . . . . . . . . . . . . . . . . . . . . . . . . . . . . . . . 308Lines/page . . . . . . . . . . . . . . . . . . . . . . . . . . . . . . . . . . 309List. . . . . . . . . . . . . . . . . . . . . . . . . . . . . . . . . . . . . . . . 308Macro quote chars . . . . . . . . . . . . . . . . . . . . . . . . . . . . 305Make a library module . . . . . . . . . . . . . . . . . . . . . . . . . 304setting in Embedded Workbench . . . . . . . . . . . . . . . . . 303Tab spacing . . . . . . . . . . . . . . . . . . . . . . . . . . . . . . . . . 309Undefine symbol . . . . . . . . . . . . . . . . . . . . . . . . . . . . . 310Warnings . . . . . . . . . . . . . . . . . . . . . . . . . . . . . . . . . . . 305
Assembler Reference Guide (Help menu). . . . . . . . . . . . . 260assembler symbols
using in C-SPY expressions . . . . . . . . . . . . . . . . . . . . . 118assumptions, programming experience . . . . . . . . . . . . . . xxixAuto indent (editor option) . . . . . . . . . . . . . . . . . . . . . . . . 249auto-variables, definition of . . . . . . . . . . . . . . . . . . . . . . . 349a45 (filename extension) . . . . . . . . . . . . . . . . . . . . . . . . . . . 17
Bbacktrace information
definition of . . . . . . . . . . . . . . . . . . . . . . . . . . . . . . . . . 349generated by compiler . . . . . . . . . . . . . . . . . . . . . . . . . 115
bank switching, definition of. . . . . . . . . . . . . . . . . . . . . . . 349banked code, definition of. . . . . . . . . . . . . . . . . . . . . . . . . 349banked data, definition of . . . . . . . . . . . . . . . . . . . . . . . . . 349banked memory, definition of . . . . . . . . . . . . . . . . . . . . . . 349bank-switching routines, definition of. . . . . . . . . . . . . . . . 349batch files
definition of . . . . . . . . . . . . . . . . . . . . . . . . . . . . . . . . . 349specifying in Embedded Workbench . . . . . . . . . . . 77, 256
U430-2
361

362
bin, common (subdirectory) . . . . . . . . . . . . . . . . . . . . . . . . 16bin, 430 (subdirectory) . . . . . . . . . . . . . . . . . . . . . . . . . . . . 16bitfield, definition of . . . . . . . . . . . . . . . . . . . . . . . . . . . . . 349blocks, in C-SPY macros . . . . . . . . . . . . . . . . . . . . . . . . . 331bookmarks
adding . . . . . . . . . . . . . . . . . . . . . . . . . . . . . . . . . . . . . . 92showing in editor . . . . . . . . . . . . . . . . . . . . . . . . . . . . . 249
brackets, matching (in editor) . . . . . . . . . . . . . . . . . . . . . . . 93Break At Location Type (Breakpoints dialog). . . . . . . . . . 238Break (button). . . . . . . . . . . . . . . . . . . . . . . . . . . . . . . . . . 263breakpoint condition, example . . . . . . . . . . . . . . . . . 125–126breakpoints . . . . . . . . . . . . . . . . . . . . . . . . . . . . . . . . . . . . 114
code, example . . . . . . . . . . . . . . . . . . . . . . . . . . . . . . . 342conditional, example . . . . . . . . . . . . . . . . . . . . . . . . . . . 63connecting a C-SPY macro . . . . . . . . . . . . . . . . . . . . . 141C-SPY FET specifics . . . . . . . . . . . . . . . . . . . . . . . . . . 193data, example . . . . . . . . . . . . . . . . . . . . . . . . . . . . . . . . 343definition of . . . . . . . . . . . . . . . . . . . . . . . . . . . . . . . . . 349EEM, using . . . . . . . . . . . . . . . . . . . . . . . . . . . . . . . . . 197EEM, using in FET . . . . . . . . . . . . . . . . . . . . . . . . . . . 206immediate, example . . . . . . . . . . . . . . . . . . . . . . . . . . . . 63setting in memory window. . . . . . . . . . . . . . . . . . . . . . 124settings. . . . . . . . . . . . . . . . . . . . . . . . . . . . . . . . . . . . . 237system, description of . . . . . . . . . . . . . . . . . . . . . . . . . 123toggling . . . . . . . . . . . . . . . . . . . . . . . . . . . . . . . . . . . . 124types of . . . . . . . . . . . . . . . . . . . . . . . . . . . . . . . . . . . . 238using C-SPY ROM-monitor. . . . . . . . . . . . . . . . . . . . . 173using system macros . . . . . . . . . . . . . . . . . . . . . . . . . . 126using the dialog box. . . . . . . . . . . . . . . . . . . . . . . . . . . 125
Breakpoints dialog box (Edit menu) . . . . . . . . . . . . . . . . . 237build configuration, definition of . . . . . . . . . . . . . . . . . . . . 81build messages, option . . . . . . . . . . . . . . . . . . . . . . . . . . . 252Build (in Messages window). . . . . . . . . . . . . . . . . . . . . . . 230building
the process . . . . . . . . . . . . . . . . . . . . . . . . . . . . . . . . . . . 85building a project . . . . . . . . . . . . . . . . . . . . . . . . . . . . . . . . 87
from the command line . . . . . . . . . . . . . . . . . . . . . . . . . 88build, options . . . . . . . . . . . . . . . . . . . . . . . . . . . . . . . . . . 250
CC compiler. See compilerC function information, in C-SPY. . . . . . . . . . . . . . . . . . . 115C symbols, using in C-SPY expressions . . . . . . . . . . . . . . 117C variables, using in C-SPY expressions . . . . . . . . . . . . . 117c (filename extension). . . . . . . . . . . . . . . . . . . . . . . . . . . . . 18Call stack information. . . . . . . . . . . . . . . . . . . . . . . . . . . . 115Call Stack window . . . . . . . . . . . . . . . . . . . . . . . . . . 115, 271
example . . . . . . . . . . . . . . . . . . . . . . . . . . . . . . . . . . . . . 62calling convention, definition of . . . . . . . . . . . . . . . . . . . . 350_ _cancelAllInterrupts (C-SPY system macro) . . . . . . . . . 334_ _cancelInterrupt (C-SPY system macro) . . . . . . . . 164, 334Case-sensitive user symbols (assembler option) . . . . . . . . 304Category, in Options dialog box . . . . . . . . . . . . . . . . . 86, 243cfg (filename extension) . . . . . . . . . . . . . . . . . . . . . . . 18, 250characters, in assembler macro quotes . . . . . . . . . . . . . . . 305cheap memory access, definition of . . . . . . . . . . . . . . . . . 350checksum
definition of . . . . . . . . . . . . . . . . . . . . . . . . . . . . . . . . . 350generating in XLINK . . . . . . . . . . . . . . . . . . . . . . . . . . 321
_ _clearBreak (C-SPY system macro). . . . . . . . . . . . . . . . 335CLIB. . . . . . . . . . . . . . . . . . . . . . . . . . . . . . . . . . . . . . . . . . 10
documentation . . . . . . . . . . . . . . . . . . . . . . . . . . . . . . . . 20specifying . . . . . . . . . . . . . . . . . . . . . . . . . . . . . . . . . . 290
CLIB Library Reference Guide (Help menu) . . . . . . . . . . 260_ _closeFile (C-SPY system macro) . . . . . . . . . . . . . . . . . 335code
banked, definition of . . . . . . . . . . . . . . . . . . . . . . . . . . 349skeleton, definition of . . . . . . . . . . . . . . . . . . . . . . . . . 358testing . . . . . . . . . . . . . . . . . . . . . . . . . . . . . . . . . . . . . . 87
Code Coveragecommands . . . . . . . . . . . . . . . . . . . . . . . . . . . . . . . . . . 273context menu . . . . . . . . . . . . . . . . . . . . . . . . . . . . . . . . 273using . . . . . . . . . . . . . . . . . . . . . . . . . . . . . . . . . . . . . . 146viewing the figures. . . . . . . . . . . . . . . . . . . . . . . . . . . . 147window . . . . . . . . . . . . . . . . . . . . . . . . . . . . . . . . . . . . 273
code generationassembler . . . . . . . . . . . . . . . . . . . . . . . . . . . . . . . . . . . 304
U430-2
MSP430 IAR Embedded Workbench™ IDEUser Guide

Index
compilerfeatures . . . . . . . . . . . . . . . . . . . . . . . . . . . . . . . . . . . 10
compiler options . . . . . . . . . . . . . . . . . . . . . . . . . . . . . 294Code generation (assembler option) . . . . . . . . . . . . . . . . . 304code memory, filling unused . . . . . . . . . . . . . . . . . . . . . . . 321code model, definition of . . . . . . . . . . . . . . . . . . . . . . . . . 350Code motion (compiler option) . . . . . . . . . . . . . . . . . . . . . 296Code page (compiler options) . . . . . . . . . . . . . . . . . . . . . . 294code pointers, definition of . . . . . . . . . . . . . . . . . . . . . . . . 350command line
commands, specifying inEmbedded Workbench . . . . . . . . . . . . . . . . . . . . . . . . . . 77
command line commands, specifying inEmbedded Workbench . . . . . . . . . . . . . . . . . . . . . . . . . . . 256Common Fonts (IDE Options dialog) . . . . . . . . . . . . . . . . 246common (directory) . . . . . . . . . . . . . . . . . . . . . . . . . . . . . . 16Common-subexpr elimination (compiler option) . . . . . . . 295compiler
command line version . . . . . . . . . . . . . . . . . . . . . . . . 4, 73documentation . . . . . . . . . . . . . . . . . . . . . . . . . . . . . 10, 19features . . . . . . . . . . . . . . . . . . . . . . . . . . . . . . . . . . . . . . 9
compiler diagnostics . . . . . . . . . . . . . . . . . . . . . . . . . . . . . 298suppressing . . . . . . . . . . . . . . . . . . . . . . . . . . . . . . . . . 301
compiler function directives, definition of . . . . . . . . . . . . 350compiler list files
assembler mnemonics, including . . . . . . . . . . . . . . . . . 298example . . . . . . . . . . . . . . . . . . . . . . . . . . . . . . . . . . . . . 32generating . . . . . . . . . . . . . . . . . . . . . . . . . . . . . . . . . . 298source code, including . . . . . . . . . . . . . . . . . . . . . . . . . 298
compiler optionsAssembler mnemonics . . . . . . . . . . . . . . . . . . . . . . . . . 298Code motion . . . . . . . . . . . . . . . . . . . . . . . . . . . . . . . . 296Common-subexpr elimination . . . . . . . . . . . . . . . . . . . 295Defined symbols . . . . . . . . . . . . . . . . . . . . . . . . . . . . . 299definition of . . . . . . . . . . . . . . . . . . . . . . . . . . . . . . . . . 350Diagnostics (in list file) . . . . . . . . . . . . . . . . . . . . . . . . 298Disable language extensions . . . . . . . . . . . . . . . . . . . . 293Enable Embedded C++ syntax . . . . . . . . . . . . . . . . . . . 292Enable multibyte support . . . . . . . . . . . . . . . . . . . . . . . 293Enable remarks . . . . . . . . . . . . . . . . . . . . . . . . . . . . . . 300
factory settings. . . . . . . . . . . . . . . . . . . . . . . . . . . . . . . . 85Function inlining . . . . . . . . . . . . . . . . . . . . . . . . . . . . . 296Generate debug information. . . . . . . . . . . . . . . . . . . . . 298Include paths . . . . . . . . . . . . . . . . . . . . . . . . . . . . . . . . 299Include source . . . . . . . . . . . . . . . . . . . . . . . . . . . . . . . 298Loop unrolling . . . . . . . . . . . . . . . . . . . . . . . . . . . . . . . 295Make library module . . . . . . . . . . . . . . . . . . . . . . . . . . 297Object module name . . . . . . . . . . . . . . . . . . . . . . . . . . 297Output assembler file . . . . . . . . . . . . . . . . . . . . . . . . . . 298Output list file . . . . . . . . . . . . . . . . . . . . . . . . . . . . . . . 298Plain ‘char’ is. . . . . . . . . . . . . . . . . . . . . . . . . . . . . . . . 293Preprocessor. . . . . . . . . . . . . . . . . . . . . . . . . . . . . . . . . 299Preprocessor output to file . . . . . . . . . . . . . . . . . . . . . . 300Relaxed ISO/ANSI . . . . . . . . . . . . . . . . . . . . . . . . . . . 293Require prototypes. . . . . . . . . . . . . . . . . . . . . . . . . . . . 292ROM-monitor compatible code . . . . . . . . . . . . . . . . . . 296setting in Embedded Workbench . . . . . . . . . . . . . . . . . 291
example. . . . . . . . . . . . . . . . . . . . . . . . . . . . . . . . . . . 29Strict ISO/ANSI. . . . . . . . . . . . . . . . . . . . . . . . . . . . . . 293Suppress these diagnostics . . . . . . . . . . . . . . . . . . . . . . 301Treat all warnings as errors . . . . . . . . . . . . . . . . . . . . . 301Treat these as errors . . . . . . . . . . . . . . . . . . . . . . . . . . . 301Treat these as remarks . . . . . . . . . . . . . . . . . . . . . . . . . 301Treat these as warnings . . . . . . . . . . . . . . . . . . . . . . . . 301
compiler outputdebug information, including . . . . . . . . . . . . . . . . . . . . 298module name . . . . . . . . . . . . . . . . . . . . . . . . . . . . . . . . 297
compiler preprocessor. . . . . . . . . . . . . . . . . . . . . . . . . . . . 299Compiler Reference Guide (Help menu). . . . . . . . . . . . . . 260compiler symbols, defining. . . . . . . . . . . . . . . . . . . . . . . . 299conditional breakpoints
example . . . . . . . . . . . . . . . . . . . . . . . . . . . . . . . . . . . . . 63conditional statements, in C-SPY macros . . . . . . . . . . . . . 330Conditions (Breakpoints dialog) . . . . . . . . . . . . . . . . . . . . 239configuration
for C-SPY FET . . . . . . . . . . . . . . . . . . . . . . . . . . . . . . 204Configure Tools (Tools menu) . . . . . . . . . . . . . . . . . . . . . 255config, 430 (subdirectory). . . . . . . . . . . . . . . . . . . . . . . . . . 16
U430-2
363

364
Context menusMessages window . . . . . . . . . . . . . . . . . . . . . . . . . . . . 231
context menusDisassembly window . . . . . . . . . . . . . . . . . . . . . . . . . . 265Memory window . . . . . . . . . . . . . . . . . . . . . . . . . . . . . 267Trace . . . . . . . . . . . . . . . . . . . . . . . . . . . . . . . . . . . . . . 278Watch window . . . . . . . . . . . . . . . . . . . . . . . . . . . . . . . 270Workspace window . . . . . . . . . . . . . . . . . . . . . . . . . . . 227
conventions, typographic . . . . . . . . . . . . . . . . . . . . . . . xxxivcost. See memory access costcpp (filename extension) . . . . . . . . . . . . . . . . . . . . . . . . . . . 18CPU variant, definition of . . . . . . . . . . . . . . . . . . . . . . . . . 351CRC
definition of . . . . . . . . . . . . . . . . . . . . . . . . . . . . . . . . . 350Cross-reference (assembler option). . . . . . . . . . . . . . . . . . 309cross-references
in map files . . . . . . . . . . . . . . . . . . . . . . . . . . . . . . . . . . 35Cstartup, definition of . . . . . . . . . . . . . . . . . . . . . . . . . . . . 350current position
in C-SPY Disassembly window . . . . . . . . . . . . . . . . . . 264cursor, in C-SPY Disassembly window. . . . . . . . . . . . . . . 264$CUR_DIR$ (argument variable) . . . . . . . . . . . . . . . . . . . 242$CUR_LINE$ (argument variable) . . . . . . . . . . . . . . . . . . 242custom build
options . . . . . . . . . . . . . . . . . . . . . . . . . . . . . . . . . . . . . 325using . . . . . . . . . . . . . . . . . . . . . . . . . . . . . . . . . . . . . . . 88
Custom Keyword File (editor option) . . . . . . . . . . . . . . . . 249C-SPY. . . . . . . . . . . . . . . . . . . . . . . . . . . . . . . . . . . . . . . . 101
characteristicsROM . . . . . . . . . . . . . . . . . . . . . . . . . . . . . . . . . . . . 173Simulator . . . . . . . . . . . . . . . . . . . . . . . . . . . . . . . . 153
debugger systems. . . . . . . . . . . . . . . . . . . . . . . . . . . . . . . 7IDE reference information . . . . . . . . . . . . . . . . . . . . . . 261overview . . . . . . . . . . . . . . . . . . . . . . . . . . . . . . . . . . . . . 5
C-SPY expressions . . . . . . . . . . . . . . . . . . . . . . . . . . . . . . 117evaluating. . . . . . . . . . . . . . . . . . . . . . . . . . . . . . . . . . . 120in C-SPY macros . . . . . . . . . . . . . . . . . . . . . . . . . . . . . 330Quick Watch, using . . . . . . . . . . . . . . . . . . . . . . . . . . . 120ToolTip watch, using . . . . . . . . . . . . . . . . . . . . . . . . . . 120
Watch window, using . . . . . . . . . . . . . . . . . . . . . . . . . . 120C-SPY macros . . . . . . . . . . . . . . . . . . . . . . . . . . . . . 135, 329
blocks. . . . . . . . . . . . . . . . . . . . . . . . . . . . . . . . . . . . . . 331conditional statements . . . . . . . . . . . . . . . . . . . . . . . . . 330C-SPY expressions . . . . . . . . . . . . . . . . . . . . . . . . . . . 330definition of the system . . . . . . . . . . . . . . . . . . . . . . . . 135dialog box . . . . . . . . . . . . . . . . . . . . . . . . . . . . . . . . . . 283dialog box, using . . . . . . . . . . . . . . . . . . . . . . . . . . . . . 138execUserExit() . . . . . . . . . . . . . . . . . . . . . . . . . . . . . . . 333execUserSetup()
example. . . . . . . . . . . . . . . . . . . . . . . . . . . . . . . . 59, 66executing . . . . . . . . . . . . . . . . . . . . . . . . . . . . . . . . . . . 137
connecting to a breakpoint . . . . . . . . . . . . . . . . . . . 141using Quick Watch . . . . . . . . . . . . . . . . . . . . . . . . . 140using setup macro and setup file . . . . . . . . . . . . . . . 139
functions . . . . . . . . . . . . . . . . . . . . . . . . . . . . . . . 118, 329loop statements . . . . . . . . . . . . . . . . . . . . . . . . . . . . . . 331macro statements . . . . . . . . . . . . . . . . . . . . . . . . . . . . . 330printing messages. . . . . . . . . . . . . . . . . . . . . . . . . . . . . 331setup macro file
definition of . . . . . . . . . . . . . . . . . . . . . . . . . . . . . . 137executing. . . . . . . . . . . . . . . . . . . . . . . . . . . . . . . . . 139
setup macro functiondefinition of . . . . . . . . . . . . . . . . . . . . . . . . . . . . . . 137execUserPreload(). . . . . . . . . . . . . . . . . . . . . . . . . . 332execUserReset() . . . . . . . . . . . . . . . . . . . . . . . . . . . 333execUserSetup() . . . . . . . . . . . . . . . . . . . . . . . . . . . 333summary . . . . . . . . . . . . . . . . . . . . . . . . . . . . . . . . . 332
using . . . . . . . . . . . . . . . . . . . . . . . . . . . . . . . . . . . . . . 135variables. . . . . . . . . . . . . . . . . . . . . . . . . . . . . . . . 118, 330_ _cancelAllInterrupts (system macro) . . . . . . . . . . . . 164_ _clearBreak (system macro) . . . . . . . . . . . . . . . . . . . 335_ _closeFile (system macro). . . . . . . . . . . . . . . . . . . . . 335_ _disableInterrupts (system macro) . . . . . . . . . . . . . . 164_ _driverType (system macro) . . . . . . . . . . . . . . . . . . . 336_ _enableInterrupts (system macro) . . . . . . . . . . . . . . . 165_ _openFile (system macro) . . . . . . . . . . . . . . . . . . . . . 336_ _orderInterrupt (system macro). . . . . . . . . . . . . . . . . 165_ _readFileByte (system macro) . . . . . . . . . . . . . 337–338
U430-2
MSP430 IAR Embedded Workbench™ IDEUser Guide

Index
_ _readMemoryByte (system macro) . . . . . . . . . . . . . . 338_ _registerMacroFile (system macro). . . . . . . . . . . . . . 340_ _resetFile (system macro) . . . . . . . . . . . . . . . . . . . . . 341_ _setCodeBreak (system macro). . . . . . . . . . . . . . . . . 342_ _setDataBreak (system macro) . . . . . . . . . . . . . 342–343_ _setSimBreak (system macro) _ _setSimBreak (C-SPY system macro) . . . . . . . . . . . . . . . . . . . . . . . . . . . . . . . 153_ _strFind. . . . . . . . . . . . . . . . . . . . . . . . . . . . . . . . . . . 343_ _subString. . . . . . . . . . . . . . . . . . . . . . . . . . . . . . . . . 344_ _toLower. . . . . . . . . . . . . . . . . . . . . . . . . . . . . . . . . . 344_ _toUpper . . . . . . . . . . . . . . . . . . . . . . . . . . . . . . . . . . 345_ _writeFile (system macro). . . . . . . . . . . . . . . . . . . . . 345_ _writeFileByte (system macro) . . . . . . . . . . . . . . . . . 346_ _writeMemoryByte (system macro) . . . . . . . . . . . . . 346_ _writeMemory16 (system macro) . . . . . . . . . . . . . . . 347_ _writeMemory32 (system macro) . . . . . . . . . . . . . . . 348_ _writeMemory8 (system macro) . . . . . . . . . . . . . . . . 347
C-SPY menusDebug . . . . . . . . . . . . . . . . . . . . . . . . . . . . . . . . . . . . . 281
C-SPY options . . . . . . . . . . . . . . . . . . . . . . . . . . . . . 243, 327definition of . . . . . . . . . . . . . . . . . . . . . . . . . . . . . . . . . 350Device description file . . . . . . . . . . . . . . . . . . . . . . . . . 328Driver. . . . . . . . . . . . . . . . . . . . . . . . . . . . . . . . . . . . . . 327FET options . . . . . . . . . . . . . . . . . . . . . . . . . . . . . . . . . 204Run to . . . . . . . . . . . . . . . . . . . . . . . . . . . . . . . . . 109, 328Setup . . . . . . . . . . . . . . . . . . . . . . . . . . . . . . . . . . . . . . 327Setup macro . . . . . . . . . . . . . . . . . . . . . . . . . . . . . . . . . 328
C-SPY windowsCall Stack. . . . . . . . . . . . . . . . . . . . . . . . . . . . . . . . . . . 271Code Coverage. . . . . . . . . . . . . . . . . . . . . . . . . . . 146, 273Disassembly. . . . . . . . . . . . . . . . . . . . . . . . . . . . . . . . . 264layouts . . . . . . . . . . . . . . . . . . . . . . . . . . . . . . . . . . . . . 104Locals . . . . . . . . . . . . . . . . . . . . . . . . . . . . . . . . . . . . . 270Log . . . . . . . . . . . . . . . . . . . . . . . . . . . . . . . . . . . . . . . 272main . . . . . . . . . . . . . . . . . . . . . . . . . . . . . . . . . . . . . . . 101Memory . . . . . . . . . . . . . . . . . . . . . . . . . . . . . . . . . . . . 266Memory, using . . . . . . . . . . . . . . . . . . . . . . . . . . . . . . . 129Profiling . . . . . . . . . . . . . . . . . . . . . . . . . . . . . . . . . . . . 274Register . . . . . . . . . . . . . . . . . . . . . . . . . . . . . . . . . . . . 268
example. . . . . . . . . . . . . . . . . . . . . . . . . . . . . . . . . . . 44
using . . . . . . . . . . . . . . . . . . . . . . . . . . . . . . . . . . . . 131Stack . . . . . . . . . . . . . . . . . . . . . . . . . . . . . . . . . . . . . . 279Terminal I/O . . . . . . . . . . . . . . . . . . . . . . . . . . . . . . . . 272
example. . . . . . . . . . . . . . . . . . . . . . . . . . . . . . . . . . . 46Trace . . . . . . . . . . . . . . . . . . . . . . . . . . . . . . . . . . 121, 276Watch. . . . . . . . . . . . . . . . . . . . . . . . . . . . . . . . . . . . . . 269
C-style preprocessordefinition of . . . . . . . . . . . . . . . . . . . . . . . . . . . . . . . . . 350
C/EC++ syntax styles, options . . . . . . . . . . . . . . . . . . . . . 249
Ddata pointers, definition of . . . . . . . . . . . . . . . . . . . . . . . . 351data representation, definition of. . . . . . . . . . . . . . . . . . . . 351ddf (filename extension) . . . . . . . . . . . . . . . . . . . . . . . 18, 110Debug info with terminal I/O (XLINK option) . 116, 272, 313Debug info (XLINK option) . . . . . . . . . . . . . . . . . . . . . . . 313debug information
generating in assembler . . . . . . . . . . . . . . . . . . . . . . . . 306in compiler, generating . . . . . . . . . . . . . . . . . . . . . . . . 298
Debug menu . . . . . . . . . . . . . . . . . . . . . . . . . . . . . . . . . . . 281Debug (assembler option) . . . . . . . . . . . . . . . . . . . . . . . . . 306debugger concepts, definitions of . . . . . . . . . . . . . . . . . . . . 99Debugger (IDE Options dialog) . . . . . . . . . . . . . . . . 252–253debugging projects
in disassembly modeexample. . . . . . . . . . . . . . . . . . . . . . . . . . . . . . . . . . . 43
declaration, definition of . . . . . . . . . . . . . . . . . . . . . . . . . . 351default installation path. . . . . . . . . . . . . . . . . . . . . . . . . . . . 15#define options (XLINK) . . . . . . . . . . . . . . . . . . . . . . . . . 314#define statement, in compiler . . . . . . . . . . . . . . . . . . . . . 299#define (assembler options) . . . . . . . . . . . . . . . . . . . . . . . 307Define symbol (assembler option) . . . . . . . . . . . . . . . . . . 307Define symbol (XLINK option) . . . . . . . . . . . . . . . . . . . . 314Defined symbols (compiler option). . . . . . . . . . . . . . . . . . 299definition, definition of . . . . . . . . . . . . . . . . . . . . . . . . . . . 351demo application, running with C-SPY FET. . . . . . . . . . . 190dep (filename extension) . . . . . . . . . . . . . . . . . . . . . . . . . . . 18derivative, definition of . . . . . . . . . . . . . . . . . . . . . . . . . . . 351
U430-2
365

366
design considerations (FET)boot-strap loader . . . . . . . . . . . . . . . . . . . . . . . . . . . . . 217device signals. . . . . . . . . . . . . . . . . . . . . . . . . . . . . . . . 217external power . . . . . . . . . . . . . . . . . . . . . . . . . . . . . . . 217
Development environmentintroduction . . . . . . . . . . . . . . . . . . . . . . . . . . . . . . . . . . 73
Device description file (C-SPY option). . . . . . . . . . . . . . . 328device description files . . . . . . . . . . . . . . . . . . . . . . . . 16, 110
definition of . . . . . . . . . . . . . . . . . . . . . . . . . . . . . 107, 351memory zones . . . . . . . . . . . . . . . . . . . . . . . . . . . . . . . 108modifying . . . . . . . . . . . . . . . . . . . . . . . . . . . . . . . . . . 109register zone. . . . . . . . . . . . . . . . . . . . . . . . . . . . . . . . . 108specifying interrupts . . . . . . . . . . . . . . . . . . . . . . . . . . 165using with memory maps . . . . . . . . . . . . . . . . . . . . . . . 155
device driver, definition of . . . . . . . . . . . . . . . . . . . . . . . . 351Diagnostics
in list file (compiler option) . . . . . . . . . . . . . . . . . . . . . 298(compiler option) . . . . . . . . . . . . . . . . . . . . . . . . . . . . . 300(XLINK option) . . . . . . . . . . . . . . . . . . . . . . . . . . . . . . 315
diagnosticsassembler, suppressing. . . . . . . . . . . . . . . . . . . . . . . . . 305compiler
including in list file . . . . . . . . . . . . . . . . . . . . . . . . . 298suppressing . . . . . . . . . . . . . . . . . . . . . . . . . . . . . . . 301
XLINK. . . . . . . . . . . . . . . . . . . . . . . . . . . . . . . . . . . . . 315suppressing . . . . . . . . . . . . . . . . . . . . . . . . . . . . . . . 316
dialog boxesBreakpoints (Edit menu) . . . . . . . . . . . . . . . . . . . . . . . 237Common fonts (IDE Options dialog) . . . . . . . . . . . . . . 246Debugger (IDE Options dialog) . . . . . . . . . . . . . . . . . . 253Editor Colors and Fonts (IDE Options dialog) . . . . . . . 249Editor (IDE Options dialog). . . . . . . . . . . . . . . . . . . . . 248EEM breakpoints dialog box (Edit menu) . . . . . . . . . . 206External Editor (IDE Options dialog) . . . . . . . . . . . . . 245File Extensions (Tools menu). . . . . . . . . . . . . . . . 257–258Find in Files (Edit menu) . . . . . . . . . . . . . . . . . . . . . . . 236Find (Edit menu) . . . . . . . . . . . . . . . . . . . . . . . . . . . . . 235Key Bindings (IDE Options dialog) . . . . . . . . . . . . . . . 247Log File (Debug menu) . . . . . . . . . . . . . . . . . . . . . . . . 285
Macro Configuration (Debug menu) . . . . . . . . . . . . . . 283Messages (IDE Options dialog) . . . . . . . . . . . . . . . . . . 252Options (Project menu) . . . . . . . . . . . . . . . . . . . . . . . . 243Quick Watch (Debug menu). . . . . . . . . . . . . . . . . . . . . 283Register Filter (IDE Options dialog) . . . . . . . . . . . . . . 254Replace (Edit menu) . . . . . . . . . . . . . . . . . . . . . . . . . . 235Sequencer (Emulator menu). . . . . . . . . . . . . . . . . . . . . 214Set Log file (Debug menu). . . . . . . . . . . . . . . . . . . . . . 282Stack settings (Stack window) . . . . . . . . . . . . . . . . . . . 280State Storage (Emulator menu) . . . . . . . . . . . . . . . . . . 211Terminal I/O Log File (Debug menu). . . . . . . . . . . . . . 286
digital signal processor, definition of . . . . . . . . . . . . . . . . 351directories
common\bin . . . . . . . . . . . . . . . . . . . . . . . . . . . . . . . . . . 16common\doc . . . . . . . . . . . . . . . . . . . . . . . . . . . . . . . . . 16common\src . . . . . . . . . . . . . . . . . . . . . . . . . . . . . . . . . . 16settings. . . . . . . . . . . . . . . . . . . . . . . . . . . . . . . . . . . . . . 19430\bin. . . . . . . . . . . . . . . . . . . . . . . . . . . . . . . . . . . . . . 16430\config . . . . . . . . . . . . . . . . . . . . . . . . . . . . . . . . . . . 16430\doc . . . . . . . . . . . . . . . . . . . . . . . . . . . . . . . . . . . . . 17430\FET_examples . . . . . . . . . . . . . . . . . . . . . . . . . . . . 17430\inc . . . . . . . . . . . . . . . . . . . . . . . . . . . . . . . . . . . . . . 17430\layouts . . . . . . . . . . . . . . . . . . . . . . . . . . . . . . . . . . 17430\lib . . . . . . . . . . . . . . . . . . . . . . . . . . . . . . . . . . . . . . 17430\src . . . . . . . . . . . . . . . . . . . . . . . . . . . . . . . . . . . . . . 17430\tutor . . . . . . . . . . . . . . . . . . . . . . . . . . . . . . . . . . . . 17
directory structure . . . . . . . . . . . . . . . . . . . . . . . . . . . . . . . . 15Disable language extensions (compiler option). . . . . . . . . 293Disable #ifdef/#endif matching (assembler option). . . . . . 304_ _disableInterrupts (C-SPY system macro) . . . . . . . . . . . 335disassembly mode debugging, example . . . . . . . . . . . . . . . 43Disassembly window . . . . . . . . . . . . . . . . . . . . . . . . . . . . 264
context menu . . . . . . . . . . . . . . . . . . . . . . . . . . . . . . . . 265definition of . . . . . . . . . . . . . . . . . . . . . . . . . . . . . . . . . 351
DLIB. . . . . . . . . . . . . . . . . . . . . . . . . . . . . . . . . . . . . . . . . . 10documentation . . . . . . . . . . . . . . . . . . . . . . . . . . . . . . . . 20specifying . . . . . . . . . . . . . . . . . . . . . . . . . . . . . . . . . . 290
DLIB Library Reference Guide C part (Help menu) . . . . . 260DLIB Library Reference Guide EC++ part (Help menu) . 260
U430-2
MSP430 IAR Embedded Workbench™ IDEUser Guide

Index
dni (filename extension) . . . . . . . . . . . . . . . . . . . . . . . . 18–19do (macro statement) . . . . . . . . . . . . . . . . . . . . . . . . . . . . 331document conventions. . . . . . . . . . . . . . . . . . . . . . . . . . xxxivdocumentation . . . . . . . . . . . . . . . . . . . . . . . . . . . . . . . . . . 15
assembler . . . . . . . . . . . . . . . . . . . . . . . . . . . . . . . . . . . . 11compiler . . . . . . . . . . . . . . . . . . . . . . . . . . . . . . . . . . . . . 10online . . . . . . . . . . . . . . . . . . . . . . . . . . . . . . . . . . . . 16–17other documentation . . . . . . . . . . . . . . . . . . . . . . . . xxxiiiproduct. . . . . . . . . . . . . . . . . . . . . . . . . . . . . . . . . . . . . . 19runtime libraries. . . . . . . . . . . . . . . . . . . . . . . . . . . . . . . 20this guide . . . . . . . . . . . . . . . . . . . . . . . . . . . . . . . . . . xxixXLIB . . . . . . . . . . . . . . . . . . . . . . . . . . . . . . . . . . . . . . . 13XLINK. . . . . . . . . . . . . . . . . . . . . . . . . . . . . . . . . . . . . . 12
doc, common (subdirectory) . . . . . . . . . . . . . . . . . . . . . . . . 16doc, 430 (subdirectory) . . . . . . . . . . . . . . . . . . . . . . . . . . . . 17Download control (C-SPY FET options) . . . . . . . . . . . . . 204drag-and-drop
of text in editor window . . . . . . . . . . . . . . . . . . . . . . . . . 93Driver (C-SPY option) . . . . . . . . . . . . . . . . . . . . . . . . . . . 327_ _driverType (C-SPY system macro). . . . . . . . . . . . . . . . 335DSP. See digital signal processorDynamic Data Exchange (DDE), calling external editor. . . . . . . . . . . . . . . . . . . . . . . . . . . . . . . . . . . . . . . . . 245dynamic initialization, definition of . . . . . . . . . . . . . . . . . 351dynamic memory allocation, definition of . . . . . . . . . . . . 351dynamic object, definition of . . . . . . . . . . . . . . . . . . . . . . 351d45 (filename extension). . . . . . . . . . . . . . . . . . . . . . . . . . . 18
EEdit menu . . . . . . . . . . . . . . . . . . . . . . . . . . . . . . . . . . . . . 233editing source files . . . . . . . . . . . . . . . . . . . . . . . . . . . . . . . 91editor
commands . . . . . . . . . . . . . . . . . . . . . . . . . . . . . . . . . . . 92customizing the environment . . . . . . . . . . . . . . . . . . . . . 94features . . . . . . . . . . . . . . . . . . . . . . . . . . . . . . . . . . . . . . 4indentation . . . . . . . . . . . . . . . . . . . . . . . . . . . . . . . . . . . 93keyboard commands . . . . . . . . . . . . . . . . . . . . . . . . . . 229matching brackets . . . . . . . . . . . . . . . . . . . . . . . . . . . . . 93
options . . . . . . . . . . . . . . . . . . . . . . . . . . . . . . . . . . . . . 248shortcut to functions. . . . . . . . . . . . . . . . . . . . . . . . 93, 228splitter controls . . . . . . . . . . . . . . . . . . . . . . . . . . . . . . 228status bar, using in . . . . . . . . . . . . . . . . . . . . . . . . . . . . . 94using . . . . . . . . . . . . . . . . . . . . . . . . . . . . . . . . . . . . . . . 91using external. . . . . . . . . . . . . . . . . . . . . . . . . . . . . . . . . 94
Editor Colors and Fonts (IDE Options dialog) . . . . . . . . . 249Editor window . . . . . . . . . . . . . . . . . . . . . . . . . . . . . . . . . 228Editor (IDE Options dialog) . . . . . . . . . . . . . . . . . . . . . . . 248EEM breakpoints dialog box (Edit menu). . . . . . . . . . . . . 206EEPROM, definition of. . . . . . . . . . . . . . . . . . . . . . . . . . . 352Embedded C++
definition of . . . . . . . . . . . . . . . . . . . . . . . . . . . . . . . . . 352syntax, enabling in compiler . . . . . . . . . . . . . . . . . . . . 292tutorial . . . . . . . . . . . . . . . . . . . . . . . . . . . . . . . . . . . . . . 51
embedded system, definition of . . . . . . . . . . . . . . . . . . . . 352Embedded Workbench
Editor . . . . . . . . . . . . . . . . . . . . . . . . . . . . . . . . . . . . . . . 91exiting from . . . . . . . . . . . . . . . . . . . . . . . . . . . . . . . . . . 75main window . . . . . . . . . . . . . . . . . . . . . . . . . . . . . 74, 224reference information. . . . . . . . . . . . . . . . . . . . . . . . . . 223running. . . . . . . . . . . . . . . . . . . . . . . . . . . . . . . . . . . . . . 74version number, displaying . . . . . . . . . . . . . . . . . . . . . 260
Embedded Workbench User Guide (Help menu) . . . . . . . 260Emulator menu . . . . . . . . . . . . . . . . . . . . . . . . . . . . . 209, 286emulator (C-SPY version)
definition of . . . . . . . . . . . . . . . . . . . . . . . . . . . . . . . . . 352features . . . . . . . . . . . . . . . . . . . . . . . . . . . . . . . . . . . . . . 8third-party . . . . . . . . . . . . . . . . . . . . . . . . . . . . . . . . . . . . 4
Enable Embedded C++ syntax (compiler option) . . . . . . . 292Enable multibyte support (compiler option) . . . . . . . . . . . 293Enable remarks (compiler option). . . . . . . . . . . . . . . . . . . 300Enable Virtual Space (editor option) . . . . . . . . . . . . . . . . . 249enabled transformations, in compiler . . . . . . . . . . . . . . . . 295_ _enableInterrupts (C-SPY system macro) . . . . . . . . . . . 336enumeration, definition of. . . . . . . . . . . . . . . . . . . . . . . . . 352EPROM, definition of . . . . . . . . . . . . . . . . . . . . . . . . . . . . 352error messages
assembler . . . . . . . . . . . . . . . . . . . . . . . . . . . . . . . . . . . 305
U430-2
367

368
compiler . . . . . . . . . . . . . . . . . . . . . . . . . . . . . . . . . . . . 301XLINK. . . . . . . . . . . . . . . . . . . . . . . . . . . . . . . . . . . . . 316
ewd (filename extension) . . . . . . . . . . . . . . . . . . . . . . . . . . 18ewp (filename extension) . . . . . . . . . . . . . . . . . . . . . . . . . . 18eww (filename extension) . . . . . . . . . . . . . . . . . . . . . . . . . . 18$EW_DIR$ (argument variable) . . . . . . . . . . . . . . . . . . . . 242examples
assemblermixing C and asm . . . . . . . . . . . . . . . . . . . . . . . . . . . 47running project with C-SPY FET . . . . . . . . . . . . . . 190viewing list file . . . . . . . . . . . . . . . . . . . . . . . . . . . . . 49
breakpointsexecuting up to . . . . . . . . . . . . . . . . . . . . . . . . . . . . . 42setting . . . . . . . . . . . . . . . . . . . . . . . . . . . . . . . . . . . . 42setting, using macro . . . . . . . . . . . . . . . . . . . . . . . . . 66setting, using options dialog . . . . . . . . . . . . . . . . . . . 63
C example, running with C-SPY FET . . . . . . . . . . . . . 191calling convention, examining . . . . . . . . . . . . . . . . . . . . 47compiling. . . . . . . . . . . . . . . . . . . . . . . . . . . . . . . . . . . . 31ddf file, using . . . . . . . . . . . . . . . . . . . . . . . . . . . . . . . . . 61debugging a program . . . . . . . . . . . . . . . . . . . . . . . . . . . 37disassembly mode debugging. . . . . . . . . . . . . . . . . . . . . 43displaying function calls in C-SPY . . . . . . . . . . . . . . . . 62displaying Terminal I/O . . . . . . . . . . . . . . . . . . . . . . . . . 46EEM breakpoint triggering state storage . . . . . . . . . . . 197interrupt
timer interrupt . . . . . . . . . . . . . . . . . . . . . . . . . . . . . 162interrupts
using dialog box . . . . . . . . . . . . . . . . . . . . . . . . . . . 160using macro. . . . . . . . . . . . . . . . . . . . . . . . . . . . . . . . 66
linkinga compiler program. . . . . . . . . . . . . . . . . . . . . . . . . . 34viewing the map file . . . . . . . . . . . . . . . . . . . . . . . . . 35
macrosfor interrupts and breakpoints . . . . . . . . . . . . . . . . . . 66using Quick Watch . . . . . . . . . . . . . . . . . . . . . . . . . 140
Memory window, using . . . . . . . . . . . . . . . . . . . . . . . . . 44mixing C/C++ and assembler. . . . . . . . . . . . . . . . . . . . . 48monitoring memory . . . . . . . . . . . . . . . . . . . . . . . . . . . . 44
monitoring registers . . . . . . . . . . . . . . . . . . . . . . . . . . . . 43options
setting project . . . . . . . . . . . . . . . . . . . . . . . . . . . . . . 29performing side-effects without stopping execution. . . 126periodically monitoring data . . . . . . . . . . . . . . . . . . . . 126project
adding files . . . . . . . . . . . . . . . . . . . . . . . . . . . . . . . . 28creating . . . . . . . . . . . . . . . . . . . . . . . . . . . . . . . . 25, 27setting options. . . . . . . . . . . . . . . . . . . . . . . . . . . . . . 29
reaching program exit . . . . . . . . . . . . . . . . . . . . . . . . . . 46Scan for Changed Files (editor option), using . . . . . . . . 33state storage, using. . . . . . . . . . . . . . . . . . . . . . . . . . . . 196stepping . . . . . . . . . . . . . . . . . . . . . . . . . . . . . . . . . . . . . 39tracing incorrect function arguments . . . . . . . . . . . . . . 125using libraries . . . . . . . . . . . . . . . . . . . . . . . . . . . . . . . . 67variables
setting a watch point . . . . . . . . . . . . . . . . . . . . . . . . . 41watching in C-SPY . . . . . . . . . . . . . . . . . . . . . . . . . . 40
viewing compiler list files . . . . . . . . . . . . . . . . . . . . . . . 32workspace, creating a new . . . . . . . . . . . . . . . . . . . . . . . 26
exceptions, definition of . . . . . . . . . . . . . . . . . . . . . . . . . . 352execUserExit() (C-SPY setup macro) . . . . . . . . . . . . . . . . 333execUserPreload() (C-SPY setup macro) . . . . . . . . . . . . . 332execUserReset() (C-SPY setup macro) . . . . . . . . . . . . . . . 333execUserSetup() (C-SPY setup macro) . . . . . . . . . . . . . . . 333
example . . . . . . . . . . . . . . . . . . . . . . . . . . . . . . . . . . 59, 66Executables (output directory) . . . . . . . . . . . . . . . . . . . . . 289executing a program up to a breakpoint . . . . . . . . . . . . . . . 42$EXE_DIR$ (argument variable) . . . . . . . . . . . . . . . . . . . 242exit
example, reaching program . . . . . . . . . . . . . . . . . . . . . . 46using C-SPY ROM-monitor. . . . . . . . . . . . . . . . . . . . . 174
Exit (File menu) . . . . . . . . . . . . . . . . . . . . . . . . . . . . . . . . . 75expensive memory access, definition of . . . . . . . . . . . . . . 352expressions. See C-SPY expressionsextended keywords, definition of . . . . . . . . . . . . . . . . . . . 352extended linker command line file. See linker command fileextensions. See filename extensions or language extensionsExternal Editor (IDE Options dialog) . . . . . . . . . . . . . . . . 245
U430-2
MSP430 IAR Embedded Workbench™ IDEUser Guide

Index
Ffactory settings
compiler . . . . . . . . . . . . . . . . . . . . . . . . . . . . . . . . . . . . . 85restoring default settings . . . . . . . . . . . . . . . . . . . . . . . . 86XLINK. . . . . . . . . . . . . . . . . . . . . . . . . . . . . . . . . 311, 323
featuresassembler . . . . . . . . . . . . . . . . . . . . . . . . . . . . . . . . . . . . 11compiler . . . . . . . . . . . . . . . . . . . . . . . . . . . . . . . . . . . . . . 9editor . . . . . . . . . . . . . . . . . . . . . . . . . . . . . . . . . . . . . . . . 4XLIB . . . . . . . . . . . . . . . . . . . . . . . . . . . . . . . . . . . . . . . 12
FETcharacteristics . . . . . . . . . . . . . . . . . . . . . . . . . . . . . . . 193design considerations . . . . . . . . . . . . . . . . . . . . . . . . . . 217functionality
breakpoints . . . . . . . . . . . . . . . . . . . . . . . . . . . . . . . 193state storage . . . . . . . . . . . . . . . . . . . . . . . . . . . . . . 196stepping. . . . . . . . . . . . . . . . . . . . . . . . . . . . . . . . . . 196
options . . . . . . . . . . . . . . . . . . . . . . . . . . . . . . . . . . . . . 204overview . . . . . . . . . . . . . . . . . . . . . . . . . . . . . . . . . . . . . 8
FET_examples, 430 (subdirectory) . . . . . . . . . . . . . . . . . . . 17File Extensions dialog box (Tools menu) . . . . . . . . . 257–258file extensions. See filename extensionsFile menu . . . . . . . . . . . . . . . . . . . . . . . . . . . . . . . . . . . . . 231file types
device description . . . . . . . . . . . . . . . . . . . . . . . . . . . . . 16specifying in Embedded Workbench. . . . . . . . . . . . 110
documentation . . . . . . . . . . . . . . . . . . . . . . . . . . . . . . . . 17header . . . . . . . . . . . . . . . . . . . . . . . . . . . . . . . . . . . . . . 17include . . . . . . . . . . . . . . . . . . . . . . . . . . . . . . . . . . . . . . 17library . . . . . . . . . . . . . . . . . . . . . . . . . . . . . . . . . . . . . . 17linker command file templates . . . . . . . . . . . . . . . . . . . . 16macro . . . . . . . . . . . . . . . . . . . . . . . . . . . . . . . . . . 110, 328map . . . . . . . . . . . . . . . . . . . . . . . . . . . . . . . . . . . . . . . 317read me . . . . . . . . . . . . . . . . . . . . . . . . . . . . . . . . . . 16–17special function registers description files . . . . . . . . . . . 16syntax coloring configuration. . . . . . . . . . . . . . . . . . . . . 16
filename extensions. . . . . . . . . . . . . . . . . . . . . . . . . . . . . . . 17asm . . . . . . . . . . . . . . . . . . . . . . . . . . . . . . . . . . . . . . . . 17
a45 . . . . . . . . . . . . . . . . . . . . . . . . . . . . . . . . . . . . . . . . . 17c . . . . . . . . . . . . . . . . . . . . . . . . . . . . . . . . . . . . . . . . . . . 18cfg . . . . . . . . . . . . . . . . . . . . . . . . . . . . . . . . . . . . . 18, 250cpp . . . . . . . . . . . . . . . . . . . . . . . . . . . . . . . . . . . . . . . . . 18ddf . . . . . . . . . . . . . . . . . . . . . . . . . . . . . . . . . . . . . . . . . 18dep . . . . . . . . . . . . . . . . . . . . . . . . . . . . . . . . . . . . . . . . . 18dni . . . . . . . . . . . . . . . . . . . . . . . . . . . . . . . . . . . . . . 18–19d45. . . . . . . . . . . . . . . . . . . . . . . . . . . . . . . . . . . . . . . . . 18ewd . . . . . . . . . . . . . . . . . . . . . . . . . . . . . . . . . . . . . . . . 18ewp . . . . . . . . . . . . . . . . . . . . . . . . . . . . . . . . . . . . . . . . 18eww . . . . . . . . . . . . . . . . . . . . . . . . . . . . . . . . . . . . . . . . 18h. . . . . . . . . . . . . . . . . . . . . . . . . . . . . . . . . . . . . . . . . . . 18i . . . . . . . . . . . . . . . . . . . . . . . . . . . . . . . . . . . . . . . . . . . 18inc . . . . . . . . . . . . . . . . . . . . . . . . . . . . . . . . . . . . . . . . . 18ini. . . . . . . . . . . . . . . . . . . . . . . . . . . . . . . . . . . . . . . . . . 19lew . . . . . . . . . . . . . . . . . . . . . . . . . . . . . . . . . . . . . . . . . 18lst . . . . . . . . . . . . . . . . . . . . . . . . . . . . . . . . . . . . . . . . . . 18mac . . . . . . . . . . . . . . . . . . . . . . . . . . . . . . . . . . . . . . . . 18map . . . . . . . . . . . . . . . . . . . . . . . . . . . . . . . . . . . . . 18–19prj . . . . . . . . . . . . . . . . . . . . . . . . . . . . . . . . . . . . . . . . . 18r45 . . . . . . . . . . . . . . . . . . . . . . . . . . . . . . . . . . . . . . . . . 18sfr. . . . . . . . . . . . . . . . . . . . . . . . . . . . . . . . . . . . . . . . . . 18
register definitions for C-SPY. . . . . . . . . . . . . . . . . 108s45 . . . . . . . . . . . . . . . . . . . . . . . . . . . . . . . . . . . . . . . . . 18xcl . . . . . . . . . . . . . . . . . . . . . . . . . . . . . . . . . . . . . . . . . 18xlb . . . . . . . . . . . . . . . . . . . . . . . . . . . . . . . . . . . . . . . . . 18
filesadding to a project . . . . . . . . . . . . . . . . . . . . . . . . . . . . . 28compiling
example. . . . . . . . . . . . . . . . . . . . . . . . . . . . . . . . . . . 31editing . . . . . . . . . . . . . . . . . . . . . . . . . . . . . . . . . . . . . . 91readme.htm . . . . . . . . . . . . . . . . . . . . . . . . . . . . . . . . . . 20
$FILE_DIR$ (argument variable) . . . . . . . . . . . . . . . . . . . 242$FILE_FNAME$ (argument variable) . . . . . . . . . . . . . . . 242$FILE_PATH$ (argument variable) . . . . . . . . . . . . . . . . . 242Fill dialog box
using . . . . . . . . . . . . . . . . . . . . . . . . . . . . . . . . . . . . . . 130Fill pattern (XLINK option) . . . . . . . . . . . . . . . . . . . . . . . 321Fill unused code memory (XLINK option) . . . . . . . . . . . . 321
U430-2
369
370
Find dialog box (Edit menu) . . . . . . . . . . . . . . . . . . . . . . . 235Find in Files dialog box (Edit menu). . . . . . . . . . . . . . . . . 236Find in Files page (in Messages window) . . . . . . . . . . . . . 230Find (button) . . . . . . . . . . . . . . . . . . . . . . . . . . . . . . . . . . . 225for (macro statement) . . . . . . . . . . . . . . . . . . . . . . . . . . . . 331format specifiers, definition of . . . . . . . . . . . . . . . . . . . . . 352Format (XLINK option) . . . . . . . . . . . . . . . . . . . . . . . . . . 312formats
assembler list file . . . . . . . . . . . . . . . . . . . . . . . . . . . . . . 49compiler list file . . . . . . . . . . . . . . . . . . . . . . . . . . . . . . . 32C-SPY input. . . . . . . . . . . . . . . . . . . . . . . . . . . . . . . . . . . 7XLINK output
default, overriding. . . . . . . . . . . . . . . . . . . . . . . . . . 313XLINK output formats
specifying . . . . . . . . . . . . . . . . . . . . . . . . . . . . . . . . 312function calls
displaying in C-SPYexample. . . . . . . . . . . . . . . . . . . . . . . . . . . . . . . . . . . 62
Function inlining (compiler option) . . . . . . . . . . . . . . . . . 296functions
C-SPY running to when starting . . . . . . . . . . . . . 109, 328intrinsic, definition of. . . . . . . . . . . . . . . . . . . . . . . . . . 353shortcut to in editor windows . . . . . . . . . . . . . . . . . 93, 228
Ggeneral options . . . . . . . . . . . . . . . . . . . . . . . . . . . . . . . . . 287
definition of . . . . . . . . . . . . . . . . . . . . . . . . . . . . . . . . . 352specifying, example . . . . . . . . . . . . . . . . . . . . . . . . . . . . 29
Generate checksum (XLINK option) . . . . . . . . . . . . . . . . 321Generate debug information (assembler option) . . . . . . . . 306Generate debug information (compiler option) . . . . . . . . . 298Generate linker listing (XLINK option) . . . . . . . . . . . . . . 317generic pointers, definition of . . . . . . . . . . . . . . . . . . . . . . 352Getting started, using the C-SPY FET . . . . . . . . . . . . . . . 190glossary. . . . . . . . . . . . . . . . . . . . . . . . . . . . . . . . . . . . . . . 349Go to function (editor button) . . . . . . . . . . . . . . . . . . . 93, 228Go to (button) . . . . . . . . . . . . . . . . . . . . . . . . . . . . . . . . . . 225Go (button) . . . . . . . . . . . . . . . . . . . . . . . . . . . . . . . . . . . . 263
Go (Debug menu) . . . . . . . . . . . . . . . . . . . . . . . . . . . . . . . 114groups, definition of . . . . . . . . . . . . . . . . . . . . . . . . . . . . . . 81
Hh (filename extension). . . . . . . . . . . . . . . . . . . . . . . . . . . . . 18hardware multiplier, enabling support for . . . . . . . . . . . . . 109Harvard architecture . . . . . . . . . . . . . . . . . . . . . . . . . . . . . 156
definition of . . . . . . . . . . . . . . . . . . . . . . . . . . . . . . . . . 353header files . . . . . . . . . . . . . . . . . . . . . . . . . . . . . . . . . . . . . 17heap memory, definition of . . . . . . . . . . . . . . . . . . . . . . . . 353heap size, definition of . . . . . . . . . . . . . . . . . . . . . . . . . . . 353Help menu . . . . . . . . . . . . . . . . . . . . . . . . . . . . . . . . . . . . 260
Assembler Reference Guide. . . . . . . . . . . . . . . . . . . . . 260CLIB Library Reference Guide . . . . . . . . . . . . . . . . . . 260Compiler Reference Guide. . . . . . . . . . . . . . . . . . . . . . 260DLIB Library Reference Guide C part . . . . . . . . . . . . . 260DLIB Library Reference Guide EC++ part . . . . . . . . . 260Embedded Workbench User Guide . . . . . . . . . . . . . . . 260Linker and Library Tools Reference Guide . . . . . . . . . 260
help, online . . . . . . . . . . . . . . . . . . . . . . . . . . . . . . . . . . . . . 20highlight color, paler variant of . . . . . . . . . . . . . . . . . . . . . 114Hold time, definition of. . . . . . . . . . . . . . . . . . . . . . . . . . . 158host, definition of . . . . . . . . . . . . . . . . . . . . . . . . . . . . . . . 353
Ii (filename extension) . . . . . . . . . . . . . . . . . . . . . . . . . . . . . 18IAR Assembler Reference Guide . . . . . . . . . . . . . . . . . . . . 19IAR Compiler Reference Guide . . . . . . . . . . . . . . . . . . . . . 19IAR Linker and Library Tools Reference Guide . . . . . . . . . 20IAR Systems website . . . . . . . . . . . . . . . . . . . . . . . . . . . . . 20IarIdePm.exe. . . . . . . . . . . . . . . . . . . . . . . . . . . . . . . . . . . . 74ICC430 options. . . . . . . . . . . . . . . . . . . . . . . . . . . . . . . . . 291IDE . . . . . . . . . . . . . . . . . . . . . . . . . . . . . . . . . . . . . . . . . . 3–4
definition of . . . . . . . . . . . . . . . . . . . . . . . . . . . . . . . . . 353if else (macro statement) . . . . . . . . . . . . . . . . . . . . . . . . . . 330if (macro statement) . . . . . . . . . . . . . . . . . . . . . . . . . . . . . 330Ignore CSTARTUP in library (XLINK option) . . . . . . . . . 318
U430-2
MSP430 IAR Embedded Workbench™ IDEUser Guide

Index
illegal access . . . . . . . . . . . . . . . . . . . . . . . . . . . . . . . . . . . 154inc (filename extension) . . . . . . . . . . . . . . . . . . . . . . . . . . . 18include files. . . . . . . . . . . . . . . . . . . . . . . . . . . . . . . . . . . . . 17
compiler, specifying path . . . . . . . . . . . . . . . . . . . . . . . 299definition of . . . . . . . . . . . . . . . . . . . . . . . . . . . . . . . . . 353XLINK, specifying path. . . . . . . . . . . . . . . . . . . . . . . . 318
Include header (assembler option) . . . . . . . . . . . . . . . . . . 308Include listing (assembler option) . . . . . . . . . . . . . . . . . . . 308Include options (XLINK) . . . . . . . . . . . . . . . . . . . . . . . . . 318Include paths (compiler option) . . . . . . . . . . . . . . . . . . . . 299Include paths (XLINK option) . . . . . . . . . . . . . . . . . . . . . 318Include source (compiler option) . . . . . . . . . . . . . . . . . . . 298Include (assembler option) . . . . . . . . . . . . . . . . . . . . . . . . 310inc, 430 (subdirectory) . . . . . . . . . . . . . . . . . . . . . . . . . . . . 17Indent Size (editor option) . . . . . . . . . . . . . . . . . . . . . . . . 248indentation, in Editor . . . . . . . . . . . . . . . . . . . . . . . . . . . . . 93information, product . . . . . . . . . . . . . . . . . . . . . . . . . . . . . . 19Inherent (XLINK option) . . . . . . . . . . . . . . . . . . . . . . . . . 319Inherent, no object code (XLINK option) . . . . . . . . . . . . . 320ini (filename extension) . . . . . . . . . . . . . . . . . . . . . . . . . . . 19inline assembler, definition of . . . . . . . . . . . . . . . . . . . . . . 353inlining
definition of . . . . . . . . . . . . . . . . . . . . . . . . . . . . . . . . . 353of functions, in compiler . . . . . . . . . . . . . . . . . . . . . . . 296
inputredirecting to Terminal I/O window. . . . . . . . . . . . . . . 272
input formats, C-SPY . . . . . . . . . . . . . . . . . . . . . . . . . . . . . . 7input modules, specifying status in XLINK . . . . . . . . . . . 319Input options (XLINK) . . . . . . . . . . . . . . . . . . . . . . . . . . . 319installation path, default . . . . . . . . . . . . . . . . . . . . . . . . . . . 15installed files. . . . . . . . . . . . . . . . . . . . . . . . . . . . . . . . . . . . 15
documentation . . . . . . . . . . . . . . . . . . . . . . . . . . . . . 16–17executables. . . . . . . . . . . . . . . . . . . . . . . . . . . . . . . . . . . 16include . . . . . . . . . . . . . . . . . . . . . . . . . . . . . . . . . . . . . . 17library . . . . . . . . . . . . . . . . . . . . . . . . . . . . . . . . . . . . . . 17
instruction mnemonics, definition of. . . . . . . . . . . . . . . . . 353Integrated Development Environment (IDE). . . . . . . . . . . 3–4
definition of . . . . . . . . . . . . . . . . . . . . . . . . . . . . . . . . . 353Intel-extended, C-SPY input format . . . . . . . . . . . . . . . 7, 101
Internet, IAR Systems website . . . . . . . . . . . . . . . . . . . . . . 20interrupt vector table, definition of . . . . . . . . . . . . . . . . . . 353interrupt vector, definition of . . . . . . . . . . . . . . . . . . . . . . 353interrupts
adapting C-SPY system for target hardware . . . . . . . . 158definition of . . . . . . . . . . . . . . . . . . . . . . . . . . . . . . . . . 353definition of simulated interrupts . . . . . . . . . . . . . . . . . 157in ddf . . . . . . . . . . . . . . . . . . . . . . . . . . . . . . . . . . . . . . 109nested, definition of . . . . . . . . . . . . . . . . . . . . . . . . . . . 355options . . . . . . . . . . . . . . . . . . . . . . . . . . . . . . . . . . . . . 161timer interrupt, example. . . . . . . . . . . . . . . . . . . . . . . . 162using dialog box. . . . . . . . . . . . . . . . . . . . . . . . . . . . . . 160using system macros . . . . . . . . . . . . . . . . . . . . . . . . . . 161
Interrupts (Simulator menu) . . . . . . . . . . . . . . . . . . . . . . . 156intrinsic functions, definition of . . . . . . . . . . . . . . . . . . . . 353intrinsic, definition of . . . . . . . . . . . . . . . . . . . . . . . . . . . . 353ISO/ANSI C . . . . . . . . . . . . . . . . . . . . . . . . . . . . . . . . . . . . 10
adhering to . . . . . . . . . . . . . . . . . . . . . . . . . . . . . . . . . . 293ISO/ANSI C mode, specifying in compiler. . . . . . . . . . . . 292
Kkey bindings
definition of . . . . . . . . . . . . . . . . . . . . . . . . . . . . . . . . . 353Key bindings (IDE Options dialog). . . . . . . . . . . . . . . . . . 247key summary, editor . . . . . . . . . . . . . . . . . . . . . . . . . . . . . 229keywords, definition of . . . . . . . . . . . . . . . . . . . . . . . . . . . 354
Llanguage extensions
definition of . . . . . . . . . . . . . . . . . . . . . . . . . . . . . . . . . 354disabling in compiler . . . . . . . . . . . . . . . . . . . . . . . . . . 293
language facilities, in compiler . . . . . . . . . . . . . . . . . . . . . . 10Language (compiler options) . . . . . . . . . . . . . . . . . . . . . . 292layouts (for C-SPY windows) . . . . . . . . . . . . . . . . . . . . . . 104layouts, 430 (subdirectory) . . . . . . . . . . . . . . . . . . . . . . . . . 17lew (filename extension) . . . . . . . . . . . . . . . . . . . . . . . . . . . 18
U430-2
371

372
librarian. See XLIBlibraries
creating a project . . . . . . . . . . . . . . . . . . . . . . . . . . . . . . 68libraries, runtime. . . . . . . . . . . . . . . . . . . . . . . . . . . . . . . . . 10library builder. See XARlibrary files . . . . . . . . . . . . . . . . . . . . . . . . . . . . . . . . . . 12, 17library functions, configurable . . . . . . . . . . . . . . . . . . . . . . 17library modules
example . . . . . . . . . . . . . . . . . . . . . . . . . . . . . . . . . . . . . 68loading in XLINK . . . . . . . . . . . . . . . . . . . . . . . . . . . . 320specifying in assembler . . . . . . . . . . . . . . . . . . . . . . . . 304specifying in compiler . . . . . . . . . . . . . . . . . . . . . . . . . 297using . . . . . . . . . . . . . . . . . . . . . . . . . . . . . . . . . . . . . . . 67
Library (general options) . . . . . . . . . . . . . . . . . . . . . . . . . 290Library (XLINK option) . . . . . . . . . . . . . . . . . . . . . . . . . . 318library, definition of . . . . . . . . . . . . . . . . . . . . . . . . . . . . . 357lib, 430 (subdirectory). . . . . . . . . . . . . . . . . . . . . . . . . . . . . 17#line directives, generating
in compiler. . . . . . . . . . . . . . . . . . . . . . . . . . . . . . . . . . 300Lines/page (assembler option) . . . . . . . . . . . . . . . . . . . . . 309Lines/page (XLINK option) . . . . . . . . . . . . . . . . . . . . . . . 317Linker and Library Tools Reference Guide (Help menu) . 260linker command file
definition of . . . . . . . . . . . . . . . . . . . . . . . . . . . . . . . . . 354path, specifying . . . . . . . . . . . . . . . . . . . . . . . . . . . . . . 318specifying in XLINK . . . . . . . . . . . . . . . . . . . . . . . . . . 319templates . . . . . . . . . . . . . . . . . . . . . . . . . . . . . . . . . . . . 16
linker. See XLINKlist files
assembler . . . . . . . . . . . . . . . . . . . . . . . . . . . . . . . . . . . . 49conditional information, specifying . . . . . . . . . . . . 308cross-references, generating . . . . . . . . . . . . . . . . . . 309header, including. . . . . . . . . . . . . . . . . . . . . . . . . . . 308in compiler, generating . . . . . . . . . . . . . . . . . . . . . . 298lines per page, specifying . . . . . . . . . . . . . . . . . . . . 309tab spacing, specifying . . . . . . . . . . . . . . . . . . . . . . 309
compilerassembler mnemonics, including . . . . . . . . . . . . . . 298example. . . . . . . . . . . . . . . . . . . . . . . . . . . . . . . . . . . 32
generating . . . . . . . . . . . . . . . . . . . . . . . . . . . . . . . . 298source code, including . . . . . . . . . . . . . . . . . . . . . . 298
XLINKgenerating . . . . . . . . . . . . . . . . . . . . . . . . . . . . . . . . 317including segment map . . . . . . . . . . . . . . . . . . . . . . 317specifying lines per page. . . . . . . . . . . . . . . . . . . . . 317
list files, option for specifying destination . . . . . . . . . . . . 290List (assembler options) . . . . . . . . . . . . . . . . . . . . . . . . . . 308List (compiler options) . . . . . . . . . . . . . . . . . . . . . . . . . . . 298List (XLINK options) . . . . . . . . . . . . . . . . . . . . . . . . . . . . 317$LIST_DIR$ (argument variable) . . . . . . . . . . . . . . . . . . . 242Load as LIBRARY (XLINK option). . . . . . . . . . . . . . . . . 320Load as PROGRAM (XLINK option) . . . . . . . . . . . . . . . 320local variables
definition of . . . . . . . . . . . . . . . . . . . . . . . . . . . . . . . . . 349Locals window . . . . . . . . . . . . . . . . . . . . . . . . . . . . . . . . . 270
context menu . . . . . . . . . . . . . . . . . . . . . . . . . . . . . . . . 271location counter, definition of . . . . . . . . . . . . . . . . . . . . . . 356Log File dialog box (Debug menu) . . . . . . . . . . . . . . . . . . 285Log window . . . . . . . . . . . . . . . . . . . . . . . . . . . . . . . . . . . 272logical address, definition of . . . . . . . . . . . . . . . . . . . . . . . 360loop statements, in C-SPY macros . . . . . . . . . . . . . . . . . . 331Loop unrolling (compiler option) . . . . . . . . . . . . . . . . . . . 295loop-invariant expressions. . . . . . . . . . . . . . . . . . . . . . . . . 296lst (filename extension). . . . . . . . . . . . . . . . . . . . . . . . . . . . 18L-value, definition of . . . . . . . . . . . . . . . . . . . . . . . . . . . . 354
Mmac (filename extension) . . . . . . . . . . . . . . . . . . . . . . . . . . 18Macro Configuration dialog box (Debug menu) . . . . . . . . 283macro files, specifying . . . . . . . . . . . . . . . . . . . . . . . 110, 328Macro quote chars (assembler option) . . . . . . . . . . . . . . . 305macro statements . . . . . . . . . . . . . . . . . . . . . . . . . . . . . . . 330macros
definition of . . . . . . . . . . . . . . . . . . . . . . . . . . . . . . . . . 354executing . . . . . . . . . . . . . . . . . . . . . . . . . . . . . . . . . . . 137
MAC, definition of . . . . . . . . . . . . . . . . . . . . . . . . . . . . . . 354mailbox (RTOS), definition of . . . . . . . . . . . . . . . . . . . . . 354
U430-2
MSP430 IAR Embedded Workbench™ IDEUser Guide

Index
main function, C-SPY running to when starting . . . . 109, 328main.s34 (assembler tutorial file) . . . . . . . . . . . . . . . . . . . . 67Make a library module (assembler option) . . . . . . . . . . . . 304Make library module (compiler option) . . . . . . . . . . . . . . 297Make (Project menu) . . . . . . . . . . . . . . . . . . . . . . . . . . . . . 87managing projects . . . . . . . . . . . . . . . . . . . . . . . . . . . . . . . . . 4map files . . . . . . . . . . . . . . . . . . . . . . . . . . . . . . . . . . . . . . 317
example . . . . . . . . . . . . . . . . . . . . . . . . . . . . . . . . . . . . . 35viewing . . . . . . . . . . . . . . . . . . . . . . . . . . . . . . . . . . . . . 35
map (filename extension) . . . . . . . . . . . . . . . . . . . . . . . 18–19maxmin.s34 (assembler tutorial file). . . . . . . . . . . . . . . . . . 68memory
filling unused . . . . . . . . . . . . . . . . . . . . . . . . . . . . . . . . 321filling with value . . . . . . . . . . . . . . . . . . . . . . . . . . . . . 130monitoring . . . . . . . . . . . . . . . . . . . . . . . . . . . . . . 129, 133
example. . . . . . . . . . . . . . . . . . . . . . . . . . . . . . . . . . . 44memory access cost, definition of . . . . . . . . . . . . . . . . . . . 355memory area, definition of . . . . . . . . . . . . . . . . . . . . . . . . 355memory bank, definition of. . . . . . . . . . . . . . . . . . . . . . . . 355Memory Fill dialog box . . . . . . . . . . . . . . . . . . . . . . . . . . 267memory map. . . . . . . . . . . . . . . . . . . . . . . . . . . . . . . . . . . 154
definition of . . . . . . . . . . . . . . . . . . . . . . . . . . . . . . . . . 355memory model, definition of. . . . . . . . . . . . . . . . . . . . . . . 355Memory window. . . . . . . . . . . . . . . . . . . . . . . . . . . . . . . . 266
context menu . . . . . . . . . . . . . . . . . . . . . . . . . . . . . . . . 267operations . . . . . . . . . . . . . . . . . . . . . . . . . . . . . . . . . . 266using . . . . . . . . . . . . . . . . . . . . . . . . . . . . . . . . . . . . . . 129
memory zonesdefinition of . . . . . . . . . . . . . . . . . . . . . . . . . . . . . . . . . 108in ddf . . . . . . . . . . . . . . . . . . . . . . . . . . . . . . . . . . . . . . 108
menu bar . . . . . . . . . . . . . . . . . . . . . . . . . . . . . . . . . . . . . . 224C-SPY-specific. . . . . . . . . . . . . . . . . . . . . . . . . . . . . . . 263
menusEmulator (FET) . . . . . . . . . . . . . . . . . . . . . . . . . . . . . . 209File. . . . . . . . . . . . . . . . . . . . . . . . . . . . . . . . . . . . . . . . 231Project . . . . . . . . . . . . . . . . . . . . . . . . . . . . . . . . . . . . . 241Tools . . . . . . . . . . . . . . . . . . . . . . . . . . . . . . . . . . . . . . 244View. . . . . . . . . . . . . . . . . . . . . . . . . . . . . . . . . . . . . . . 240
message (C-SPY macro statement) . . . . . . . . . . . . . . . . . . 331
messagesdisplaying in Embedded Workbench . . . . . . . . . . . . . . 252printing during macro execution . . . . . . . . . . . . . . . . . 331
Messages window. . . . . . . . . . . . . . . . . . . . . . . . . . . . . . . 230amount of output, configuring . . . . . . . . . . . . . . . . . . . 252
Messages (IDE Options dialog) . . . . . . . . . . . . . . . . . . . . 252microcontroller, definition of . . . . . . . . . . . . . . . . . . . . . . 355microprocessor, definition of . . . . . . . . . . . . . . . . . . . . . . 355migration
from earlier IAR compilers, option . . . . . . . . . . . . . . . 292module map, in map files . . . . . . . . . . . . . . . . . . . . . . . . . . 35module name, specifying in compiler . . . . . . . . . . . . . . . . 297Module status (XLINK option) . . . . . . . . . . . . . . . . . . . . . 319module types
libraryloading in XLINK. . . . . . . . . . . . . . . . . . . . . . . . . . 320specifying in assembler. . . . . . . . . . . . . . . . . . . . . . 304specifying in compiler. . . . . . . . . . . . . . . . . . . . . . . 297
program, loading in XLINK. . . . . . . . . . . . . . . . . . . . . 320MODULE (assembler directive) . . . . . . . . . . . . . . . . . . . . . 68modules
definition of . . . . . . . . . . . . . . . . . . . . . . . . . . . . . . . . . 355including local symbols in input . . . . . . . . . . . . . . . . . 313maintaining . . . . . . . . . . . . . . . . . . . . . . . . . . . . . . . . . . 67specifying status in XLINK . . . . . . . . . . . . . . . . . . . . . 319
Module-local symbols (XLINK option) . . . . . . . . . . . . . . 313Motorola, C-SPY input format . . . . . . . . . . . . . . . . . . . 7, 101Multiply and accumulate, definition of . . . . . . . . . . . . . . . 354multitasking, definition of. . . . . . . . . . . . . . . . . . . . . . . . . 356
Nnested interrupts, definition of . . . . . . . . . . . . . . . . . . . . . 355New Project (dialog box) . . . . . . . . . . . . . . . . . . . . . . . . . . 26Next Statement (button) . . . . . . . . . . . . . . . . . . . . . . . . . . 263No global type checking (XLINK option). . . . . . . . . . . . . 315non-banked memory, definition of . . . . . . . . . . . . . . . . . . 355non-initialized memory, definition of . . . . . . . . . . . . . . . . 355non-volatile storage, definition of . . . . . . . . . . . . . . . . . . . 355
U430-2
373

374
NOP, definition of . . . . . . . . . . . . . . . . . . . . . . . . . . . . . . . 355
Oobject files, specifying output directory . . . . . . . . . . . . . . 290Object module name (compiler option). . . . . . . . . . . . . . . 297$OBJ_DIR$ (argument variable) . . . . . . . . . . . . . . . . . . . 242online documentation
guides. . . . . . . . . . . . . . . . . . . . . . . . . . . . . . . . 16–17, 260help . . . . . . . . . . . . . . . . . . . . . . . . . . . . . . . . . . . . 20, 260
Open Workspace (File menu) . . . . . . . . . . . . . . . . . . . . . . 232_ _openFile (C-SPY system macro) . . . . . . . . . . . . . . . . . 336operator precedence, definition of. . . . . . . . . . . . . . . . . . . 355operators, definition of . . . . . . . . . . . . . . . . . . . . . . . . . . . 355optimization levels . . . . . . . . . . . . . . . . . . . . . . . . . . . . . . 294optimization models . . . . . . . . . . . . . . . . . . . . . . . . . . . . . 294optimization techniques
code motion . . . . . . . . . . . . . . . . . . . . . . . . . . . . . . . . . 296common-subexpression elimination. . . . . . . . . . . . . . . 295function inlining. . . . . . . . . . . . . . . . . . . . . . . . . . . . . . 296loop unrolling . . . . . . . . . . . . . . . . . . . . . . . . . . . . . . . 295
optimizationseffects on variables. . . . . . . . . . . . . . . . . . . . . . . . . . . . 119
optionscompiler . . . . . . . . . . . . . . . . . . . . . . . . . . . . . . . . . . . . 291C-SPY . . . . . . . . . . . . . . . . . . . . . . . . . . . . . . . . . 243, 327C-SPY FET . . . . . . . . . . . . . . . . . . . . . . . . . . . . . . . . . 204editor . . . . . . . . . . . . . . . . . . . . . . . . . . . . . . . . . . . . . . 248general . . . . . . . . . . . . . . . . . . . . . . . . . . . . . . . . . . 29, 287ICC430 . . . . . . . . . . . . . . . . . . . . . . . . . . . . . . . . . . . . 291XLINK. . . . . . . . . . . . . . . . . . . . . . . . . . . . . 311, 323, 325
Options dialog boxusing . . . . . . . . . . . . . . . . . . . . . . . . . . . . . . . . . . . . . . . 86(Project menu) . . . . . . . . . . . . . . . . . . . . . . . . . . . . . . . 243
_ _orderInterrupt (C-SPY system macro) . . . . . . . . . . . . . 337output
assemblergenerating library modules . . . . . . . . . . . . . . . . . . . 304
compilerincluding debug information . . . . . . . . . . . . . . . . . . 298preprocessor, generating . . . . . . . . . . . . . . . . . . . . . 300
from C-SPY, redirecting to a file . . . . . . . . . . . . . . . . . 106XLINK
generating . . . . . . . . . . . . . . . . . . . . . . . . . . . . . . . . 315specifying filename. . . . . . . . . . . . . . . . . . . . . . . . . 312
Output assembler file (compiler option) . . . . . . . . . . . . . . 298Output file (XLINK option) . . . . . . . . . . . . . . . . . . . . . . . 312Output format (XLINK option). . . . . . . . . . . . . . . . . . . . . 313output formats
debug (ubrof) . . . . . . . . . . . . . . . . . . . . . . . . . . . . . . . . 313XLINK. . . . . . . . . . . . . . . . . . . . . . . . . . . . . . . . . 312–313
Output list file (compiler option) . . . . . . . . . . . . . . . . . . . 298Output options (XLINK). . . . . . . . . . . . . . . . . . . . . . . . . . 312Output (compiler options). . . . . . . . . . . . . . . . . . . . . . . . . 297Output (general options) . . . . . . . . . . . . . . . . . . . . . . . . . . 289Output (general option). . . . . . . . . . . . . . . . . . . . . . . . . . . 289
PParallel Port (C-SPY FET option). . . . . . . . . . . . . . . . . . . 205paths
compiler include files. . . . . . . . . . . . . . . . . . . . . . . . . . 299relative, in Embedded Workbench . . . . . . . . . . . . . 83, 229source files . . . . . . . . . . . . . . . . . . . . . . . . . . . . . . . . . . 229XLINK include files . . . . . . . . . . . . . . . . . . . . . . . . . . 318
peripherals, definition of . . . . . . . . . . . . . . . . . . . . . . . . . . 356pipeline, definition of . . . . . . . . . . . . . . . . . . . . . . . . . . . . 356Plain ‘char’ is (compiler option) . . . . . . . . . . . . . . . . . . . . 293pointers, definition of . . . . . . . . . . . . . . . . . . . . . . . . . . . . 356#pragma directive, definition of . . . . . . . . . . . . . . . . . . . . 356precedence, definition of. . . . . . . . . . . . . . . . . . . . . . . . . . 355preemptive multitasking, definition of . . . . . . . . . . . . . . . 356preprocessing directives, definition of. . . . . . . . . . . . . . . . 356Preprocessor output to file (compiler option) . . . . . . . . . . 300preprocessor (compiler options) . . . . . . . . . . . . . . . . . . . . 299preprocessor, definition of. See C-style preprocessorprerequisites, programming experience. . . . . . . . . . . . . . xxix
U430-2
MSP430 IAR Embedded Workbench™ IDEUser Guide

Index
prj (filename extension) . . . . . . . . . . . . . . . . . . . . . . . . . . . 18Probability, definition of . . . . . . . . . . . . . . . . . . . . . . . . . . 158Processing options (XLINK) . . . . . . . . . . . . . . . . . . . . . . 321processor variant, definition of . . . . . . . . . . . . . . . . . . . . . 356product information, obtaining detailed . . . . . . . . . . . . . . 260product overview
assembler . . . . . . . . . . . . . . . . . . . . . . . . . . . . . . . . . . . . 11compiler . . . . . . . . . . . . . . . . . . . . . . . . . . . . . . . . . . . . . . 9C-SPY Debugger . . . . . . . . . . . . . . . . . . . . . . . . . . . . . . . 5directory structure . . . . . . . . . . . . . . . . . . . . . . . . . . . . . 15documentation . . . . . . . . . . . . . . . . . . . . . . . . . . . . . . . . 19file typesIAR Embedded Workbench IDE . . . . . . . . . . . . . . . . . . . 3XAR . . . . . . . . . . . . . . . . . . . . . . . . . . . . . . . . . . . . . . . 12XLIB . . . . . . . . . . . . . . . . . . . . . . . . . . . . . . . . . . . . . . . 12XLINK. . . . . . . . . . . . . . . . . . . . . . . . . . . . . . . . . . . . . . 11
Profilingcolumns . . . . . . . . . . . . . . . . . . . . . . . . . . . . . . . . . . . . 275commands . . . . . . . . . . . . . . . . . . . . . . . . . . . . . . . . . . 275context menu . . . . . . . . . . . . . . . . . . . . . . . . . . . . . . . . 275window . . . . . . . . . . . . . . . . . . . . . . . . . . . . . . . . . . . . 274
program counter, definition of. . . . . . . . . . . . . . . . . . . . . . 356program execution, in C-SPY . . . . . . . . . . . . . . . . . . . . . . 111program location counter, definition of . . . . . . . . . . . . . . . 356program modules, loading in XLINK . . . . . . . . . . . . . . . . 320programming experience. . . . . . . . . . . . . . . . . . . . . . . . . xxixProject Make, options . . . . . . . . . . . . . . . . . . . . . . . . . . . . 250Project menu . . . . . . . . . . . . . . . . . . . . . . . . . . . . . . . . . . . 241Project model . . . . . . . . . . . . . . . . . . . . . . . . . . . . . . . . . . . 79project options, definition of . . . . . . . . . . . . . . . . . . . . . . . 356Project page (IDE Options dialog) . . . . . . . . . . . . . . . . . . 250projects
adding files to . . . . . . . . . . . . . . . . . . . . . . . . . . . . 82, 241example. . . . . . . . . . . . . . . . . . . . . . . . . . . . . . . . . . . 28
build configuration, creating . . . . . . . . . . . . . . . . . . . . . 82building . . . . . . . . . . . . . . . . . . . . . . . . . . . . . . . . . . . . . 87compiling, example . . . . . . . . . . . . . . . . . . . . . . . . . . . . 31creating . . . . . . . . . . . . . . . . . . . . . . . . . . . . . . . . . . 27, 82
example. . . . . . . . . . . . . . . . . . . . . . . . . . . . . . . . . . . 68
definition of . . . . . . . . . . . . . . . . . . . . . . . . . . . . . . 79, 356excluding groups and files . . . . . . . . . . . . . . . . . . . . . . . 82groups, creating . . . . . . . . . . . . . . . . . . . . . . . . . . . . . . . 82managing . . . . . . . . . . . . . . . . . . . . . . . . . . . . . . . . . . 4, 79moving files . . . . . . . . . . . . . . . . . . . . . . . . . . . . . . . . . . 82organization . . . . . . . . . . . . . . . . . . . . . . . . . . . . . . . . . . 79removing items . . . . . . . . . . . . . . . . . . . . . . . . . . . . . . . 82setting options . . . . . . . . . . . . . . . . . . . . . . . . . . . . . . . . 85testing . . . . . . . . . . . . . . . . . . . . . . . . . . . . . . . . . . . . . . 87workspace, creating . . . . . . . . . . . . . . . . . . . . . . . . . . . . 82
$PROJ_DIR$ (argument variable) . . . . . . . . . . . . . . . . . . 242$PROJ_FNAME$ (argument variable) . . . . . . . . . . . . . . . 242$PROJ_PATH$ (argument variable) . . . . . . . . . . . . . . . . . 242PROM, definition of . . . . . . . . . . . . . . . . . . . . . . . . . . . . . 356PUBLIC (assembler directive) . . . . . . . . . . . . . . . . . . . . . . 68
Qqualifiers, definition of. See type qualifiersQuick Watch
executing C-SPY macros . . . . . . . . . . . . . . . . . . . . . . . 140using . . . . . . . . . . . . . . . . . . . . . . . . . . . . . . . . . . . . . . 120
Quick Watch dialog box (Edit menu) . . . . . . . . . . . . . . . . 283
RRange checks (XLINK option) . . . . . . . . . . . . . . . . . . . . . 316_ _readFile (C-SPY system macro). . . . . . . . . . . . . . . . . . 337_ _readFileByte (C-SPY system macro) . . . . . . . . . . . . . . 338readme files. . . . . . . . . . . . . . . . . . . . . . . . . . . . . . . . . . 16–17
readme.htm . . . . . . . . . . . . . . . . . . . . . . . . . . . . . . . . . . 20_ _readMemoryByte (C-SPY system macro) . . . . . . . . . . 338_ _readMemory16 (C-SPY system macro) . . . . . . . . . . . . 339_ _readMemory32 (C-SPY system macro) . . . . . . . . . . . . 340_ _readMemory8 (C-SPY system macro) . . . . . . . . . . . . . 339real-time operating system, definition of. . . . . . . . . . . . . . 356real-time system, definition of . . . . . . . . . . . . . . . . . . . . . 356reference information
C-SPY IDE . . . . . . . . . . . . . . . . . . . . . . . . . . . . . . . . . 261
U430-2
375

376
Embedded Workbench . . . . . . . . . . . . . . . . . . . . . . . . . 223guides. . . . . . . . . . . . . . . . . . . . . . . . . . . . . . . . . . . . . . . 19
register constant, definition of. . . . . . . . . . . . . . . . . . . . . . 356Register Filter (IDE Options dialog) . . . . . . . . . . . . . . . . . 254Register groups . . . . . . . . . . . . . . . . . . . . . . . . . . . . . . . . . 131
application-specific, defining . . . . . . . . . . . . . . . . . . . . 132pre-defined, enabling . . . . . . . . . . . . . . . . . . . . . . . . . . 132
register locking, definition of . . . . . . . . . . . . . . . . . . . . . . 357register variables, definition of . . . . . . . . . . . . . . . . . . . . . 357Register window . . . . . . . . . . . . . . . . . . . . . . . . . . . . . . . . 268
example . . . . . . . . . . . . . . . . . . . . . . . . . . . . . . . . . . . . . 44using . . . . . . . . . . . . . . . . . . . . . . . . . . . . . . . . . . . . . . 131
register zone . . . . . . . . . . . . . . . . . . . . . . . . . . . . . . . . . . . 108_ _registerMacroFile (C-SPY system macro) . . . . . . . . . . 340registers
definition of . . . . . . . . . . . . . . . . . . . . . . . . . . . . . . . . . 356in ddf . . . . . . . . . . . . . . . . . . . . . . . . . . . . . . . . . . . . . . 108
relative paths. . . . . . . . . . . . . . . . . . . . . . . . . . . . . . . . 83, 229Relaxed ISO/ANSI (compiler option) . . . . . . . . . . . . . . . . 293relocatable segments, definition of . . . . . . . . . . . . . . . . . . 357remarks, compiler diagnostics. . . . . . . . . . . . . . . . . . . . . . 301Repeat interval, definition of. . . . . . . . . . . . . . . . . . . . . . . 158Replace dialog box (Edit menu) . . . . . . . . . . . . . . . . . . . . 235Replace (button) . . . . . . . . . . . . . . . . . . . . . . . . . . . . . . . . 225Require prototypes (compiler option) . . . . . . . . . . . . . . . . 292reset
definition of . . . . . . . . . . . . . . . . . . . . . . . . . . . . . . . . . 357using C-SPY ROM-monitor. . . . . . . . . . . . . . . . . . . . . 174
Reset (button) . . . . . . . . . . . . . . . . . . . . . . . . . . . . . . . . . . 263Reset (Debug menu)
example . . . . . . . . . . . . . . . . . . . . . . . . . . . . . . . . . . . . . 46_ _resetFile (C-SPY system macro) . . . . . . . . . . . . . . . . . 341restoring
factory settings, default . . . . . . . . . . . . . . . . . . . . . . . . . 86return (macro statement) . . . . . . . . . . . . . . . . . . . . . . . . . . 331ROM-monitor
definition of . . . . . . . . . . . . . . . . . . . . . . . . . . . . . . . . . 357features . . . . . . . . . . . . . . . . . . . . . . . . . . . . . . . . . . . . . . 8
ROM-monitor-compatible code (compiler option) . . . . . . 296
root directory . . . . . . . . . . . . . . . . . . . . . . . . . . . . . . . . . . . 15Round Robin, definition of . . . . . . . . . . . . . . . . . . . . . . . . 357RTOS, definition of. . . . . . . . . . . . . . . . . . . . . . . . . . . . . . 356Run to Cursor (button) . . . . . . . . . . . . . . . . . . . . . . . . . . . 263Run to (C-SPY option) . . . . . . . . . . . . . . . . . . . . . . . 109, 328runtime libraries . . . . . . . . . . . . . . . . . . . . . . . . . . . . . . . . . 10
documentation . . . . . . . . . . . . . . . . . . . . . . . . . . . . . . . . 20runtime library, definition of . . . . . . . . . . . . . . . . . . . . . . . 357runtime model attributes
definition of . . . . . . . . . . . . . . . . . . . . . . . . . . . . . . . . . 357in map files . . . . . . . . . . . . . . . . . . . . . . . . . . . . . . . . . . 35
R-value, definition of . . . . . . . . . . . . . . . . . . . . . . . . . . . . 356r45 (filename extension) . . . . . . . . . . . . . . . . . . . . . . . . . . . 18
Ssaturated mathematics, definition of . . . . . . . . . . . . . . . . . 357Save All (File menu). . . . . . . . . . . . . . . . . . . . . . . . . . . . . 232Save As (File menu) . . . . . . . . . . . . . . . . . . . . . . . . . . . . . 232Save Current Layout As Default (Debug menu) . . . . 156, 286Save Workspace (File menu). . . . . . . . . . . . . . . . . . . . . . . 232Save (File menu). . . . . . . . . . . . . . . . . . . . . . . . . . . . . . . . 232Scan for Changed Files (editor option) . . . . . . . . . . . . . . . 249
using . . . . . . . . . . . . . . . . . . . . . . . . . . . . . . . . . . . . . . . 33scheduler (RTOS), definition of . . . . . . . . . . . . . . . . . . . . 357scope, definition of . . . . . . . . . . . . . . . . . . . . . . . . . . . . . . 357searching
facilities . . . . . . . . . . . . . . . . . . . . . . . . . . . . . . . . . . . . . 94Segment map (XLINK option) . . . . . . . . . . . . . . . . . . . . . 317segment map, definition of . . . . . . . . . . . . . . . . . . . . . . . . 357Segment overlap warnings (XLINK option) . . . . . . . . . . . 315segments
definition of . . . . . . . . . . . . . . . . . . . . . . . . . . . . . . . . . 357overlap errors, reducing . . . . . . . . . . . . . . . . . . . . . . . . 315range checks, controlling . . . . . . . . . . . . . . . . . . . . . . . 316section in map files . . . . . . . . . . . . . . . . . . . . . . . . . . . . 35
semaphores, definition of . . . . . . . . . . . . . . . . . . . . . . . . . 358Sequencer dialog box (Emulator menu . . . . . . . . . . . . . . . 214Set Log file dialog box (Debug menu) . . . . . . . . . . . . . . . 282
U430-2
MSP430 IAR Embedded Workbench™ IDEUser Guide

Index
Set Terminal IO Log File (Debug menu). . . . . . . . . . . . . . 116_ _setCodeBreak (C-SPY system macro) . . . . . . . . . . . . . 341_ _setDataBreak (C-SPY system macro) . . . . . . . . . 342–343_ _setSimBreak (C-SPY system macro) . . . . . . . . . . . . . . 153settings (directory) . . . . . . . . . . . . . . . . . . . . . . . . . . . . . . . 19Setup macro (C-SPY option) . . . . . . . . . . . . . . . . . . . . . . 328setup macros, in C-SPY
See also C-SPY macrosSetup (C-SPY options) . . . . . . . . . . . . . . . . . . . . . . . . . . . 327severity level, definition of . . . . . . . . . . . . . . . . . . . . . . . . 358SFR
definition of . . . . . . . . . . . . . . . . . . . . . . . . . . . . . . . . . 358header files. . . . . . . . . . . . . . . . . . . . . . . . . . . . . . . . . . . 17
sfr (filename extension) . . . . . . . . . . . . . . . . . . . . . . . . . . . 18short addressing, definition of. . . . . . . . . . . . . . . . . . . . . . 358shortcut keys . . . . . . . . . . . . . . . . . . . . . . . . . . . . . . . . . . . . 92Show Bookmarks (editor option) . . . . . . . . . . . . . . . . . . . 249Show Line Number (editor option) . . . . . . . . . . . . . . . . . . 249showing build messages, in Embedded Workbench . . . . . 252side-effect, definition of . . . . . . . . . . . . . . . . . . . . . . . . . . 358signals, definition of . . . . . . . . . . . . . . . . . . . . . . . . . . . . . 358simulation
enabling/disabling . . . . . . . . . . . . . . . . . . . . . . . . . . . . 161simulator
definition of . . . . . . . . . . . . . . . . . . . . . . . . . . . . . . . . . 358features . . . . . . . . . . . . . . . . . . . . . . . . . . . . . . . . . . . . . . 7
Simulator menu. . . . . . . . . . . . . . . . . . . . . . . . . . . . . 156, 286single-stepping, using C-SPY ROM-monitor . . . . . . . . . . 173size optimization. . . . . . . . . . . . . . . . . . . . . . . . . . . . . . . . 294skeleton code, definition of . . . . . . . . . . . . . . . . . . . . . . . . 358source code
including in compiler list file . . . . . . . . . . . . . . . . . . . . 298source file paths . . . . . . . . . . . . . . . . . . . . . . . . . . . . . 83, 229source files . . . . . . . . . . . . . . . . . . . . . . . . . . . . . . . . . . . . . 81
adding to a project . . . . . . . . . . . . . . . . . . . . . . . . . . . . . 28editing . . . . . . . . . . . . . . . . . . . . . . . . . . . . . . . . . . . . . . 91
special function registers (SFR)definition of . . . . . . . . . . . . . . . . . . . . . . . . . . . . . . . . . 358description files . . . . . . . . . . . . . . . . . . . . . . . . . . . . . . . 16
header files. . . . . . . . . . . . . . . . . . . . . . . . . . . . . . . . . . . 17using as assembler symbols . . . . . . . . . . . . . . . . . . . . . 118
speed optimization . . . . . . . . . . . . . . . . . . . . . . . . . . . . . . 294src, common (subdirectory) . . . . . . . . . . . . . . . . . . . . . . . . 16src, 430 (subdirectory) . . . . . . . . . . . . . . . . . . . . . . . . . . . . 17stack frames, definition of. . . . . . . . . . . . . . . . . . . . . . . . . 358stack segments, definition of. . . . . . . . . . . . . . . . . . . . . . . 358Stack Settings
dialog box (Stack window) . . . . . . . . . . . . . . . . . . . . . 280Stack window . . . . . . . . . . . . . . . . . . . . . . . . . . . . . . . . . . 279
using . . . . . . . . . . . . . . . . . . . . . . . . . . . . . . . . . . . . . . 133stack, measuring depth . . . . . . . . . . . . . . . . . . . . . . . . . . . 133starting the Embedded Workbench . . . . . . . . . . . . . . . . . . . 74State Storage
dialog box (Emulator menu) . . . . . . . . . . . . . . . . . . . . 211using . . . . . . . . . . . . . . . . . . . . . . . . . . . . . . . . . . . . . . 196
state storageusing . . . . . . . . . . . . . . . . . . . . . . . . . . . . . . . . . . . . . . 197
State Storage window (Emulator menu) . . . . . . . . . . . . . . 213static objects, definition of . . . . . . . . . . . . . . . . . . . . . . . . 358static overlay, definition of . . . . . . . . . . . . . . . . . . . . . . . . 359statically allocated memory, definition of . . . . . . . . . . . . . 358status bar. . . . . . . . . . . . . . . . . . . . . . . . . . . . . . . . . . . . . . 225Step Into
button. . . . . . . . . . . . . . . . . . . . . . . . . . . . . . . . . . . . . . 263example . . . . . . . . . . . . . . . . . . . . . . . . . . . . . . . . . . . . . 40
Step Out (button) . . . . . . . . . . . . . . . . . . . . . . . . . . . . . . . 263Step Over (button) . . . . . . . . . . . . . . . . . . . . . . . . . . . . . . 263step points, definition of . . . . . . . . . . . . . . . . . . . . . . . . . . 112stepping . . . . . . . . . . . . . . . . . . . . . . . . . . . . . . . . . . . . . . 112
definition of . . . . . . . . . . . . . . . . . . . . . . . . . . . . . . . . . 358example . . . . . . . . . . . . . . . . . . . . . . . . . . . . . . . . . . . . . 39using C-SPY FET . . . . . . . . . . . . . . . . . . . . . . . . . . . . 196
Stop Debugging (button). . . . . . . . . . . . . . . . . . . . . . . . . . 263stopping execution, using C-SPY ROM-monitor . . . . . . . 173_ _strFind (C-SPY system macro) . . . . . . . . . . . . . . . . . . 343Strict ISO/ANSI (compiler option) . . . . . . . . . . . . . . . . . . 293structure value, definition of . . . . . . . . . . . . . . . . . . . . . . . 359_ _subString (C-SPY system macro) . . . . . . . . . . . . . . . . 344
U430-2
377

378
support, technical . . . . . . . . . . . . . . . . . . . . . . . . . . . . . . . . 21Suppress all warnings (XLINK option). . . . . . . . . . . . . . . 316Suppress these diagnostics (compiler option) . . . . . . . . . . 301Suppress these diagnostics (XLINK option) . . . . . . . . . . . 316symbolic location, definition of . . . . . . . . . . . . . . . . . . . . 359symbols
See also user symbolsdefining in compiler . . . . . . . . . . . . . . . . . . . . . . . . . . . 299defining in XLINK. . . . . . . . . . . . . . . . . . . . . . . . . . . . 314definition of . . . . . . . . . . . . . . . . . . . . . . . . . . . . . . . . . 359in input modules . . . . . . . . . . . . . . . . . . . . . . . . . . . . . 313using in C-SPY expressions . . . . . . . . . . . . . . . . . . . . . 117
syntax coloringconfiguration files . . . . . . . . . . . . . . . . . . . . . . . . . . . . . 16in editor . . . . . . . . . . . . . . . . . . . . . . . . . . . . . . . . . . . . . 93
Syntax Highlighting (editor option) . . . . . . . . . . . . . . . . . 248syntax highlighting, in Editor window . . . . . . . . . . . . 93, 228System breakpoints on (C-SPY FET option) . . . . . . . . . . 205s45 (filename extension) . . . . . . . . . . . . . . . . . . . . . . . . . . . 18
TTab Key Function (editor option) . . . . . . . . . . . . . . . . . . . 248Tab Size (editor option). . . . . . . . . . . . . . . . . . . . . . . . . . . 248Tab spacing (assembler option). . . . . . . . . . . . . . . . . . . . . 309target monitor, definition of . . . . . . . . . . . . . . . . . . . . . . . 359Target options
specifying . . . . . . . . . . . . . . . . . . . . . . . . . . . . . . . . . . 288target processors . . . . . . . . . . . . . . . . . . . . . . . . . . . . . . . . . 79Target (general options) . . . . . . . . . . . . . . . . . . . . . . . . . . 288target, definition of . . . . . . . . . . . . . . . . . . . . . . . . . . . . . . 359$TARGET_DIR$ (argument variable) . . . . . . . . . . . . . . . 243$TARGET_FNAME$ (argument variable) . . . . . . . . . . . . 243$TARGET_PATH$ (argument variable) . . . . . . . . . . . . . . 243task, definition of . . . . . . . . . . . . . . . . . . . . . . . . . . . . . . . 359technical support . . . . . . . . . . . . . . . . . . . . . . . . . . . . . . . . . 21tentative definition, definition of . . . . . . . . . . . . . . . . . . . . 359terminal I/O
definition of . . . . . . . . . . . . . . . . . . . . . . . . . . . . . . . . . 359
in C-SPY ROM-monitor . . . . . . . . . . . . . . . . . . . . . . . 174simulating . . . . . . . . . . . . . . . . . . . . . . . . . . . . . . . . . . 313
Terminal I/O Log File dialog box (Debug menu) . . . . . . . 286Terminal I/O window . . . . . . . . . . . . . . . . . . . . . . . . . . . . 272
example . . . . . . . . . . . . . . . . . . . . . . . . . . . . . . . . . . . . . 46terminology. . . . . . . . . . . . . . . . . . . . . . . . . . . . . . . . . . . . 349testing, of code . . . . . . . . . . . . . . . . . . . . . . . . . . . . . . . . . . 87thread, definition of. . . . . . . . . . . . . . . . . . . . . . . . . . . . . . 359timer, definition of . . . . . . . . . . . . . . . . . . . . . . . . . . . . . . 359timeslice, definition of . . . . . . . . . . . . . . . . . . . . . . . . . . . 359Toggle Breakpoint (button) . . . . . . . . . . . . . . . . . . . . . . . . 263Toggle Breakpoint (Edit menu)
example . . . . . . . . . . . . . . . . . . . . . . . . . . . . . . . . . . 42, 65_ _toLower (C-SPY system macro) . . . . . . . . . . . . . . . . . 344tool chain
extending . . . . . . . . . . . . . . . . . . . . . . . . . . . . . . . . . . . . 88specifying . . . . . . . . . . . . . . . . . . . . . . . . . . . . . . . . . . . 27
Tool Output (in Messages window) . . . . . . . . . . . . . . . . . 231toolbar. . . . . . . . . . . . . . . . . . . . . . . . . . . . . . . . . . . . . . . . 225
debug . . . . . . . . . . . . . . . . . . . . . . . . . . . . . . . . . . . . . . 263Trace . . . . . . . . . . . . . . . . . . . . . . . . . . . . . . . . . . . . . . 277
$TOOLKIT_DIR$ (argument variable) . . . . . . . . . . . . . . 243Tools menu . . . . . . . . . . . . . . . . . . . . . . . . . . . . . . . . . . . . 244tools, user-configured . . . . . . . . . . . . . . . . . . . . . . . . . . . . 255_ _toUpper (C-SPY system macro). . . . . . . . . . . . . . . . . . 345Trace
context menu . . . . . . . . . . . . . . . . . . . . . . . . . . . . . . . . 278toolbar . . . . . . . . . . . . . . . . . . . . . . . . . . . . . . . . . . . . . 277window . . . . . . . . . . . . . . . . . . . . . . . . . . . . . . . . . . . . 276window, using . . . . . . . . . . . . . . . . . . . . . . . . . . . . . . . 121
transformations, enabled in compiler . . . . . . . . . . . . . . . . 295translation unit, definition of. . . . . . . . . . . . . . . . . . . . . . . 359trap, definition of . . . . . . . . . . . . . . . . . . . . . . . . . . . . . . . 359Treat all warnings as errors (compiler option). . . . . . . . . . 301Treat these as errors
(compiler option) . . . . . . . . . . . . . . . . . . . . . . . . . . . . . 301(XLINK option) . . . . . . . . . . . . . . . . . . . . . . . . . . . . . . 316
Treat these as remarks (compiler option) . . . . . . . . . . . . . 301
U430-2
MSP430 IAR Embedded Workbench™ IDEUser Guide

Index
Treat these as warnings(compiler option) . . . . . . . . . . . . . . . . . . . . . . . . . . . . . 301(XLINK option) . . . . . . . . . . . . . . . . . . . . . . . . . . . . . . 316
tutor, 430 (subdirectory) . . . . . . . . . . . . . . . . . . . . . . . . . . . 17type qualifiers, definition of . . . . . . . . . . . . . . . . . . . . . . . 359type-checking . . . . . . . . . . . . . . . . . . . . . . . . . . . . . . . . 10, 12
disabling at link time . . . . . . . . . . . . . . . . . . . . . . . . . . 315typographic conventions . . . . . . . . . . . . . . . . . . . . . . . . xxxiv
UUBROF. . . . . . . . . . . . . . . . . . . . . . . . . . . . . . . . . . . . . . 7, 11
definition of . . . . . . . . . . . . . . . . . . . . . . . . . . . . . . . . . 359#undef (assembler options) . . . . . . . . . . . . . . . . . . . . . . . . 309Undefine symbol (assembler option) . . . . . . . . . . . . . . . . 310Universal Binary Relocatable Object Format (UBROF) . 7, 11
definition of . . . . . . . . . . . . . . . . . . . . . . . . . . . . . . . . . 359Use Default Size (editor option) . . . . . . . . . . . . . . . . . . . . 249Use virtual breakpoints (C-SPY FET option) . . . . . . . . . . 205user symbols, making case-sensitive . . . . . . . . . . . . . . . . . 304
Vvariables
effects of optimizations . . . . . . . . . . . . . . . . . . . . . . . . 119information, limitation on . . . . . . . . . . . . . . . . . . . . . . 119using in arguments . . . . . . . . . . . . . . . . . . . . . . . . . . . . 255using in C-SPY expressions . . . . . . . . . . . . . . . . . . . . . 117watching in C-SPY . . . . . . . . . . . . . . . . . . . . . . . . . . . 120
example. . . . . . . . . . . . . . . . . . . . . . . . . . . . . . . . . . . 40Variance, definition of. . . . . . . . . . . . . . . . . . . . . . . . . . . . 158Verify download (C-SPY FET option) . . . . . . . . . . . . . . . 204version number, of Embedded Workbench . . . . . . . . . . . . 260View menu . . . . . . . . . . . . . . . . . . . . . . . . . . . . . . . . . . . . 240virtual address, definition of . . . . . . . . . . . . . . . . . . . . . . . 360virtual space, definition of . . . . . . . . . . . . . . . . . . . . . . . . 360volatile storage, definition of . . . . . . . . . . . . . . . . . . . . . . 360von Neumann architecture . . . . . . . . . . . . . . . . . . . . . . . . 156
definition of . . . . . . . . . . . . . . . . . . . . . . . . . . . . . . . . . 360
Wwarnings
assembler . . . . . . . . . . . . . . . . . . . . . . . . . . . . . . . . . . . 305compiler. . . . . . . . . . . . . . . . . . . . . . . . . . . . . . . . . . . . 301XLINK. . . . . . . . . . . . . . . . . . . . . . . . . . . . . . . . . . . . . 316
Warnings (assembler option). . . . . . . . . . . . . . . . . . . . . . . 305Warnings/Errors (XLINK option) . . . . . . . . . . . . . . . . . . . 316Watch window . . . . . . . . . . . . . . . . . . . . . . . . . . . . . . . . . 269
context menu . . . . . . . . . . . . . . . . . . . . . . . . . . . . . . . . 270using . . . . . . . . . . . . . . . . . . . . . . . . . . . . . . . . . . . . . . 120
watchpointsdefinition of . . . . . . . . . . . . . . . . . . . . . . . . . . . . . . . . . 360setting . . . . . . . . . . . . . . . . . . . . . . . . . . . . . . . . . . . . . . 40
website, IAR Systems . . . . . . . . . . . . . . . . . . . . . . . . . . . . . 20which . . . . . . . . . . . . . . . . . . . . . . . . . . . . . . . . . . . . . . . . 158while (macro statement) . . . . . . . . . . . . . . . . . . . . . . . . . . 331Window menu. . . . . . . . . . . . . . . . . . . . . . . . . . . . . . . . . . 259Windows
Editor . . . . . . . . . . . . . . . . . . . . . . . . . . . . . . . . . . . . . . 228Messages . . . . . . . . . . . . . . . . . . . . . . . . . . . . . . . . . . . 230workspace . . . . . . . . . . . . . . . . . . . . . . . . . . . . . . . . . . 226
windowsState Storage (Emulator window) . . . . . . . . . . . . . . . . 213
windows. See Project Manager windows or C-SPY windowsworkspace
the procedure . . . . . . . . . . . . . . . . . . . . . . . . . . . . . . . . . 82Workspace window
creating . . . . . . . . . . . . . . . . . . . . . . . . . . . . . . . . . . . . . 26example . . . . . . . . . . . . . . . . . . . . . . . . . . . . . . . . . . . . . 27
workspace window . . . . . . . . . . . . . . . . . . . . . . . . . . . . . . 226workspace, definition of . . . . . . . . . . . . . . . . . . . . . . . . . . . 79_ _writeFile (C-SPY system macro) . . . . . . . . . . . . . . . . . 345_ _writeFileByte (C-SPY system macro) . . . . . . . . . . . . . 345_ _writeMemoryByte (C-SPY system macro). . . . . . . . . . 346_ _writeMemory16 (C-SPY system macro) . . . . . . . . . . . 347_ _writeMemory32 (C-SPY system macro) . . . . . . . . . . . 347_ _writeMemory8 (C-SPY system macro) . . . . . . . . . . . . 346
U430-2
379

380
www.iar.com. . . . . . . . . . . . . . . . . . . . . . . . . . . . . . . . . . . . 20
XXAR . . . . . . . . . . . . . . . . . . . . . . . . . . . . . . . . . . . . . . . . . . 67
documentation . . . . . . . . . . . . . . . . . . . . . . . . . . . . . . . . 20XAR options
setting in Embedded Workbench . . . . . . . . . . . . . . . . . 323XAR overview . . . . . . . . . . . . . . . . . . . . . . . . . . . . . . . . . . 12XCL filename (XLINK option). . . . . . . . . . . . . . . . . . . . . 319xcl (filename extension) . . . . . . . . . . . . . . . . . . . . . . . . . . . 18xlb (filename extension) . . . . . . . . . . . . . . . . . . . . . . . . . . . 18XLIB. . . . . . . . . . . . . . . . . . . . . . . . . . . . . . . . . . . . . . . . . . 67
documentation . . . . . . . . . . . . . . . . . . . . . . . . . . . . . . . . 20features . . . . . . . . . . . . . . . . . . . . . . . . . . . . . . . . . . . . . 12options, definition of . . . . . . . . . . . . . . . . . . . . . . . . . . 360overview . . . . . . . . . . . . . . . . . . . . . . . . . . . . . . . . . . . . 12
XLIB optionsdefinition of . . . . . . . . . . . . . . . . . . . . . . . . . . . . . . . . . 360
XLINKdiagnostics, suppressing. . . . . . . . . . . . . . . . . . . . . . . . 316documentation . . . . . . . . . . . . . . . . . . . . . . . . . . . . . . . . 20example . . . . . . . . . . . . . . . . . . . . . . . . . . . . . . . . . . . . . 34overview . . . . . . . . . . . . . . . . . . . . . . . . . . . . . . . . . . . . 11
XLINK list filesgenerating . . . . . . . . . . . . . . . . . . . . . . . . . . . . . . . . . . 317including segment map . . . . . . . . . . . . . . . . . . . . . . . . 317specifying lines per page . . . . . . . . . . . . . . . . . . . . . . . 317
XLINK options . . . . . . . . . . . . . . . . . . . . . . . . . . . . . . . . . 311Always generate output . . . . . . . . . . . . . . . . . . . . . . . . 315Debug info . . . . . . . . . . . . . . . . . . . . . . . . . . . . . . . . . . 313Debug info with terminal I/O. . . . . . . . . . . . . . . . 116, 313Define symbol . . . . . . . . . . . . . . . . . . . . . . . . . . . . . . . 314definition of . . . . . . . . . . . . . . . . . . . . . . . . . . . . . . . . . 360factory settings. . . . . . . . . . . . . . . . . . . . . . . . . . . 311, 323Fill pattern . . . . . . . . . . . . . . . . . . . . . . . . . . . . . . . . . . 321Fill unused code memory. . . . . . . . . . . . . . . . . . . . . . . 321Format . . . . . . . . . . . . . . . . . . . . . . . . . . . . . . . . . . . . . 312Generate checksum . . . . . . . . . . . . . . . . . . . . . . . . . . . 321
Generate linker listing . . . . . . . . . . . . . . . . . . . . . . . . . 317Ignore CSTARTUP in library. . . . . . . . . . . . . . . . . . . . 318Include paths . . . . . . . . . . . . . . . . . . . . . . . . . . . . . . . . 318Inherent . . . . . . . . . . . . . . . . . . . . . . . . . . . . . . . . . . . . 319Inherent, no object code . . . . . . . . . . . . . . . . . . . . . . . . 320Library . . . . . . . . . . . . . . . . . . . . . . . . . . . . . . . . . . . . . 318Lines/page . . . . . . . . . . . . . . . . . . . . . . . . . . . . . . . . . . 317Load as LIBRARY. . . . . . . . . . . . . . . . . . . . . . . . . . . . 320Load as PROGRAM . . . . . . . . . . . . . . . . . . . . . . . . . . 320Module status. . . . . . . . . . . . . . . . . . . . . . . . . . . . . . . . 319Module-local symbols . . . . . . . . . . . . . . . . . . . . . . . . . 313No global type checking . . . . . . . . . . . . . . . . . . . . . . . 315Output file . . . . . . . . . . . . . . . . . . . . . . . . . . . . . . . . . . 312Output format . . . . . . . . . . . . . . . . . . . . . . . . . . . . . . . 313Range checks . . . . . . . . . . . . . . . . . . . . . . . . . . . . . . . . 316Segment map . . . . . . . . . . . . . . . . . . . . . . . . . . . . . . . . 317Segment overlap warnings . . . . . . . . . . . . . . . . . . . . . . 315setting in Embedded Workbench . . . . . . . . . . . . . . . . . 311Suppress all warnings . . . . . . . . . . . . . . . . . . . . . . . . . 316Suppress these diagnostics . . . . . . . . . . . . . . . . . . . . . . 316Treat these as errors . . . . . . . . . . . . . . . . . . . . . . . . . . . 316Treat these as warnings . . . . . . . . . . . . . . . . . . . . . . . . 316Warnings/Errors . . . . . . . . . . . . . . . . . . . . . . . . . . . . . . 316XCL filename . . . . . . . . . . . . . . . . . . . . . . . . . . . . . . . 319
XLINK outputoverriding default format . . . . . . . . . . . . . . . . . . . . . . . 313
XLINK symbols, defining. . . . . . . . . . . . . . . . . . . . . . . . . 314
Zzero-overhead loop, definition of . . . . . . . . . . . . . . . . . . . 360zone, definition of . . . . . . . . . . . . . . . . . . . . . . . . . . . 108, 360
Symbols#define options (XLINK) . . . . . . . . . . . . . . . . . . . . . . . . . 314#define statement, in compiler . . . . . . . . . . . . . . . . . . . . . 299#define (assembler options) . . . . . . . . . . . . . . . . . . . . . . . 307#line directives, generating in compiler . . . . . . . . . . . . . . 300
U430-2
MSP430 IAR Embedded Workbench™ IDEUser Guide

Index
#pragma directive, definition of . . . . . . . . . . . . . . . . . . . . 356#undef (assembler options) . . . . . . . . . . . . . . . . . . . . . . . . 309$CUR_DIR$ (argument variable) . . . . . . . . . . . . . . . . . . . 242$CUR_LINE$ (argument variable) . . . . . . . . . . . . . . . . . . 242$EW_DIR$ (argument variable) . . . . . . . . . . . . . . . . . . . . 242$EXE_DIR$ (argument variable) . . . . . . . . . . . . . . . . . . . 242$FILE_DIR$ (argument variable) . . . . . . . . . . . . . . . . . . . 242$FILE_FNAME$ (argument variable) . . . . . . . . . . . . . . . 242$FILE_PATH$ (argument variable) . . . . . . . . . . . . . . . . . 242$LIST_DIR$ (argument variable) . . . . . . . . . . . . . . . . . . . 242$OBJ_DIR$ (argument variable) . . . . . . . . . . . . . . . . . . . 242$PROJ_DIR$ (argument variable) . . . . . . . . . . . . . . . . . . 242$PROJ_FNAME$ (argument variable) . . . . . . . . . . . . . . . 242$PROJ_PATH$ (argument variable) . . . . . . . . . . . . . . . . . 242$TARGET_DIR$ (argument variable) . . . . . . . . . . . . . . . 243$TARGET_FNAME$ (argument variable) . . . . . . . . . . . . 243$TARGET_PATH$ (argument variable) . . . . . . . . . . . . . . 243$TOOLKIT_DIR$ (argument variable) . . . . . . . . . . . . . . 243_ _cancelAllInterrupts (C-SPY system macro) . . . . . 164, 334_ _cancelInterrupt (C-SPY system macro) . . . . . . . . 164, 334_ _clearBreak (C-SPY system macro). . . . . . . . . . . . . . . . 335_ _closeFile (C-SPY system macro) . . . . . . . . . . . . . . . . . 335_ _disableInterrupts (C-SPY system macro) . . . . . . . 164, 335_ _driverType (C-SPY system macro). . . . . . . . . . . . . . . . 335_ _enableInterrupts (C-SPY system macro) . . . . . . . 165, 336_ _openFile (C-SPY system macro) . . . . . . . . . . . . . . . . . 336_ _orderInterrupt (C-SPY system macro) . . . . . . . . . 165, 337_ _readFile (C-SPY system macro). . . . . . . . . . . . . . . . . . 337_ _readFileByte (C-SPY system macro) . . . . . . . . . . . . . . 338_ _readMemoryByte (C-SPY system macro) . . . . . . . . . . 338_ _readMemory16 (C-SPY system macro) . . . . . . . . . . . . 339_ _readMemory32 (C-SPY system macro) . . . . . . . . . . . . 340_ _readMemory8 (C-SPY system macro) . . . . . . . . . . . . . 339_ _registerMacroFile (C-SPY system macro) . . . . . . . . . . 340_ _resetFile (C-SPY system macro) . . . . . . . . . . . . . . . . . 341_ _setCodeBreak (C-SPY system macro) . . . . . . . . . . . . . 341_ _setDataBreak (C-SPY system macro) . . . . . . . . . 342–343_ _strFind (C-SPY system macro) . . . . . . . . . . . . . . . . . . 343_ _subString (C-SPY system macro). . . . . . . . . . . . . . . . . 344
_ _toLower (C-SPY system macro) . . . . . . . . . . . . . . . . . 344_ _toUpper (C-SPY system macro). . . . . . . . . . . . . . . . . . 345_ _writeFile (C-SPY system macro) . . . . . . . . . . . . . . . . . 345_ _writeFileByte (C-SPY system macro) . . . . . . . . . . . . . 345_ _writeMemoryByte (C-SPY system macro). . . . . . . . . . 346_ _writeMemory16 (C-SPY system macro) . . . . . . . . . . . 347_ _writeMemory32 (C-SPY system macro) . . . . . . . . . . . 347_ _writeMemory8 (C-SPY system macro) . . . . . . . . . . . . 346
Numerics430 (directory) . . . . . . . . . . . . . . . . . . . . . . . . . . . . . . . . . . 16
U430-2
381

382
U430-2
MSP430 IAR Embedded Workbench™ IDEUser Guide