User Guide for Schwab Equity Ratings Report€¦ · Equity Ratings Report The Schwab Equity Ratings...
12
(0518-8740) User Guide for Schwab Equity Ratings Report The Schwab Equity Ratings Report will help you make informed decisions on equities by providing you with important additional information and analysis. Each position in your portfolio, whether you’re buying or selling, should use a disciplined strategy regardless of investment style. This report will provide ideas you might consider in developing such a strategy.
Transcript of User Guide for Schwab Equity Ratings Report€¦ · Equity Ratings Report The Schwab Equity Ratings...

(0518-8740)
User Guide for SchwabEquity Ratings ReportThe Schwab Equity Ratings Report will help you make informed decisions on equities by providing you with important additional information and analysis. Each position in your portfolio, whether you’re buying or selling, should use a disciplined strategy regardless of investment style. This report will provide ideas you might consider in developing such a strategy.
How to use the equity ratings report
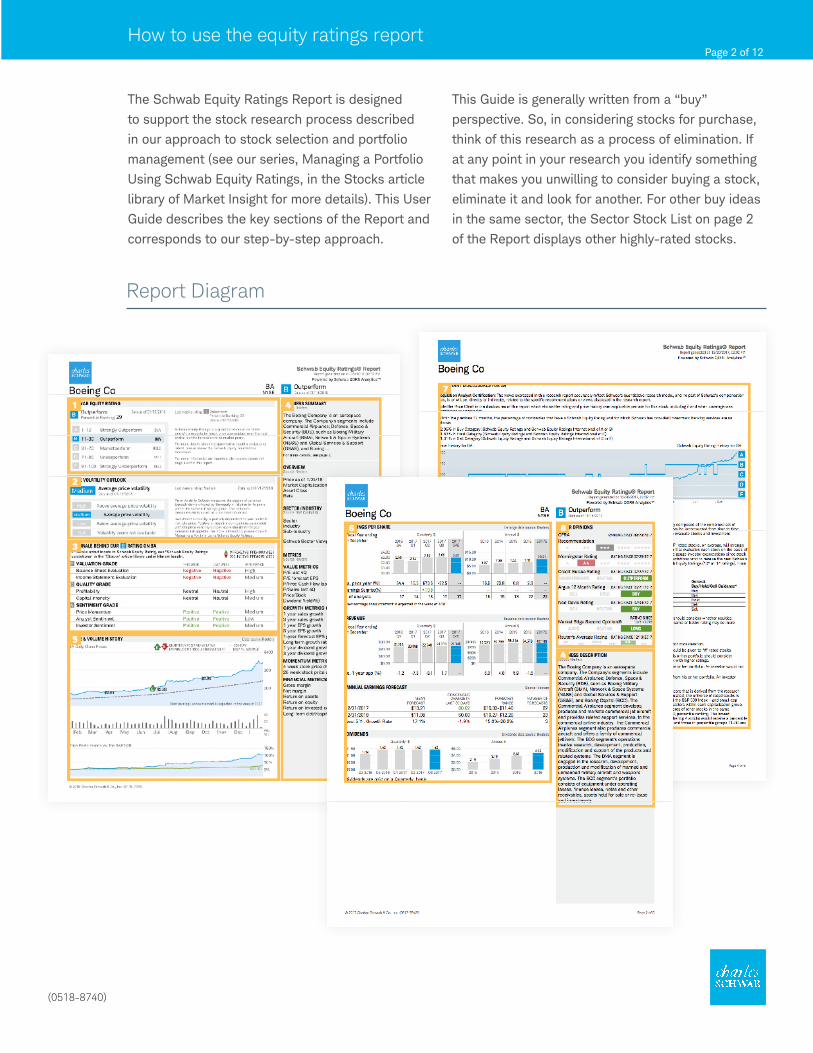
The Schwab Equity Ratings Report is designed
to support the stock research process described
in our approach to stock selection and portfolio
management (see our series, Managing a Portfolio
Using Schwab Equity Ratings, in the Stocks article
library of Market Insight for more details). This User
Guide describes the key sections of the Report and
corresponds to our step-by-step approach.
This Guide is generally written from a “buy”
perspective. So, in considering stocks for purchase,
think of this research as a process of elimination. If
at any point in your research you identify something
that makes you unwilling to consider buying a stock,
eliminate it and look for another. For other buy ideas
in the same sector, the Sector Stock List on page 2
of the Report displays other highly-rated stocks.
(0518-8740)
Report Diagram
Page 2 of 12
How to use the equity ratings report
The “Schwab Equity Rating” section gives an
overview of the current and prior week’s Rating
and percentile rank. Below the Ratings, you’ll see
a graphic view of the distribution of the Schwab
Equity Rating and percentile ranks. The guidance
corresponding to the stock’s current Rating (A =
The Price Volatility Outlook section gives an overview
of the current and prior week’s Outlook. This
information can help you set your expectations
regarding a particular investment. Stocks that rank
“high” are expected to experience above average
To begin your evaluation, examine the current Rating.
Consider purchasing stocks rated A or high B (see
the explanation of a high B below), with a preference
for A-rated stocks, while considering D- and F-rated
stocks as potential sell candidates. C-rated stocks
can be considered as holds, or as a neutral opinion.
The percentile ranks can be used to refine your
decisions by selecting stocks based on their
percentile ranks and not just the Rating’s letter
Every investor is unique. We all have different
financial goals and different levels of risk tolerance
associated with achieving those goals. The
classic example which highlights the differences
between risk appetites compares someone close to
retirement, guarding their nest egg, versus a young
professional pursuing a selection of more risky
positions to invigorate their portfolio. Schwab Equity
Ratings’ Price Volatility Outlook metric provides
Strongly Outperform / Buy, B = Outperform / Buy,
etc.) appears to the right of the graph, along with
sources for additional information about Schwab
Equity Ratings. This information about the Rating can
help you quickly decide if a stock is a buy (or sell)
candidate.
price volatility over the next 6 months. Stocks that
rank “low” are expected to have below average price
volatility over the next 6 months. This supplemental
information is intended to help you select stocks that
will help you meet your risk and return objectives.
grade. Lower percentile ranks for A and B-rated
stocks are considered better buy candidates, while
higher ranks are considered stronger sell candidates
within D and F-rated stocks. For example, a Schwab
Equity Rating with high B-rated stocks – those with
percentile ranks between 11 and 15 – are generally
expected to outperform B-rated stocks with
percentile ranks between 25 and 30.
some beneficial insights into the projected volatility
of a particular stock to help you assess the goodness
of fit for their unique financial goals.
We do NOT suggest you use the Price Volatility
Outlook independently to make buy or sell decisions.
Rather, it provides a process for projecting the
future price volatility of a stock to arm the intelligent
investor in his or her decision making.
(0518-8740)
Start your Evaluation Process by Looking at the Schwab Equity Rating
What is the Expected Price Volatility of This Stock?
1
2
What You’re Seeing and Why
What You’re Seeing and Why
How to Use This Information
How to Use This Information
Page 3 of 12
How to use the equity ratings report
(0518-8740)
This section shows the Schwab Equity Ratings
Component grades (Valuation, Quality, and
Sentiment) and the Research Concepts associated
with each Component. The Components and
Research Concepts can help you make more
effective use of the Ratings by providing an
understanding of the basis for a stock’s rating and
why it changed ( if it did). For more information on
the Components and Research Concepts, see our
Schwab Equity Ratings Foundations document in the
Stocks article library.
This section provides two levels of perspective.
At the first level, the “Rationale” section displays
the current grades for the three Components.
Component grades can be interpreted in the same
We do NOT suggest that you allow Component
grades to override the overall Schwab Equity
Rating. Instead, consider each Component grade
as illustrating various aspects of a stock’s overall
Rating.
Valuation: This Component is based on several
value- oriented investment criteria. Valuation
grades may change at any time, since the Research
Concepts used employ financial statement data,
market prices, and information about the behavior of
short sellers.
Quality: This Component is based on financial
performance and earnings quality measures drawn
from recent financial statement data. In general, the
release of new financial statement data may cause a
change in a stock’s Quality grade, though the grade
may change at any time.
manner as the A/B/C/D/F grades for the overall
Rating. Moving to the next level of detail, under each
Component you will see the Research Concepts
which form the basis for each Component grade.
To the right of each Research Concept are the
current and prior week’s scores. Positive/Neutral/
Negative scores are equivalent to A or B (Positive),
C (Neutral), and D or F (Negative). Declines from
the past week are indicated by downward-pointing
arrows, improvements by upward-pointing arrows.
The importance of each Research Concept is shown
in the column on the far right. To see a more detailed
explanation of the Research Concepts on schwab.
com, enter a ticker, click on the Ratings tab and the
Schwab’s Viewpoint tab, and click on the “Expand
All” link.
Sentiment: This Component uses several measures
of short-term changes in investor expectations,
including the sentiment of brokerage firm analysts
and the overall market. Sentiment grades can
change at any time and will generally change more
frequently than the grades of the other Components.
If a stock’s grade has changed since last week,
the “Rationale” section may help you understand
what drove the change. For example, in the Quality
component, changes in operating profitability may
indicate a company’s potential to increase profits
through margin expansion or the possible erosion of
profits through price competition. In the Sentiment
component, recent changes in the earnings
estimates and ratings of brokerage analysts may be
an early sign of changing market sentiment.
Understand the Rationale for the Rating3What You’re Seeing and Why
How to Use This Information
Page 4 of 12
How to use the equity ratings report
Based on the financial and other data presented
here, you can determine suitability by assessing the
stock’s characteristics relative to your investment
objectives, risk tolerance, strategy, and current
portfolio holdings. Here are some general guidelines
for each category of metrics.
Business Summary: Understanding what a company
does can help you interpret how recent news may
affect the company. If the company’s business
or activities seem hard to understand, consider
eliminating the stock from consideration and
searching for another.
Overview: If you are currently overexposed to a
capitalization category, or you believe the stock is
not consistent with your investment objectives or
your portfolio based on its capitalization or beta,
eliminate it and look for another (check the Sector
List for stocks in the same sector).
Sector/Industry: You should know the sector in
which the company operates in order to maintain
your portfolio’s sector diversification. Proper
diversification across sectors is vital because it can
help reduce your portfolio’s expected risk without
reducing expected returns.
Metrics: If your investment objectives and strategy
specifically seek out stocks with particular
characteristics (e.g., strong price momentum, high
earnings growth forecasts, positive dividend yields),
use the appropriate metrics to assess whether a
stock is consistent with your preferences.
(0518-8740)
How to Use This Information
Page 5 of 12
This section is intended to allow you to quickly
determine whether or not the stock you’re
considering is appropriate for your portfolio, given
your investment objectives and strategy. There are
four parts of this section:
Business Summary: Provides a brief description
of the company’s key business or businesses,
economic activities (manufacturing, distribution,
etc.), and geographic scope if applicable. Information
is provided by Standard & Poor’s. An expanded
description, provided by Reuters, is shown on page 2
of the Report.
Overview: Classifies the stock in terms of price
(the closing price as of the date listed), market
capitalization (based on most recent quarterly
shares outstanding and closing price), the stock’s
capitalization-based asset class ( large-, mid-,
small-, or micro-cap), and its beta (a measure of the
stock’s co-movement with the market in general,
with higher values generally considered as riskier).
Sector/Industry: Displays the stock’s Sector (the
economic category of its primary business activities),
industry, and sub-industry. This section also
displays the Schwab Sector Viewpoint, representing
Schwab’s outlook for the company’s sector in the
intermediate term.
Metrics: This section displays measures that
generally describe the company’s performance
characteristics, grouped into Value, Growth,
Momentum, and Financial metrics. For comparison,
the company’s values are shown relative to those of
the Standard & Poor’s 500 Index whenever possible.
Suitability: Is This Stock Appropriate for Your Portfolio?4What You’re Seeing and Why
How to use the equity ratings report
At the individual company level, markets react for
a reason, so try to determine the reason for any
unusual price or volume behavior. Price changes are
most informative when viewed relative to a broader
market index, such as the S&P 500 index. Check
for recent spikes, up or down, in relative prices and
volume as possible evidence of a market reaction
to an earnings announcement, including those with
positive or negative surprises. Other price changes
may indicate the release of news that merits further
research. If such evidence appears, check the
company’s earnings and news as described below.
The stock’s price performance relative to its own
historical prices, as measured by the 200-day
moving average, provides a view of intermediate-
term price trends. If you observe a downward trend
in the current price relative to the moving average,
eliminate the stock and look for another.
The expected date of the company’s next earnings
announcement is worth noting. If an earnings report
is expected within 1-2 weeks, we recommend that
you consider waiting until after the report to assess
the market’s reaction. An earnings announcement,
and the market’s reaction to it, is a “known
unknown” – a source of risk that can potentially
be reduced by waiting for more information. If a
company’s earnings report is late, eliminate the
stock and look for another – late reporting may
indicate negative news.
(0518-8740)
How to Use This Information
This section displays the company’s earnings,
revenues, and dividends ( if paid). Reported earnings,
revenues, and dividends are shown for the past 4
fiscal quarters and years. Estimated earnings and
revenues are shown for the current quarter and
year if available. In addition, this section provides
information about the consensus forecasts of
brokerage analysts for earnings for the current and
following fiscal years and the consensus long-term
Check the Company’s Earnings6What You’re Seeing and Why
Page 6 of 12
Schwab believes that the stock market is relatively
efficient at incorporating news and significant
events into a stock’s price. The purpose of a
market sentiment check is to look for evidence of
recent changes in investor perception as reflected
in the stock’s price history, earnings reports, and
performance relative to the market, as the market’s
reaction to this evidence is believed to be indicative
of future performance. The price chart in the upper
portion of this section shows the stock’s price over
the past year, relative to its 200-day moving average.
The company’s quarterly earnings per share reported
during that period, the positive (green up arrow)
or negative (red down arrow) earnings surprise
generated by those earnings if applicable, and the
stock’s weekly trading volume included in this chart.
The price chart in the lower portion section shows
the stock’s price over the period in percentage
terms, relative to the Standard & Poor’s 500 stock
index. Both price lines begin at 0%, making it easier
to evaluate the stock’s relative price performance.
Check the Market’s Sentiment5What You’re Seeing and Why
How to use the equity ratings report
You should not use information about earnings,
revenues, and dividends in this section to override
the stock’s Schwab Equity Rating. Instead, consider
each section as illustrating various aspects of a
stock’s overall Rating.
Under the Earnings Per Share Section
EPS history and forecast: Among other factors,
Schwab Equity Ratings considers the history
of a company’s earnings surprises, and prefers
companies with a pattern of positive surprises.
# of analysts: Companies followed by relatively large
numbers of sell-side analysts are generally believed
to offer fewer opportunities for “surprise anticipation”
(one of the foundational principles of Schwab Equity
Ratings), possibly because those analysts have done
exhaustive and careful research on the company.
Expected earnings announcement dates: An
earnings report represents a potential “event
risk” - the chance that reported earnings will be
significantly worse than the market’s expectations.
If an earnings report is expected within 1-2 weeks,
we recommend that you consider waiting until
after the report to assess the market’s reaction. If
a company’s earnings report is late, eliminate the
stock and look for another – late reporting may
potentially indicate negative news.
Under the Revenue Section
In general, a firm’s revenues have less predictive
power than its earnings. As with earnings, many of
the predictive aspects of revenues have already been
incorporated into Schwab Equity Ratings. A pattern
of positive revenue growth (the “vs. prior year (%)”
row), both quarterly and annual, is usually preferred.
Under the Annual Earnings Forecasts Section
Brokerage analysts revise their forecasts and ratings
when they receive new information about companies,
and those revisions frequently move stock prices in
the same direction. But Schwab research has found
that often the analysts, and the market as a whole,
initially tend to underreact react to new information,
leading to follow-on effects on performance. Positive
recent revisions of earnings and growth forecasts,
along with a moderate range of values for analysts’
estimates are preferred.
Under the Dividends Section
If a company has paid a dividend, look for stable
to increasing dividend growth on an annual basis.
Under normal circumstances, rising dividends may
be a signal of a healthy, growing company.
(0518-8740)
How to Use This Information
Page 7 of 12
EPS growth rate estimate. It also provides the recent
change ( if any) in these consensus forecasts, the
number of estimates for all three measures, and
their range from minimum to maximum.
Schwab believes there is useful information
in a company’s quarterly and annual earnings
announcements, and the earnings forecasts of
brokerage analysts. Thus the predictive aspects
of many of these measures have already been
incorporated in the Schwab Equity Ratings. The data
in this section, therefore, is provided purely to give
you a better understanding for the stock’s overall
Rating.
In keeping with Schwab’s goals of objectivity and
transparency, we make available access to the
research and recommendations of independent
research firms (Standard & Poor’s, Credit Suisse,
Ned Davis Research, Argus Research, Reuters,
and Market Edge). The use of independent third-
party research is optional – Schwab believes that
Schwab Equity Ratings are the most useful source of
information for our clients, since we believe them to
be objective,
You should neither expect nor require a stock’s
Schwab Equity Rating to conform to a third-party
opinion, and a third-party opinion should generally
not override a stock’s Rating. Studying the third party
research firm’s rationale for its rating may give you a
better understanding of the company’s operations
consistently applied, and equally balanced between
low and high ratings. But independent third-party
research may provide an additional perspective
a company and its industry, allowing you to
better evaluate news and company or industry
developments.
To access a third party’s independent research, click
on the “Reports” tab of the Research >>> Stocks
page and view the vendor’s research report for the
company.
and the potential performance risks of its stock.
Buying a stock: For stocks with Ratings of A
or high B, research the basis for a third-party
recommendation of “sell” or “underperform,” by
Check for Other Opinions8What You’re Seeing and Why
How to Use This Information
How to use the equity ratings report
Review news about the company with your
understanding of its business, industry, and recent
price and volume behavior in mind. Look for news
items that are both material and recent. Earnings
restatements, divestitures or acquisitions, product
news (recalls, product releases), legal issues
(product-related lawsuits, antitrust developments),
company-specific news (auditor or senior
management changes) and other factors may be
relevant. Concentrate on recent news that may not
yet be incorporated into the Schwab Equity Rating
via price movements or analysts’ sentiment. If you
observe news that seems to explain a price and/or
volume spike and makes you unwilling to consider
the stock for purchase, eliminate it and look for
another stock in the Sector List.
(0518-8740)
How to Use This Information
Page 8 of 12
Schwab Equity Ratings are generally available by
Monday mornings. You should always check for
recently released news on any stock before you
make a decision to buy or sell, because recent news
may not be reflected in the current Rating. Page 4 of
the Schwab Equity Ratings Report displays news
stories that have occurred over the period shown
in the price chart at the top of the page. Each news
story is identified by a number that corresponds to
the numbers shown at the top of the chart.
Check the News7What You’re Seeing and Why
How to use the equity ratings report
(0518-8740)
Page 9 of 12
clicking on the “Reports” tab of the Research >>> Stocks page and viewing the vendor’s research
report. If you see what seems to be a compelling
reason for a negative rating on a stock rated A
or B by Schwab Equity Ratings, eliminate it from
consideration and look for another.
Selling a stock: In general, consider selling stocks
with Schwab Equity Ratings of D or F in spite of
“buy” or “outperform” opinions from third-party
research providers.
Important Disclosures
Schwab Equity Ratings use a scale of A, B, C, D and
F, and are assigned to approximately 3,000 stocks
headquartered in the United States and certain
foreign nations where companies typically locate or
incorporate for operational or tax reasons. Schwab’s
outlook is that A-rated stocks, on average, will
strongly outperform, and F-rated stocks, on average,
will strongly underperform the equities market during
the next 12 months. Schwab Equity Ratings are
not personal recommendations for any particular
investor. Before buying, investors should consider
whether the investment is suitable for themselves
and their portfolio. Schwab Equity Ratings should
only constitute one component in your own research
to evaluate stocks and investment opportunities.
The information provided is for general informational
purposes only and should not be considered as
an individualized recommendation or personalized
investment advice. The investment strategies
mentioned here may not be suitable for everyone.
Each investor needs to review an investment strategy
for his or her own particular situation before making
any investment decision.
All expressions of opinion are subject to change
without notice in reaction to shifting market
conditions. Examples provided are for illustrative
purposes only and not intended to be reflective of
results you can expect to achieve.
(0518-8740)
Page 10 of 12
Glossary
4 week price change: Percentage change in the
price of a security from the day’s closing price 4
weeks prior to the most recent closing price.
52 week price change: Percentage change in the
price of a security from the day’s closing price 52
weeks prior to the most recent closing price.
3 year EPS growth: A measure of growth in a
company’s net income over a 3 year period. The term
can apply to actual data from previous periods or
estimated data for future periods.
3-5 years EPS growth forecast: The consensus
value (arithmetic mean or average) of all long-term
earnings growth estimates provided by contributing
sell-side analysts.
Announcement Date: The date on which a
company’s directors meet to announce the date
and amount of the next dividend payment. Once the
payment has been authorized, it is called a declared
dividend, which is a legal liability. Compare with
Earnings Announcement Date and Expected Earnings
Announcement Date.
Book Value: The value of the shareholders’ equity, or
net worth, of a company, calculated by subtracting
the company’s total liabilities from its total assets.
Total assets and total liabilities are generally
measured at their historical costs rather than
at current market values. Consensus Forecast:
Generally, the arithmetic mean (average) of all
sell-side stock analysts’ forecasts of a company’s
earnings, revenues, etc. for a particular period.
Dividend Yield: The company’s Indicated Annual
Dividend divided by the current market price of its
common stock.
Earnings Surprise: The amount by which a
company’s reported earnings differ from the
consensus analyst earnings forecast, expressed as
a percentage of the consensus forecast. Earnings
surprises may be positive or negative, and are often
followed by corresponding positive or negative
movements in the stock’s price.
EPS: Earnings per share, or the company’s income
divided by the average number of common shares
outstanding over the period when the income was
earned. Income may be measured in various ways
(e.g., before or after “extraordinary gains or losses,”
before or after adjusting for the possible conversion
of convertible bonds or convertible preferred stock,
etc.)
EPS % Change: Average estimate for the current
time period compared with actual earnings from an
equivalent previous time period. Comparisons can
be made with equivalent changes in the stock’s own
industry as well as the broader market as a whole.
Forecast Range: The difference, in absolute value,
between the highest and lowest forecasts of a group
of earnings or other forecasts.
Indicated Annual Dividend: Generally, a company’s
most recent quarterly dividend multiplied by 4,
effectively converting the quarterly dividend to an
annual amount.
Long-Term Debt/Capital: Long-term debt capital,
including capital leases, divided by total assets.
This ratio describes the company’s reliance on debt
to finance its assets. When calculating this ratio, it
is conventional to consider both current and non-
current debt and assets. In general, the lower the
company’s reliance on debt for asset financing,
the less risky the company is believed to be, since
excessive debt can lead to heavy interest and
principal repayment burdens.
Market Capitalization (“market cap”): The total
market value of the company’s outstanding common
stock, measured as the current market price times
(0518-8740)
Page 11 of 12
Glossary
the number of common shares outstanding as of the
end of a fiscal period, usually a quarter.
Net Margin: Net profit divided by net revenues,
usually expressed as a percentage. This number is
an indication of how effective a company is at cost
control. The higher the firm’s net margin, the more
effective the company is at converting revenue
into actual profit. The net margin is a good way of
comparing companies in the same industry, since
such companies are generally subject to similar
business conditions.
Number of Forecasts: The number of sell-side
analysts contributing to the Consensus Estimate.
P/E, forecast EPS: A Price/Earnings ratio defined as
the current stock price divided by a consensus EPS
estimate. Most commonly, the ratio uses the EPS
estimate for the current fiscal year. Less commonly, a
Forward Four Quarters (FFQ) version divides current
stock price by the sum of the mean EPS estimates
for the next four fiscal quarters.
PEG Ratio: The Price/Earnings ratio, based on EPS of
the last reported fiscal year, divided by the average
estimated long-term (3-5 year) growth rate. Lower
PEG ratios are believed to represent growth stocks
selling at better valuation multiples.
P/E Last 4Q: A variant of the Price/Earnings ratio
defined as the current price divided by the sum
of reported earnings per share for the latest four
quarters.
Price/Book (P/B) ratio: A company’s market
capitalization divided by its book value. Price/Book
is the same whether the calculation is done for the
whole company or on a per-share basis, calculated
as the stock’s current price divided by book value
per share. This ratio compares the market’s valuation
of a company to the value of that company as
indicated on its financial statements. Stocks with
low Price/Book ratios are frequently described
as undervalued.
Price/Earnings (P/E) ratio: the ratio of a company’s
current stock price to an earnings per share
measure. Price/Earnings is the same whether the
calculation is done on a per-share basis or for the
whole company, calculated as the stock’s current
income divided by its market capitalization. This
ratio compares the market’s valuation of a company
to the earnings of that company as indicated on its
financial statements. Stocks with low Price/Earnings
ratios are frequently described as undervalued.
Price History chart: A visual representation of the
closing share price of the company over time and
relative to a 200-day moving average of its prices.
The earnings for the quarters that were reported
during that period are also shown.
Return on Assets (ROA): A measure of a company’s
profitability, equal to the latest twelve months’ or
fiscal year’s earnings divided by its total assets,
expressed as a percentage.
Return on Equity (ROE): A measure of how well
a company used reinvested earnings to generate
additional earnings. ROE is equal to the latest twelve
months’ or fiscal year’s after-tax income (after
preferred stock dividends but before common stock
dividends) divided by book value, expressed as a
percentage. It is used as a general indication of the
company’s efficiency by measuring in percentage
terms the profit the company generated using the
resources provided by its stockholders.
(0518-8740)
Page 12 of 12