User Guide for Palm Oil Sector Indonesia 2050 Pathway ...
14
Halaman 1 dari 14 User Guide for Palm Oil Sector Indonesia 2050 Pathway Calculator
Transcript of User Guide for Palm Oil Sector Indonesia 2050 Pathway ...
Halaman 1 dari 14
User Guide for Palm Oil Sector
Indonesia 2050 Pathway Calculator
Halaman 2 dari 14
Daftar Isi
1. Introduction .......................................................................................................................................... 3
2. Overview of Palm Oil Sector in Indonesia ............................................................................................. 3
3. Assumption ........................................................................................................................................... 7
4. Methodology ....................................................................................................................................... 10
5. Results ................................................................................................................................................. 11
6. References .......................................................................................................................................... 14
Halaman 3 dari 14
1. Introduction This user Guide is intended for the users of Indonesia in 2050 Pathway Calculator (I2050PC), especially ifor palm oil plantation sector. There are four sections in this user guide: First, the overview section contains basic information on the development process of the Indonesian palm oil production to become the largest producer in the world. Second, the section that explain the assumptions on the selection of the data references. Third, contains the calculation methods and levels that will be used. Fourth, modeling results section which present the projected changes in land area and productivity of palm oil in Indonesia until 2050.
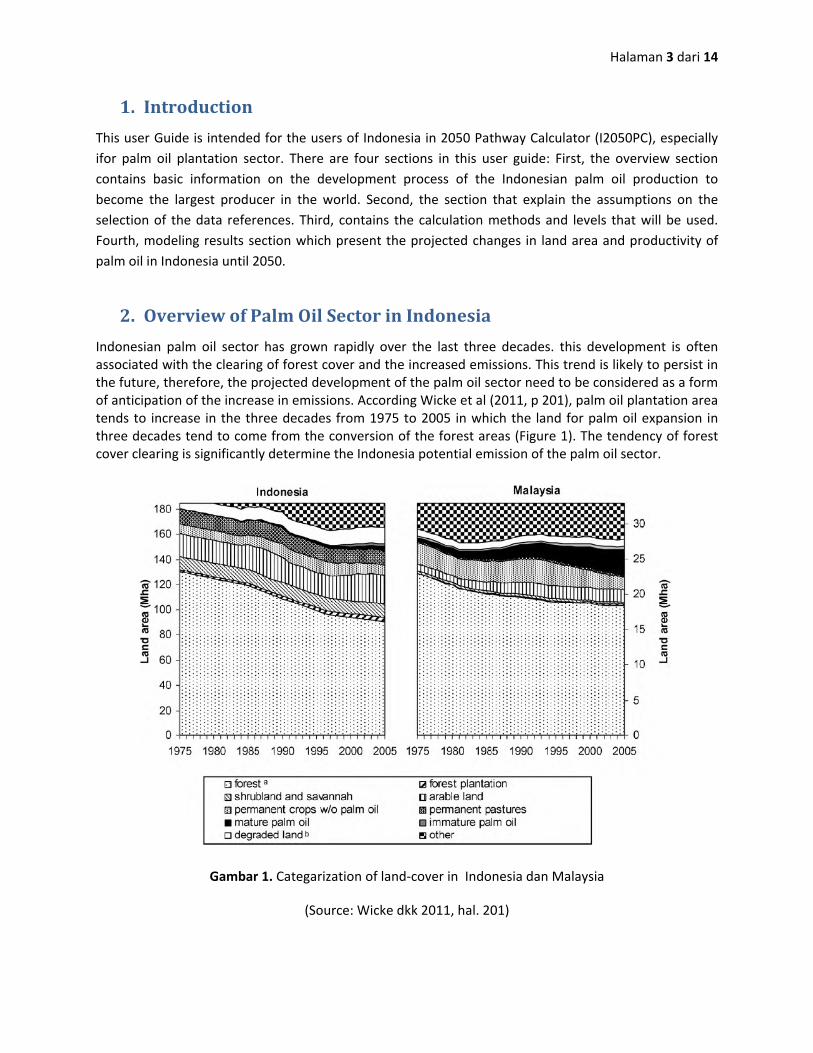
2. Overview of Palm Oil Sector in Indonesia Indonesian palm oil sector has grown rapidly over the last three decades. this development is often associated with the clearing of forest cover and the increased emissions. This trend is likely to persist in the future, therefore, the projected development of the palm oil sector need to be considered as a form of anticipation of the increase in emissions. According Wicke et al (2011, p 201), palm oil plantation area tends to increase in the three decades from 1975 to 2005 in which the land for palm oil expansion in three decades tend to come from the conversion of the forest areas (Figure 1). The tendency of forest cover clearing is significantly determine the Indonesia potential emission of the palm oil sector.
Gambar 1. Categarization of land-cover in Indonesia dan Malaysia
(Source: Wicke dkk 2011, hal. 201)
Halaman 4 dari 14
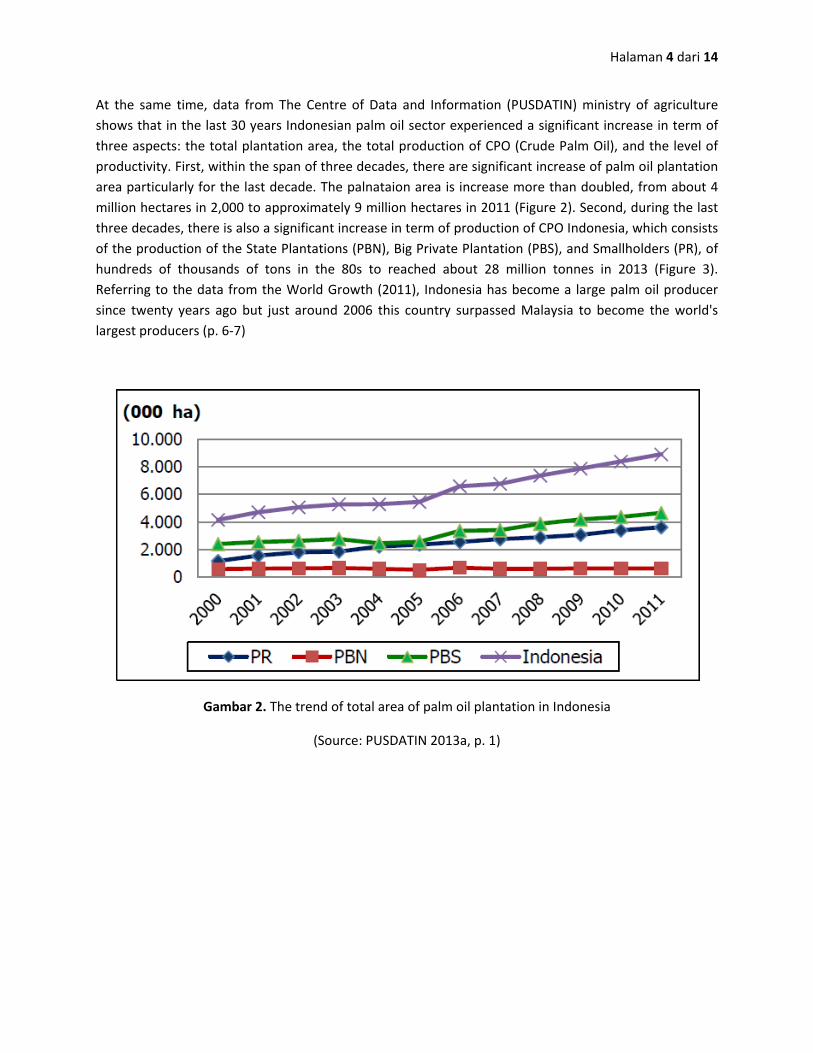
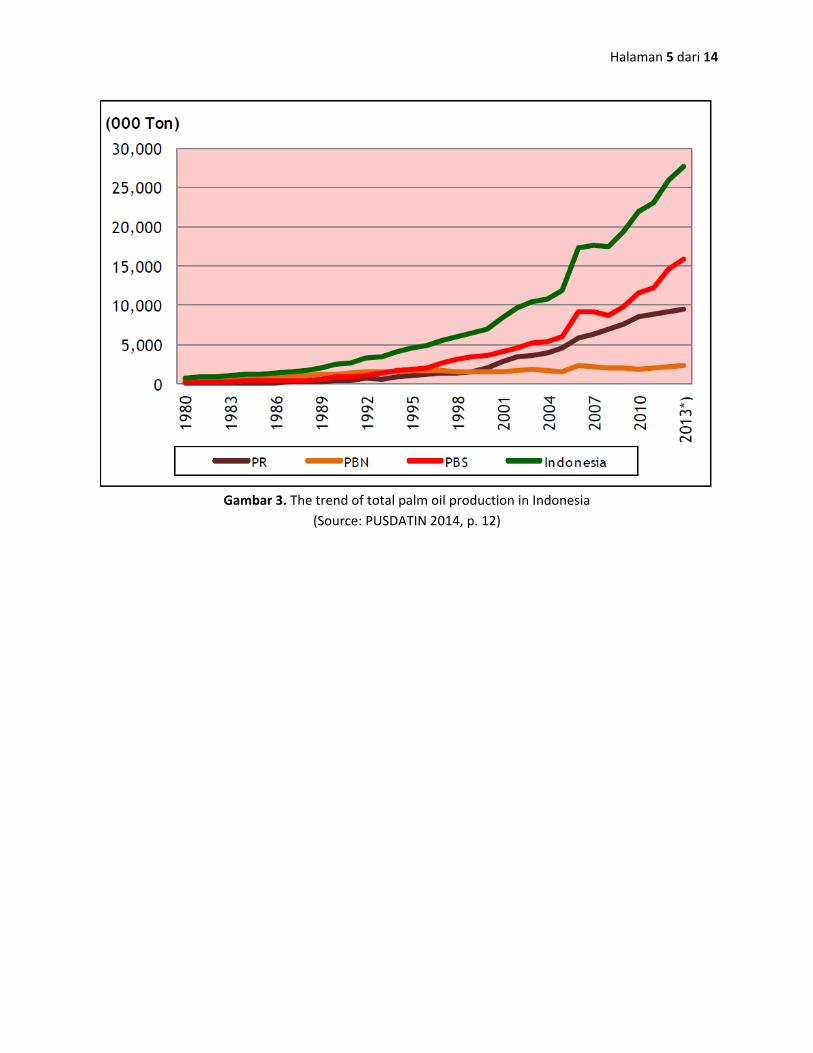
At the same time, data from The Centre of Data and Information (PUSDATIN) ministry of agriculture shows that in the last 30 years Indonesian palm oil sector experienced a significant increase in term of three aspects: the total plantation area, the total production of CPO (Crude Palm Oil), and the level of productivity. First, within the span of three decades, there are significant increase of palm oil plantation area particularly for the last decade. The palnataion area is increase more than doubled, from about 4 million hectares in 2,000 to approximately 9 million hectares in 2011 (Figure 2). Second, during the last three decades, there is also a significant increase in term of production of CPO Indonesia, which consists of the production of the State Plantations (PBN), Big Private Plantation (PBS), and Smallholders (PR), of hundreds of thousands of tons in the 80s to reached about 28 million tonnes in 2013 (Figure 3). Referring to the data from the World Growth (2011), Indonesia has become a large palm oil producer since twenty years ago but just around 2006 this country surpassed Malaysia to become the world's largest producers (p. 6-7)
Gambar 2. The trend of total area of palm oil plantation in Indonesia
(Source: PUSDATIN 2013a, p. 1)
Halaman 5 dari 14
Gambar 3. The trend of total palm oil production in Indonesia
(Source: PUSDATIN 2014, p. 12)
Halaman 6 dari 14
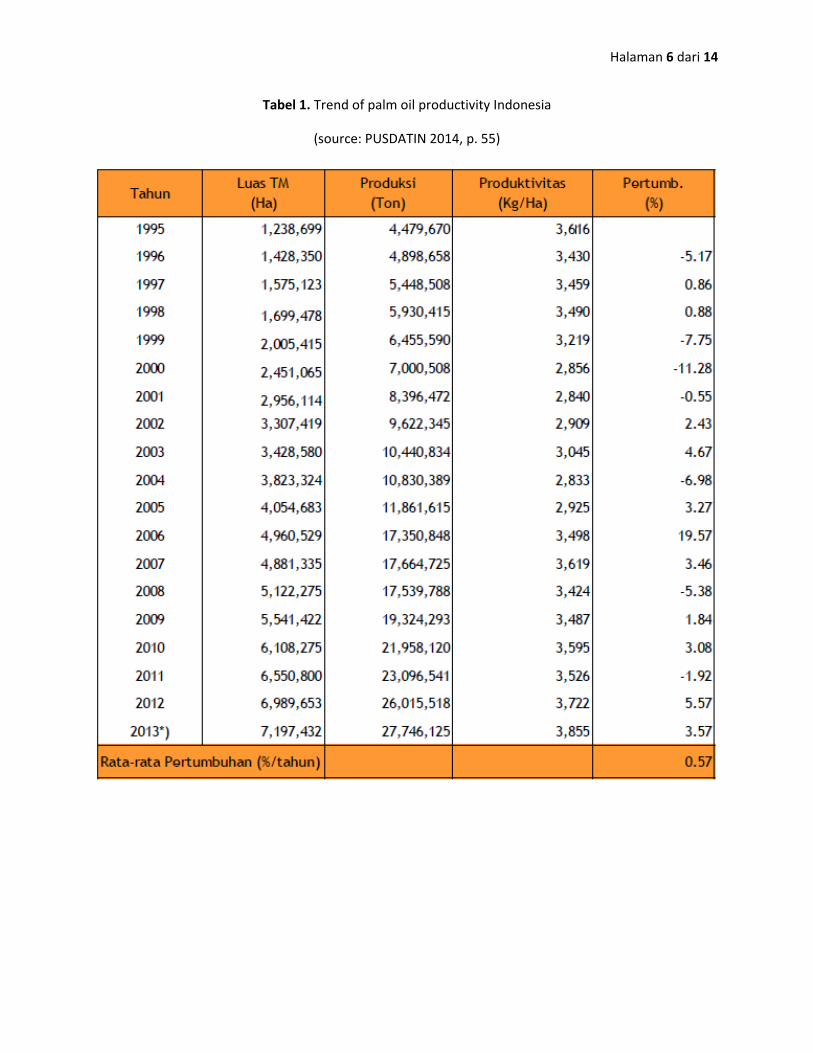
Tabel 1. Trend of palm oil productivity Indonesia
(source: PUSDATIN 2014, p. 55)
Halaman 7 dari 14
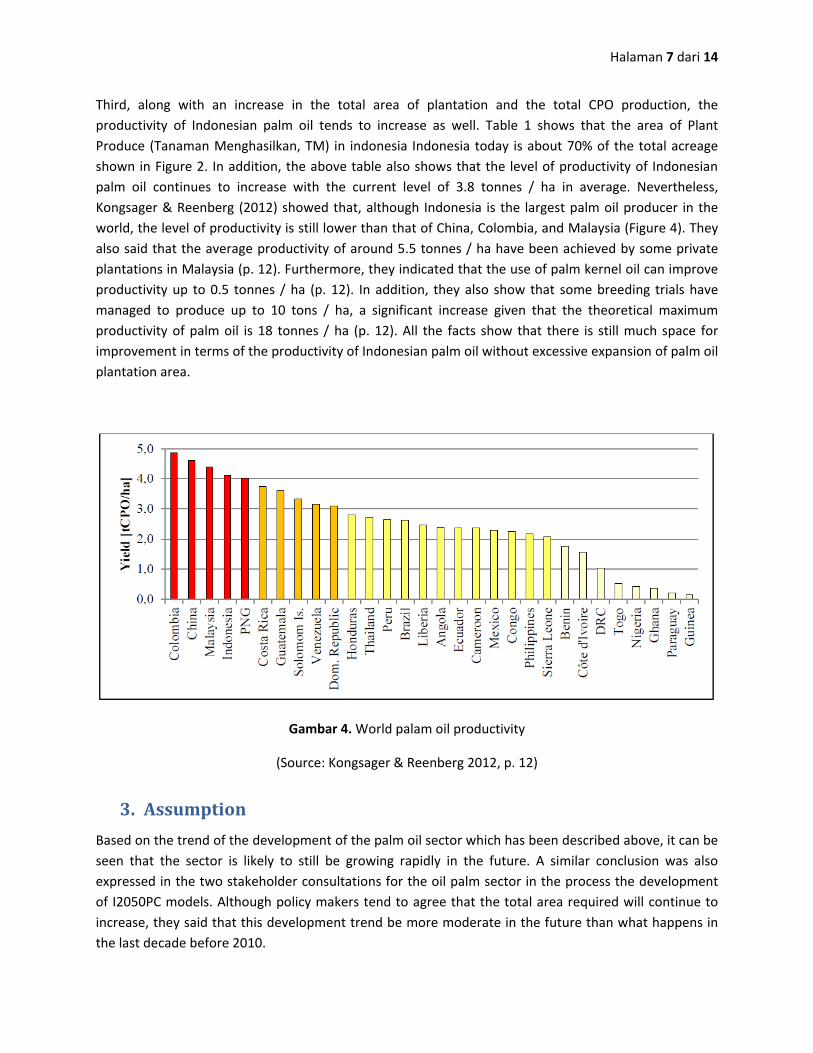
Third, along with an increase in the total area of plantation and the total CPO production, the productivity of Indonesian palm oil tends to increase as well. Table 1 shows that the area of Plant Produce (Tanaman Menghasilkan, TM) in indonesia Indonesia today is about 70% of the total acreage shown in Figure 2. In addition, the above table also shows that the level of productivity of Indonesian palm oil continues to increase with the current level of 3.8 tonnes / ha in average. Nevertheless, Kongsager & Reenberg (2012) showed that, although Indonesia is the largest palm oil producer in the world, the level of productivity is still lower than that of China, Colombia, and Malaysia (Figure 4). They also said that the average productivity of around 5.5 tonnes / ha have been achieved by some private plantations in Malaysia (p. 12). Furthermore, they indicated that the use of palm kernel oil can improve productivity up to 0.5 tonnes / ha (p. 12). In addition, they also show that some breeding trials have managed to produce up to 10 tons / ha, a significant increase given that the theoretical maximum productivity of palm oil is 18 tonnes / ha (p. 12). All the facts show that there is still much space for improvement in terms of the productivity of Indonesian palm oil without excessive expansion of palm oil plantation area.
Gambar 4. World palam oil productivity
(Source: Kongsager & Reenberg 2012, p. 12)
3. Assumption Based on the trend of the development of the palm oil sector which has been described above, it can be seen that the sector is likely to still be growing rapidly in the future. A similar conclusion was also expressed in the two stakeholder consultations for the oil palm sector in the process the development of I2050PC models. Although policy makers tend to agree that the total area required will continue to increase, they said that this development trend be more moderate in the future than what happens in the last decade before 2010.
Halaman 8 dari 14
At the same time, the policy makers are also very interested in the discussion of the potential development of palm oil productivity. According to their opinion on both stakeholder consultations, Indonesia can pursue the current productivity of Malaysia, but to achieve a higher value may be difficult. However, the policy makers quite agree with the findings of existing literature study in which the results of the intensive management of oil palm plantations can achieve an increase of more than 100% as compared to the current value. Therefore, the level of productivity of the level 4 will be considered as the best possible scenario where the national average productivity of Indonesian palm oil reached 8 tonnes / ha.
For the above-ground carbon content (AGC), the average value proposed by BAPPENAS (2015) is used which equal to 63 tons / ha. This value is chosen because it is similar to that proposed by other literature such as Agus et al (2013) and Carre et al (2010). As a reference, we can see a comparison with the value of the selected AGC with the AGC value of Agus et al (2013)(Table 2).

Halaman 9 dari 14
Tabel 2. The comparison of the above-ground carbon content (AGC)for palam oil and land cover
(source: Agus et.al ,2013)
Halaman 10 dari 14
4. Methodology By considering the ease of use and user-friendliness, the emissions of palm oil sector is calculated based on the enhancement of carbon content as expressed in the following equation
𝐸 = 𝐴 × 𝐴𝐺𝐶
Where,
E = Emissions (in tons CO2eq) A = Area (in acres or hectares) AGC = Above ground carbon content (in tonnes CO2eq per hectare)
Based on the above mentioned background and assumptions, the modeling of the oil palm sector in I2050PC is divided into two levers: first is for the land area and second is for the productivity. Although the emissions from palm oil sector will be determined only by land area lever, productivity lever will also be presented to the user. This is to accommodate users who want a trajectory of minimum land area but with increasing production of palm oil. This scenario can be realized through the role of productivity lever. The modelling of these two levers are as follows:
Area of Palm Oil Plantation
Level 1
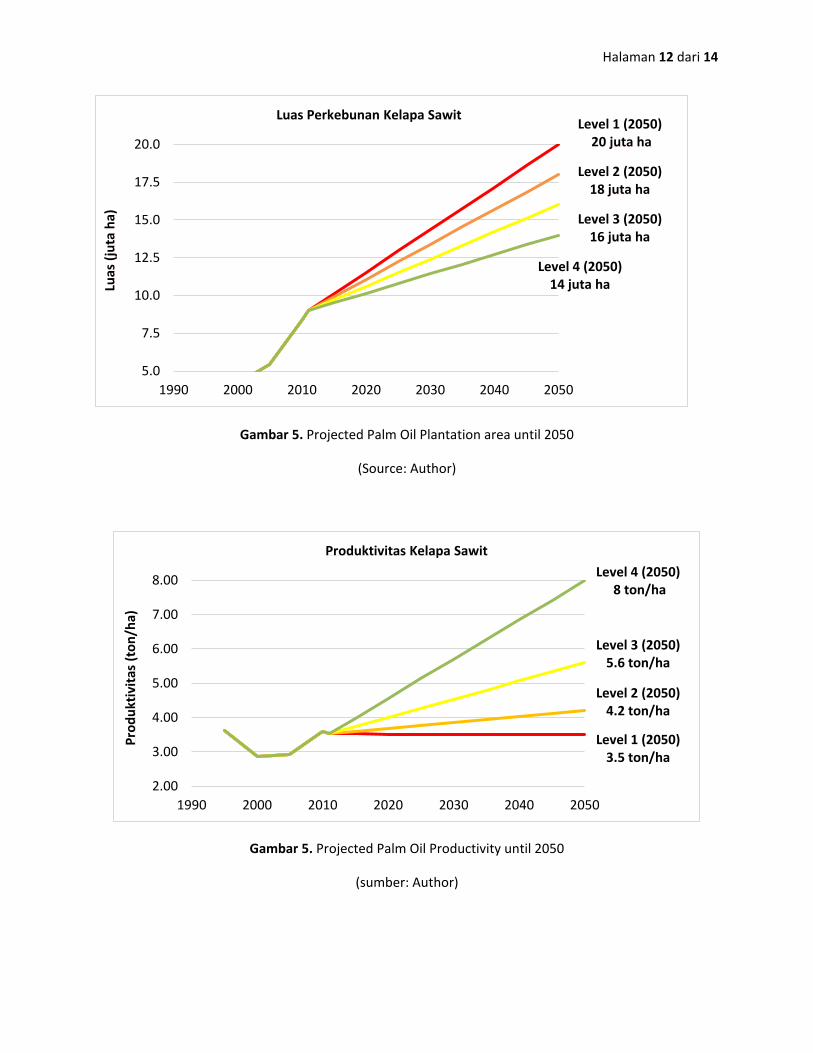
Level 1 assumes that palm oil plantations to grow to 20 million ha in 2050. While it may sound very large, it is most likely to occur if the rate of growth of oil palm plantations in the last two decades continued to increase until 2050.
Level 2
Level 2 assumes that palm oil plantations increased to reach 18 million hectares by 2050. This is due to the international and national influencing factors. International influencing factor is the decreasing growth of global demand while national factor is the implementation of national policies such as incentives for intensification of oil palm productivity or the limitation of new forest clearing.
level 3 Level 3 assumes that palm oil plantations increased up to 16 million ha in 2050. This can be achieved if the policies of the new land clearing are completely tightened together with the explicit requirement of rejuvenation rotation for all palm oil plantations.
Halaman 11 dari 14
Level 4 Level 4 assumes that palm oil plantations are only increased up to 14 million hectares by 2050. This can be achieved if the regulatory of the land clearance is really tightened, programs FMU (Forest Management Unit) is strengthened, as well as the policies and support for replanting which evenly distributed Palm Oil Productivity Level 1
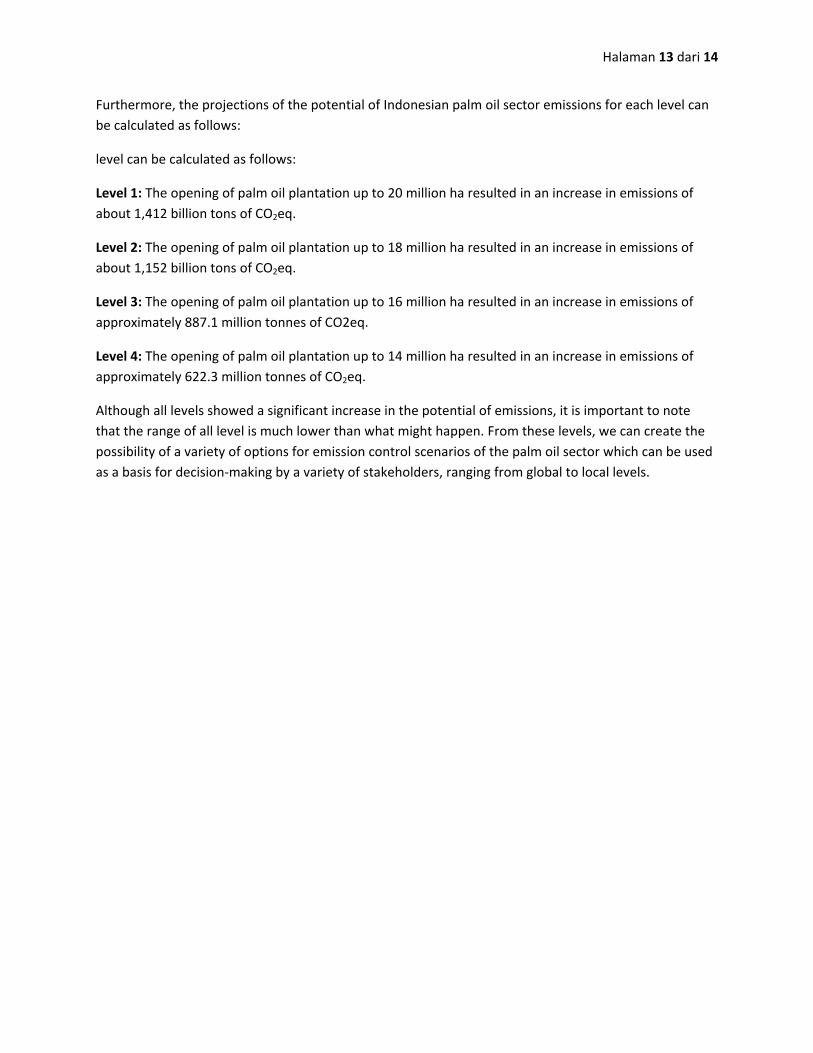
Level 1 assumes that the productivity of palm oil plantations in 2050 was equal to the base year 2011 of 3.5 tonnes / ha. This can be happened if the oil palm plantation management at the national level do not improve significantly. Without any policies to encourage, national palm oil productivity will not change much.
Level 2
Level 2 assumes that the productivity of palm oil plantations has increased up to 4.2 tonnes / ha in 2050. This can be achieved through a number of policies that support the improvement of smallholders management such as counselling and assistance for rejuvenation.
Level 3 Level 3 assumes that the productivity of palm oil plantations has reached 5.6 tons / ha in 2050. This can be achieved through the government support for the palm oil sector such as incentives and assistance for PR and PBN rejuvenation.
Level 4 Level 4 assumes an increase in the productivity of oil palm plantations in 2050 up to 8 tons / ha by providing greater assistance to PR and PBN and support for better transport infrastructure and processing of Fresh Fruit Bunches (FFB).
5. Results By using the above methodology, the modeling result of the projections of palm oil plantations area and the productivity of Indonesian palm oil by 2050 are presented in Figure 5 and 6
Halaman 12 dari 14
Gambar 5. Projected Palm Oil Plantation area until 2050
(Source: Author)
Gambar 5. Projected Palm Oil Productivity until 2050
(sumber: Author)
Level 1 (2050) 20 juta ha
Level 2 (2050) 18 juta ha
Level 3 (2050) 16 juta ha
Level 4 (2050) 14 juta ha
5.0
7.5
10.0
12.5
15.0
17.5
20.0
1990 2000 2010 2020 2030 2040 2050
Luas
(jut
a ha
) Luas Perkebunan Kelapa Sawit
Level 1 (2050) 3.5 ton/ha
Level 2 (2050) 4.2 ton/ha
Level 3 (2050) 5.6 ton/ha
Level 4 (2050) 8 ton/ha
2.00
3.00
4.00
5.00
6.00
7.00
8.00
1990 2000 2010 2020 2030 2040 2050
Prod
uktiv
itas
(ton
/ha)
Produktivitas Kelapa Sawit
Halaman 13 dari 14
Furthermore, the projections of the potential of Indonesian palm oil sector emissions for each level can be calculated as follows:
level can be calculated as follows:
Level 1: The opening of palm oil plantation up to 20 million ha resulted in an increase in emissions of about 1,412 billion tons of CO2eq.
Level 2: The opening of palm oil plantation up to 18 million ha resulted in an increase in emissions of about 1,152 billion tons of CO2eq.
Level 3: The opening of palm oil plantation up to 16 million ha resulted in an increase in emissions of approximately 887.1 million tonnes of CO2eq.
Level 4: The opening of palm oil plantation up to 14 million ha resulted in an increase in emissions of approximately 622.3 million tonnes of CO2eq.
Although all levels showed a significant increase in the potential of emissions, it is important to note that the range of all level is much lower than what might happen. From these levels, we can create the possibility of a variety of options for emission control scenarios of the palm oil sector which can be used as a basis for decision-making by a variety of stakeholders, ranging from global to local levels.
Halaman 14 dari 14
6. References
Agus, F, Henson, IE, Sahardjo, BH, Haris, N, van Noordwijk, M & Killeen, TJ 2013, “Review of Emission Factors for Assessment of CO2 Emission From Land Use Change to Oil Palm in Southeast Asia”, Reports from the Technical Panels of the 2nd Greenhouse Gas Working Group of the Roundtable on Sustainable Palm Oil, hal. 7-28.
BAPPENAS (Kementerian Perencanaan Pembangunan Nasional) 2015, “Pembentukan BAU Baseline Bidang Berbasis Lahan”, Sekretariat RAN-GRK, diunduh 30 Maret 2015, <http://www.sekretariat-rangrk.org/english/home/9-uncategorised/173-baulahan>.
Carre, F, Hiederer, R, Blujdea, V & Koeble, R 2010, Background Guide for the Calculation of Land Carbon Stocks in the Biofuels Sustainability Scheme – Drawing on the 2006 IPCC Guidelines for National Greenhouse Gas Inventories, Office for Official Publications of the European Communities, Luxembourg.
Kongsager, R & Reenberg, A 2012, Contemporary land-use transitions: The global oil palm expansion, GLP Report No. 4, GLP-IPO, Copenhagen.
PUSDATIN (Pusat Data dan Sistem Informasi Pertanian) 2013, “Kelapa Sawit”, Informasi Ringkas Komoditas Perkebunan, No. 01/01/I, 7 Januari 2013, diunduh 28 Januari 2015, <http://pusdatin.setjen.pertanian.go.id/tinymcpuk/gambar/file/A1_Jan_Klp_Sawit.pdf>.
Wicke, B, Sikkema, R, Dornbug, V & Faaij, A 2011, “Exploring land use changes and the role of palm oil production in Indonesia and Malaysia”, Land Use Policy, no. 28, hal. 193-206.
World Growth 2011, The Economic Benefit of Palm Oil to Indonesia, World Growth, Arlington.