Usefulness of corpotate annual report: Empirical study
41
WELCOME
-
Upload
pip-freixas -
Category
Business
-
view
48 -
download
1
Transcript of Usefulness of corpotate annual report: Empirical study

WELCOME

A Study on
Usefulness of Corporate Annual
Reports in Bangladesh

Corporate Annual Reports
Corporate annual report provided to investors is the major source that provides information on the effectiveness of the accomplishments of managers in meeting their fiduciary duties and carrying out their stewardship functions.
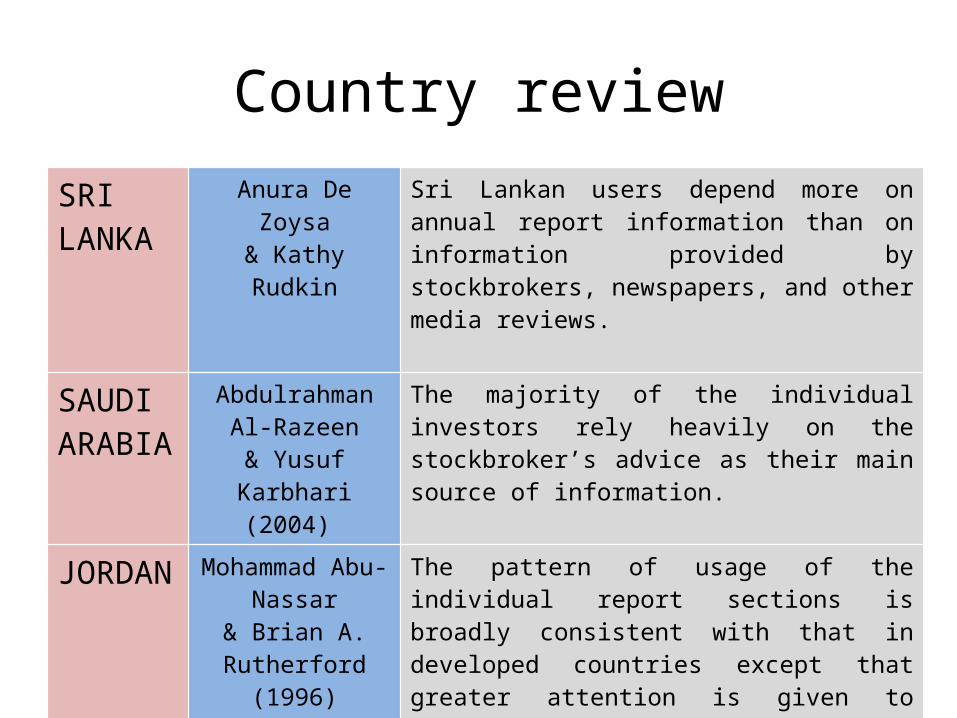
Country reviewSRI LANKA
Anura De Zoysa& Kathy Rudkin
Sri Lankan users depend more on annual report information than on information provided by stockbrokers, newspapers, and other media reviews.
SAUDI ARABIA
Abdulrahman Al-Razeen
& Yusuf Karbhari(2004)
The majority of the individual investors rely heavily on the stockbroker’s advice as their main source of information.
JORDAN Mohammad Abu-Nassar
& Brian A. Rutherford
(1996)
The pattern of usage of the individual report sections is broadly consistent with that in developed countries except that greater attention is given to auditors’ reports.

KUWAIT Kamal Naser, Rana Nuseibeh &Ahmed Al-Hussaini(2003)
The users mainly rely mainly on the information made directly available by the company
AUSTRALIA John K. Courtis(1982)
The users mainly depend on the stockbroker’s advice and ranked the importance of annual reports as 3rd.
QATAR Jalal M. Alattar &Khalid Al-Khater(2007)
The users consider annual reports to be very important and to be the main source of information for investment decision.

Survey Response
User Group Approached Responded Response Percentage (%)
Investors 44 27 61
Stockbrokers 8 6 75
Total 52 33 63
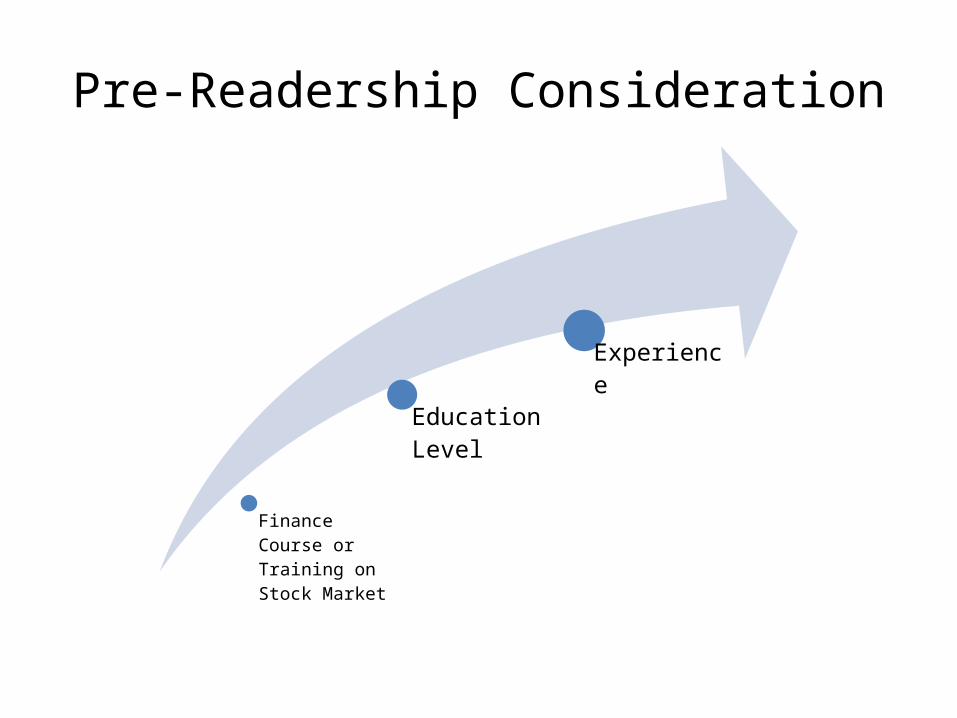
Pre-Readership Consideration
Finance Course or Training on Stock Market
Education Level
Experience

Financial Courses
17%
83%
Stock Brokers
YesNo
48%52%
Shareholders
YesNo
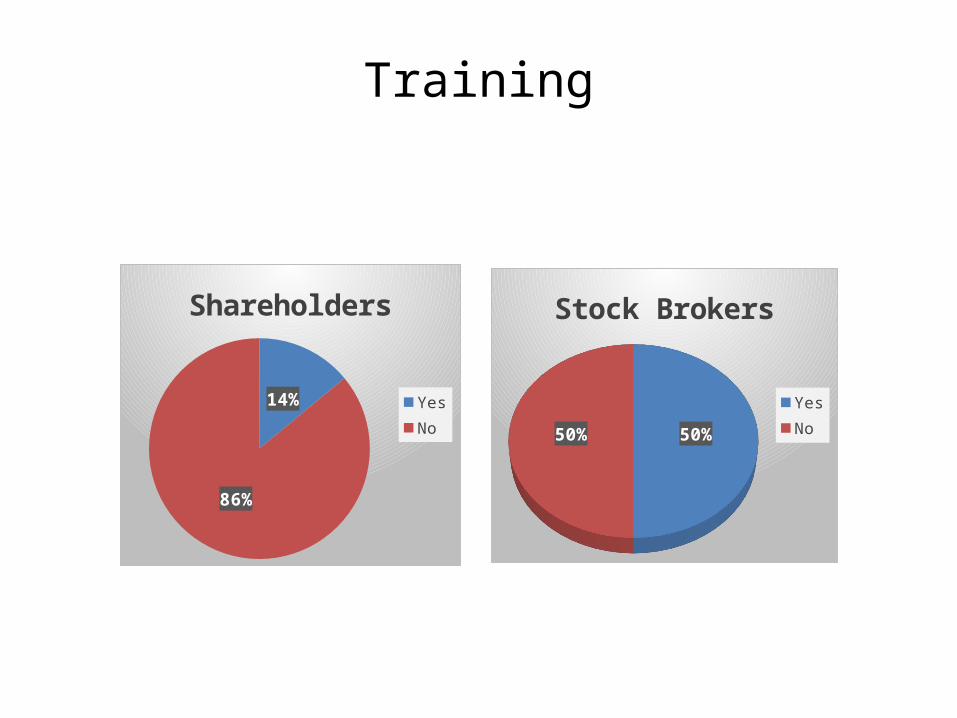
Training
50%50%
Stock Brokers
YesNo
14%
86%
Shareholders
YesNo

Education
33%
67%
Stock Brokers
Graduate/Postgraduate of BusinessGraduate/Postgraduate of Others
52%48%
Shareholders
Graduate/Postgraduate of BusinessGraduate/Postgraduate of Others
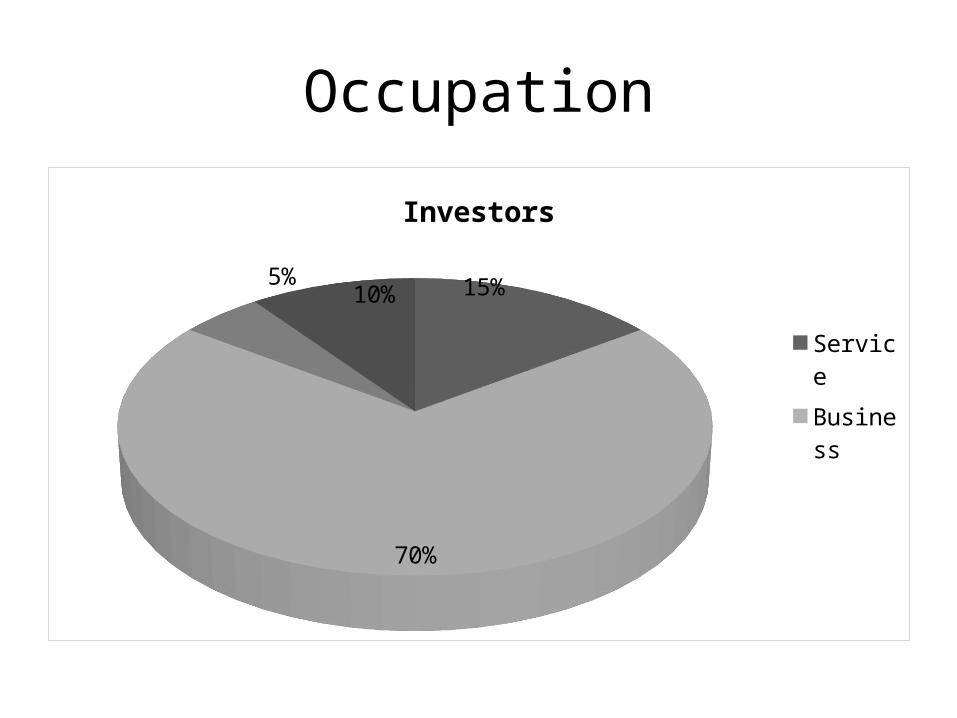
Occupation
15%
70%
5%10%
Investors
ServiceBusinessStudentOthers

Trading Experience
67%17%
16%
Stock Brokers
1-5 years6-10 years11-20 years48%
38%
14%
Shareholders
1-5 years6-10 years11-20 years

Reading between Numbers

Reading Annual Reports
40%
20%
20%
20%
Stock Brokers
AlwaysUsuallySometimesRarelyNever
11%
36%39%
14%
Shareholders
AlwaysUsuallySometimesRarelyNever

Importance of Sources of Information

Investors
Sources of information
Mean value
Standard Deviation
Mean difference
t - statistic Sig. (2-tailed)
Null Hypothesis
Broker_advice 3.14 1.457 .138 .510 .614 Accepted
FnF_advice2.93 1.280 -.069 -.290 .774
Accepted
Annual_report4.14 .915 1.138 6.696 .000
Accepted
Interim_report3.86 .915 .862 5.073 .000
Accepted
Communication_mgt3.17 1.311 .172 .708 .485
Accepted
Media_report3.21 1.424 .207 .783 .440
Accepted
Ho: µ ≥ 3 (Source of information is perceived as at least moderately important)H1: µ < 3 (Source of information is perceived as less than moderately important)

Sources of information
Mean value
Standard Deviation
Mean difference
t - statistic Sig. (2-tailed)
Null Hypothesis
Publication_DSE_BSEC3.24 1.455 .241 .893 .379
Accepted
Technical_analysis2.76 1.405 -.241 -.925 .363
Accepted
Info_internet2.83 1.391 -.172 -.668 .510
Accepted
Rumors1.90 1.319 -1.103 -4.506 .000
Rejected
Ho: µ ≥ 3 (Source of information is perceived as at least moderately important)H1: µ < 3 (Source of information is perceived as less than moderately important)
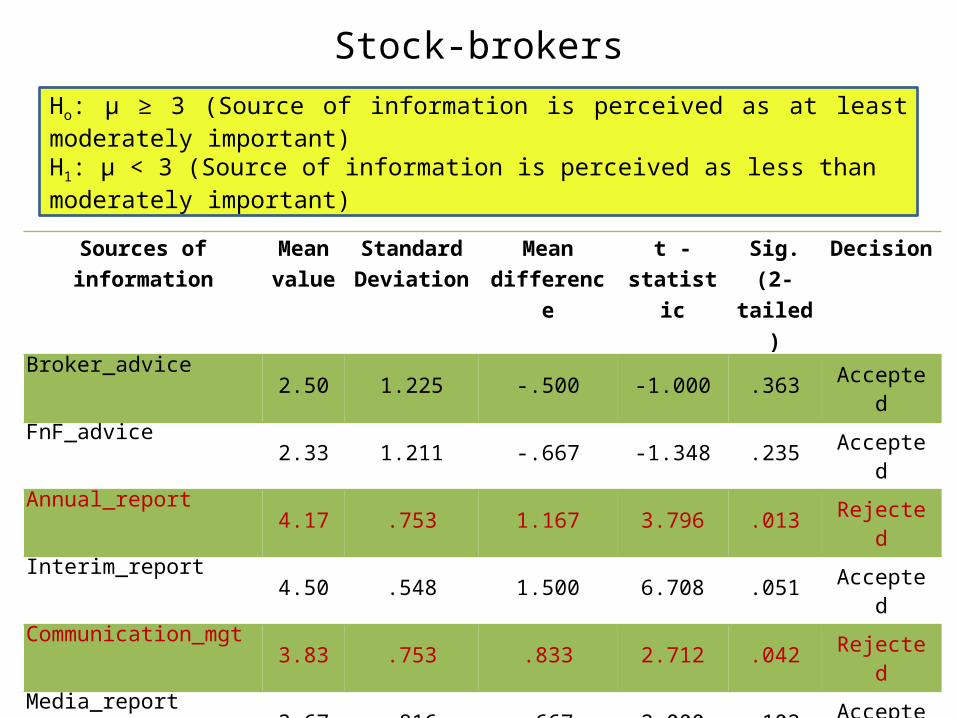
Stock-brokers
Sources of information Mean value
Standard Deviation
Mean difference
t - statistic Sig. (2-tailed)
Decision
Broker_advice 2.50 1.225 -.500 -1.000 .363 Accepted
FnF_advice 2.33 1.211 -.667 -1.348 .235 Accepted
Annual_report 4.17 .753 1.167 3.796 .013 Rejected
Interim_report 4.50 .548 1.500 6.708 .051 Accepted
Communication_mgt 3.83 .753 .833 2.712 .042 Rejected
Media_report 3.67 .816 .667 2.000 .102 Accepted
Publication_DSE_BSEC 3.83 .753 .833 2.712 .042 Rejected
Technical_analysis 3.83 .753 .833 2.712 .042 Rejected
Info_internet 2.00 1.549 -1.000 -1.581 .175 Accepted
Rumors 1.17 .408 -1.833 -11.000 .000 Rejected
Ho: µ ≥ 3 (Source of information is perceived as at least moderately important)H1: µ < 3 (Source of information is perceived as less than moderately important)
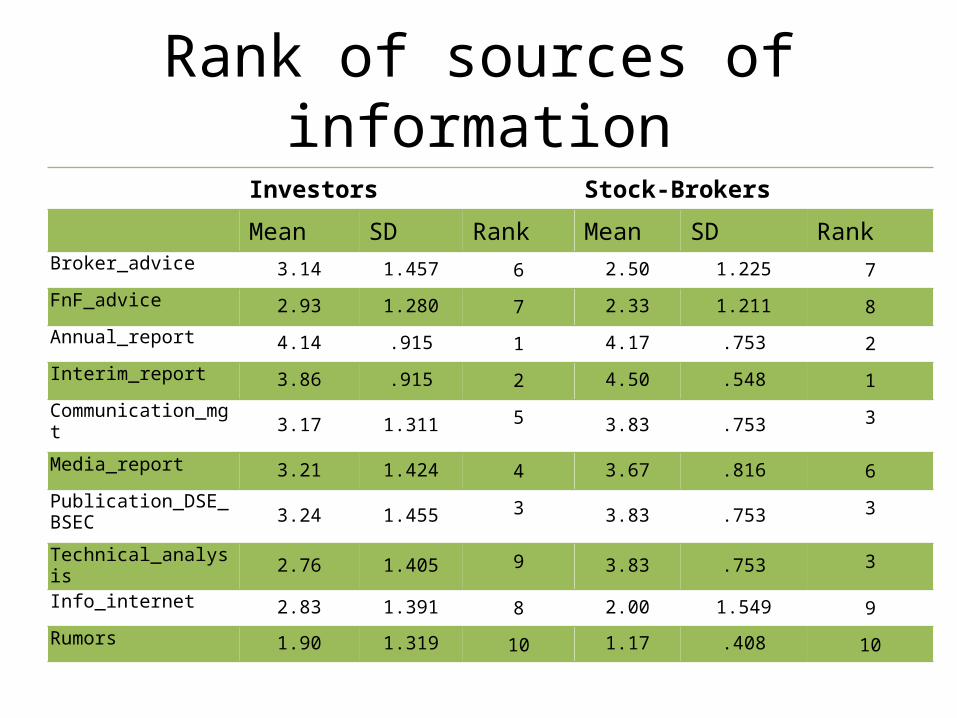
Rank of sources of information
Investors Stock-BrokersMean SD Rank Mean SD Rank
Broker_advice 3.14 1.457 6 2.50 1.225 7
FnF_advice 2.93 1.280 7 2.33 1.211 8
Annual_report 4.14 .915 1 4.17 .753 2
Interim_report 3.86 .915 2 4.50 .548 1
Communication_mgt3.17 1.311
53.83 .753
3
Media_report 3.21 1.424 4 3.67 .816 6
Publication_DSE_BSEC3.24 1.455
33.83 .753
3
Technical_analysis 2.76 1.405 9 3.83 .753 3
Info_internet 2.83 1.391 8 2.00 1.549 9
Rumors 1.90 1.319 10 1.17 .408 10
How important the annual report contents
are?
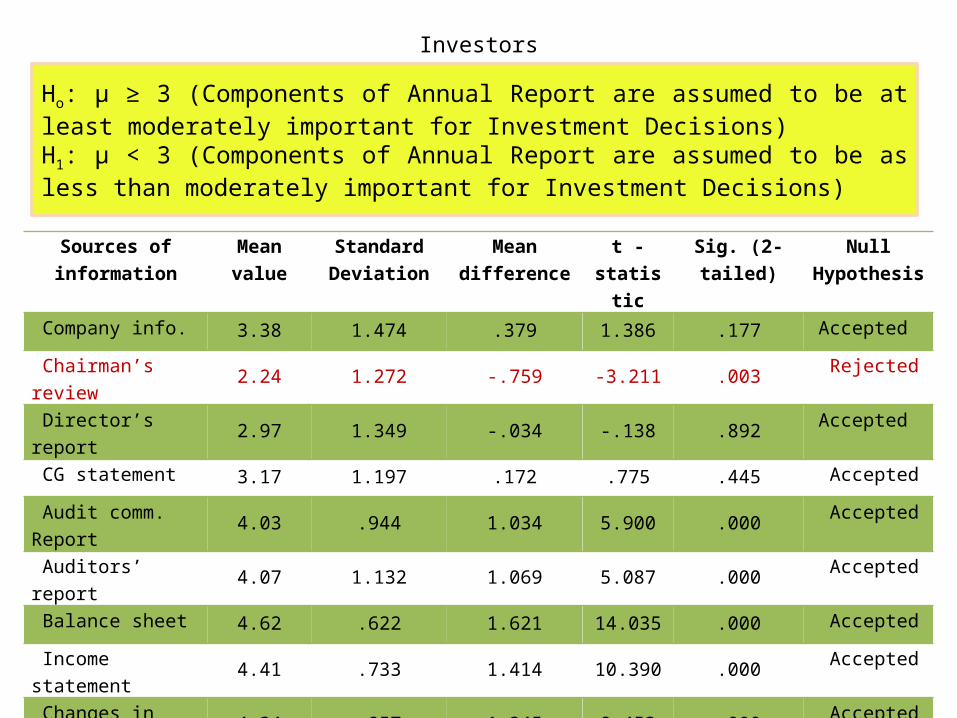
Investors
Sources of information
Mean value
Standard Deviation
Mean difference
t -statistic Sig. (2-tailed) Null Hypothesis
Company info. 3.38 1.474 .379 1.386 .177 Accepted
Chairman’s review 2.24 1.272 -.759 -3.211 .003 Rejected
Director’s report 2.97 1.349 -.034 -.138 .892 Accepted
CG statement 3.17 1.197 .172 .775 .445 Accepted
Audit comm. Report 4.03 .944 1.034 5.900 .000 Accepted
Auditors’ report 4.07 1.132 1.069 5.087 .000 Accepted
Balance sheet 4.62 .622 1.621 14.035 .000 Accepted
Income statement 4.41 .733 1.414 10.390 .000 Accepted
Changes in equity 4.34 .857 1.345 8.453 .000 Accepted
Cash flow state. 3.97 1.267 .966 4.103 .000 Accepted
Acc. Policy notes 3.59 1.119 .586 2.822 .009 Accepted
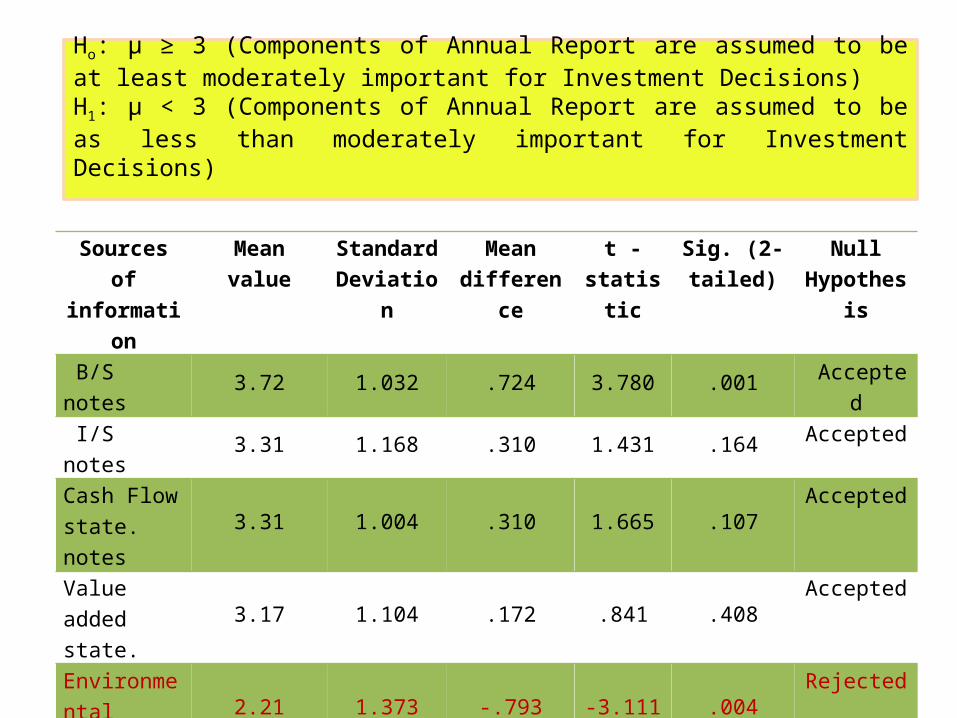
Ho: µ ≥ 3 (Components of Annual Report are assumed to be at least moderately important for Investment Decisions)H1: µ < 3 (Components of Annual Report are assumed to be as less than moderately important for Investment Decisions)
Sources of information
Mean value Standard Deviation
Mean difference
t -statistic
Sig. (2-tailed)
Null Hypothesis
B/S notes 3.72 1.032 .724 3.780 .001 Accepted
I/S notes 3.31 1.168 .310 1.431 .164 Accepted
Cash Flow state. notes 3.31 1.004 .310 1.665 .107 Accepted
Value added state. 3.17 1.104 .172 .841 .408 Accepted
Environmental reports 2.21 1.373 -.793 -3.111 .004 Rejected
Reviews 4.17 .928 1.172 6.800 .000 Accepted
Essay 2.72 1.131 -.276 -1.314 .200 Accepted
Ho: µ ≥ 3 (Components of Annual Report are assumed to be at least moderately important for Investment Decisions)H1: µ < 3 (Components of Annual Report are assumed to be as less than moderately important for Investment Decisions)

Components of Annual report
Mean value
Standard Deviation
Mean difference
t - statistic Sig. (2-tailed) Decision
Company info. 4.00 1.265 1.000 1.936 .111 Accepted
Chairman’s review 4.17 1.329 1.167 2.150 .084 Accepted
Director’s report 3.83 1.329 .833 1.536 .185 Accepted
CG statement 4.17 .983 1.167 2.907 .034 Rejected
Audit comm. Report4.33 .816 1.333 4.000 .010 Rejected
Auditors’ report 4.50 .548 1.500 6.708 .001 Rejected
Balance sheet 4.83 .408 1.833 11.000 .000 Accepted
Income statement 4.67 .516 1.667 7.906 .001 Rejected
Changes in equity 4.33 .816 1.333 4.000 .010 Rejected
Cash flow state. 4.17 .753 1.167 3.796 .013 Rejected
Stock-Brokers
Ho: µ ≥ 3 (Components of Annual Report are assumed to be at least moderately important for Investment Decisions)H1: µ < 3 (Components of Annual Report are assumed to be as less than moderately important for Investment Decisions)
Components of Annual report
Mean value
Standard Deviation
Mean difference
t - statistic Sig. (2-tailed) Decision
Acc. Policy notes 3.50 .837 .500 1.464 .203 Accepted
B/S notes 3.83 1.329 .833 1.536 .185 Accepted
I/S notes 3.67 1.506 .667 1.085 .328 Accepted
Cash Flow state. notes 3.33 1.633 .333 .500 .638
Accepted
Value added state. 3.50 1.517 .500 .808 .456 Accepted
Environmental reports 3.33 1.366 .333 .598 .576
Accepted
Reviews 4.00 .894 1.000 2.739 .041 Rejected
Essay 3.17 1.169 .167 .349 .741 Accepted
Stock-brokers
Ho: µ ≥ 3 (Components of Annual Report are assumed to be at least moderately important for Investment Decisions)H1: µ < 3 (Components of Annual Report are assumed to be as less than moderately important for Investment Decisions)

Thoroughness
Investors
Sources of information
Mean value Standard Deviation
Mean difference
t -statistic Sig. (2-tailed) Null Hypothesis
Company info.2.21 1.114 -.793 -3.833 .001
Rejected
Chairman’s review2.69 1.137 -.310 -1.470 .153
Accepted
Director’s report2.69 1.257 -.310 -1.330 .194
Accepted
CG statement3.86 1.217 .862 3.816 .001
Rejected
Audit comm. Report 3.83 1.197 .828 3.722 .001
Rejected
Auditors’ report4.21 1.013 1.207 6.413 .000
Accepted
Balance sheet3.97 .981 .966 5.298 .000
Accepted
Income statement3.79 1.114 .793 3.833 .001
Rejected
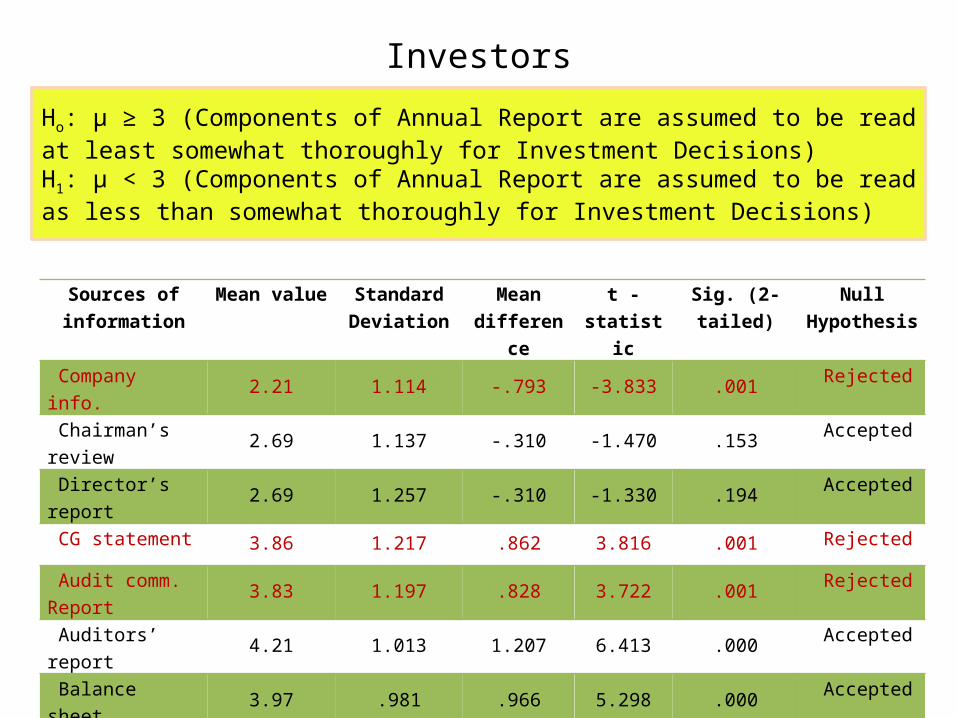
Ho: µ ≥ 3 (Components of Annual Report are assumed to be read at least somewhat thoroughly for Investment Decisions)H1: µ < 3 (Components of Annual Report are assumed to be read as less than somewhat thoroughly for Investment Decisions)

Sources of information
Mean value Standard Deviation
Mean difference
t -statisti
c
Sig. (2-tailed) Decision
Changes in equity 3.52 1.153 .517 2.415 .023 Accepted
Cash flow state. 3.34 1.111 .345 1.672 .106 Accepted
Acc. Policy notes 3.59 1.119 .586 2.822 .009 Accepted
B/S notes 3.14 1.246 .138 .596 .556 Accepted
I/S notes 2.9310 1.03272 -.06897 -.360 .722 Accepted
Cash Flow state. notes 2.9310 1.25160 -.06897 -.297 .769 Accepted
Value added state. 2.0345 1.20957 -.96552 -4.299 .000 Accepted
Environmental reports 3.6897 1.31213 .68966 2.830 .009 Rejected
Reviews 2.5172 1.27113 -.48276 -2.045 .050 Rejected
Essay 2.84. 1.23970. -.160 -.1291 .030 Rejected
Ho: µ ≥ 3 (Components of Annual Report are assumed to be read at least somewhat thoroughly for Investment Decisions)H1: µ < 3 (Components of Annual Report are assumed to be read as less than somewhat thoroughly for Investment Decisions)

Components of Annual report
Mean value
Standard Deviation
Mean difference
t - statistic Sig. (2-tailed) Null Hypothesis
Company info. 3.83 1.169 .833 1.746 .141 Accepted
Chairman’s review 3.00 1.265 .000 .000 1.000 Accepted
Director’s report 3.67 .816 .667 2.000 .102 Accepted
CG statement 3.50 .837 .500 1.464 .203 Accepted
Audit comm. Report4.33 .816 1.333 4.000 .010
Rejected
Auditors’ report 4.33 1.033 1.333 3.162 .025 Rejected
Balance sheet 4.67 .516 1.667 7.906 .001 Rejected
Income statement 4.50 .548 1.500 6.708 .001 Rejected
Changes in equity 4.33 .816 1.333 4.000 .010 Rejected
Cash flow state. 4.33 .816 1.333 4.000 .010 Rejected
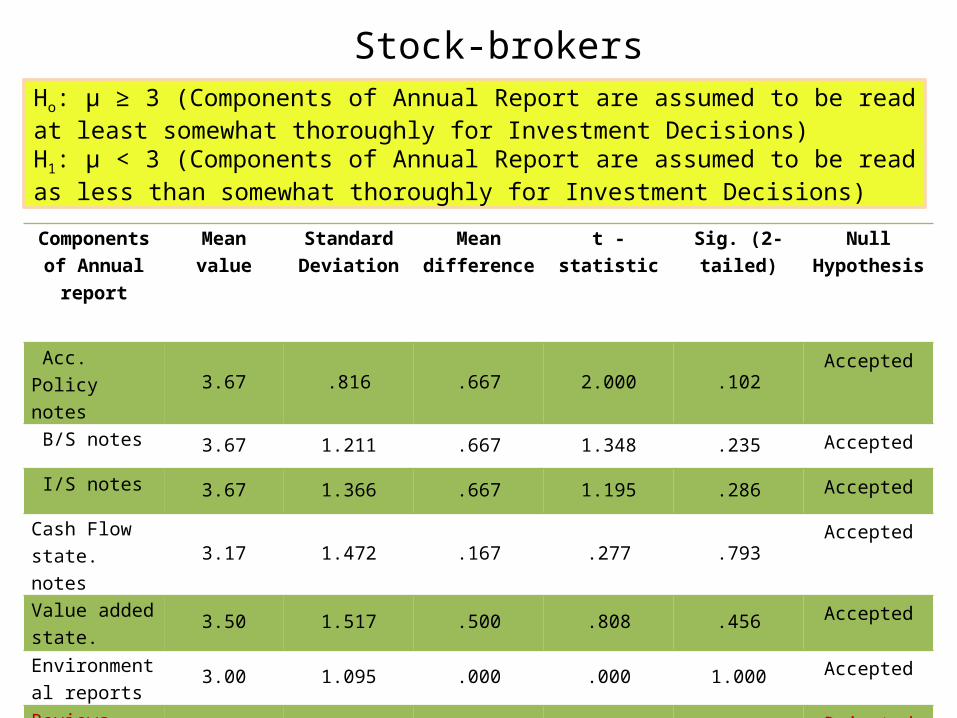
Stock-brokersHo: µ ≥ 3 (Components of Annual Report are assumed to be read at least somewhat thoroughly for Investment Decisions)H1: µ < 3 (Components of Annual Report are assumed to be read as less than somewhat thoroughly for Investment Decisions)
Components of Annual report
Mean value Standard Deviation
Mean difference
t - statistic Sig. (2-tailed) Null Hypothesis
Acc. Policy notes 3.67 .816 .667 2.000 .102 Accepted
B/S notes3.67 1.211 .667 1.348 .235 Accepted
I/S notes3.67 1.366 .667 1.195 .286 Accepted
Cash Flow state. notes 3.17 1.472 .167 .277 .793
Accepted
Value added state. 3.50 1.517 .500 .808 .456
Accepted
Environmental reports 3.00 1.095 .000 .000 1.000
Accepted
Reviews4.17 .983 1.167 2.907 .034 Rejected
Essay3.33 1.366 .333 .598 .576 Accepted
Stock-brokersHo: µ ≥ 3 (Components of Annual Report are assumed to be read at least somewhat thoroughly for Investment Decisions)H1: µ < 3 (Components of Annual Report are assumed to be read as less than somewhat thoroughly for Investment Decisions)

Importance
Thoroughness

Investors
Correlation T-statistic Sig. (2 tailed) Null Hypothesis Company info. .779 2.451 .021 Rejected
Chairman’s review .694 .197 .846 Accepted Director’s report .714 1.548 .133 Accepted CG statement .630 2.461 .020 Rejected Audit comm. Report .719 1.095 .283 Accepted
Auditors’ report .773 1.653 .109 Accepted Balance sheet .469 2.457 .020 Rejected Income statement .666 3.279 .003 Rejected Changes in equity .676 3.591 .001 Rejected
Ho : µ1=µ2 (Degree of thoroughness and degree of importance of components of annual report are equal. )H1: µ1≠µ2 (Degree of thoroughness and degree of importance of components of annual report are not the equal.)

Correlation T-statistic Sig. (2 tailed) Null Hypothesis
Cash flow state. .648 2.365 .025 Rejected Acc. Policy notes .550 1.229 .229 Accepted B/S notes .702 .891 .380 Accepted I/S notes .706 1.000 .326 AcceptedCash Flow state. notes
.848 3.638 .001 Rejected
Value added state. .629 1.270 .214 Accepted
Environmental reports
.598 .796 .433 Accepted
Reviews .720 2.853 .008 RejectedEssay .600 1.030 .312 Accepted
Ho : µ1=µ2 (Degree of thoroughness and degree of importance of components of annual report are equal. )H1: µ1≠µ2 (Degree of thoroughness and degree of importance of components of annual report are not the equal.)

Correlation T-statistic Sig. (2 tailed) Null Hypothesis Company info. .947 1.000 .363 Accepted Chairman’s review .250 1.581 .175 Accepted Director’s report .600 -.415 .695 Accepted CG statement .608 1.000 .363 Accepted Audit comm. Report .700 .000 1.000 Accepted Auditors’ report .707 .542 .611 Accepted Balance sheet .632 1.000 .363 Accepted Income statement .707 1.000 .363 Accepted Changes in equity 1.000 Std error of the difference was
zeroRejected
Ho : µ1=µ2 (Degree of thoroughness and degree of importance of components of annual report are equal. )H1: µ1≠µ2 (Degree of thoroughness and degree of importance of components of annual report are not the equal.)
Stock-brokers

Correlation T-statistic Sig. (2 tailed) Null Hypothesis
Cash flow state. .868 -1.000 .363 Accepted Acc. Policy notes .878 1.000 .363 Accepted B/S notes .953 1.000 .363 Accepted I/S notes .907 .000 1.000 AcceptedCash Flow state. notes
.888 .542 .611 Accepted
Value added state.
1.000 Std error of the difference was zero
Rejected
Environmental reports
.802 1.000 .363 Accepted
Reviews .910 -1.000 .363 AcceptedEssay .960 -1.000 .363 Accepted
Ho : µ1=µ2 (Degree of thoroughness and degree of importance of components of annual report are equal. )H1: µ1≠µ2 (Degree of thoroughness and degree of importance of components of annual report are not the equal.)

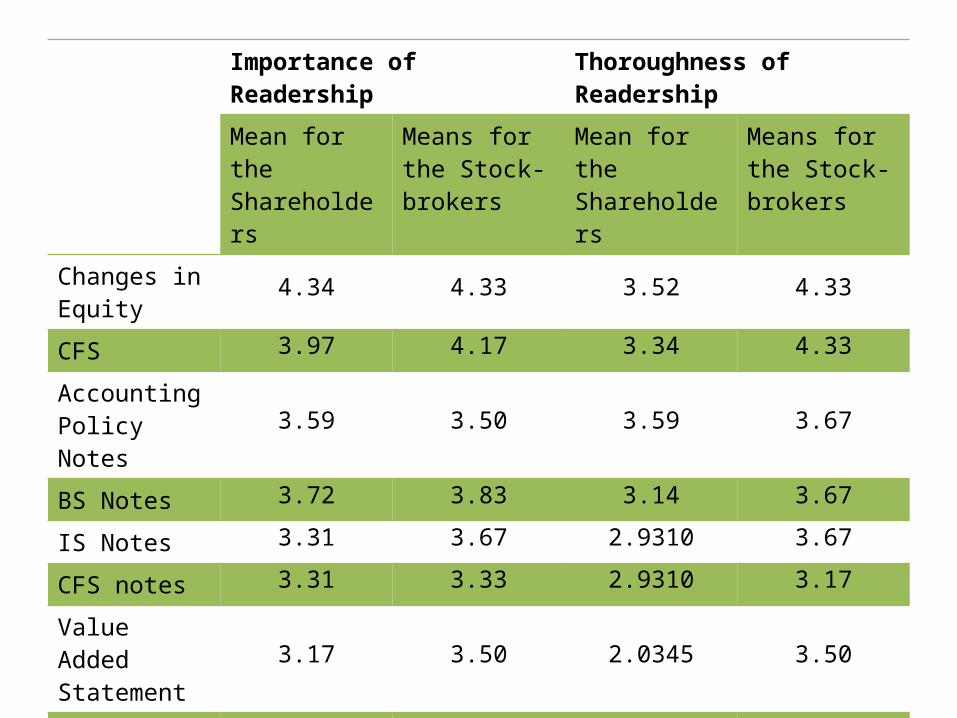
Readership Comparison

Importance of Readership Thoroughness of Readership
Mean for the Shareholders
Means for the Stock-brokers
Mean for the Shareholders
Means for the Stock-brokers
Company info 3.38 4.00 2.21 3.83
Chairman’s Review 2.24 4.17 2.69 3.00
Director’s Report 2.97 3.83 2.69 3.67
CG Statement 3.17 4.17 3.86 3.50
Audit Committee Report
4.03 4.33 3.83 4.33
Auditor’s Report 4.07 4.50 4.21 4.33
BS 4.62 4.83 3.97 4.67
IS 4.41 4.67 3.79 4.50
Importance of Readership Thoroughness of ReadershipMean for the Shareholders
Means for the Stock-brokers
Mean for the Shareholders
Means for the Stock-brokers
Changes in Equity 4.34 4.33 3.52 4.33
CFS 3.97 4.17 3.34 4.33Accounting Policy Notes 3.59 3.50 3.59 3.67
BS Notes 3.72 3.83 3.14 3.67IS Notes 3.31 3.67 2.9310 3.67CFS notes 3.31 3.33 2.9310 3.17Value Added Statement 3.17 3.50 2.0345 3.50
Environmental Report 2.21 3.33 3.6897 3.00
Reviews 4.17 4.00 2.5172 4.17Essays and Pictorial 2.72 3.17 2.84 3.33
Findings
While collecting data, we found the stock-brokers to be more cordial and cooperating than the investors.
Company information though not perceived to be much important by the investors but is somewhat read thoroughly.
Environmental report is neither perceived as important nor read thoroughly. Inferences can be drawn that they are not much concerned about the company's environmental disclosure. Either they don’t have faith in the company reporting or they simply don’t care about the environmental reporting.
Neither the investor nor the brokers considered audit committee report as important.

Findings
• Brokers did not regard Auditors Report as important. Likewise they don’t read them thoroughly .
• Rumors were found to be the least important source of information for both the investors and the brokers.
• Interim reports were found to be perceived more important than annual reports as an important source of information by the brokers .
• Corporate governance was not taken importantly by either parties.

Recommendations
• Organizations should provide more transparent and understandable
financial information through annual report which ultimately lead to
take rational and sound investment decision.
• Awareness should be created among general investors through various
training programs and seminars.
• Efficient efforts should be taken to make the annual report more
reliable to the shareholders.
• Purpose of maximizing shareholders value should be clearly
highlighted in the annual report.