Useful Block Designs for Gage R&R Studies for Measuring Total Analytical Variability Jyh-Ming...
25
Useful Block Designs for Gage R&R Studies for Measuring Total Analytical Variability Jyh-Ming Shoung *, Areti Manola, Yan Shen, Stan Altan *[email protected] Midwest Biopharmaceutical Statistics Workshop May 19, 2015
-
Upload
candice-doyle -
Category
Documents
-
view
216 -
download
1
Transcript of Useful Block Designs for Gage R&R Studies for Measuring Total Analytical Variability Jyh-Ming...

Useful Block Designs for Gage R&R Studies for Measuring Total
Analytical Variability
Jyh-Ming Shoung*, Areti Manola, Yan Shen, Stan Altan
Midwest Biopharmaceutical Statistics WorkshopMay 19, 2015

Outline• Measurement System Analysis – Gage R&R – Design and Outputs– ICH Q2(R1)
• Case Study I – Dissolution • Case Study II – Content Uniformity• Case Study III – In Vitro Release Assay• Summary

Measurement System Analysis – Gage R&R
• Gage R&R design is a well known statistical design embraced by Six Sigma practitioners– Describes quantitatively how a process is performing. – To achieve the designation of a Six Sigma process, it must not produce more than 3.4
defects per million opportunities.
• The typical Gage R&R (Repeatability and Reproducibility) study consists of a factorial type design with blocking used to measure the total variability in a measurement system and its important components. Other designs can be used also, examples shown in the case studies.
• Gage R&R studies have been used for investigating chemical analytical methods for the active pharmaceutical ingredient, uniformity across dosage units and dissolution.
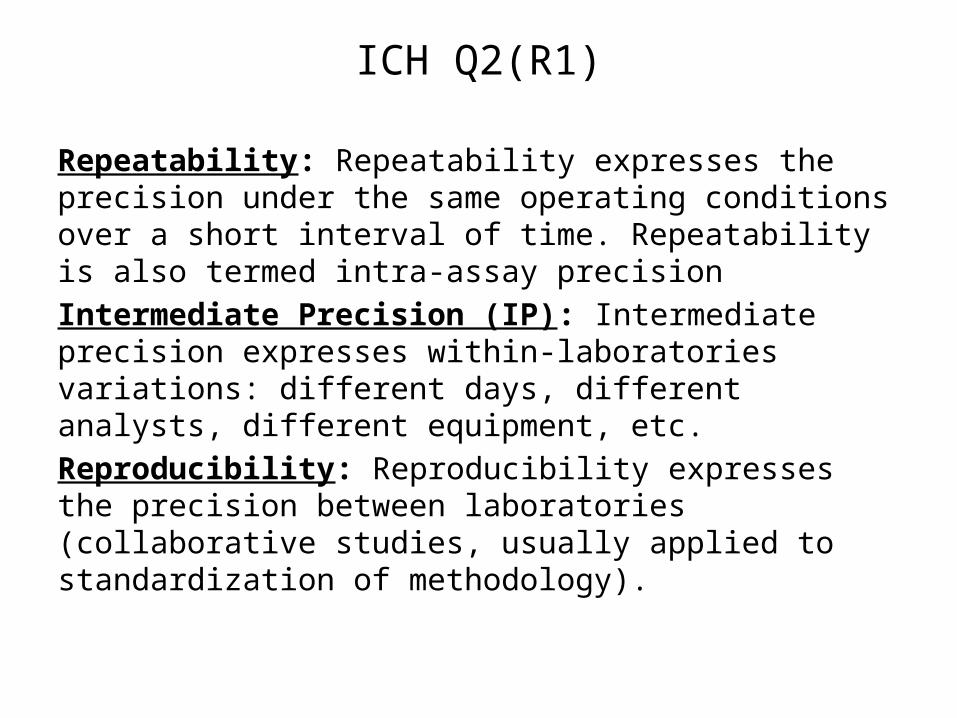
ICH Q2(R1)
Repeatability: Repeatability expresses the precision under the same operating conditions over a short interval of time. Repeatability is also termed intra-assay precisionIntermediate Precision (IP): Intermediate precision expresses within-laboratories variations: different days, different analysts, different equipment, etc.Reproducibility: Reproducibility expresses the precision between laboratories (collaborative studies, usually applied to standardization of methodology).
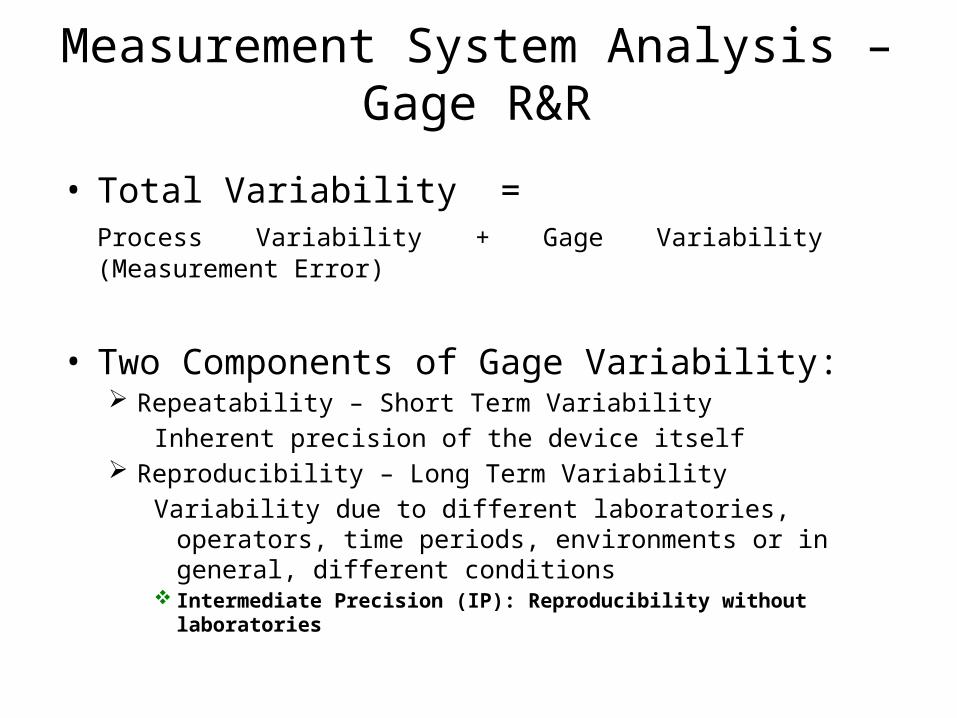
Measurement System Analysis – Gage R&R
• Total Variability = Process Variability + Gage Variability (Measurement Error)
• Two Components of Gage Variability: Repeatability – Short Term Variability
Inherent precision of the device itself Reproducibility – Long Term Variability
Variability due to different laboratories, operators, time periods, environments or in general, different conditions
Intermediate Precision (IP): Reproducibility without laboratories

CASE STUDY I - DISSOLUTION

DoE for Dissolution Test
Day DissRun Analyst App V 1 V 2 V 3 V 4 V 5 V 6 HPLC Run
1
8 2 1B C A - - - 1
- - - B A C 2
10 1 2A B C - - - 2
- - - A C B 1
2
1 1 2A B C - - - 4
- - - A C B 3
9 2 1C A B - - - 3
- - - C B A 4
3
12 1 1B C A - - - 5
- - - B A C 6
3 2 2C A B - - - 6
- - - C B A 5
4
6 2 2B C A - - - 8
- - - B A C 7
4 1 1A B C - - - 7
- - - A C B 8
5
2 1 1B C A - - - 9
- - - B A C 10
5 2 2C A B - - - 10
- - - C B A 9
6
7 2 1A B C - - - 12
- - - A C B 11
11 1 2C A B - - - 11
- - - C B A 12
Design Parameters:1. 3 Batches: A, B, C2. 4 sites/labs: G, I, L, T3. 2 apparatus and 2 analysts per
site• Experiment to be run in 6
days• On each day, each analyst
will carry out 1 dissolution run, total 12 dissolution run per lab/site
• Samples are assigned to 2 HPLC runs according to the table, total 12 HPLC runs per lab/site
Responses: Dissolution measurements at 5, 10, 15, 20, 30, 45, 60 and 90 minutes are collected with analysis focusing on Q time of 30 minutes
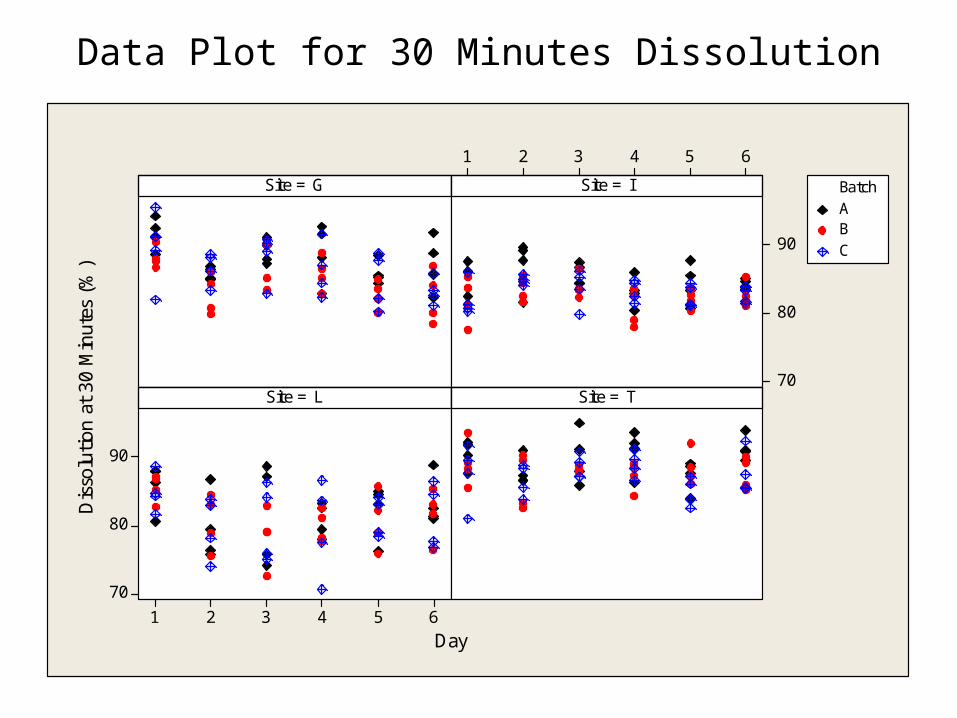
Data Plot for 30 Minutes Dissolution
654321
90
80
70
654321
90
80
70
Site = G
Day
Dis
solu
tion
at 3
0 M
inut
es (
%)
Site = I
Site = L Site = T
ABC
Batch
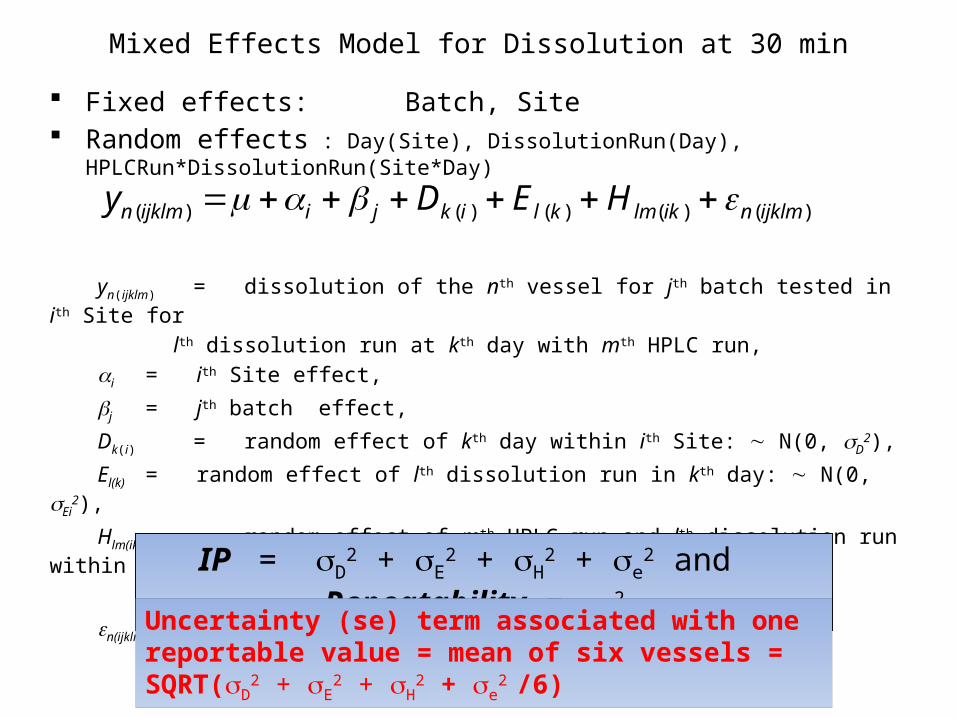
Mixed Effects Model for Dissolution at 30 min Fixed effects: Batch, Site
Random effects : Day(Site), DissolutionRun(Day), HPLCRun*DissolutionRun(Site*Day)
yn(ijklm) = dissolution of the nth vessel for jth batch tested in ith Site for
lth dissolution run at kth day with mth HPLC run,
i = ith Site effect,
j = jth batch effect,
Dk(i) = random effect of kth day within ith Site: N(0, D2),
El(k) = random effect of lth dissolution run in kth day: N(0, Ei2),
Hlm(ik) = random effect of mth HPLC run and lth dissolution run within
the kth day and ith Site N(0, H2),
n(ijklm) = residual error (vessel-to-vessel): N(0, ei2).
)()()()()( ijklmniklmklikjiijklmn HEDy
IP = D2 + E
2 + H2 + e
2 and Repeatability = e2
Uncertainty (se) term associated with one reportable value = mean of six vessels = SQRT(D
2 + E2 + H
2 + e2 /6)
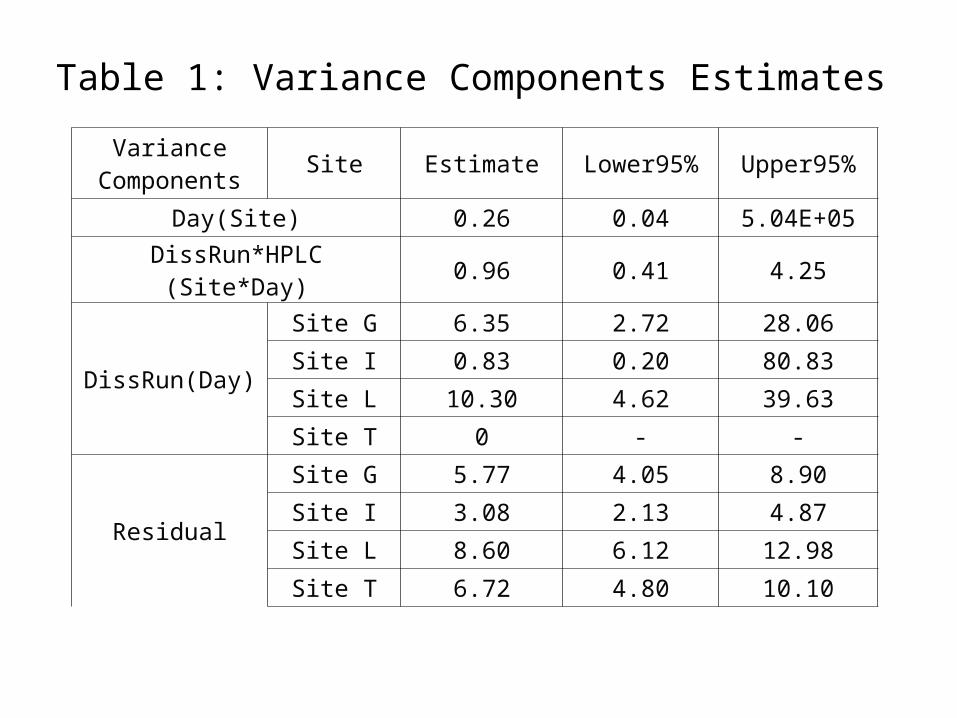
Table 1: Variance Components Estimates
Variance Components Site Estimate Lower95% Upper95%
Day(Site) 0.26 0.04 5.04E+05
DissRun*HPLC(Site*Day) 0.96 0.41 4.25
DissRun(Day)
Site G 6.35 2.72 28.06
Site I 0.83 0.20 80.83
Site L 10.30 4.62 39.63
Site T 0 - -
Residual
Site G 5.77 4.05 8.90
Site I 3.08 2.13 4.87
Site L 8.60 6.12 12.98
Site T 6.72 4.80 10.10
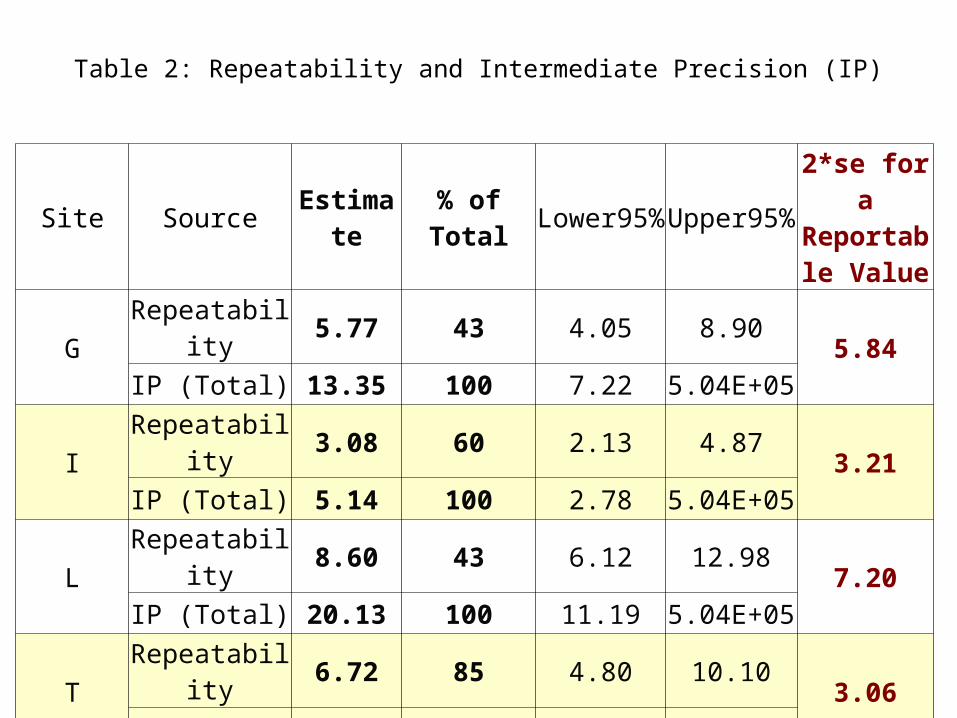
Table 2: Repeatability and Intermediate Precision (IP)
Site Source Estimate % of Total Lower95% Upper95%2*se for a
Reportable Value
GRepeatability 5.77 43 4.05 8.90
5.84IP (Total) 13.35 100 7.22 5.04E+05
IRepeatability 3.08 60 2.13 4.87
3.21IP (Total) 5.14 100 2.78 5.04E+05
LRepeatability 8.60 43 6.12 12.98
7.20IP (Total) 20.13 100 11.19 5.04E+05
TRepeatability 6.72 85 4.80 10.10
3.06IP (Total) 7.95 100 5.25 5.04E+05
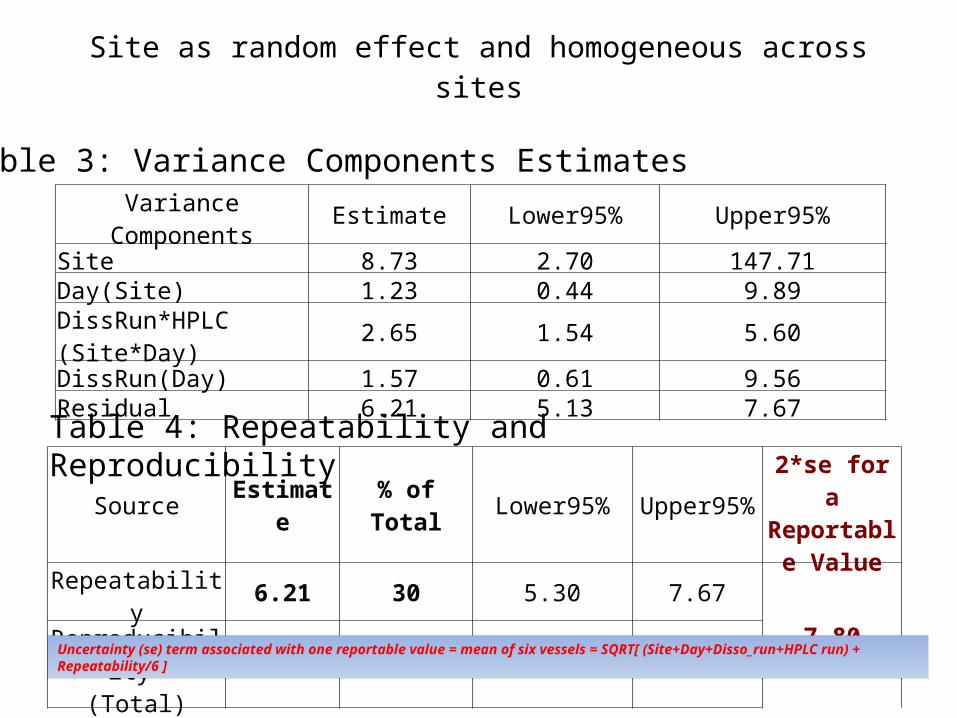
Site as random effect and homogeneous across sites
Table 3: Variance Components Estimates
Table 4: Repeatability and Reproducibility
Variance Components Estimate Lower95% Upper95%Site 8.73 2.70 147.71Day(Site) 1.23 0.44 9.89DissRun*HPLC(Site*Day) 2.65 1.54 5.60
DissRun(Day) 1.57 0.61 9.56Residual 6.21 5.13 7.67
Source Estimate % of Total Lower95% Upper95%2*se for a
Reportable Value
Repeatability 6.21 30 5.30 7.677.80Reproducibility
(Total) 20.39 100 10.42 180.44
Uncertainty (se) term associated with one reportable value = mean of six vessels = SQRT[ (Site+Day+Disso_run+HPLC run) + Repeatability/6 ]

CASE STUDY II – PARTICLE SIZE

14
Design for Laser Diffraction Test Method for Particle Size Site/Lab Analyst Instrument ID
A JL MS-2
B DH MM2
C KCEOP049
EOP224
D LL
PSE002
LD005
M300
• Four laboratories, 4 analysts and 7 instruments
• Six Batches
• Design of Experiments performed by each combination of analyst and instrument within each lab
Batch Batch Info
L1 Target batch
L2 Larger particle size
L3 Smaller particle size
L4 Registration batch at target
L5 100L Target batch
L6 100L Smaller particle size
Batch Day 1 Day 2 Day 3
L1 Syringe 1-2-3-4 Syringe 5-6 /
L2 Syringe 1-2 / Syringe 3-4-5-6
L3 / Syringe 1-2-3-4 Syringe 5-6
L4 Syringe 1-2-3-4 Syringe 5-6 /
L5 Syringe 1-2 / Syringe 3-4-5-6
L6 / Syringe 1-2-3-4 Syringe 5-6
Response: particle size d50 (50% of particle size distribution, m)
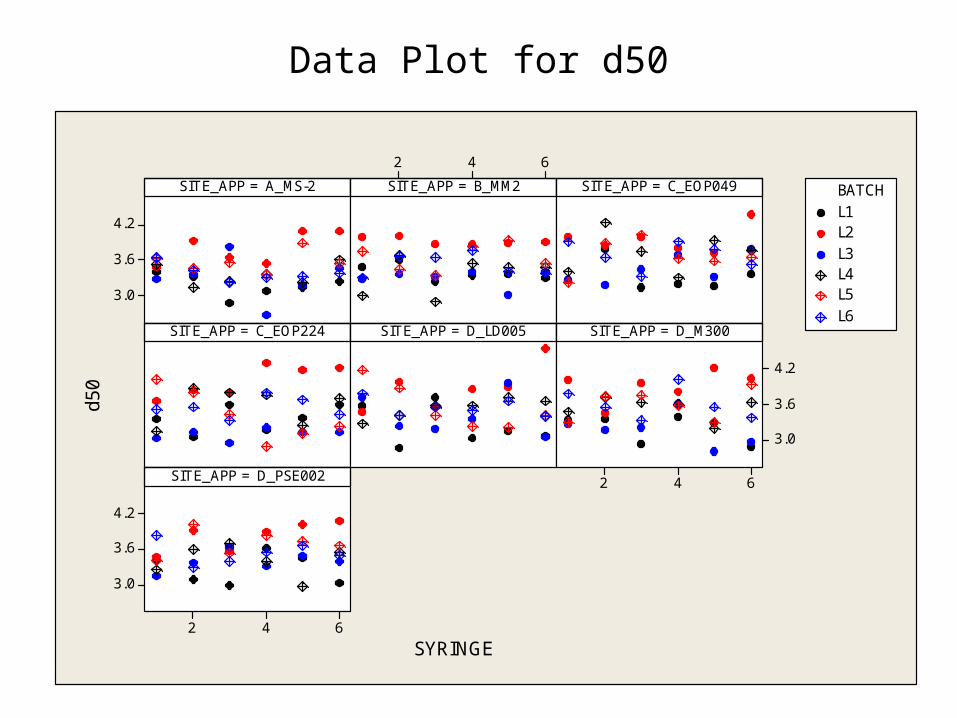
Data Plot for d50
4.2
3.6
3.0
642
642
4.2
3.6
3.0
642
4.2
3.6
3.0
SITE_APP = A_MS-2
SYRINGE
d50
SITE_APP = B_MM2 SITE_APP = C_EOP049
SITE_APP = C_EOP224 SITE_APP = D_LD005 SITE_APP = D_M300
SITE_APP = D_PSE002
L1L2L3L4L5L6
BATCH

Mixed Effects Model for Particle Size d50Site_App - combination of Site-Analyst and Instrument (7 combinations),
Fixed effects : Site_App and Batch
Random effects : Day(Site_App), Day*Batch(Site_App) and residuals.
yl(ijk) = d50 of the lth syringe of jth batch tested by ith Site_App at kth day
i = ith Site_App effect
j = jth batch effect
Dk(i) = random effect of kth day within ith Site_App: N(0, D2)
Ekj(i) = random interaction effect of jth batch by kth day
within ith Site_App: N(0, E2)
l(ijk) = residual errors: N(0, e2).
)()()()( ijklikjikjiijkl EDy
IP = D2 + E
2 + e2 and Repeatability = e
2
Uncertainty (se) term associated with one reportable value = SQRT(D
2 + E2 + e
2 )
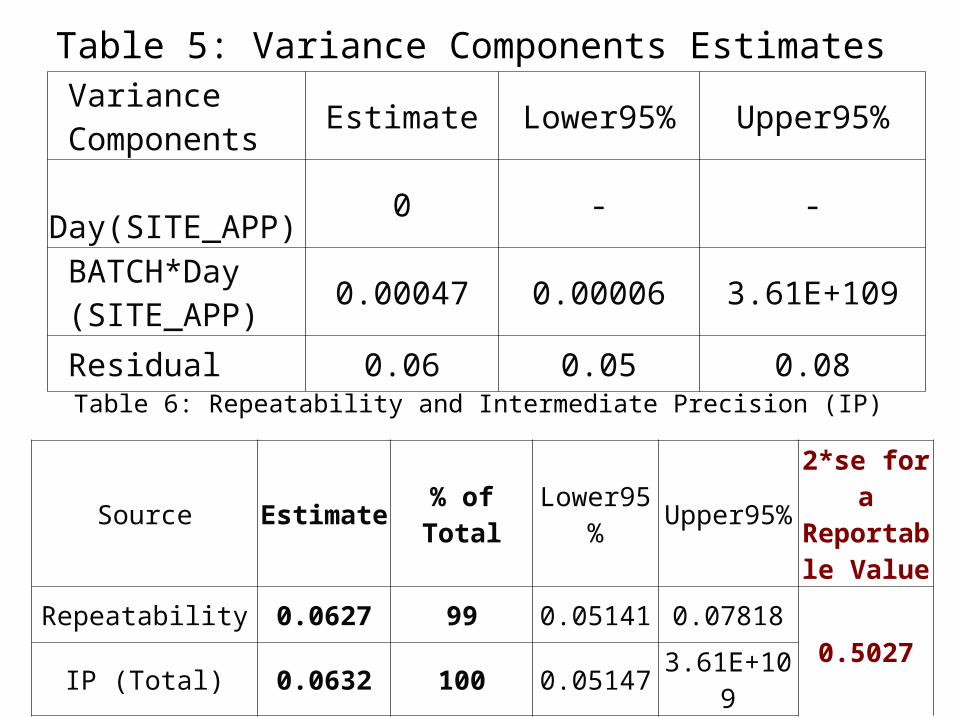
Table 5: Variance Components Estimates Variance Components Estimate Lower95% Upper95%
Day(SITE_APP) 0 - -
BATCH*Day (SITE_APP) 0.00047 0.00006 3.61E+109
Residual 0.06 0.05 0.08
Table 6: Repeatability and Intermediate Precision (IP)
Source Estimate % of Total Lower95% Upper95%2*se for a
Reportable Value
Repeatability 0.0627 99 0.05141 0.078180.5027
IP (Total) 0.0632 100 0.05147 3.61E+109

Site_App as random effect, Site_Apps homogeneous
Table 7: Variance Components Estimates
Table 8: Repeatability and Reproducibility
Uncertainty (se) term associated with one reportable value = SQRT((Reproducibility)
Variance Components Estimate Lower95% Upper95%SITE_APP 0.00185 0.00045 0.19354Day(SITE_APP) 0 - -BATCH*Day(SITE_APP) 0.00037 9.60E-05 8.85E+172Residual 0.06278 0.05149 0.07827
Source Estimate % of Total Lower95% Upper95%2*se for a
Reportable Value
Repeatability 0.063 97 0.05 0.080.51
Reproducibility (Total) 0.065 100 0.05 8.85E+172

CASE STUDY III - BIOASSAY
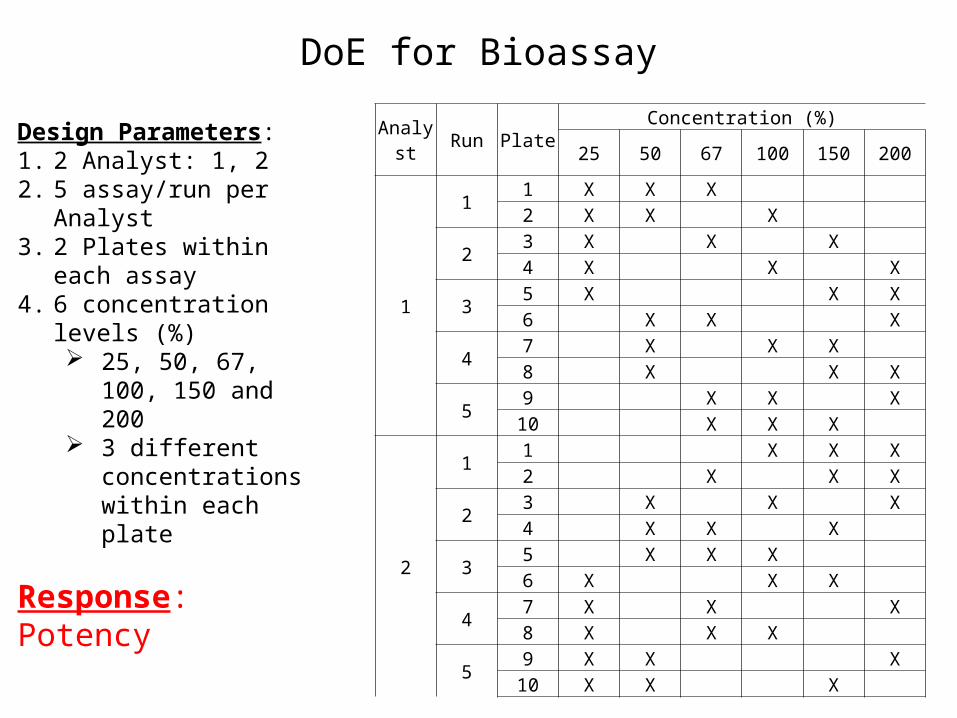
DoE for Bioassay
Design Parameters:1. 2 Analyst: 1, 22. 5 assay/run per Analyst3. 2 Plates within each assay4. 6 concentration levels (%)
25, 50, 67, 100, 150 and 200
3 different concentrations within each plate
Response:Potency
Analyst Run PlateConcentration (%)
25 50 67 100 150 200
1
11 X X X
2 X X X
23 X X X
4 X X X
35 X X X
6 X X X
47 X X X
8 X X X
59 X X X
10 X X X
2
11 X X X
2 X X X
23 X X X
4 X X X
35 X X X
6 X X X
47 X X X
8 X X X
59 X X X
10 X X X

Data Plot for Bioassay
2001000 2001000
120
110
100
90
80
2001000
120
110
100
90
80
2001000 2001000
Analyst = 1, Run = 1
Concentration (%)
% R
ecov
ery
Analyst = 1, Run = 2 Analyst = 1, Run = 3 Analyst = 1, Run = 4 Analyst = 1, Run = 5
Analyst = 2, Run = 1 Analyst = 2, Run = 2 Analyst = 2, Run = 3 Analyst = 2, Run = 4 Analyst = 2, Run = 5 10
123456789
Plate

Mixed Effects Model for Potency• Fixed effects : Analyst, Concentration• Random effects : Run(Analyst), Plate(Run*Analyst) and residual (within-plate)
ym (ijkl) = log of mth potency for jth concentration tested by
ith Analyst in lth Plate at kth Run
i = ith Analyst effect
j = jth Concentration effect
Rk(i) = random effect of kth Run by ith Analyst: N(0, R2)
Pl(ik) = random effect of lth plate within kth Run by ith Analyst: N(0, P2)
m(ijkl) = residual errors: N(0, e2) .
)()()()( ijklmiklikjiijklm PRy
IP = R2 + P
2 + e2 and Repeatability = e
2
Reportable Value defined as mean of 3 runs, 2 plates/run /analyst Uncertainty = SQRT(R
2/3 + P2/6 + e
2 /6) (Format IP)
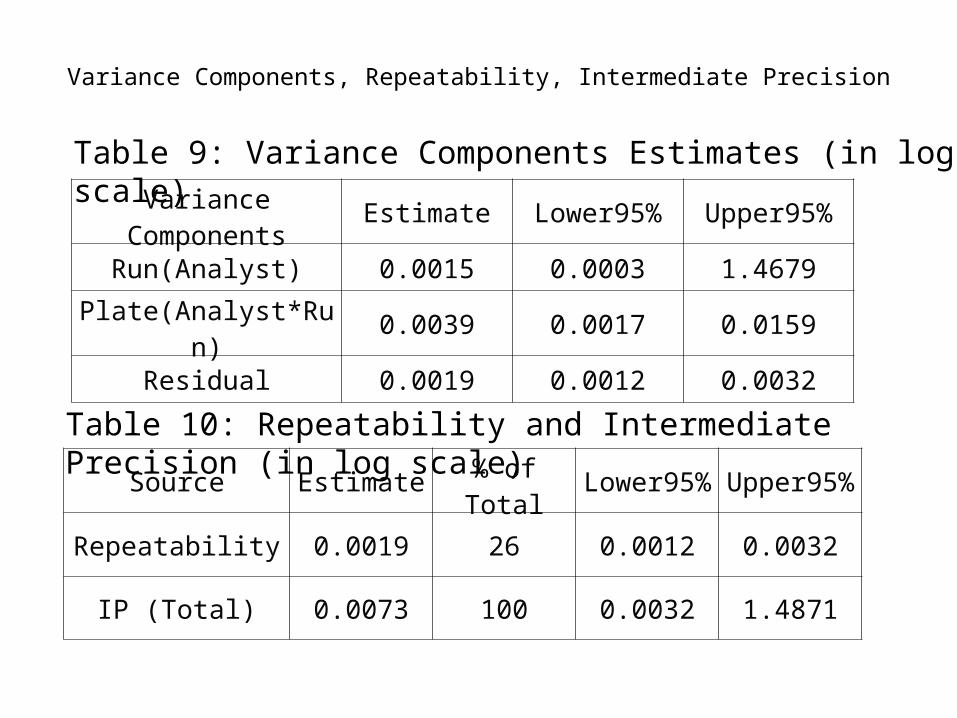
Variance Components, Repeatability, Intermediate Precision
Table 9: Variance Components Estimates (in log scale)
Table 10: Repeatability and Intermediate Precision (in log scale)
Variance Components Estimate Lower95% Upper95%
Run(Analyst) 0.0015 0.0003 1.4679
Plate(Analyst*Run) 0.0039 0.0017 0.0159
Residual 0.0019 0.0012 0.0032
Source Estimate % of Total Lower95% Upper95%
Repeatability 0.0019 26 0.0012 0.0032
IP (Total) 0.0073 100 0.0032 1.4871

Variance Components, Repeatability, Intermediate Precision
Table 11: Repeatability and Intermediate Precision (in linear scale)
Source%
GeometricVariance
% of Total Lower95% Upper95%2*%GCV
Reportable Value
Repeatability 19.9 26 13.0 34.07.8
IP (Total) 76.4 100 34.0 15627.6

Remarks1. Application of blocking and Statistical DoE is an efficient way to study
analytical method performance for the purpose of assessing reproducibility, intermediate precision and repeatability of chemical analytical methods.
2. DoEs permit a logical decomposition of the total variability into meaningful component parts.
3. Results are straight forward to interpret and have scientific meaning.4. Inherent precision of the device itself cannot always be estimated because
of the destructive nature of the test – confounded with dosage unit variation.
5. Some sources of variability may be estimated with insufficient precision. – Not possible at the development stage to estimate process variability due to small number of lots (make it a fixed effect).
6. Various statistical designs can form the basis for a Gage R&R study to gather information about additional factors.
7. Improves understanding and ability to support product specifications.
25