Scraping and Clustering Techniques for the Characterization of Linkedin Profiles
1
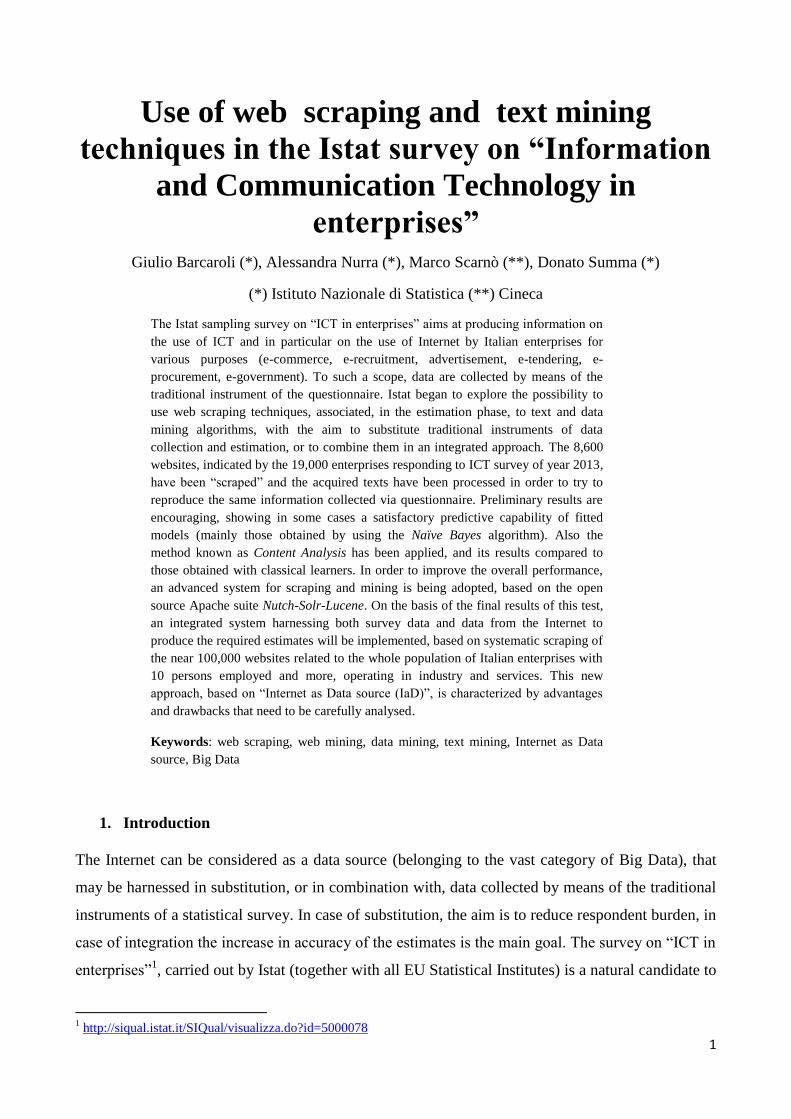
Use of web scraping and text mining
techniques in the Istat survey on “Information
and Communication Technology in
enterprises” Giulio Barcaroli (*), Alessandra Nurra (*), Marco Scarnò (**), Donato Summa (*)
(*) Istituto Nazionale di Statistica (**) Cineca
The Istat sampling survey on “ICT in enterprises” aims at producing information on
the use of ICT and in particular on the use of Internet by Italian enterprises for
various purposes (e-commerce, e-recruitment, advertisement, e-tendering, e-
procurement, e-government). To such a scope, data are collected by means of the
traditional instrument of the questionnaire. Istat began to explore the possibility to
use web scraping techniques, associated, in the estimation phase, to text and data
mining algorithms, with the aim to substitute traditional instruments of data
collection and estimation, or to combine them in an integrated approach. The 8,600
websites, indicated by the 19,000 enterprises responding to ICT survey of year 2013,
have been “scraped” and the acquired texts have been processed in order to try to
reproduce the same information collected via questionnaire. Preliminary results are
encouraging, showing in some cases a satisfactory predictive capability of fitted
models (mainly those obtained by using the Naïve Bayes algorithm). Also the
method known as Content Analysis has been applied, and its results compared to
those obtained with classical learners. In order to improve the overall performance,
an advanced system for scraping and mining is being adopted, based on the open
source Apache suite Nutch-Solr-Lucene. On the basis of the final results of this test,
an integrated system harnessing both survey data and data from the Internet to
produce the required estimates will be implemented, based on systematic scraping of
the near 100,000 websites related to the whole population of Italian enterprises with
10 persons employed and more, operating in industry and services. This new
approach, based on “Internet as Data source (IaD)”, is characterized by advantages
and drawbacks that need to be carefully analysed.
Keywords: web scraping, web mining, data mining, text mining, Internet as Data
source, Big Data
1. Introduction
The Internet can be considered as a data source (belonging to the vast category of Big Data), that
may be harnessed in substitution, or in combination with, data collected by means of the traditional
instruments of a statistical survey. In case of substitution, the aim is to reduce respondent burden, in
case of integration the increase in accuracy of the estimates is the main goal. The survey on “ICT in
enterprises”1, carried out by Istat (together with all EU Statistical Institutes) is a natural candidate to
1 http://siqual.istat.it/SIQual/visualizza.do?id=5000078
2
experiment this approach, as the questionnaire contains a number of questions, related to the
characteristics of the websites owned or used by the enterprises, whose answers can be deduced
directly by the content of these websites. An experiment has been conducted, whose aim is twofold:
(i) from a technological point of view, verify the capability to access the websites indicated by
enterprises participating to the sampling survey, and collect all the relevant information, (ii) from a
methodological point of view, use the information collected from the Internet in order to predict the
characteristics of the websites not only for surveyed enterprises, but for the whole population of
reference, in order to produce estimates with a higher level of accuracy.
The paper is organized as follows. In section 2 a general description of the survey is given with a
focus on the section of the questionnaire interested to the experiment. In section 3 the web scraping
system is described (with two variants). In section 4 two different inference approaches are
outlined, together with first results. In the conclusions, pros and cons of the web mining (or Internet
as a Data source, IaD) approach are evaluated, and indications about future work are outlined.
2. Description of the survey
The Community survey on ICT usage and e-commerce in enterprises (in short, “ICT in enterprises”)
is carried out annually by the Italian National Statistical Institute (Istat), according to a common
questionnaire and a harmonised methodology set out by Eurostat, shared in all the EU member
states and in cooperation with OECD. The survey collects information on ICT usage by enterprises
with 10 and more persons employed working in industry and services2 and, in particular, involves a
sample of small and medium firms and all the large enterprises (with at least 250 persons
employed). The survey, on the basis also of a benchmarking framework adopted for the Information
Society policy, is annually adapted to the needs of users and policy makers. Moreover,
technological evolution requires flexible statistical measurements of the phenomena observed and
this survey responds to the need to better tailor some indicators from year to year while keeping the
others fixed and more comparable in accordance with the general criteria of reduction or
maintenance of response burden on enterprises within a given limit. For ICT survey this limit was
fixed to 66 variables per questionnaire and was one of the main reason to begin discussing about the
2 The enterprises are classified in the following economic activity (NACE Rev. 2): Manufacturing; Electricity, gas and steam, water
supply, sewerage and waste management; Construction; Wholesale and retail trade repair of motor vehicles and motorcycles;
Transportation and storage; Accommodation and food service activities; Information and communication; Real estate activities;
Professional, scientific and technical activities; Administrative and support activities; Repair of computers. In 2013 sample was of
32.328 enterprises and the frame population of 193.130 enterprises. The survey frame is represented by the Italian Business Register
of active enterprises (BR). The sampling design is stratified with one-stage se lection of units with equal probability. Strata are
defined by the combination of economic activities, size classes and administrative regions of the administrative office of enterprises.
3
use of Internet as source of data and possibility to substitute or to complete the information asked
through more traditional statistical instruments like self-administered survey. The survey aims at
measuring the adoption of ICT, broadband Internet connection, website functionalities, the impact
of new technologies on the relationships with customers and suppliers (sharing information
electronically on Supply Chain Management, exchanging automatically business documents), on
organizational and marketing aspects (sharing electronically information on sales and/or purchases
with any internal function, using application to analyse information collected on clients), e-
commerce, e-government. Figures considered in this paper derive from raw survey data of year
2013. In 2013 respondents to the ICT survey were 19,114, equal to 59% of the total initial sample
and 9.9% of the universe of Italian active enterprises with 10 and more persons employed.
The ICT questionnaire includes a section on access and use of the Internet with a subsection on use
of website that it is the subject of this paper. We used information coming from questions about
facilities supplied through website and those given by respondent in a final section dedicated to
enterprises indicating the website URL. The observed variable (Does your enterprise have a
Website or Home Page, or one or more Internet pages?) does not refer specifically to the ownership
of the website, but to the use of a website by the enterprise to present its activity. The enterprises
answering ‘yes’ to this filter question can include not only the existence of a website which is
located on servers belonging to the enterprise, but also third party websites (e.g. one of the group of
enterprises to which it belongs, other third party websites3). This definition represents a first
possible limit of this experimental study, as we will discuss further. For the enterprises having a
website, this question focuses on the measurement of its specific uses. In particular we concentrated
our study on possibility to sell product or services via web (Online ordering or reservation or
booking, shopping cart facility4 5, from now on “web sales functionality”). This choice was due to
particular potential importance of this facility for positive impact on enterprise’s performance, for
giving a measure of level of e-business readiness and intensity of firms and sectors and also
because, in terms of web contents, should be easier to recognize keywords that could detect the
same phenomenon through automated tools.
3 An enterprise may offer web sales functionality and still not have a website as the sales are through e-marketplaces that are not
included in questions considered in this paper.
4 From the Methodological Manual (2013): “This item refers to a facility which allows the user to order products or services with no
additional contact offline or via e-mail necessary (for the ordering). It includes also websites which allow the reservation of hotel
rooms or the booking of flights. It does not include a link in the website which directs the user to an e-mail application which
requires the user to send the order via e-mail. Payment may or may not be included in the ordering facility, e.g. payment may be
made on reception of the product also by other means than electronic payment”.
5 Inside the benchmarking framework 2011-2015 it is included the indicator D7 asking for percentage of enterprises having a website
with web sales facilities (Website or a Home Page with online ordering or reservation or booking).
4
3. The web scraping system
Web scraping is the process of automatically collecting information from the World Wide Web. It is
a field with active developments sharing a common goal with the semantic web vision; it is based
on a tool that navigates and extracts the content of a website, and stores the scraped data in a local
data base. It has to be observed that, from a legal point of view, web scraping may be against the
terms of use of some websites: courts are prepared to protect proprietary content of commercial
sites from undesirable uses, even though the degree of protection for such content is not clearly
settled. The amount of information accessed and copied depends on the degree to which the access
is perceived as adversely affecting the site owner’s system, and the types and manner of restrictions
to such access. In the following two different solutions for the web scraping are described: the first
one is already available and has been used specifically for this experiment, while the second one is
still in the development phase.
The web scraping application based on JSOUP and ADaMSoft
A first choice was to develop the scraping application by making use of an Open Source library
called JSOUP6 and by integrating it in the ADaMSoft system
7, in order to deal with all navigation
and data management problems. Actually, a number of difficulties have been encountered during
this step, mainly due to websites not fully reachable and to those making use of technologies not
entirely based on standard html text (like, for example, the websites realized with Flash
technology), and therefore not easily accessible. After the execution of this step, two sets of data
have been obtained: one that contains the text (visible by a generic user) of each website, the other
the information reported in each tag related to the objects in the html pages (for instance, “type”,
“name”, “value”). We experienced that this second set of data greatly increases the amount of
useful information.
The web scraping application based on the Nutch/Solr/Lucene Apache suite
The Apache suite used for crawling, content extraction, indexing and searching results is composed
by Nutch and Solr. Nutch8 is a highly extensible and scalable open source web crawler, it facilitates
parsing, indexing, creating a search engine, customizing search according to needs, scalability,
6 http://jsoup.org/
7 http://adamsoft.sourceforge.net/
8 https://nutch.apache.org/
5
robustness, and scoring filter for custom implementations. Built on top of Apache Lucene and based
on Apache Hadoop, Nutch can be deployed on a single machine as well as on a cluster, if large
scale web crawling is required. Apache Solr9 is an open source enterprise search platform that is
built on top of Apache Lucene and can be seen as a Nutch search back-end. It can be used for
searching any type of data; in this experiment, however, it is specifically used to search web pages.
Its major features include full-text search, hit highlighting, faceted search, dynamic clustering,
database integration, and rich document handling. Providing distributed search and index
replication, Solr is highly scalable. Both Nutch and Solr have an extensive plugin architecture
useful when advanced customization is required.
Starting from a list of URLs (root pages), Nutch fetches, parses and indexes for each of them all the
linked resources according to a series of constraints, the most important are (i) the link depth from
the root page that should be crawled, (ii) the maximum number of pages that will be retrieved at
each level up to the depth. Nutch offers a series of fine configurable NLP (Natural Language
Processing) functions applicable on fetched web resources, such as tokenization, stopping and
stemming. Finally Nutch delegates searching to Solr.
All problems encountered are relative to environment configuration and tools integration, for
example it was necessary to manage case sensitiveness, site load balancing, page redirections,
plugins and OS configuration, etc..
Although this web scraping approach requires an initial effort in terms of technological expertise, in
the long run it can lead to a substantial return on investment as it can be used on many other
contexts to access Big Data sources. As an example, it can be used as platform to access and
analyse web resources like blogs or social media to perform semantic analyses or sentiment
analyses tasks.
4. The inference system
Once completed the web scraping activities, before proceeding with the inference phase a pre-
processing step was applied, consisting in treating the text in the usual way (reduction to lower case,
elimination of punctuation and stop-words, stemming) and in selecting only the words that showed
a significant influence on the target variables. This influence was determined by evaluating the chi-
square associated to the joint distribution of a given target variable and the presence/absence of a
given word. Four different subsets of words have been defined: having set as thresholds the
9 https://lucene.apache.org/solr/
6
percentiles 99.5, 99.0, 97.5, 95.0 related to their chi-square distributions, words with a chi-square
exceeding those thresholds have been considered.
The final result of this pre-processing consists in a document/term matrix, where each row
represents a website, each column is referred to an influent word, and the intersection indicates the
presence or the absence of the word in the website.
In order to choose the best instruments useful to build the inference system, in this exploratory
phase we tested several of them, distinguished in:
1. data mining learners, applicable to this text mining problem: Classification Trees, ensemble
learners (Random Forest, Adaptive Boosting, Bootstrap Aggregating), Neural Networks,
Maximum Entropy, Support Vector Machines, Latent Dirichlet Allocation ([1]);
2. the learner most suitable for text mining: Naïve Bayes ([2]);
3. the approach followed in the Content Analysis ([3]).
As usual, available data have been partitioned in a training set and in a test set: each model, fitted
using the training set, has been applied to the test set in order to evaluate its performance, by
comparing observed and predicted values for the target variables, both at individual and aggregate
level. In general, the proportion between the two sets was determined in 75/25, but a sensitivity
analysis has been performed for Naïve Bayes and Content Analysis defining 9 different levels for
the training set (from 10% to 90%). Experiments have been carried out considering the four
different subset of words defined accordingly to their chi-square, and the most favorable in terms of
performance has been retained.
Performance has been measured by considering the following indicators: (i) precision rate (number
of correctly classified cases on the total number of cases), (ii) sensitivity (rate of correctly classified
positive cases), (iii) specificity (rate of correctly classified negative cases). Besides, we also
introduced (iv) the proportion of predicted positive cases, as it corresponds to the final estimate that
we want to produce and whose accuracy we want to maximize. These four indicators can be easily
computed from the so called confusion matrix.
4.1 Data mining learners
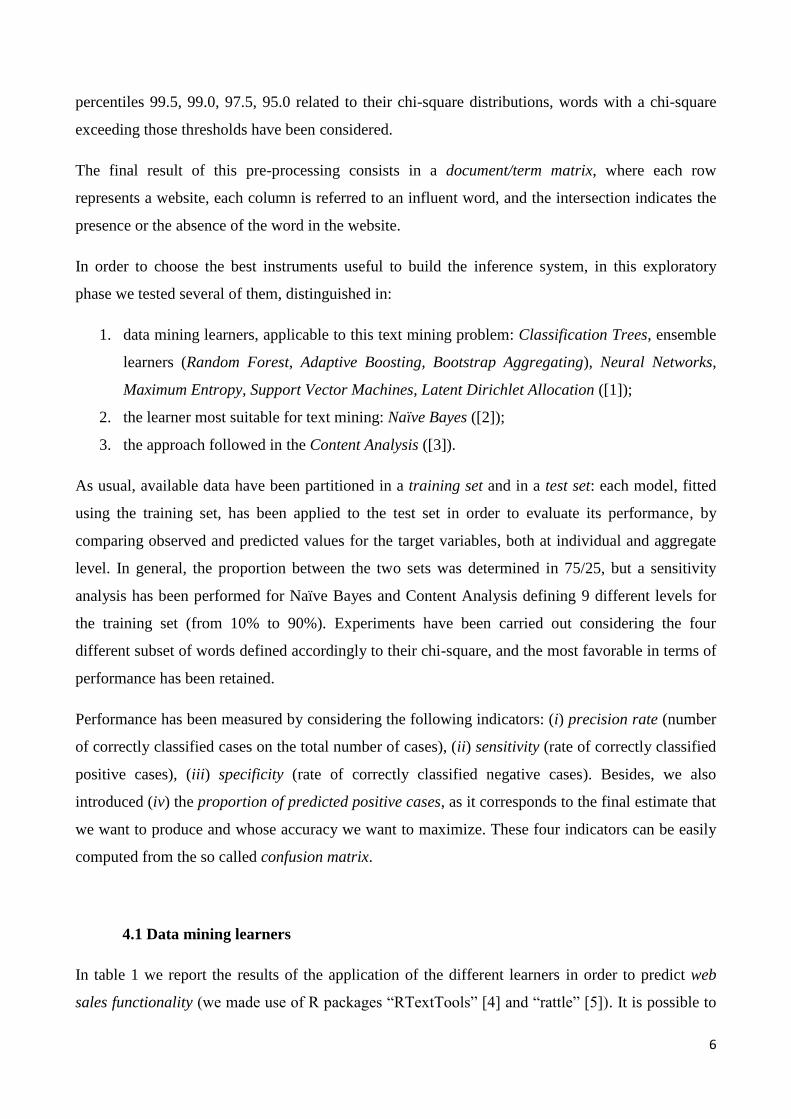
In table 1 we report the results of the application of the different learners in order to predict web
sales functionality (we made use of R packages “RTextTools” [4] and “rattle” [5]). It is possible to
7
notice that the precision level is in general acceptable: it ranges from a minimum of 79% to a
maximum of 85%. Specificity is always very high. The real problem is given by sensitivity, that is
the capability to correctly classify positive cases, i.e. the websites that offer web sales functionality:
in many cases its value is too low to be considered as acceptable. As for the proportion of web sales
functionality, in general data mining learners fail in reproducing the correct aggregates10
.
Table 1 – Performance indicators for data mining learners (variable “web sales functionality”)
4.1 Text mining specific approaches
Content analysis
Hopkins and King proposed a method quite different from all the others so far considered, as it does
not require statistical or machine learning modeling of data and individual predictions. It does not
even require a training set to be a representative sample of the whole population: the only
requirement is that the training set must contain a sufficient number of cases for each combination
of terms.
In order to verify the robustness of this method, different training sets have been obtained by
drawing samples from the available websites, varying the sampling rate from 10% to 90% (40
10
It is worthwhile to notice that the small differences in the proportions of observed presence of web sales functionality
depend on the fact that they are calculated each time on a test set that is selected randomly by the complete set of survey
data.
Precision Sensitivity Specificity
Proportion of
web sales
functionality
(observed)
Proportion of
web sales
functionality
(predicted)
Classification Tree 0.83 0.28 0.98 0.21 0.08
Random Forest 0.85 0.34 0.99 0.22 0.08
Bootstrap aggregating 0.82 0.48 0.91 0.21 0.10
Adaptive boosting 0.80 0.39 0.91 0.22 0.17
Maximum entropy 0.80 0.46 0.90 0.22 0.18
Support Vector Machines 0.79 0.02 0.99 0.22 0.01
Neural networks 0.82 0.21 0.98 0.20 0.06
Latent Dirichlet allocation 0.81 0.18 0.98 0.21 0.05
Learners
Indicators
8
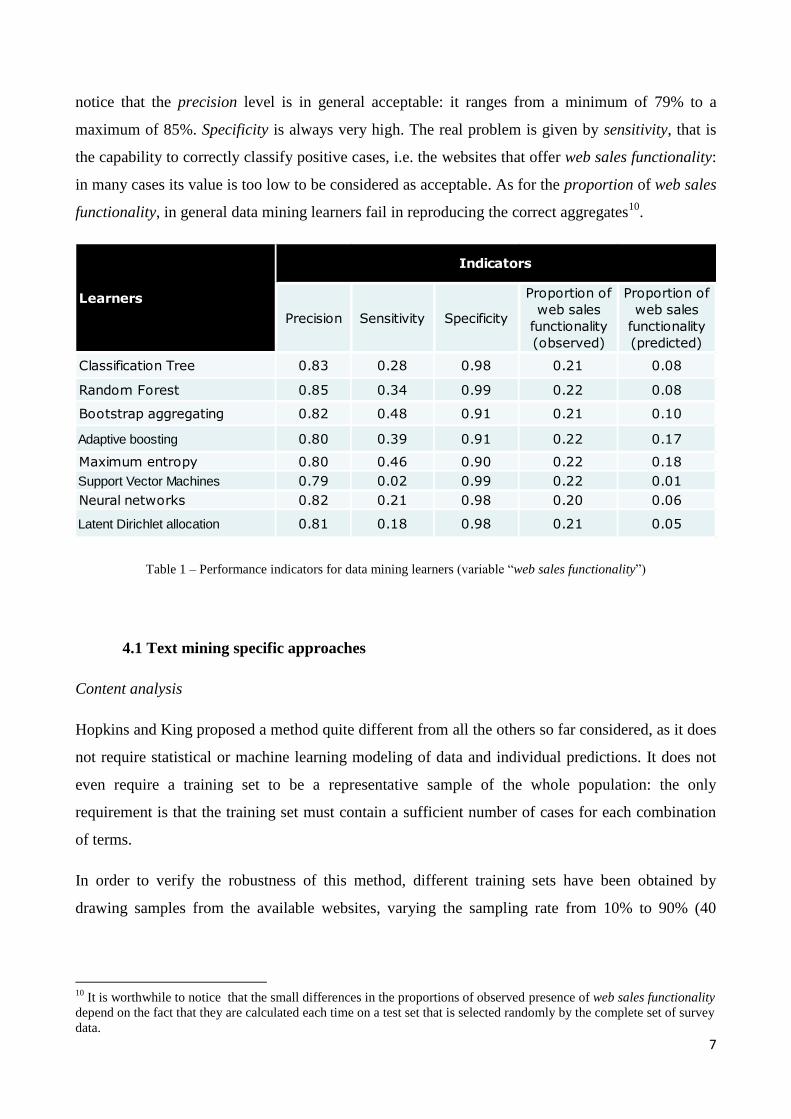
samples for each sampling rate), and related estimates of web sales functionality rate have been
produced for each sample by using Content Analysis.
It can be seen (figure 1) that, especially in cases from 10% to 30% of training set rate, the method
seems to be unbiased, as the median of the samples tends to coincide with the proportion in the total
number of cases. But the range of the estimates is considerably large: for example, in the case of
10%, interval of estimates goes from 0.08 to 0.31, and we have even worse situations in the other
cases.
Figure 1 – Content Analysis: distributions of estimates varying the training set rate (variable “web sales functionality”)
Naïve Bayes algorithm
The Naïve Bayes algorithm is the most used in the field of the text classification, where it can be
considered as a standard choice. It is called “naïve” because of its (simplistic) assumptions
concerning data, as it assumes that all the features in a dataset are independent and equally
important, a condition that is seldom verified in real situations. Actually, words in a text are not
equally important in order to predict a given category to be associated to the text, and words are not
independent each other. But Naïve Bayes works well despite the fact that its basic assumptions are
very seldom fulfilled. We made use of the implementation available in the R package “e1071” [6].
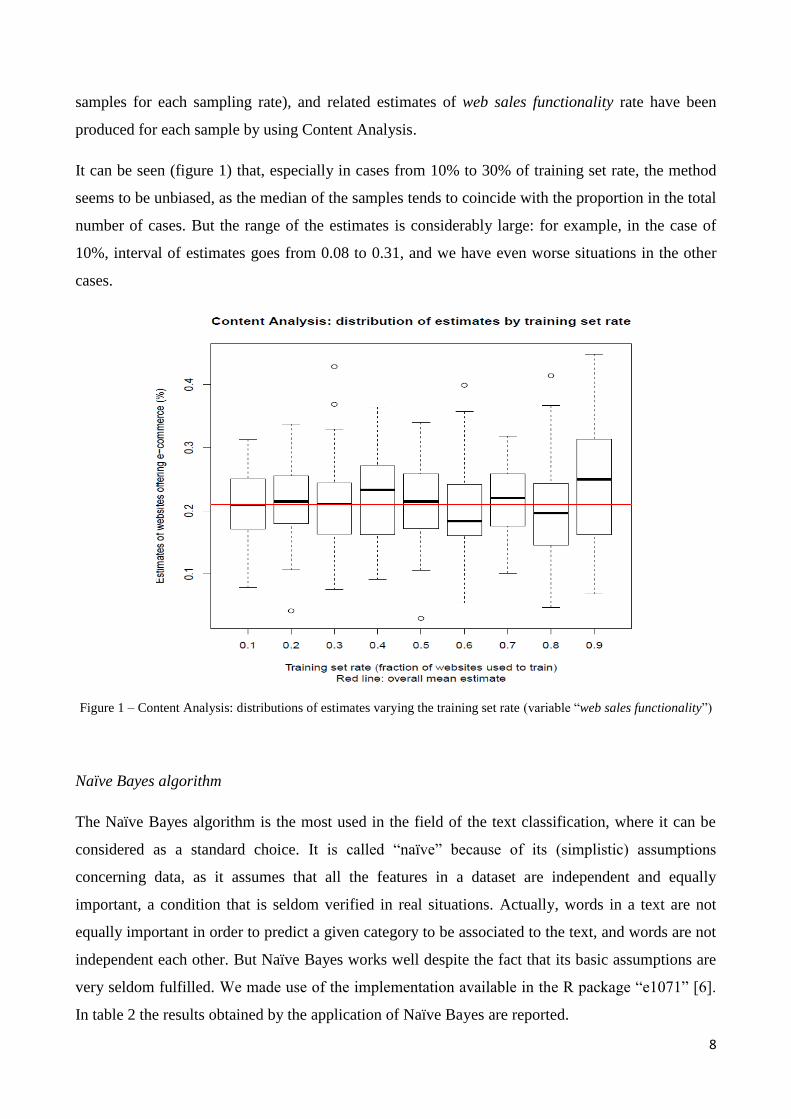
In table 2 the results obtained by the application of Naïve Bayes are reported.
9
Table 2 – Confusion matrix and performance indicators for Naïve Bayes application (variable “web sales functionality”)
It can be seen that Naïve Bayes is slightly inferior to some data mining learners in terms of
precision, but performs much better in terms of sensitivity, and reaches a practically perfect
coincidence between the predicted proportion and the observed one.
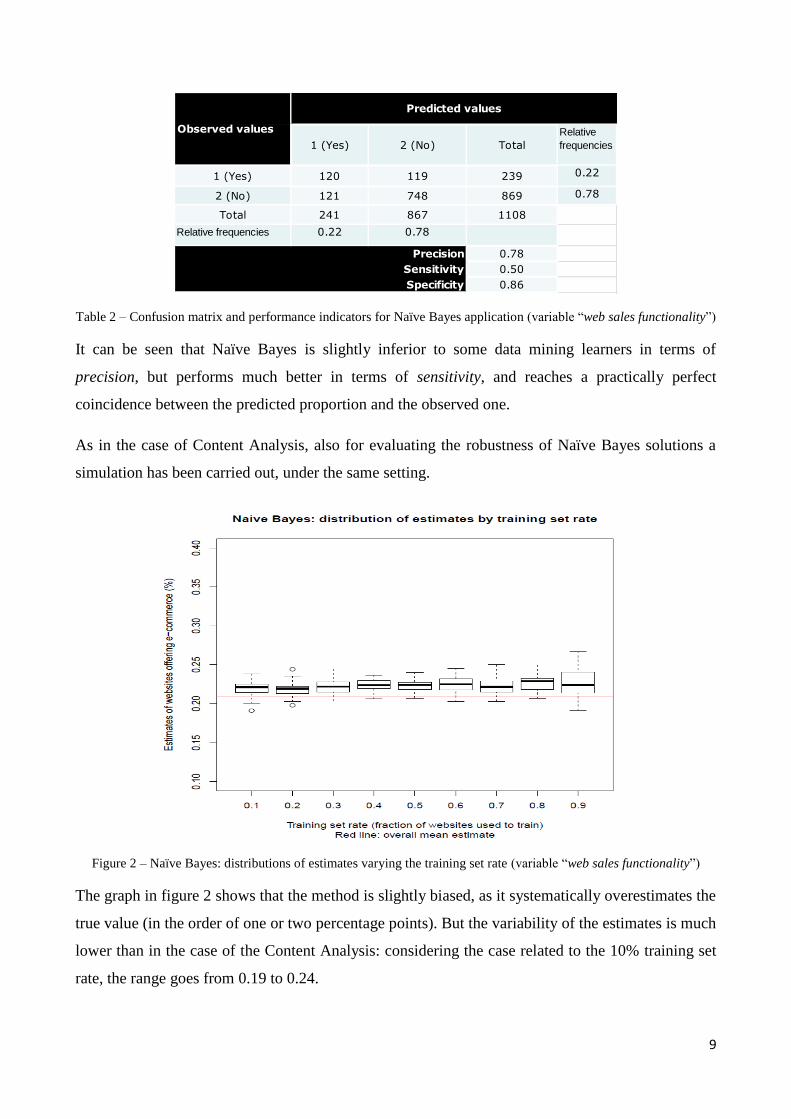
As in the case of Content Analysis, also for evaluating the robustness of Naïve Bayes solutions a
simulation has been carried out, under the same setting.
Figure 2 – Naïve Bayes: distributions of estimates varying the training set rate (variable “web sales functionality”)
The graph in figure 2 shows that the method is slightly biased, as it systematically overestimates the
true value (in the order of one or two percentage points). But the variability of the estimates is much
lower than in the case of the Content Analysis: considering the case related to the 10% training set
rate, the range goes from 0.19 to 0.24.
1 (Yes) 2 (No) Total
Relative
frequencies
1 (Yes) 120 119 239 0.22
2 (No) 121 748 869 0.78
Total 241 867 1108
Relative frequencies 0.22 0.78
0.78
0.50
0.86
Observed values
Precision
Sensitivity
Specificity
Predicted values
10
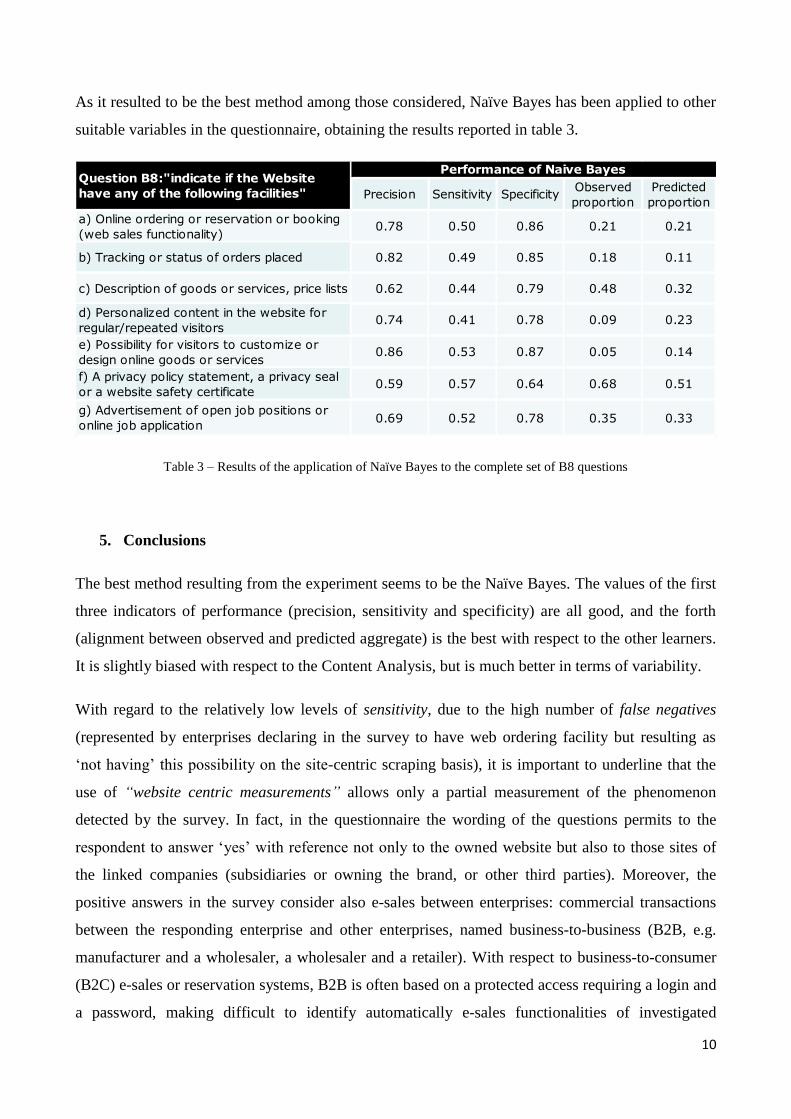
As it resulted to be the best method among those considered, Naïve Bayes has been applied to other
suitable variables in the questionnaire, obtaining the results reported in table 3.
Table 3 – Results of the application of Naïve Bayes to the complete set of B8 questions
5. Conclusions
The best method resulting from the experiment seems to be the Naïve Bayes. The values of the first
three indicators of performance (precision, sensitivity and specificity) are all good, and the forth
(alignment between observed and predicted aggregate) is the best with respect to the other learners.
It is slightly biased with respect to the Content Analysis, but is much better in terms of variability.
With regard to the relatively low levels of sensitivity, due to the high number of false negatives
(represented by enterprises declaring in the survey to have web ordering facility but resulting as
‘not having’ this possibility on the site-centric scraping basis), it is important to underline that the
use of “website centric measurements” allows only a partial measurement of the phenomenon
detected by the survey. In fact, in the questionnaire the wording of the questions permits to the
respondent to answer ‘yes’ with reference not only to the owned website but also to those sites of
the linked companies (subsidiaries or owning the brand, or other third parties). Moreover, the
positive answers in the survey consider also e-sales between enterprises: commercial transactions
between the responding enterprise and other enterprises, named business-to-business (B2B, e.g.
manufacturer and a wholesaler, a wholesaler and a retailer). With respect to business-to-consumer
(B2C) e-sales or reservation systems, B2B is often based on a protected access requiring a login and
a password, making difficult to identify automatically e-sales functionalities of investigated
Precision Sensitivity SpecificityObserved
proportion
Predicted
proportion
a) Online ordering or reservation or booking
(web sales functionality)0.78 0.50 0.86 0.21 0.21
b) Tracking or status of orders placed 0.82 0.49 0.85 0.18 0.11
c) Description of goods or services, price lists 0.62 0.44 0.79 0.48 0.32
d) Personalized content in the website for
regular/repeated visitors0.74 0.41 0.78 0.09 0.23
e) Possibility for visitors to customize or
design online goods or services 0.86 0.53 0.87 0.05 0.14
f) A privacy policy statement, a privacy seal
or a website safety certificate0.59 0.57 0.64 0.68 0.51
g) Advertisement of open job positions or
online job application0.69 0.52 0.78 0.35 0.33
Question B8:"indicate if the Website
have any of the following facilities"
Performance of Naive Bayes
11
websites. These two factors can explain why using different instruments (survey vs scraping) we
measure the same phenomenon but delimited by different boundaries.
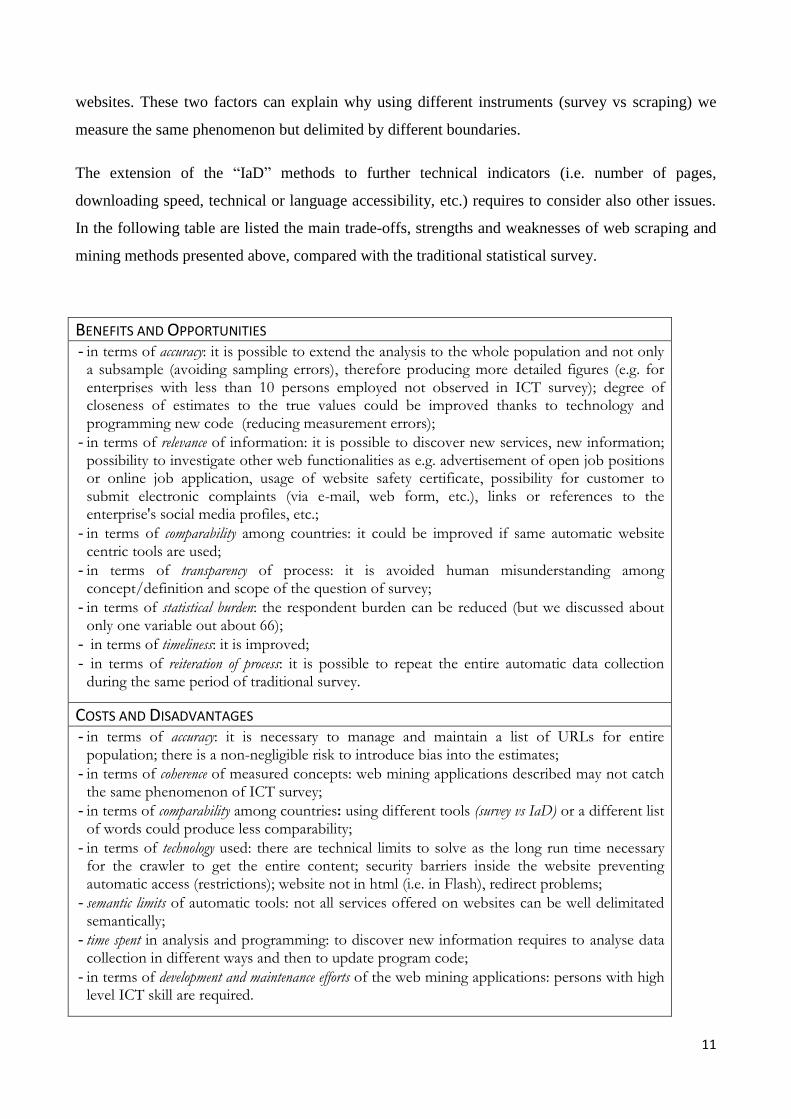
The extension of the “IaD” methods to further technical indicators (i.e. number of pages,
downloading speed, technical or language accessibility, etc.) requires to consider also other issues.
In the following table are listed the main trade-offs, strengths and weaknesses of web scraping and
mining methods presented above, compared with the traditional statistical survey.
BENEFITS AND OPPORTUNITIES
- in terms of accuracy: it is possible to extend the analysis to the whole population and not only a subsample (avoiding sampling errors), therefore producing more detailed figures (e.g. for enterprises with less than 10 persons employed not observed in ICT survey); degree of closeness of estimates to the true values could be improved thanks to technology and programming new code (reducing measurement errors);
- in terms of relevance of information: it is possible to discover new services, new information; possibility to investigate other web functionalities as e.g. advertisement of open job positions or online job application, usage of website safety certificate, possibility for customer to submit electronic complaints (via e-mail, web form, etc.), links or references to the enterprise's social media profiles, etc.;
- in terms of comparability among countries: it could be improved if same automatic website centric tools are used;
- in terms of transparency of process: it is avoided human misunderstanding among concept/definition and scope of the question of survey;
- in terms of statistical burden: the respondent burden can be reduced (but we discussed about only one variable out about 66);
- in terms of timeliness: it is improved;
- in terms of reiteration of process: it is possible to repeat the entire automatic data collection during the same period of traditional survey.
COSTS AND DISADVANTAGES
- in terms of accuracy: it is necessary to manage and maintain a list of URLs for entire population; there is a non-negligible risk to introduce bias into the estimates;
- in terms of coherence of measured concepts: web mining applications described may not catch the same phenomenon of ICT survey;
- in terms of comparability among countries: using different tools (survey vs IaD) or a different list of words could produce less comparability;
- in terms of technology used: there are technical limits to solve as the long run time necessary for the crawler to get the entire content; security barriers inside the website preventing automatic access (restrictions); website not in html (i.e. in Flash), redirect problems;
- semantic limits of automatic tools: not all services offered on websites can be well delimitated semantically;
- time spent in analysis and programming: to discover new information requires to analyse data collection in different ways and then to update program code;
- in terms of development and maintenance efforts of the web mining applications: persons with high level ICT skill are required.
12
The web mining (or Internet as Data source) approach experimented in the “ICT in enterprises”
survey revealed to be promising and can be continued and extended in different directions:
o with reference to the population of interest: we can consider the URLs of all the units belonging
to the Business Register, and perform a mass scraping of related websites (in this case also
experimenting more properly the high volume problems related to Big Data), considering the
whole sampling subset of websites as a training set, so to obtain a model that can be applied the
whole population. The aim is twofold:
1. to produce estimates under a full predictive approach, reducing the sampling errors at the
cost of introducing additional bias (both components of MSE should be evaluated);
2. to identify the subpopulation of enterprises active in web sales transactions with individuals
as the end consumer (B2C), that can be considered as a new sampling frame to consider in
the ICT survey or to carry out new ad hoc surveys;
o with reference to the content of the questionnaire: the approach used with the set of variables
contained in the “B8” section of the questionnaire will be evaluated also with regard to other
suitable variables in the questionnaire (e-recruitment, e-procurement, use of social networks,
etc.).
Anyway, it is necessary to improve the results of the web mining applications and to investigate
more on those units appearing as false positives. In fact, while conceptual reasons justify, as
discussed above, the high percentage of false negatives, it is more difficult to understand cases in
which web scraping finds web sales functionality signals in websites contrary to answers of the
survey. In the future it is necessary to better explore these false positives because, for example, they
could be a signal that respondents do not understand correctly the question. Different explanations
could be found in time lag between survey and web scraping, or in flaws in the methods and tools
used for web scraping and text mining.
13
References
[1] James, G., Witten, D., Hastie, T., Tibshirani R. (2013), An Introduction to Statistical Learning
with Applications in R, Springer Texts in Statistics
[2] Lantz, B. (2013), Machine Learning with R, Packt Publishing Ltd, Pp. 89-117
[3] Hopkins, D.J., King G. (2010), A Method of Automated Nonparametric Content Analysis for
Social Science, American Journal of Political Science, Vol. 54, No.1, January 2010, Pp. 229-247
[4] Timothy P. Jurka, Loren Collingwood, Amber E. Boydstun, Emiliano Grossman and Wouter
van Atteveldt (2014). RTextTools: AutomaticText Classification via Supervised Learning. R
package version 1.4.2. http://CRAN.R-project.org/package=RTextTools
[5] Williams, G. J. (2011), Data Mining with Rattle and R: The Art of Excavating Data for
Knowledge Discovery, Use R!, Springer.
[6] David Meyer, Evgenia Dimitriadou, Kurt Hornik, Andreas Weingessel and Friedrich Leisch
(2014). e1071: Misc Functions of the Department of Statistics (e1071), TU Wien. R package
version 1.6-3. http://CRAN.R-project.org/package=e1071