Use of the PistenBully 300 (Kässbohrer) on maize silage ... 1.Test question How are the compaction,...
26
LANDWIRTSCHAFTLICHES ZENTRUM für Rinderhaltung, Grünlandwirtschaft, Milchwirtschaft, Wild und Fischerei Baden-Württemberg (LAZBW) Atzenberger Weg 99, 88326 Aulendorf Use of the PistenBully 300 (Kässbohrer) on maize silage Effects on density, silage temperature and fermentation quality - Project 2009 - Created by: Dr Hansjörg Nußbaum
-
Upload
truongdung -
Category
Documents
-
view
230 -
download
4
Transcript of Use of the PistenBully 300 (Kässbohrer) on maize silage ... 1.Test question How are the compaction,...

LANDWIRTSCHAFTLICHES ZENTRUM für Rinderhaltung, Grünlandwirtschaft, Milchwirtschaft, Wild und Fischerei Baden-Württemberg (LAZBW) Atzenberger Weg 99, 88326 Aulendorf
Use of the PistenBully 300 (Kässbohrer) on maize silage
Effects on density, silage temperature and fermentation quality - Project 2009 -
Created by:
Dr Hansjörg Nußbaum
2
1.Test question How are the compaction, silage temperature and fermentation quality of maize silage affected by use of a snow groomer as the spreading and rolling vehicle? The LAZBW (Baden-Württemberg agricultural centre for ruminant production, grassland management, dairy management, wildlife and fisheries) has performed laboratory analyses on the harvested crop and all silage samples for its own interest and at its own cost. These results are also presented in this report. 2. Material and methods 2.1 Firm: Bioenergie Pfullendorf Dorfstr. 10 88630 Pfullendorf Tel.: +49 (0)755 250 78 2.2 Harvest technology: Chaff chopper: Claas Jaguar 950 Subcontractor Markus Wahl Ortsstr. 28 88630 Pfullendorf-Zell am Andelsbach Tel.: +49 (0)755 293 8743 Transport: 3 dumpers Brandner TA 20053 (approx. 30 m³) 2.3 Silage crop: Silo maize was sown at Bioenergie Pfullendorf after the green rye harvest in May (20th - 25th May 2009). The maize was harvested using a chaff chopper on 7th October 2009 in summer temperatures. The short cut (theoretical cut length 6-8 mm) harvested crop was exclusively spread and compacted with a snow groomer (PistenBully 300, Kässbohrer). The DLG (German agricultural society) test centre at Groß-Umstadt and the LAZBW were represented and participated in the harvest and ensilaging. Monitoring and recording the harvest progress was the remit of the DLG test centre in line with contractual provisions, whilst the LAZBW was responsible for sampling and certifying the silage. According to the DLG e.V. 871 tonnes of harvested crop (FM) were unloaded in 1,270 m³ silo space in around 8 working hours (net). This results in a mean density of 686 kg FM/m³ and 213 kg DM/m³ and a mean output of 108 t FM and 33.6 t DM/h. The cut silo maize had a mean dry substance content across all 80 tipper loads of 31.1 % (spread 23.8 to 37.6 % DM). The content of 15 of the 80 samples was investigated (Table 1). These samples represented the whole harvested crop well with a mean 31.7 % DM and a spread of 27.0 to 34.9 % DM. The silo maize had a recorded 6.2 % mean crude protein, 21.7 % crude fibre and 3.6 %
3
crude ash in the dry substance. The starch content was 32.5 % in DM on harvesting, the digestibility (Elos) 72.3 %. An energy concentration of 6.4 MJ NEL/kg DM resulted from the raw nutrients. The different land use and varieties of silo maize, which was at different stages of maturity on harvesting, were evident in the ranges of the individual contents. With a fermentability coefficient of 38.1, the harvested crop ranged from moderately easy, to easy to silage. Table 1: Content of the harvested crop (15 of 80 samples were analysed)
no. DM Crude Crude Crude NDForg Starch Elos ME NEL Sugar BC S/BC FC protein fibre ash ratio
% % in DM % MJ/kg DM% in DM
1 27.0 7.2 24.3 4.2 47.3 28.1 68.0 10.2 6.1 3.0 6.6 0.5 30.72 32.4 5.7 21.8 4.2 43.6 33.2 72.3 10.6 6.3 4.1 4.5 0.9 39.73 33.2 7.2 21.9 3.3 45.6 30.2 69.9 10.7 6.4 1.7 7.0 0.2 35.14 31.5 6.7 20.3 3.7 41.8 33.3 74.0 10.9 6.5 4.6 5.2 0.9 38.55 32.5 5.8 22.0 3.9 43.5 31.4 71.9 10.6 6.3 4.1 6.5 0.6 37.56 29.6 5.8 21.3 2.7 45.5 31.7 72.0 10.8 6.5 8.4 7.5 1.1 38.67 34.1 6.1 19.6 3.6 41.8 34.9 73.9 11.0 6.6 7.7 8.8 0.9 41.18 34.6 5.9 21.1 3.5 40.9 35.9 74.6 10.8 6.4 7.5 7.7 1.0 42.49 31.6 6.4 21.2 2.9 43.9 31.0 72.0 10.8 6.5 6.6 6.9 1.0 39.2
10 31.5 6.4 21.6 3.4 42.7 33.9 74.2 10.7 6.4 5.1 8.5 0.6 36.311 28.0 5.6 22.3 4.0 47.9 29.6 68.3 10.5 6.3 8.6 7.5 1.2 37.212 28.4 5.5 22.5 4.2 44.6 31.5 71.2 10.5 6.3 4.8 9.2 0.5 32.513 34.9 6.5 21.4 3.8 42.5 34.0 73.0 10.7 6.4 4.3 10.5 0.4 38.214 33.4 5.9 22.2 3.1 41.7 35.0 75.5 10.6 6.4 7.3 7.4 1.0 41.315 32.5 6.2 22.0 3.7 42.1 33.4 74.0 10.6 6.3 8.4 6.8 1.2 42.5
Mean 31.7 6.2 21.7 3.6 43.7 32.5 72.3 10.7 6.4 5.7 7.4 0.8 38.1Min 27.0 5.5 19.6 2.7 40.9 28.1 68.0 10.2 6.1 1.7 4.5 0.2 30.7Max 34.9 7.2 24.3 4.2 47.9 35.9 75.5 11.0 6.6 8.6 10.5 1.2 42.5
FC = 8 x S/BC + DM 2.4 Silo type: Bunker silo with side walls, covered with tarpaulin Height: 2.60 m
Width: 13.05 m on the road, 8.20 m to the biogas plant Length: left side 46.40 m (for drying), right side 54.20 m
2.5 Local sampling dates:
1. D1 20th October 2009 at approx. 30.0 m from the back (marking left) 2. D2 8th January 2010 at approx. 20.0 m from the back 3. D3 28th January 2010 at approx. 10.0 m from the back 2.6 Sampling position:
1. P1 at the side approx. 0.50 m from the side wall (edge 1) 2. P2 at the side approx. 1.00 m from the side wall (edge 2) 3. P3 in the middle of the silage pile, 5.5 m from the left-hand wall (middle)
2.7 Layers:
1. L1 approx. 0.30 m from the access edge starting from the top 2. L2 approx. 1.00 m from the access edge starting from the top 3. L3 approx. 0.50 m above the silo floor

4
2.8 Analyses: 1. Density using Pioneer borer in kg FM/m³ and kg DM/m³ 2. DM content using drying at 60°C and 105 °C; for the silage dry mass corrections acc.
WEISSBACH (1994); figures then in % in DMc 3. pH values using rapid determination on-site (indicator paper Macherey & Nagel, no.
095300) and additionally using measuring equipment in the lab 4. Sensory evaluation of the silage on-site 5. Raw nutrients: acc. VDLUFA 6. Energy content: calculated using HFT (formula for maize silage acc. STEINGASS and
MENKE, 1987) 7. Fermentation acid and residual sugar: using HPLC, modified acc. SIEGFRIED et al.
1984 8. Sugar content in the harvested crop acc. VDLUFA (Volume III Book of Methods) by
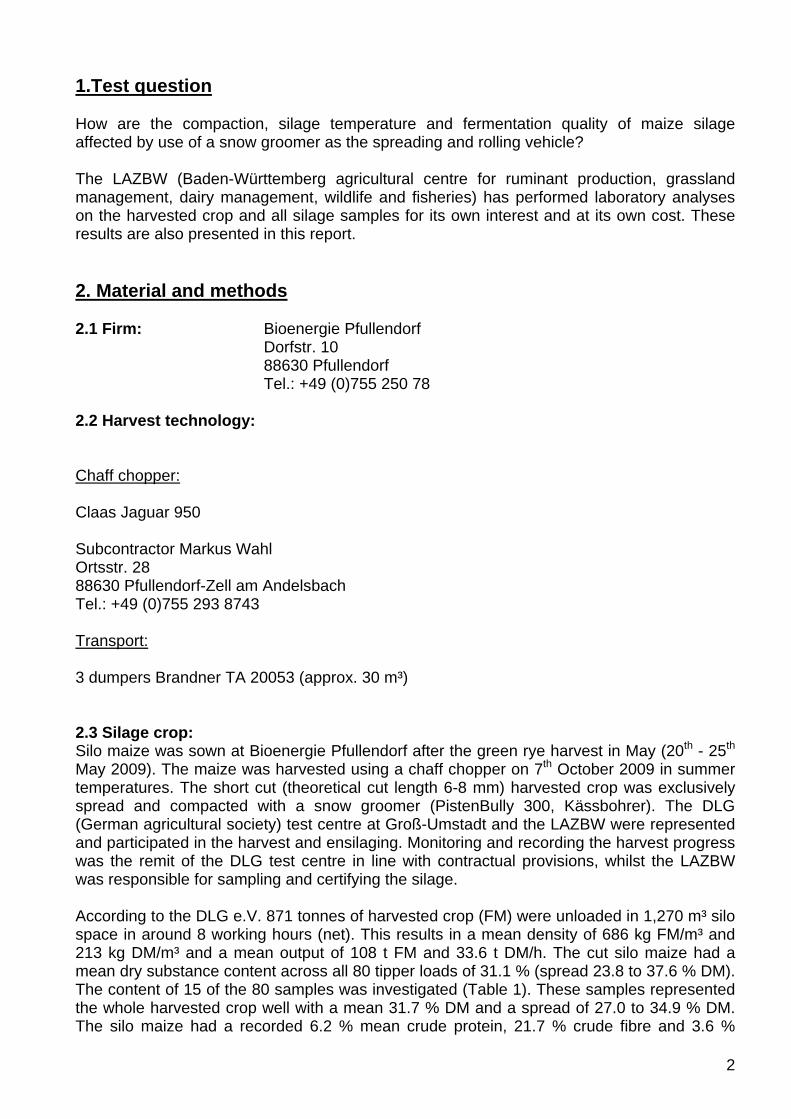
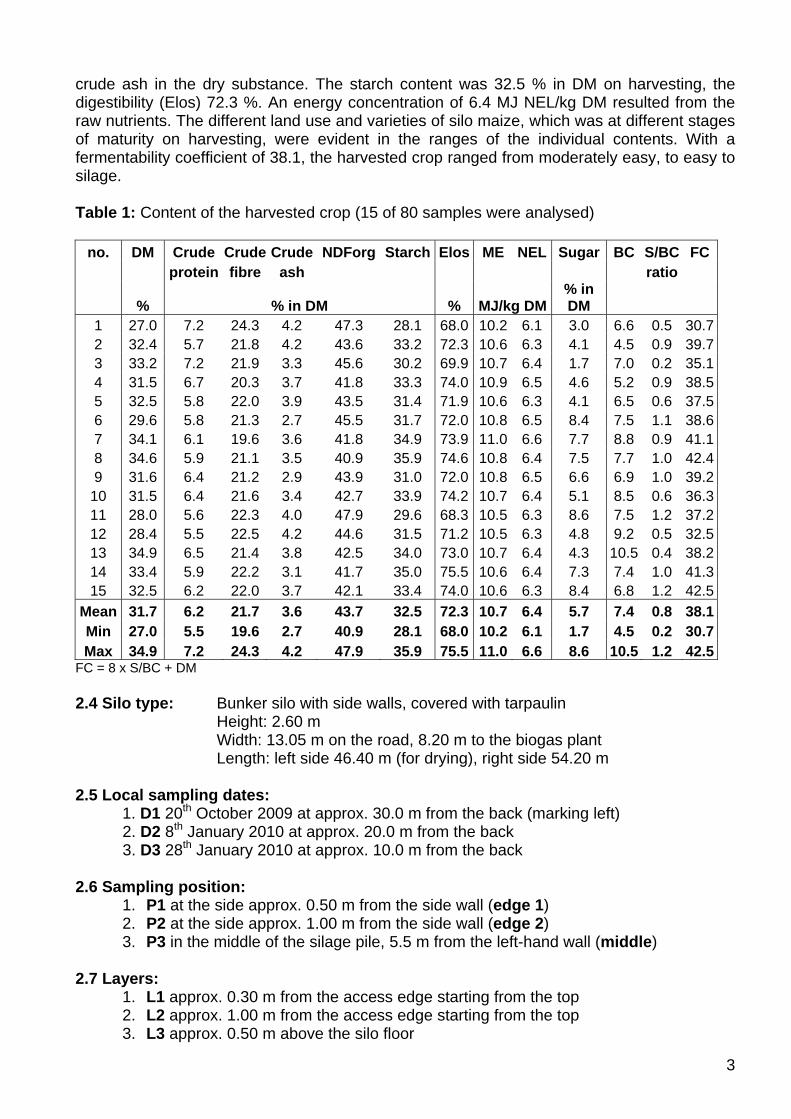
the LTZ Augustenberg 2.9 Process The silo was covered with tarpaulin on the morning of the 8th October 2009. However, the first feed removal occurred immediately afterward. Thus, there was no complete anaerobic phase. The mean removal rate was around 3.5 metres per week. The first sample was taken at an access height of around 2 metres on 20th October 2009. The ambient temperature on this day was 2 °C. Silage was removed regularly from the silo until the middle of December. The firm then stored turkey manure in front of the open access, which meant the next samples could not be taken until 8th January 2010 after removal of the feed and another harvest of around 5 metres. The ambient temperature at the start of January was -3.7 °C. The last sample was taken on 28th January when around 10 metres of silage remained in the silo. The temperature on this day was -2.1 °C. Sampling was effected at three positions in each case (P1 to P3) and three layers (L1 to L3) using a sample borer (Pioneer). Core samples (3 bore holes per position and layer; diameter 4.5 cm, 45 cm long) were removed and weighed (Figure 1). Mixed samples were created from the three core samples from the individual positions and layers. The mixed samples were tested immediately using sensory analysis for faulty fermentation and using indicator paper for the pH value. The samples were then weighed (500 g fresh material in crisp packs) to determine the dry substance content (Mettler PM 54). The samples were transported to Aulendorf in a cool box and then dried for at least 24 hours at 105 °C in the drying cupboard to a constant weight. Fresh material from each mixed sample was deep frozen to analyse feed value and fermentation quality. The temperature was measured using two temperature probes (Testo) at three depths (15 cm, 50 cm, 150 cm from the front edge of the bore hole) in each bore hole (Figure 2).
5
100 cm Edge 2
50 cm Edge 1
← Silo middle
30 cm
100 cm
50 cm
Figure 1: Schematic arrangement of the core samples around the edge of the grass silage (illustration not to scale)
Figure 2: Temperature measurements in the bore holes

6
3. Results 3.1 DM content The 27 silage samples had a mean 19.6 % DM with a spread of 34.9 % DM to 30.8 % DM (Table 3). This corresponds fairly accurately to the mean value of 31.1 % DM when the 80 tippers were unloaded. The mean DM content is in the target range of good maize silage of 30 to 35 %. The mean DN content was 32.3 % at first sampling (silo start), 30.8 % in the silo middle and 29.3 % at the silo end. Slightly lower DM content with a mean 29.6 % DM was detected in edge section 1, i.e. right next to the silo wall, than the 30.9 % in edge section 2 (1 metre from the wall) and the 31.9 % DM in the middle of the silo (Table 3). Some rainwater probably seeped into this area, although the silage was very carefully covered with tarpaulin and undersheet. The fact that the tarpaulins were butted up against the wall certainly contributed to this. It was not possible to pull the tarpaulins over the silo wall because of the type of construction. The DM content in the silo decreased from the top downward from a mean 32.1 % DM to 31.6 % DM, to 28.8 % DM. The test results showed that the PistenBully had no effect on the DM content of the silage as expected. 3.2 Density Maize silage with around 31 % DM should have a density according to RICHTER (2009) of at least 225 kg DM/m³ and around 720 kg FM/m³. The maize unloaded by the PistenBully showed a lower compaction with an arithmetic mean of 175.4 kg DM/m³ and 574.5 kg FM/m³ (Table 3). It was around 22.1 % beneath the target of 225 kg DM/m³. The spread within the silo was high from 130 to 226 kg DM/m³ and 422 to 720 kg FM/m³ (Figure 3). Effects were noted between the layers and positions (Tables 4 and 5). The mean density was almost the same at the front (date 1) with 177 kg DM/m³, in the middle of the silo (date 2) with 174 kg DM/m³ and at the back (date 3) with 175 kg DM/m³. Thus, the harvested crop was unloaded and compacted very evenly from the back to the front in the silo. The less well compacted edge sections take a smaller proportion than the better compacted silo middle. Therefore, presentation of the arithmetic compaction calculated from the nine measured values does not sufficiently reflect the actual ratios in the silo. Consequently, a trend line (R²= 0.98) was laid through the measured values of the silo middle (Figure 4) and further compaction for each layer of 50-60 cm. As an almost even compaction was recorded with the measured values for the edges (edge 1, edge 2) at a distance of 100 cm from the wall (Figure 4), the arithmetic mean of the actual measured values was used for the compaction of the individual layers (figure 5). A weighted mean of 194.5 kg DM/m³ results from the volume shares of the individual layers and sections (Figure 5). This mean is around 13.6 % beneath the target of 225 kg DM/m³.

7
Figure 3: The target range of well-compacted silage depending on the DM content and actually measured values of maize silage in different sections of the silo.
120 130 140 150 160 170 180 190 200 210 220 230 240 250
18 19 20 21 22 23 24 25 26 27 28 29 30 31 32 33 34 35
DM %
kg DM/m³
161.4
146.7 159.7
184.9
184.1
153.1
196.2
214.2
178.6
y = 125.59x0.0486
R2 = 0.7943
y = 109.4x0.1038
R 2 = 0.8558
y = 129.14x0,0938
R2 = 0.982
100 110 120 130 140 150 160 170 180 190 200 210 220
0 50 100 150 200 250Distance in cm from surface (top)
kg DM/m³
Edge 1 Edge 2 Silo middle
Edge 1 Edge 2 Silo middle
8
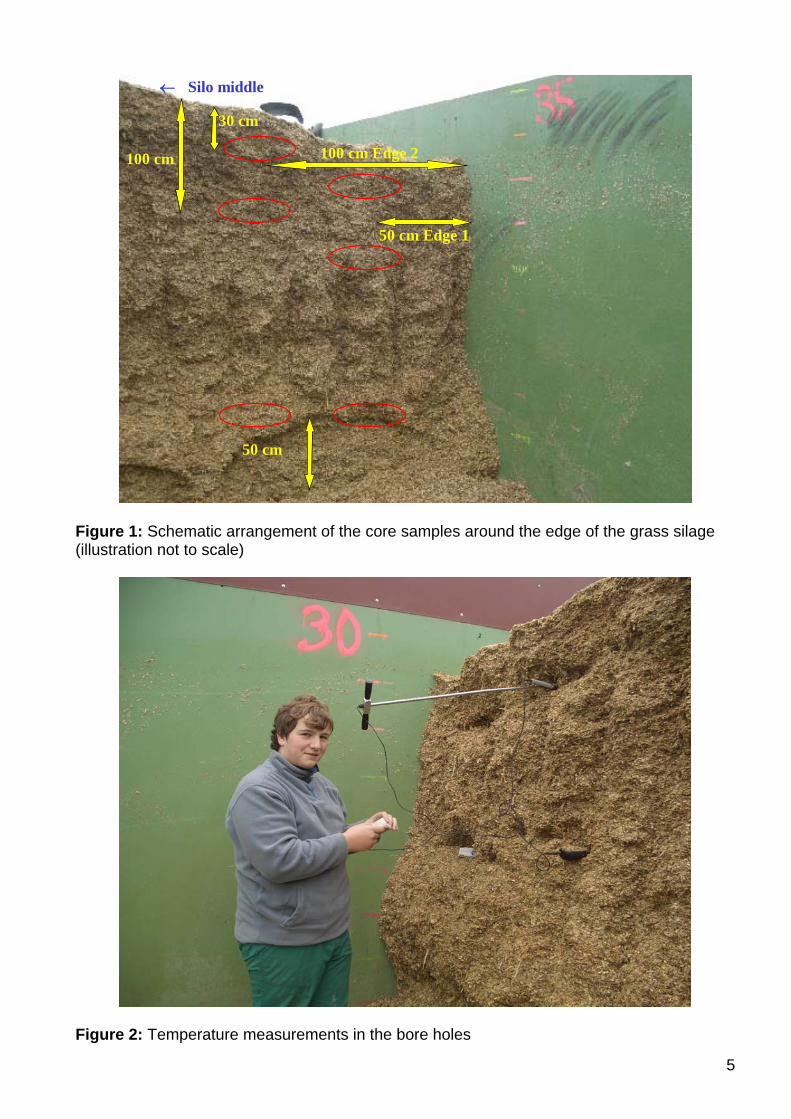
Figure 4: Density (kg DM/m³) depending on position (edge, middle) and location (distance in cm from the silo top surface). The measured values (points) and trend lines at the edge sections are shown. 50 cm 100 cm 760 cm 100 cm 50 cm
147 160 182 160 147 50 cm 157 177 194 177 157 50 cm 160 185 205 185 160 50 cm 160 185 214 185 160 50 cm 160 185 220 185 160 60 cm
Figure 5: The compaction (kg DM/m³) of the individual layers (each 50-60 cm) and sections (width of the layers) calculated from the measured values and trend lines in the silo. The evaluation and grading of the silage was effected according to Table 2. Consequently, in Figure 5 the moderately compacted (150-180 kg DM/m³) silage was shown as light blue and the well compacted (180-225 kg DM/m³) as light green. Thus, around 15 % of the maize silage was graded as moderately and 83 % as well compacted in the test. Around 2 % of the silage (upper corners) had less than 150 kg DM/m³ and was highlighted in red in Figure 5. The sampling did not reveal any very well compacted (over 225 kg DM/m³) or very poorly compacted (less than 112.5 kg DM/m³) silage. Table 2: Evaluating the compaction (kg DM/m³) in comparison to the minimum compaction of 225 kg DM/m³.
kg DM/m³ Target (225 kg DM/m³) achieved
Compaction grading
< 112.5 < 50 % Bad - - 112.5 -150 50 – 66.6 % Less good - 150 - 180 66.6 - 80 % Moderate ± 180 - 225 80 - 100 % Good +
> 225 >100 % Very good + + The lowest compaction was measured at the silo wall (edge 1) with a mean 155.9 kg DM/m³ (Table 4). The spread there ranged from 130 (-42 %) to 178 kg DM/m³ (-21 %). The compaction was around 31 % lower than the target of 225 kg DM/m³. The mean density around a metre from the silo wall (edge 2) was 174.0 kg DM/m³ and, thus, was around 23 % lower than the target. The spread in the “edge 2” section ranged from 146.5 kg DM/m³ (-35 %) to 196.3 kg DM/m³ (-13 %). The best mean compaction of 196.3 kg DM/m³ was measured in the middle of the silo. The compaction there was only around 12.5 % lower than the target of 225 kg DM/m³. The target value was almost exceeded at times in the silo middle (+ 1 %). The compaction increased from the top downward in the silo from 159.4 kg DM/m³ to 180.8 kg DM/m³ to a mean 186.0 kg DM/m³ (Table 5). Accordingly, the uppermost layer was around 29 %), layer 2 (100 cm from the top) almost 20 % and the bottom layer (50 cm from the bottom) around 17 % below the target of 225 kg DM/m³. It is worth noting that higher densities were achieved at times in the uppermost layer with 182.8 kg DM/m³ and in the second layer with 196.5 kg DM/m³.
9
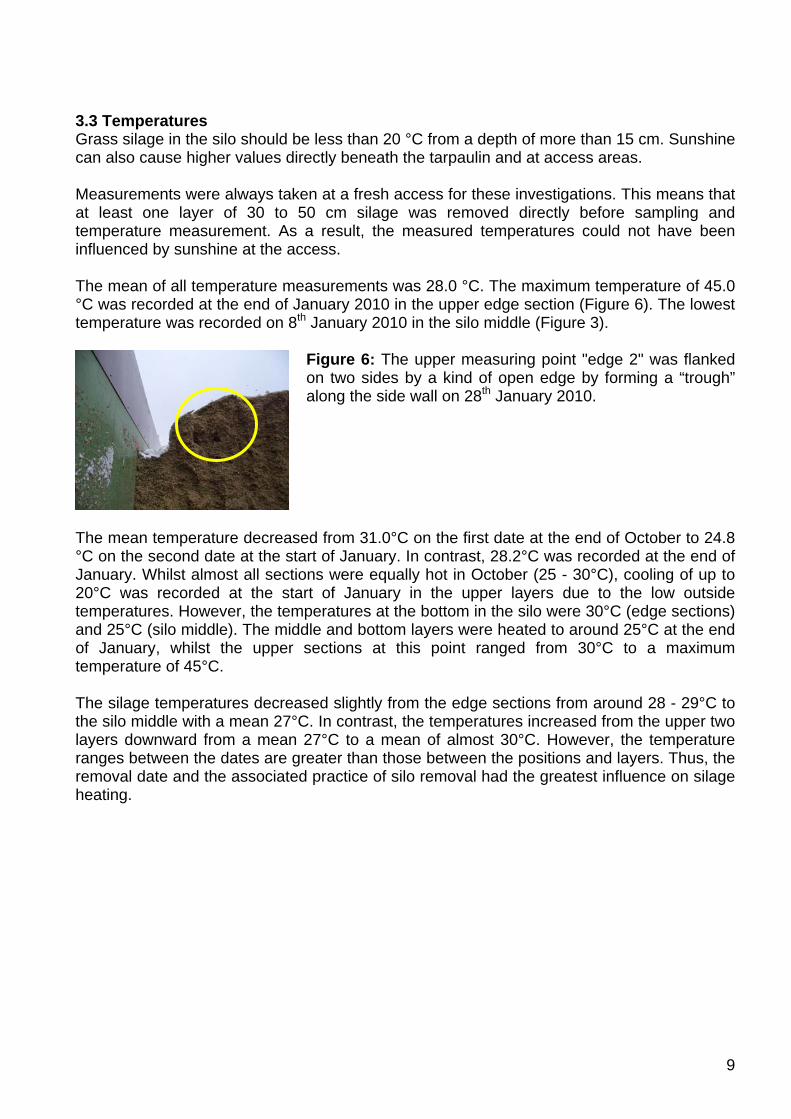
3.3 Temperatures Grass silage in the silo should be less than 20 °C from a depth of more than 15 cm. Sunshine can also cause higher values directly beneath the tarpaulin and at access areas. Measurements were always taken at a fresh access for these investigations. This means that at least one layer of 30 to 50 cm silage was removed directly before sampling and temperature measurement. As a result, the measured temperatures could not have been influenced by sunshine at the access. The mean of all temperature measurements was 28.0 °C. The maximum temperature of 45.0 °C was recorded at the end of January 2010 in the upper edge section (Figure 6). The lowest temperature was recorded on 8th January 2010 in the silo middle (Figure 3).
Figure 6: The upper measuring point "edge 2" was flanked on two sides by a kind of open edge by forming a “trough” along the side wall on 28th January 2010.
The mean temperature decreased from 31.0°C on the first date at the end of October to 24.8 °C on the second date at the start of January. In contrast, 28.2°C was recorded at the end of January. Whilst almost all sections were equally hot in October (25 - 30°C), cooling of up to 20°C was recorded at the start of January in the upper layers due to the low outside temperatures. However, the temperatures at the bottom in the silo were 30°C (edge sections) and 25°C (silo middle). The middle and bottom layers were heated to around 25°C at the end of January, whilst the upper sections at this point ranged from 30°C to a maximum temperature of 45°C. The silage temperatures decreased slightly from the edge sections from around 28 - 29°C to the silo middle with a mean 27°C. In contrast, the temperatures increased from the upper two layers downward from a mean 27°C to a mean of almost 30°C. However, the temperature ranges between the dates are greater than those between the positions and layers. Thus, the removal date and the associated practice of silo removal had the greatest influence on silage heating.

10
Table 3: Test results, arranged by the sampling date
DMc Density Temp.°C at measured
depth Date Position Location % kg FM/m² kg DM/m³ 15 cm 50 cm 150 cm
20.10.2009 Edge 1 30 cm from the
top 33.5 331.4 148.9 28.4 27.3 28.7
Edge 1 100 cm from the
top 32.8 390.2 160.0 33.1 32.6 33.2
Edge 1 50 cm from the
bottom 31.8 486.2 177.6 34.9 33.9 34.8
Edge 2 30 cm from the
top 30.6 401.4 156.5 27.5 26.5 25.9
Edge 2 100 cm from the
top 33.8 481.1 183.0 33.7 32.5 33.0
Edge 2 50 cm from the
bottom 32.3 531.4 188.8 32.1 31.1 31.6
Silo middle30 cm from the
top 31.5 500.2 179.5 30.3 30.2 32.7
Silo middle100 cm from the
top 34.0 537.5 196.2 33.5 33.0 33.5
Silo middle50 cm from the
bottom 30.8 621.9 202.1 28.3 27.4 26.7 Date 1 n=9 Mean 32.3 475.7 177.0 31.3 30.5 31.1
Min 30.6 331.4 148.9 27.5 26.5 25.9 Max 34.0 621.9 202.1 34.9 33.9 34.8
08.01.2010 Edge 1 30 cm from the
top 30.8 267.8 130.0 22.0 18.4 14.0
Edge 1 100 cm from the
top 31.0 442.9 166.2 23.9 24.8 23.7
Edge 1 50 cm from the
bottom 28.3 459.6 161.5 31.6 34.4 34.8
Edge 2 30 cm from the
top 31.2 345.0 146.5 17.9 20.3 20.0
Edge 2 100 cm from the
top 31.1 517.4 181.9 28.0 27.7 27.4
Edge 2 50 cm from the
bottom 30.4 601.4 196.3 31.9 32.7 33.3
Silo middle30 cm from the
top 31.7 467.1 173.4 20.4 15.7 12.2
Silo middle100 cm from the
top 32.0 569.7 195.8 26.6 25.3 24.4
Silo middle50 cm from the
bottom 30.7 684.8 214.2 25.5 26.3 26.2 Date 2 n=9 Mean 30.8 484.0 174.0 25.3 25.1 24.0
Min 28.3 267.8 130.0 17.9 15.7 12.2 Max 32.0 684.8 214.2 31.9 34.4 34.8
28.01.2010 Edge 1 30 cm from the
top 34.9 372.0 161.2 27.7 31.8 32.3 Edge 1 100 cm from the 23.7 528.2 158.0 19.2 20.7 22.5
11
top
Edge 1 50 cm from the
bottom 19.6 496.5 139.9 28.6 29.4 32.9
Edge 2 30 cm from the
top 32.4 377.1 156.1 45.0 39.6 39.4
Edge 2 100 cm from the
top 32.9 525.4 189.6 20.5 20.9 21.3
Edge 2 50 cm from the
bottom 23.6 588.3 167.2 25.9 28.5 30.3
Silo middle30 cm from the
top 32.0 507.7 182.8 31.6 31.0 29.2
Silo middle100 cm from the
top 33.0 555.7 196.5 25.8 26.5 27.1
Silo middle50 cm from the
bottom 31.4 726.8 226.2 24.5 24.7 24.2 Date 3 n=9 Mean 29.3 519.7 175.3 27.7 28.1 28.8
Min 19.6 372.0 139.9 19.2 20.7 21.3 Max 34.9 726.8 226.2 45.0 39.6 39.4
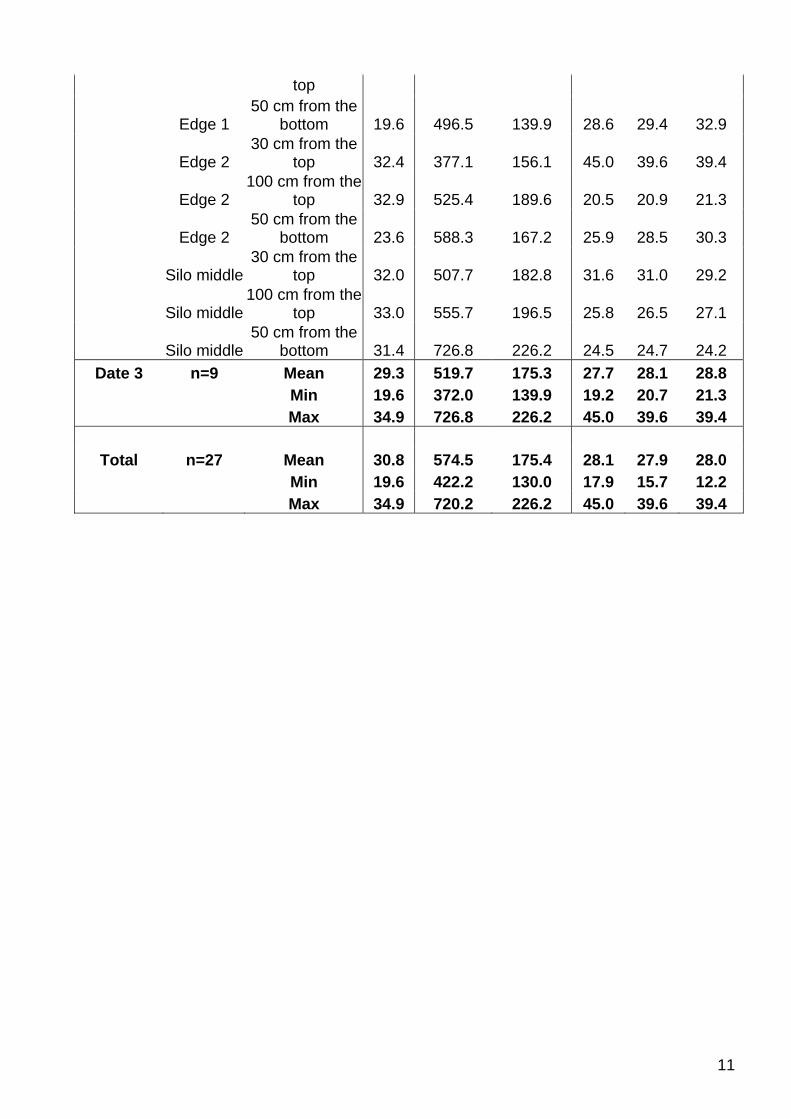
Total n=27 Mean 30.8 574.5 175.4 28.1 27.9 28.0 Min 19.6 422.2 130.0 17.9 15.7 12.2 Max 34.9 720.2 226.2 45.0 39.6 39.4

12
Table 4: Test results, arranged by the sampling positions
DMc Density Temp.°C at measured
depth Date Position Location % kg FM/m² kg DM/m³ 15 cm 50 cm 150 cm
20.10.2009 Edge 1 30 cm from the
top 33.5 444.2 148.9 28.4 27.3 28.7
Edge 1 100 cm from the
top 32.8 488.0 160.0 33.1 32.6 33.2
Edge 1 50 cm from the
bottom 31.8 558.5 177.6 34.9 33.9 34.8
08.01.2010 Edge 1 30 cm from the
top 30.8 422.2 130.0 22.0 18.4 14.0
Edge 1 100 cm from the
top 31.0 536.0 166.2 23.9 24.8 23.7
Edge 1 50 cm from the
bottom 28.3 570.1 161.5 31.6 34.4 34.8
28.01.2010 Edge 1 30 cm from the
top 34.9 462.1 161.2 27.7 31.8 32.3
Edge 1 100 cm from the
top 23.7 668.1 158.0 19.2 20.7 22.5
Edge 1 50 cm from the
bottom 19.6 712.6 139.9 28.6 29.4 32.9 n=9 Edge 1 Mean 29.6 540.2 155.9 27.7 28.1 28.5
Min 19.6 422.2 130.0 19.2 18.4 14.0 Max 34.9 712.6 177.6 34.9 34.4 34.8
20.10.2009 Edge 2 30 cm from the
top 30.6 512.2 156.5 27.5 26.5 25.9
Edge 2 100 cm from the
top 33.8 540.8 183.0 33.7 32.5 33.0
Edge 2 50 cm from the
bottom 32.3 584.7 188.8 32.1 31.1 31.6
08.01.2010 Edge 2 30 cm from the
top 31.2 470.0 146.5 17.9 20.3 20.0
Edge 2 100 cm from the
top 31.1 584.2 181.9 28.0 27.7 27.4
Edge 2 50 cm from the
bottom 30.4 645.2 196.3 31.9 32.7 33.3
28.01.2010 Edge 2 30 cm from the
top 32.4 482.4 156.1 45.0 39.6 39.4
Edge 2 100 cm from the
top 32.9 576.4 189.6 20.5 20.9 21.3
Edge 2 50 cm from the
bottom 23.6 708.3 167.2 25.9 28.5 30.3 n=9 Edge 2 Mean 30.9 567.1 174.0 29.2 28.9 29.1
Min 23.6 470.0 146.5 17.9 20.3 20.0 Max 33.8 708.3 196.3 45.0 39.6 39.4

13
20.10.2009 Silo
middle 30 cm from the
top 31.5 570.2 179.5 30.3 30.2 32.7
Silo
middle 100 cm from the
top 34.0 576.9 196.2 33.5 33.0 33.5
Silo
middle 50 cm from the
bottom 30.8 655.5 202.1 28.3 27.4 26.7
08.01.2010 Silo
middle 30 cm from the
top 31.7 546.3 173.4 20.4 15.7 12.2
Silo
middle 100 cm from the
top 32.0 612.3 195.8 26.6 25.3 24.4
Silo
middle 50 cm from the
bottom 30.7 698.3 214.2 25.5 26.3 26.2
28.01.2010 Silo
middle 30 cm from the
top 32.0 571.0 182.8 31.6 31.0 29.2
Silo
middle 100 cm from the
top 33.0 595.8 196.5 25.8 26.5 27.1
Silo
middle 50 cm from the
bottom 31.4 720.2 226.2 24.5 24.7 24.2
n=9 Silo
middle Mean 31.9 616.3 196.3 27.4 26.7 26.3 Min 30.7 546.3 173.4 20.4 15.7 12.2 Max 34.0 720.2 226.2 33.5 33.0 33.5

14
Table 5: Test results, arranged by the sampling layers
DMc Density Temp.°C at measured
depth Date Position Location % kg FM/m² kg DM/m³ 15 cm 50 cm 150 cm
20.10.2009 Edge 1 30 cm from the top 33.5 444.2 148.9 28.4 27.3 28.7
Edge 2 30 cm from the top 30.6 512.2 156.5 27.5 26.5 25.9
Silo middle30 cm from the top 31.5 570.2 179.5 30.3 30.2 32.7
08.01.2010 Edge 1 30 cm from the top 30.8 422.2 130.0 22.0 18.4 14.0
Edge 2 30 cm from the top 31.2 470.0 146.5 17.9 20.3 20.0
Silo middle30 cm from the top 31.7 546.3 173.4 20.4 15.7 12.2
28.01.2010 Edge 1 30 cm from the top 34.9 462.1 161.2 27.7 31.8 32.3
Edge 2 30 cm from the top 32.4 482.4 156.1 45.0 39.6 39.4
Silo middle30 cm from the top 32.0 571.0 182.8 31.6 31.0 29.2
n=9 Mean 30 cm from the top 32.1 497.8 159.4 27.9 26.7 26.0
Min 30.6 422.2 130.0 17.9 15.7 12.2 Max 34.9 571.0 182.8 45.0 39.6 39.4
20.10.2009 Edge 1 100 cm from the top 32.8 488.0 160.0 33.1 32.6 33.2
Edge 2 100 cm from the top 33.8 540.8 183.0 33.7 32.5 33.0
Silo middle100 cm from the top 34.0 576.9 196.2 33.5 33.0 33.5
08.01.2010 Edge 1 100 cm from the top 31.0 536.0 166.2 23.9 24.8 23.7
Edge 2 100 cm from the top 31.1 584.2 181.9 28.0 27.7 27.4
Silo middle100 cm from the top 32.0 612.3 195.8 26.6 25.3 24.4
28.01.2010 Edge 1 100 cm from the top 23.7 668.1 158.0 19.2 20.7 22.5
Edge 2 100 cm from the top 32.9 576.4 189.6 20.5 20.9 21.3
Silo middle100 cm from the top 33.0 595.8 196.5 25.8 26.5 27.1
n=9 Mean 100 cm from the top 31.6 575.4 180.8 27.2 27.1 27.3
Min 23.7 488.0 158.0 19.2 20.7 21.3 Max 34.0 668.1 196.5 33.7 33.0 33.5

15
20.10.2009 Edge 1 50 cm from the bottom 31.8 558.5 177.6 34.9 33.9 34.8
Edge 2 50 cm from the bottom 32.3 584.7 188.8 32.1 31.1 31.6
Silo middle50 cm from the bottom 30.8 655.5 202.1 28.3 27.4 26.7
08.01.2010 Edge 1 50 cm from the bottom 28.3 570.1 161.5 31.6 34.4 34.8
Edge 2 50 cm from the bottom 30.4 645.2 196.3 31.9 32.7 33.3
Silo middle50 cm from the bottom 30.7 698.3 214.2 25.5 26.3 26.2
28.01.2010 Edge 1 50 cm from the bottom 19.6 712.6 139.9 28.6 29.4 32.9
Edge 2 50 cm from the bottom 23.6 708.3 167.2 25.9 28.5 30.3
Silo middle50 cm from the bottom 31.4 720.2 226.2 24.5 24.7 24.2
n=9 Mean 50 cm from the bottom 28.8 650.4 186.0 29.3 29.8 30.5
Min 19.6 558.5 139.9 24.5 24.7 24.2 Max 32.3 720.2 226.2 34.9 34.4 34.8

16
3.4. Feed value The feed value of the maize silage decreased over the course of feeding from date 1 to date 3 (Figure 6). The crude ash content remained almost the same regardless of date, location and position. In contrast, the crude fibre content increased, whilst the crude protein and energy content decreased. Thus, the crude fibre content clearly increased from unloading (Table 1) from a mean 21.7 % in DM to 23.0 % in DMc at date 1 to 24.9 % in DMc at date 2 and especially at date 3 to 26.3 % in DMc. Accordingly, the energy content decreased from 6.4 on unloading to 6.2 (date 1) to 6.0 (date 2) and 5.9 MJ NEL/kg DM (date 3). The crude protein content decreased slightly in the same period from a mean 6.6 to 5.7 % in DMc. This is due to the increasing ammonia content, which signals a protein breakdown in some areas. In addition to the main “date” effect, the influence of layering on the feed value must also be noted. The content of crude protein and energy decreased from the top downward and the content of crude fibre increased in the opposite direction (Table 6). The influence of position (edge, middle) is insignificant on the feed value. For example, the crude fibre content remained at around a mean 25 % in DMc at all positions. The crude protein content ranged from 6.2 (edge 1) to 6.5 % in DMc in the silo middle. The mean energy content at all positions was always precisely 6.0 MJ NEL/kg DM. 16 maize silage records from the “Westlicher Bodensee” area were available for comparison from the Aulendorf “Fodder Report” from 2009. These showed a higher mean DM content by almost 5 %, less crude fibre (18.4 % compared to 24.7 % in DM) and higher energy content (6.6 compared to 6.0 MJ NEL/kg DM) (Table 7). 3.5 Fermentation quality Mould formation and reheating can occur if silage is not optimally compacted. No swabs were taken sensorially on the first date in October and neither mould formation nor decay were observed. Mould cavities up to 10 cm thick appeared in the upper section at the edge and in the silo middle at the start of January after the "feeding break". At the same time, a mouldy and “burnt” odour was detected, which indicates reheating. An unpleasant, slightly manure-like odour was detected at the last sampling at the end of January in the edge section (edge 1 and 2). The odour was mainly pleasant in the silo middle. Mould was registered everywhere in the uppermost layer on this date and the maize silage in the lower section was a light yellow colour, which indicates an increase in moisture. The maize silage was well fermented with a mean pH value of 4.1. The highest pH value was recorded at the end of January (date 3) at the edge (Table 6). Consequently, these measuring points were also outside the critical pH value (Figure 6). All other silage was well fermented. The maize silage from the silo middle had lower pH values and optimum DM content. A reduction from the outside inward was recorded within the silo from a mean 4.2 (edge 1) to 4.0 (edge 2) to 3.9 in the silo middle. The pH values decreased slightly from the top downward from 4.2 to 4.0. The reduction in the pH value from the outside inward and from the top downward is due to lactic acid levels. These increased from the outside (edge 1) inward from a mean 3.0 % in DMc to 3.7 % in DMc (edge 2) to 4.7 % in DMc in the silo middle, and from the top downward from a mean 3.5 % in DMc to 3.9 % in DMc to 4.0 % in DMc at the bottom of the silo. However, the lactic acid content was more greatly affected by the sampling dates. The maize silage still had a mean 4.3 – 4.4 % in DMc lactic acid at the first two samplings. The mean content reduced by the end of January (date 3) to 2.6 % in DMc.

17
In contrast, the acetic acid content increased slightly from the end of October to the end of January from 1.2 to 1.5 % in DMc. A decrease, albeit a small one, was recorded from the outside (edge 1 and 2) from a mean 1.4 to 1.5 % in DMc to the silo middle with a mean 1.1 % in DMc. Somewhat higher acetic acid content was detected at the bottom of the silo with a mean 1.8 % in DMc compared to the top with a mean 1.0 to 1.2 % in DMc.
Figure 6: Grading the fermentation quality of the silage by DM content and pH value. The ideal is silage that is beneath the “critical pH value” (black line) and between 30 and 40 % DM. Butyric acid was only detected in small volumes at the final sampling at the end of January in the edge section (edge 1 and 2) and in the bottom layer with 0.3 to 0.4 % in DMc. In contrast, around a third of the silage had increased ammonia levels and most of these samples came from the final date (Table 6). The proportion of ammonia nitrogen in the total nitrogen should not exceed 10 % in good silage. A mean of 9.9 % was achieved in the silage, with the proportion increasing from date 1 with a mean 6.0 % (“unremarkable”) to 10.0 % (date 2) to a mean 13.6 % (“raised”) on date 3. The highest proportion of 27.2 % was recorded on the third date at the outside (edge 1) at the bottom of the silo, which again corresponds to the butyric acid content. The ammonia content increased from the outside (10.8 %) inward (9.0 %) and from the top (8.7 %) downward (11.1 %) Following page: Table 6: Feed value and fermentation quality in the maize silage, arranged by sampling date
3,6 3,7 3,8 3,9 4,0 4,1 4,2 4,3 4,4 4,5 4,6 4,7 4,8 4,9 5,0
20 25 30 35 40 45DM %
Edge 1Edge 2Silo middle
pH-value

18
Date Position Location DMc CP CF CA Energy MJ/kg DM pH NH3N:Nt Lactic acid Acetic acid Butyric acid Ethanol Sugar % % in DMc ME NEL % % in DMc
20.10.09 Edge 1 30 cm from the top 34.4 6.9 19.0 3.5 11.0 6.6 4.3 5.9 3.7 1.0 0.0 1.4 0.3
Edge 1 100 cm from the top 33.7 6.9 21.9 3.8 10.5 6.3 4.1 6.6 4.4 0.7 0.0 1.8 1.2
Edge 1 50 cm from the bottom 32.8 6.6 22.9 3.1 10.4 6.2 4.0 6.1 4.7 1.9 0.0 1.0 1.6
Edge 2 30 cm from the top 31.8 6.8 23.6 4.2 10.2 6.0 4.1 5.8 5.2 2.4 0.0 1.0 0.5
Edge 2 100 cm from the top 34.4 6.9 23.0 3.9 10.4 6.2 4.1 6.5 4.3 0.9 0.0 0.6 2.8
Edge 2 50 cm from the bottom 33.0 6.3 23.4 3.1 10.4 6.2 4.0 5.6 4.5 1.0 0.0 0.9 2.6
Silo middle
30 cm from the top 32.1 6.6 24.1 4.1 10.2 6.1 4.1 5.5 3.4 0.7 0.0 0.9 0.9
Silo middle
100 cm from the top 34.6 6.7 23.8 3.2 10.3 6.1 4.0 5.1 3.5 0.7 0.0 0.8 1.0
Silo middle
50 cm from the bottom 31.9 5.8 25.5 4.1 9.9 5.9 4.1 6.5 5.2 1.2 0.0 1.7 1.6
20.10.09 n=9 Mean 33.2 6.6 23.0 3.6 10.4 6.2 4.1 6.0 4.3 1.2 0.0 1.1 1.4 Min 31.8 5.8 19.0 3.1 9.9 5.9 4.0 5.1 3.4 0.7 0.0 0.6 0.3 Max 34.6 6.9 25.5 4.2 11.0 6.6 4.3 6.6 5.2 2.4 0.0 1.8 2.8
08.01.10 Edge 1 30 cm from the top 31.2 6.8 25.3 4.2 10.0 5.9 4.6 7.4 2.4 0.5 0.0 0.5 0.6
Edge 1 100 cm from the top 31.8 7.1 22.6 4.1 10.4 6.2 4.0 10.2 4.9 0.9 0.0 1.0 0.2
Edge 1 50 cm from the bottom 29.5 6.2 25.4 4.3 9.9 5.8 4.5 5.9 1.6 3.2 0.0 0.4 0.2
Edge 2 30 cm from the top 31.8 6.6 23.0 4.0 10.4 6.2 4.1 10.1 4.2 1.0 0.0 0.5 0.3
Edge 2 100 cm from the top 31.8 6.7 25.5 4.1 10.0 5.9 4.0 11.9 4.9 1.3 0.0 0.4 0.1
Edge 2 50 cm from the bottom 31.1 5.8 27.8 3.9 9.7 5.7 4.0 13.8 4.5 1.2 0.0 0.5 0.2
Silo middle
30 cm from the top 32.3 6.8 23.9 3.4 10.3 6.1 4.0 9.4 3.9 0.9 0.0 0.6 0.2
Silo middle
100 cm from the top 32.7 6.8 24.9 3.8 10.1 6.0 3.9 10.8 5.6 1.3 0.0 0.4 0.1
Silo middle
50 cm from the bottom 31.7 6.6 25.8 3.8 9.9 5.9 3.8 10.7 8.0 1.1 0.0 1.6 1.4
08.01.10 n=9 Mean 31.5 6.6 24.9 3.9 10.1 6.0 4.1 10.0 4.4 1.3 0.0 0.7 0.4

19
Min 29.5 5.8 22.6 3.4 9.7 5.7 3.8 5.9 1.6 0.5 0.0 0.4 0.1 Max 32.7 7.1 27.8 4.3 10.4 6.2 4.6 13.8 8.0 3.2 0.0 1.6 1.4
28.01.10 Edge 130 cm from the
top 35.8 6.8 20.3 3.0 10.8 6.5 4.2 10.8 2.7 1.3 0.0 1.0 0.7
Edge 1 100 cm from the top 24.2 4.5 29.7 2.1 9.6 5.6 4.1 16.8 1.2 1.5 0.1 0.6 0.1
Edge 1 50 cm from the bottom 20.5 3.8 36.6 1.5 8.6 4.9 3.9 27.2 1.1 2.5 0.4 0.8 0.1
Edge 2 30 cm from the top 33.0 6.4 23.3 3.8 10.3 6.1 4.1 10.0 2.0 1.3 0.0 0.4 0.2
Edge 2 100 cm from the top 33.6 6.2 23.5 3.0 10.4 6.2 4.0 10.7 2.3 0.7 0.0 1.2 0.5
Edge 2 50 cm from the bottom 24.7 4.4 30.0 2.4 9.4 5.5 3.9 13.9 1.6 2.7 0.3 1.1 0.1
Silo middle
30 cm from the top 33.0 6.3 23.2 4.1 10.3 6.1 3.9 13.2 3.8 1.5 0.0 1.2 0.2
Silo middle
100 cm from the top 33.9 6.6 22.8 3.5 10.4 6.2 3.9 10.0 4.4 1.1 0.0 1.1 0.1
Silo middle
50 cm from the bottom 32.3 6.0 27.0 3.8 9.8 5.7 3.8 10.0 4.5 1.2 0.0 1.1 0.6
28.01.10 n=9 Mean 30.1 5.7 26.3 3.0 10.0 5.9 4.0 13.6 2.6 1.5 0.1 0.9 0.3 Min 20.5 3.8 20.3 1.5 8.6 4.9 3.8 10.0 1.1 0.7 0.0 0.4 0.1 Max 35.8 6.8 36.6 4.1 10.8 6.5 4.2 27.2 4.5 2.7 0.4 1.2 0.7 Table 7: Comparison of feed value and fermentation quality of maize silage from the test with comparative values from the "Fodder Report Baden-Württemberg 2009” database. Pfullendorf is part of the “Westlicher Bodensee” reference area.
Type DMC CP CF CA Energy MJ/kg DM pH NH3N:Nt Lactic acid Acetic acid Butyric acid Ethanol Sugar % % in DMc ME NEL % % in DMc
Biogas n=27 Mean 31.6 6.3 24.7 3.5 10.1 6.0 4.1 9.9 3.8 1.3 0.0 0,9 0,7 Silage Min 20.5 3.8 19.0 1.5 8.6 4.9 3.8 5.1 1.1 0.5 0.0 0,4 0,1
Max 35.8 7.1 36.6 4.3 11.0 6.6 4.6 27.2 8.0 3.2 0.4 1,8 2,8 Cf “Westl. Bodensee” (n=16) 35.2 7.4 18.4 3.6 11.1 6.7

The mean ethanol content was 0.9 % in DMc with a spread of 0.4 to 1.8 % in DMc. No influence by date, position or location (layer) of the sample was detected. The levels only fluctuated from 0.7 to 101 % in DMc between the end of October and the end of January, from 0.7 to 1.0 % in DMc between the outside and inside of the silo and from 0.8 to 1.0 % in DMc from the top downward. The highest ethanol content of 1.8 % in DMc was recorded at the end of October in the edge section. The maize silage had a low residual sugar content of a mean 0.7 % in DMc. The spread ranged from 0.1 to 2.8 % in DMc. Despite this, the silage was very well fermented (Figure 6) with exceptions (3rd date in edge section). No loss in fermentation substrate was detected. However, the sampling date did have an effect. The residual sugar content decreased from date 1 from a mean 1.4 % in DMc to 0.4 % in DMc (date 2) to 0.3 % in DMc (date 3). Somewhat lower content was detected right next to the wall with a mean 0.5 % in DMc than at edge 2 (100 cm from the edge) and in the silo middle with 0.7 to 0.8 % in DMc. A slight increase was also noted from the top (0.4 % in DMc) downward (0.7 - 0.9 % in DMc). 4. Evaluating the results The starting material had moderate to easy silage ability with a fermentability coefficient (FC) of 38.1, but the FC was below the standard values for silo maize of 50 to 60. The delayed sowing (20th - 25th May) after the harvest of the preceding green rye crop and possibly the variety choice (silo maturity no.) and the time of harvest had an effect on the quality of the silo maize. A mean dry mass of 31.1 % was achieved, but the spread ranged from 23.8 to 37.6 %. The maturity of the maize plants differed widely, which could also be seen in the starch contents of 28.1 to 35.9 % in DM. Thus, the mean starch content of 32.5 % in DM on harvesting was lower than the starch content of maize silage for feeding from the “Westlicher Bodensee” region, which recorded 33.9 % starch in DM. However, the low pH values indicate that the fermentation substrate for very good fermentation was sufficient, even though the residual sugar content was at a low level. The differences in DM content on harvesting were also noted in the silage with a mean 30.8 % DM and a spread of 19.6 to 34.9 % DM, where the spread was greater at the bottom. Some fermentation liquid was produced due to the differing maturity levels of the harvested crop. Therefore, the silage in the bottom area of the silo also has a lower DM content and increasing light yellow colouration, which indicates a liquid blockage in the silage. In terms of DM content, it should be noted that the bunker silo was filled in even layers from the back to the front. Slightly lower DM content with a mean 29.6 % DM was detected right next to the silo wall, than 1 metre from the wall (30.9 % DM) and in the middle of the silo (31.9 % DM). Some rainwater probably seeped into this area, although the silage was very carefully covered with tarpaulin and undersheet. The fact that the tarpaulins were butted up against the wall certainly contributed to this. It was not possible to pull the tarpaulins over the silo wall because of the type of construction. This influence increased the longer the silage was stored. These effects are not due to use of the PistenBully. Maize silage with around 31 % DM should have a density according to RICHTER (2009) of at least 225 kg DM/m³ and around 715 kg FM/m³. The maize silage spread by the PistenBully had a lower compaction with a weighted mean of 194.5 kg DM/m³. It was around 13.6 % beneath the target of 225 kg DM/m³.

21
The spread within the silo was high from 130 to 226 kg DM/m³ and 422 to 720 kg FM/m³. Effects between the layers and positions and, thus, influences by the PistenBully were noted. The mean density was almost the same at the front (date 1) with 177 kg DM/m³, in the middle of the silo (date 2) with 174 kg DM/m³ and at the back (date 3) with 175 kg DM/m³. Thus, the harvested crop was unloaded and compacted very evenly from the back to the front in the silo. The lowest compaction was measured at the silo wall with a mean 155.9 kg DM/m³ (-31 %). The mean density around a metre from the silo wall was 174.0 kg DM/m³ and, thus, was around 23 % lower than the target. The best mean compaction of 196.3 kg DM/m³ was measured in the middle of the silo. The compaction there was only around 12.5 % lower than the target of 225 kg DM/m³. The target value was almost exceeded at times in the silo middle (+ 1 %). Accordingly, the PistenBully was in a position to compact this area better than the edge zone. The fact that the PistenBully was not able to drive along directly and parallel to the silo wall because of the overhanging blade had a negative effect. The edge zone was regularly compacted though by reversing along the wall. However, this was insufficient to achieve optimum compaction right at the wall. As a result, thought should be given to how the blade can be constructed so that the PistenBully is able to drive along directly and parallel to the silo wall and compact accordingly. The fact that the silo in this test was relatively narrow also made things difficult. All tippers were weighed by the DLG test centre on unloading and the volume of the filled silo was measured by an independent surveyor. A mean compaction of 213 kg DM/m³ resulted from the overall tonnage of 870 tonnes of fresh mass and the overall volume of 1,270 m³ and the individual DM content of each tipper load (mean value 31.1 % DM). This density is around 5 % beneath the target of 225 kg DM/m³. It was achieved when sampling the maize silage in the silo middle from a depth of around one metre, but not in the weighted mean of the whole silo with 194.5 kg DM/m³. Several things may be responsible for this. It should be noted that sampling with boring stock only produces a relatively small (45 mm x 450 mm) and, above all, point-like sample. Small quantitative displacements in the boring stock can clearly affect calculations on a cubic metre of silage. Three borings were used per measuring point in an attempt to counter this. However, it remains possible that the type of sampling has affected the overall result. If a fluctuation range of 5 to 10 % is assumed because of the method used, the recorded densities are within the range of the recorded overall compaction. The unavoidable fermentation losses, which amount to at least 7.5 % in ideal conditions and may also be higher than 10 % in practice, are also a factor. Additionally, fermentation losses also occurred in sections with less than 28 % DM. The DM content was less than 28 % for 11 of the 80 loads (14 %) and was less than 30 % DM for 31 of the 80 loads (38 %). If the effects of the PistenBully on the different zones in the silo are taken into account, however, then the comparison of the densities with one another is significant in any case. Accordingly, the edge sections are less well compacted than the samples from the silo middle. Despite this, the less well compacted areas (less than 150 kg DM/m³) account for a maximum 2 % of the silo volume (upper edge section). Around 15 % of the silo was moderately compacted (150 - 180 kg DM/m³) and around 83 % was well compacted silage (180 - 225 kg DM/m³). The sampling did not reveal any very well compacted (over 225 kg DM/m³) or very poorly compacted (less than 112.5 kg DM/m³) silage. The increase in compaction from the top downward from a mean 159.4 kg DM/m³ (minus 29 %) to 180.8 kg DM/m³ (minus 20 %) to a mean 186.0 kg DM/m³ (minus 17 %) is seen in any silo with a similar method. This is because the lower layers are traversed more frequently. This can be countered in practice by longer rerolling. In addition, it should be considered
22
whether an additional rolling vehicle (e.g. wheel loader) ought to be used in the upper third of the silo in future when the output is high. Decay occurred in the maize silage in the edge section from the second sampling date. Mould cavity formation was detected from the start of January everywhere in the uppermost layer (up to 10 cm thickness). At the same time, a mouldy and “burnt” odour was detected, which indicates reheating. No mould was detected in the deeper layers. The temperature of silage should not exceed 20 °C except for sections exposed to direct sunlight (silo access) and directly beneath the heated tarpaulin (in summer). The mean of all temperature measures was too high at 28.0 °C and, thus, reheating was detected. The maximum temperature of 45.0 °C was recorded at the end of January 2010 in the surrounding air in the upper edge section despite the minus temperatures. The lowest temperature was recorded on 8th January 2010 in the silo middle. Only around 23 % of all measured values were beneath 25 °C and only 8.6 % were in the desired range of less than 20 °C. Almost half (44.7 %) of all measured temperatures were over 30 °C, around a third were in the range between 25 and 30 °C, although the mean compaction was only 13.6 % beneath the target. Accordingly, other factors had contributed to the silage reheating. The immediate opening of the silo definitely had a negative effect. Airtight sealing for at least 4 to 6 weeks would definitely have improved aerobic stability. This is demonstrated by the fact that the highest mean temperature of 31.0 °C was recorded after just three weeks (end October) and this was recorded almost evenly across all measuring points. The decreasing outside temperature and the good rate of three to four metres per week (depending on fill level) then had a positive effect. Unfortunately, removal from the middle of December to the start of January was interrupted by the storage of turkey manure directly in front of the open access. This break had a negative effect particularly in the upper, less well compacted areas. A mean of 24.8 °C was recorded at the start of January and then 28.2 °C at the end of January. The somewhat lower temperature at the start of January is due to the heat emission from the upper layers. Temperatures less than 20 °C were recorded at times there. However, the temperatures at the bottom in the silo were over 30 °C at this time. The heating then continued until the end of January and achieved a mean over 30 °C and maximum values in some areas of up to 45 °C. A deep trough along the side wall in the edge area was also observed at the end of January. Thus, the upper measuring point “edge 2” was surrounded on two sides by a kind of open edge. The reheating in the maize silage certainly benefited from the low compaction in the edge area, but the main cause of the unwanted increase in temperatures was the immediate opening and the removal interruption. Consequently, the unfavourable removal timetable is not due to the PistenBully. The nutritional value of the maize silage decreased over the course of feeding from date 1 to date 3. The crude ash content remained almost the same regardless of date, location and position. In contrast, the crude fibre content increased, whilst the crude protein and energy content decreased. The energy content decreased from 6.4 on unloading to 6.2 (date 1) to 6.0 (date 2) and 5.9 MJ NEL/kg DM (date 3). In addition to the main “date” effect, the influence of layering on the feed value must also be noted. Thus, the crude protein and energy content increased from the top downward, whilst the crude fibre content decreased in the opposite direction. The decline in feed value is due to two effects. On the one hand, easily available carbohydrates were respirated by the heating, which was clearly detected in the reduction in residual sugar content and the decreasing energy content. At the same time, the structure carbohydrates (crude fibre) were enriched. These effects can be seen in the higher temperatures at the edge area. On the other hand, lactic acid breakdown occurred in

23
the upper layers, especially where water had penetrated at the edge and where there was liquid blockage (light yellow maize silage). Some sections were sampled with less than 20 % DM. This process took place partially in the lower edge section and can be seen in the increasing ammonia content and in the occurrence of butyric acid. Ammonia is produced when protein breaks down and, thus, is also an indicator of a reduction in crude protein content. Accordingly, the effects on the feed value are less to do with the use of the PistenBully and more to do with the removal schedule. Despite the falling lactic acid levels, the maize silage fermentation quality was predominantly very good. The critical pH value was never exceeded except for individual edge samples in January. However, the increasing build-up of butyric acid and the accompanying increase in ammonia would have had a noticeable negative effect if the silage had been stored for longer, particularly in the rising outside temperatures. The build-up of butyric acid and ammonia benefits from rising pH values because of the breakdown of lactic acid due to reheating. It is particularly found in damper sections, but is normally rare in maize silage. Butyric acid content of more than 0.3 % in DMc is assessed as negative in the DLG key. A proportion of ammonia nitrogen of more than 10 % of the total nitrogen is undesirable. Both limit values were exceeded in the lower damp sections at the end of January. In future, therefore, the silo maize must be harvested when evenly mature (over 30 % DM) and must be hermetically sealed for at least four to six weeks. A liquid blockage must be avoided wherever possible. These factors and their effects on the maize silage quality are not due to the PistenBully. The low residual sugar content and the somewhat low fermentability (FC = 38) for silo maize underline the above conclusions with regard to time of harvest and maturity level. The ethanol levels were in the uncritical range with a mean of 0.9 % in DMc. No effect from the PistenBully was detected. 5. Summary Silo maize was harvested at Bioenergie Pfullendorf on 7th October 2009 using a chaff chopper and was exclusively spread and compacted with a PistenBully 300 (Kässbohrer) in the silo. The harvest process was recorded and captured by the DLG test centre (Groß-Umstadt). The Landwirtschaftliches Zentrum Baden-Württemberg (Aulendorf) was responsible for silo controlling. According to the DLG e.V. 871 tonnes of harvested crop (FM) were unloaded in 1,270 m³ silo space in around 8 working hours (net). This results in a mean density of 686 kg FM/m³ and 213 kg DM/m³ and a mean output of 108 t FM and 33.6 t DM/h. The cut silo maize had a mean dry substance content across all 80 tipper loads of 31.1 % on harvesting. The content of 15 of the 80 samples was investigated. These samples represented the whole harvested crop well with a mean 31.7 % DM and a spread of 27.0 to 34.9 % DM. The silo maize had a recorded 6.2 % mean crude protein, 21.7 % crude fibre and 3.6 % crude ash in the dry substance. The starch content was 32.5 % in DM on harvesting, the digestibility (Elos) 72.3 %. An energy concentration of 6.4 MJ NEL/kg DM resulted from the raw nutrients. With a fermentability coefficient of 38.1, the harvested crop ranged from moderately easy, to easy to silage. The silo was filled on one day and covered with tarpaulin on the morning of the following day. The removal and feeding in the biogas plant began immediately afterward on the following day. Removal was interrupted between the middle of December and the start of January because of temporary turkey manure storage directly in front of the access. The results can be summarised as follows:

24
1. The silo maize had moderate to easy silage ability with a fermentability coefficient
(FC) of 38.1, but the FC was below the standard values for silo maize (> 50 - 60). The delayed sowing after the harvest of the preceding green rye crop and possibly the variety choice and the time of harvest had an effect on quality.
2. The 27 silage samples had a mean 30.8 % DM (19.6 - 34.9 %) and reflect the content on unloading with a mean 31.1 % DM (23.8 - 37.6 %). In contrast, the maturity of the maize plants differed widely, which could also be seen in the starch levels (28.1 to 35.9 % in DM). The mean starch content in the harvested crop (32.5 % in DM) was beneath that of maize silage from the region (33.9 % in DM).
3. The DM content increased in the silo from the top (32.1 % DM) downward to 31.6 % DM (28.8 % DM) and this is due to the differing maturity grades of the harvested crop and the build-up of fermentation liquid. A liquid blockage occurred at times in the silo, which could be seen in a light yellow silage colouration.
4. Slightly lower DM content (29.6 % DM) was detected right next to the silo wall, than 1
metre from the wall (30.9 % DM) and in the middle of the silo (31.9 % DM). Rainwater had penetrated the silage in this area, although the silage was covered with tarpaulin. The fact that the tarpaulin was butted up against the wall certainly contributed to this.
5. The test results showed that the PistenBully had no effect on the DM content of the
silage as expected.
6. The maize silage spread by the PistenBully had a mean compaction of 194.5 kg DM/m³. Thus, it was around 13,6 % beneath the target of 225 kg DM/m³.
7. The mean compaction of 194.5 kg DM/m³ differed from the mean compaction of 213
kg DM/m³ recorded by the DLG on unloading. Causes of this are the unavoidable DM losses through fermentation liquid (between 28 - 30 % DM) and the fermentation process itself (at least 7.5 %). The DM content was less than 30 % for 31 of the 80 loads (38 %). Possible variations may also be due to the point-like and small samples using sample borer, where quantitative displacements in the boring stock can have an effect.
8. There was a large range of compaction within the silo from 130 to 226 kg DM/m³ and
effects were clear between the layers and positions. These effects are also due to use of the PistenBully. Around 83 % of all the maize silage was well (over 180 kg DM/m³), a further 15 % moderately (150 - 180 kg DM/m³) and around 2 % (edge areas) was less well (under 150 kg DM/m³) compacted.
9. The lowest compaction was measured at the silo wall with a mean 156 kg DM/m³. The compaction was around 31 % lower than the target of 225 kg DM/m³. The mean density around a metre from the silo wall was 174 kg DM/m³ and, thus, was around 23 % lower than the target. The best mean compaction of 196 kg DM/m³ was measured in the middle of the silo. The compaction there was only around 13 % lower than the target of 225 kg DM/m³.
10. Edge effects were also noted with other techniques. The closer the rolling vehicle was able to work along the wall, the smaller these effects were. The fact that the PistenBully was not able to drive along directly and parallel to the silo wall because of
25
the overhanging blade had a negative effect at the silo wall. The edge zone was regularly compacted though by reversing along the wall. However, this was insufficient to achieve optimum compaction right at the wall.
11. The compaction increased from the top downward in the silo from 159 kg DM/m³ to
181 kg DM/m³ to a mean 186 kg DM/m³. Effects of this kind are observed frequently in all silos regardless of the rolling technique. It is worth noting that higher densities were achieved at times in the uppermost layer with 182.8 kg DM/m³ and in the second layer with 196.5 kg DM/m³. The target value was exceeded in places in the silo middle with 226 kg DM/m³.
12. The removal schedule with immediate feeding of the freshly ensilaged crop and the removal interruption from the middle of December to the start of January had a negative effect on the quality and stability of the maize silage despite low outside temperatures.
13. The mean temperature was too high at 28 °C and, thus, reheating was detected. The maximum temperature of 45°C was recorded at the end of January despite minus temperatures in the surrounding air. Around 23 % of all values were less than 25°C and 8.6 % were less than 20°C. Some 45 % of all measured temperatures were over 30 °C; around a third were between 25 and 30°C.
14. The immediate opening of the silo contributed to heating. Airtight sealing for at least 4 to 6 weeks would definitely have improved aerobic stability. This is demonstrated by the fact that the highest mean temperature of 31°C was recorded after just three weeks and this was measured evenly across the silage. Afterward, the decreasing outside temperature and the good rate (3-4 m/week) had a positive effect.
15. Removal was interrupted from the middle of December to the start of January. This break had a negative effect particularly in the upper, less well compacted areas. 24.8°C was recorded at the start of January and 28.2°C at the end of January. The somewhat lower temperature at the start of January is due to the heat emission from the upper layers. However, the temperatures at the bottom in the silo were over 30°C at this time. Heating then continued until the end of January and achieved a mean over 30°C up to a maximum value of 45°C.
16. The reheating in the maize silage certainly benefited from the low compaction in the edge area, but the main cause of the unwanted increase in temperatures was the immediate opening and the removal interruption. Consequently, the unfavourable removal timetable is not due to the PistenBully.
17. Decay occurred in the maize silage from January 2010 in the edge section. Additionally, mould cavity formation was observed everywhere in the uppermost layer. There was no mould in deeper layers.
18. The energy content of the maize silage decreased from 6.4 on unloading to 6.2 (date 1) to 6.0 (date 2) and 5.9 MJ NEL/kg DM (date 3) due to reheating. In contrast, the crude fibre content increased from 21.7 % in DM (unloading) to 26.3 % in DMc (end January).
19. There was a breakdown in lactic acid and build-up of ammonia levels and butyric acid in the lower, particularly damp edge layers. This explains the decrease in crude

26
protein content there. However, these effects are not due to use of the PistenBully, but rather to the removal schedule.
20. The fermentation quality of the maize silage was always good except for individual edge sections. However, the increasing build-up of butyric acid and the accompanying increase in ammonia would have had a noticeable negative effect if the silage had been stored for longer, particularly in the rising outside temperatures. The build-up of butyric acid and ammonia benefits from rising pH values because of the breakdown of lactic acid due to reheating. It is seen especially in damper sections.
21. Thus, the limit values for butyric acid and ammonia were exceeded in the lower damp sections at the end of January. In future, therefore, the silo maize must be harvested when evenly mature and must be hermetically sealed for at least four to six weeks. A liquid blockage must be avoided wherever possible. These factors and their effects on the maize silage quality are not due to the PistenBully.
22. The mean ethanol content was 0.9 % in DMc with a spread of 0.4 to 1.8 % in DMc.
No influence was detected from the date, position and location of the samples and, thus, no negative effect by the PistenBully.
These results show that use of a snow groomer (PistenBully 300) is suitable for ensilaging silo maize with outputs of 100 tonnes fresh mass per hour, despite a weighted mean compaction of 194.5 kg DM/m³, which was around 13.6 % beneath the target of 225 kg DM/m³ on average. 6. Responsible for the results Dr Hansjörg Nußbaum Landwirtschaftliches Zentrum für Rinderhaltung, Grünlandwirtschaft, Milchwirtschaft, Wild und Fischerei Baden-Württemberg(LAZBW) Fachbereich Grünlandwirtschaft und Futterbau Atzenberger Weg 99 88326 Aulendorf Tel.: +49 (0)752 594 2352 E-mail: [email protected] Aulendorf, 22nd March 2010