Use of Tax Incentives for Retirement Saving in 2006
39
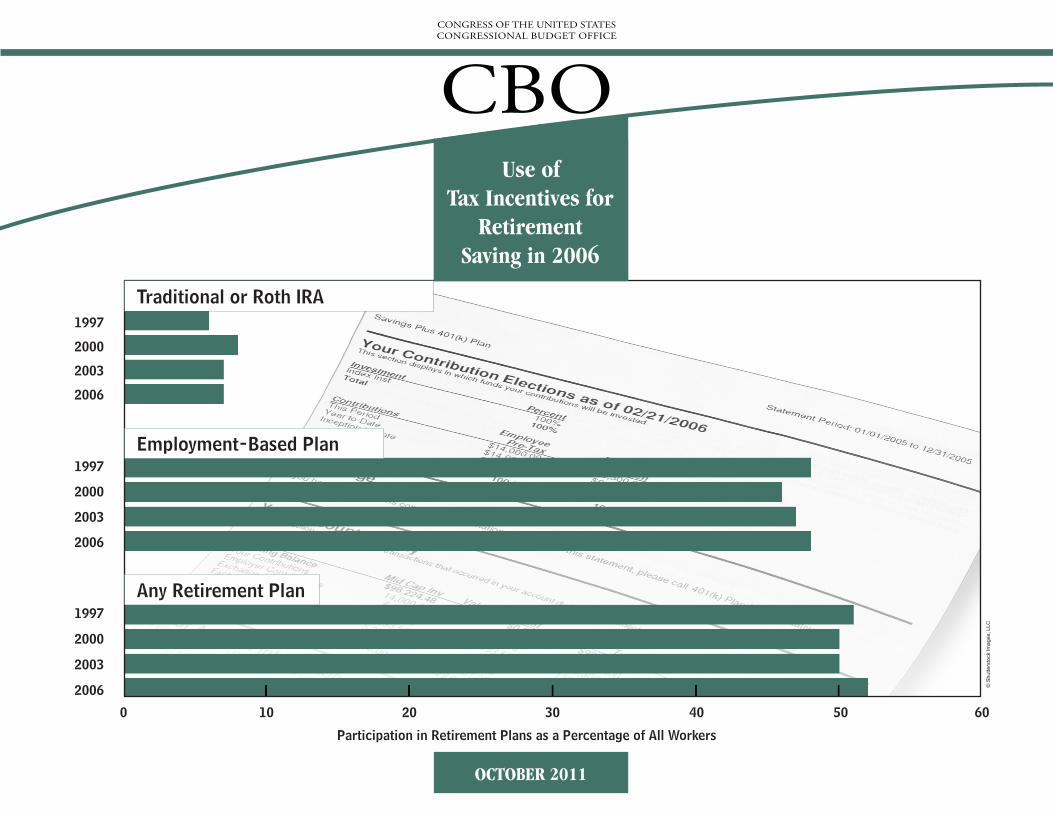
1997 1997 1997 2003 2003 2003 2000 2000 2000 2006 2006 2006 Traditional or Roth IRA Employment-Based Plan Any Retirement Plan 0 10 30 50 20 40 60 Participation in Retirement Plans as a Percentage of All Workers CONGRESS OF THE UNITED STATES CONGRESSIONAL BUDGET OFFICE CBO Use of Tax Incentives for Retirement Saving in 2006 OCTOBER 2011 © Shutterstock Images, LLC
-
Upload
congressional-budget-office -
Category
News & Politics
-
view
24.665 -
download
1
description
Chartbook for Retirement Saving in 2006
Transcript of Use of Tax Incentives for Retirement Saving in 2006
1997
1997
1997
2003
2003
2003
2000
2000
2000
2006
2006
2006
Traditional or Roth IRA
Employment-Based Plan
Any Retirement Plan
0 10 30 5020 40 60
Participation in Retirement Plans as a Percentage of All Workers
CONGRESS OF THE UNITED STATESCONGRESSIONAL BUDGET OFFICE
CBOUse of
Tax Incentives for Retirement
Saving in 2006
OCTOBER 2011
© S
hutte
rsto
ck Im
ages
, LLC

Pub. No. 4167
ffice
CBO
The Congress of the United States O Congressional Budget O
Use of Tax Incentives for Retirement Saving in 2006
October 2011
CBO
y not add up
e, deferring
e, but
at typically x contribu-h such plans.
t contain the ons. For this ibutory
it employers s (all named ift Savings it sector and re 2006, age earners
yees; instead,
Notes and Definitions
Unless otherwise noted, all years referred to are calendar years. Numbers in the text, tables, and exhibits mato totals because of rounding.
Types of Tax Benefits Traditional: Retirement plans offering these benefits allow contributions to be made from before-tax incomtaxes until the funds are withdrawn.
Roth-style: Retirement plans offering these benefits require contributions to be made from after-tax incomimpose no tax on withdrawals.
Employment-Based Retirement Plans Defined-Benefit Plans: Retirement payments under this group of plans are set on the basis of formulas thconsider an employee’s earnings and years of service. Because defined-benefit plans do not accept before-tations from employees, they are categorized as noncontributory. Roth-style benefits are not available throug
Defined-Contribution Plans: Retirement payments under this group of plans are made out of accounts thaamounts contributed by the employer and the employee, and the investment earnings on those contributistudy, defined-contribution plans are further subdivided into two groups, 401(k)-type plans and noncontrdefined-contribution plans.
401(k)-type plans: These plans accept before-tax contributions from employees. Many such plans also permto match some or all of their employees’ contributions. This category includes 401(k), 403(b), and 457 planfor the sections of the Internal Revenue Code in which they are defined) and the federal government’s ThrPlan. 401(k) plans are most common in the private sector, 403(b) plans are most common in the nonprofin public school systems, and 457 plans are most common in other state and local government units. Befo401(k)-type plans provided traditional tax benefits only; in 2006, Roth 401(k) plans were introduced for wbut not for self-employed people.
Noncontributory defined-contribution plans: These plans do not accept before-tax contributions from emplothey are funded entirely by employers. Roth-style benefits are not available through such plans.
NOTES AND DEFINITIONS USE OF TAX INCENTIVES FOR RETIREMENT SAVING IN 2006 iii
CBO
Individual Retirement AccountsTraditional IRAs: Most taxpayers who contribute to a traditional individual retirement account (IRA) are permitted to make before-tax contributions to that account. However, if either the taxpayer or the taxpayer’s spouse is covered by an
ng on ed can be fore- and
re tax-free sallowed
ed for the by attach-base was
ge earners, tion from
y plans, fits in -employed
lations. e people ed in a n the data, arately in
informa-as adjusted , and 2006.
employment-based plan, some or all of those contributions may be deemed after-tax contributions, dependiincome (see Table A-1 of the online supplemental material for details). In such cases, the amounts contributwithdrawn tax-free, but the earnings on those contributions are taxable upon withdrawal. For this report, beafter-tax contributions to traditional IRAs were tabulated together.
Roth IRAs: The Roth-style IRA (introduced in 1998) accepts after-tax contributions only, and withdrawals aonce the account is five years old. Above certain income thresholds, however, contributions are limited or di(see Table A-1 of the online supplemental material for details).
Data and Supplemental MaterialSource data: Participation in tax-favored retirement plans, contributions to such plans, and the amounts claimsaver’s credit were tabulated from a sample of 320,897 individual income tax returns for 2006 and enhanceding data from supplemental tax forms filed by employers and financial institutions. Details on how that dataassembled and used are presented in the appendix.
Identification of Plan Types: The data did not permit the discrete identification of all types of plans. For wa401(k)-type plans could be identified, but it was impossible to distinguish noncontributory defined-contribunoncontributory defined-benefit plans, so both varieties were tabulated together. (Note that noncontributordespite their label, include plans that require employees to make after-tax contributions and pay tax on beneexcess of those contributions.) None of the different employment-based plan types could be identified for selfpeople, so all data on those workers were tabulated together.
People can participate in more than one type of plan, and such participation is generally reflected in the tabuPeople who participated in an employment-based plan along with an IRA are counted in each category, as arwho contributed both to a traditional IRA and to a Roth IRA. The exception is wage earners who participat401(k)-type plan and a noncontributory plan at the same time. Because they are not separately identifiable ithose workers are counted only as participants in 401(k)-type plans. Roth 401(k) plans are not identified septhe data, but there is evidence that participation in 2006 (the first year of their existence) was low.
Supplemental Material: Additional material is available online (www.cbo.gov), including detailed historical tion on changes in tax provisions and on participation rates; average contributions (in nominal amounts and for inflation); and percentages of people who were constrained by contribution limits for 1997, 2000, 2003

Preface
CBO
In 2006, m is study, the fourth s in and contributio ives for Retirement 00 and 2003.
This docum g with CBO’s mandate to
Paul Burnh tino and Janet Holt seful comments sts solely with CBO
Kate Kelly pared the document print distributio
October 2
ore than half of all U.S. workers participated in some form of tax-favored retirement plan. Thin a triennial series published by the Congressional Budget Office (CBO) on participation ratens to various plans, examines data for that year. The first in the series, Utilization of Tax Incent
Saving (August 2003), presented data from 1997; the subsequent updates presented data for 20
ent was prepared at the request of the Chairman of the Senate Finance Committee. In keepin provide objective, impartial analysis, the study makes no recommendations.
am of CBO’s Tax Analysis Division produced the study under the direction of Frank Sammarzblatt. Frank Russek of CBO and Peter Brady of the Investment Company Institute provided u. The assistance of an external reviewer implies no responsibility for the final product, which re.
edited the document, and John Skeen proofread it. Maureen Costantino and Jeanine Rees prefor publication, Monte Ruffin produced the printed copies, and Linda Schimmel handled the n. An electronic version is available from CBO’s Web site (www.cbo.gov).
Douglas W. ElmendorfDirector
011
jeaniner
Doug
CBO
Exhibit Page
Participation Rates and C
1. Participation in 5
2. Participation of 6
3. Participation of 7
4. Participation of me Range, 2006 8
5. IRA Participatio 9
6. IRA Participatio 10
7. Retirement Plan 11
8. Contributions b 12
9. Contributions b 13
10. Contributions to 14
11. Contributions to 15
12. Average Contrib 16
Effects of EGTRRA’s Incre
13. Participants Mak 18
14. ge Real Co 19
ontribu
Tax-Fa
Wage E
the Self
the Self
n, 2003
n, by In
Partici
y Wage
y the S
Tradi
Roth
utions
ases in
ing th
ntribut
tio
vore
arn
-Em
-Em
an
com
pati
Ear
elf-E
tion
IRA
to R
Co
e M
ions
ns
d Re
ers in
ploy
ploy
d 200
e Ra
on, 1
ners
mplo
al IRA
s, 200
oth a
ntrib
aximu
to R
tirem
Emp
ed in
ed an
6
nge,
997 t
to 40
yed t
s, 20
3 an
nd T
ution
m C
etirem
ent P
loym
Emp
d Wa
2006
o 200
1(k)-
o Em
03 a
d 200
raditi
Lim
ontri
ent
Li
lans,
ent-B
loym
ge Ea
6
Type
ploym
nd 20
6
onal
its
butio
Plans
st
2003
ased
ent-B
rners
Plan
ent
06
IRAs
n, 20
, 199
of
and
Retir
ased
in E
s, 200
-Base
, by A
00 to
7 to 2
Ex
2006
emen
Retir
mplo
3 an
d Ret
ge G
2006
006
hi
t Pla
emen
ymen
d 200
ireme
roup
bi
ns, 20
t Plan
t-Bas
6
nt Pl
, 200
ts
03 a
s, 20
ed R
ans, 2
6
nd 20
03 an
etirem
003
06
d 200
ent P
and 2
6
lans
006
, by Inco
Avera
CBO
Exhib Page
LIST OF EXHIBITS USE OF TAX INCENTIVES FOR RETIREMENT SAVING IN 2006 vii
15 20
16 21
17 22
Use of
18 24
19 25
20 26
21 27
22 28
23 29
it
. T
. T
. T
the Sa
. E
. C
. E
. A
. O
. E
he Ef
he Ef
he Ef
ver’s
ligibi
laimi
ligible
verag
ther
ffectiv
fect o
fect o
fect o
Cre
lity fo
ng of
Con
e Sav
Featu
e Ra
f EGT
f EGT
f EGT
dit
r the S
the Sa
tribut
er’s Cr
res of
te of t
RR
RR
RR
ave
ver
ors
edit
Con
he S
A on
A on
A on
r’s Cr
’s Cre
Claim
s and
tribu
aver’s
Max
Max
Max
edit,
dit b
ing t
Asso
tions
Cre
imum
imum
imum
2003
y Elig
he Sa
ciate
for W
dit, 2
Con
Con
Con
and
ible W
ver’s
d Con
hich
006
tributions to 401(k)-Type Plans, 2006
tributions to Traditional IRAs, 2006
tributions to Roth IRAs, 2006
2006
orkers, 2003 and 2006
Credit, 2006
tributions, 2003 and 2006
the Saver’s Credit May Be Claimed, 2003 and 2006
CBO
ome incenent. ontrin acer tath soute fe of
mentartic
e of cthe tmenl tax woulhose ld p
remen tradivi
the dns. Ce maan belarly,empans) ntive
f those workers also participated in ment-based plans.
-nine percent of workers who filed tax were wage earners who contributed to -type plans. Another 18 percent were wage who participated in noncontributory ment-based plans only. Participation rates income, and marital status for 401(k)-type ere similar to those for all tax-favored retire-lans. For employees who participated in tributory plans only, the rates were much niform across all groupings. Participants in -type plans contributed an average of in 2006. Average contributions were higher older workers and those whose earnings fell gher income ranges. For example, average utions were $670 among participants income was below $20,000 and $11,000 those earning $160,000 or more. Contri-s also were higher among married workers ere either a sole or a primary earner than ere among unmarried workers or among ary earners in two-earner couples.
y fewer workers contributed to traditional 3 percent) than to Roth IRAs (4 percent) 6. Participation in each type of IRA was y associated with income (except in the income range, in which workers were le to contribute to a Roth IRA).
The federal incnative types of save for retiremworkers make climit) into certaincome and defwithdrawn. Wiworkers contribno tax at the timresulting investtax-free. If the psame at the timof withdrawal, Roth-style treatwhose marginaare withdrawn a participant wwithdrawal wou
Among the retia choice betweeincentives are in(IRAs) and (at 401(k)-type plaplans also can bcontributions cincentive. Simiplans to which contributory pltraditional ince
can benefit only from the . earners and 1 percent as self-employed people).
Only 7 percent of workers contributed to IRAs; highestineligib
ipant’s marginal tax rate is the ontribution as it is at the time
ax benefits of traditional and t are the same. A participant rate is lower at the time funds d prefer traditional treatment; marginal tax rate is higher at refer Roth-style treatment.
nt savings vehicles permitting ditional and Roth-style dual retirement accounts iscretion of the employer) ontributions to 401(k)-type de by employers, but such nefit only from the traditional
employer contributions to loyees do not contribute (non-
Participation Rates and ContributionsIn 2006, just over half (52 percent) of all workers who filed tax returns participated in some form of tax-favored retirement plan. The highest rates of participation (64 percent and above) were seen among workers between the ages of 45 and 59; those whose income was $40,000 or more; and those who were the primary (that is, the higher) earner in a two-earner household. The lowest rates (41 percent or less) were among workers under the age of 30; those whose income was under $20,000; and those who were unmarried. Participation was concentrated in employment-based plans, with 48 percent of all workers either contributing to or being covered by such a plan (47 percent as wage
ment pnonconmore u401(k)$4,350amonginto hicontribwhose amongbutionwho wthey wsecond
SlightlIRAs (in 200strongl
Use of Tax Incentives forRetirement Saving in 2006
tax system contains two alter-tives to encourage workers to With traditional incentives, ibutions (up to a statutory counts from their before-tax
x payments until the funds are -called Roth-style incentives, rom after-tax income but pay withdrawal. In either case, the income is effectively earned
This publication of the Congressional Budget Office (CBO) examines participation rates in and contributions to various plans in 2006, with some earlier data presented for comparison. Two features of the Economic Growth and Tax Relief Reconcili-ation Act of 2001 (EGTRRA) also are analyzed: increases in contribution limits and an additional incentive created to encourage lower-income tax-payers to save for retirement that is known as the “saver’s credit.”
some oemploy
Twentyreturns401(k)earnersemployby age,plans w
CBO
INT SE OF TAX INCENTIVES FOR RETIREMENT SAVING IN 2006 2
PacoIRretpleIRwolarRoboan
Ovret205120pofaian20anin po
Avinc20incEGexcchfershaccpr
arison of Pre-EGTRRA and nt-Law Contribution Limits 06
Congressional Budget Office.
GTRRA = Economic Growth and Tax Relief econciliation Act of 2001; IRA = individual tirement account.
ontribution limits under pre-EGTRRA law are ated on the basis of inflation since 2001.
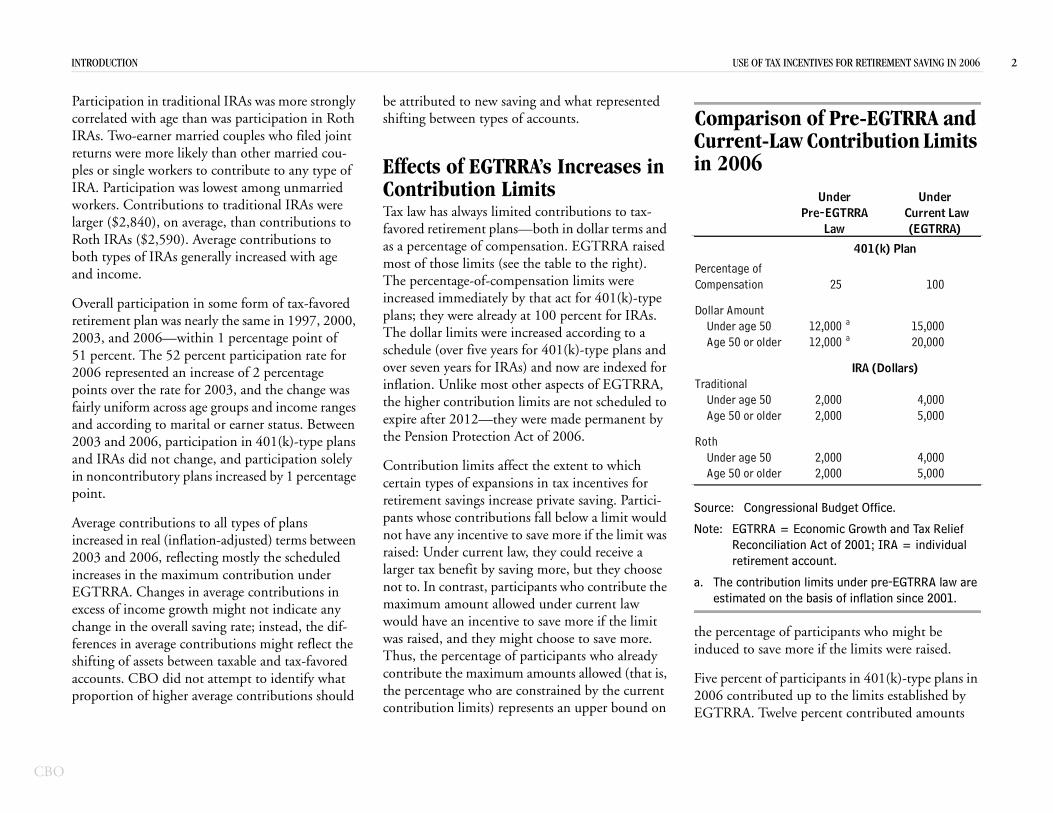
entage of participants who might be to save more if the limits were raised.
cent of participants in 401(k)-type plans in ntributed up to the limits established by A. Twelve percent contributed amounts
e of ation 25 100
ount age 50 12,000 a 15,000 or older 12,000 a 20,000
al age 50 2,000 4,000 or older 2,000 5,000
age 50 2,000 4,000 or older 2,000 5,000
Under Under Pre-EGTRRA
LawCurrent Law(EGTRRA)
401(k) Plan
IRA (Dollars)
ounts. CBO did not attempt to identify what oportion of higher average contributions should the percentage who are constrained by the current
contribution limits) represents an upper bound on
Five per2006 coEGTRR
06 represented an increase of 2 percentage ints over the rate for 2003, and the change was rly uniform across age groups and income ranges d according to marital or earner status. Between 03 and 2006, participation in 401(k)-type plans d IRAs did not change, and participation solely noncontributory plans increased by 1 percentage int.
erage contributions to all types of plans reased in real (inflation-adjusted) terms between 03 and 2006, reflecting mostly the scheduled reases in the maximum contribution under TRRA. Changes in average contributions in ess of income growth might not indicate any
ange in the overall saving rate; instead, the dif-ences in average contributions might reflect the ifting of assets between taxable and tax-favored
over seven years for IRAs) and now are indexed for inflation. Unlike most other aspects of EGTRRA, the higher contribution limits are not scheduled to expire after 2012—they were made permanent by the Pension Protection Act of 2006.
Contribution limits affect the extent to which certain types of expansions in tax incentives for retirement savings increase private saving. Partici-pants whose contributions fall below a limit would not have any incentive to save more if the limit was raised: Under current law, they could receive a larger tax benefit by saving more, but they choose not to. In contrast, participants who contribute the maximum amount allowed under current law would have an incentive to save more if the limit was raised, and they might choose to save more. Thus, the percentage of participants who already contribute the maximum amounts allowed (that is,
Source:
Note: ERre
a. The cestim
the percinduced
TraditionUnder Age 50
Under Age 50
Roth
RODUCTION U
rticipation in traditional IRAs was more strongly rrelated with age than was participation in Roth As. Two-earner married couples who filed joint urns were more likely than other married cou-s or single workers to contribute to any type of A. Participation was lowest among unmarried rkers. Contributions to traditional IRAs were ger ($2,840), on average, than contributions to th IRAs ($2,590). Average contributions to th types of IRAs generally increased with age d income.
erall participation in some form of tax-favored irement plan was nearly the same in 1997, 2000, 03, and 2006—within 1 percentage point of percent. The 52 percent participation rate for
be attributed to new saving and what represented shifting between types of accounts.
Effects of EGTRRA’s Increases in Contribution Limits Tax law has always limited contributions to tax-favored retirement plans—both in dollar terms and as a percentage of compensation. EGTRRA raised most of those limits (see the table to the right). The percentage-of-compensation limits were increased immediately by that act for 401(k)-type plans; they were already at 100 percent for IRAs. The dollar limits were increased according to a schedule (over five years for 401(k)-type plans and
CompCurrein 20
PercentagCompens
Dollar AmUnder Age 50
CBO
INT USE OF TAX INCENTIVES FOR RETIREMENT SAVING IN 2006 3
eqanallEGprby7 pEGcofrocenprde
ThThtocregroTo40creincfirtab
ble, meaning that it e tax liability.
me tax liability they make qualify-redit originally was but it was made ld was indexed for tion Act of 2006.
ers who filed tax saver’s credit (down e basis of their 0 percent of those a retirement percent in 2003), ntributed claimed in 2003).
w enough to qual-rcent) were the fying contributions . Those whose
est bracket (10 per-ake qualifying credit. The average
Saver’s Credit Rates and Income Ranges, 2003 and 2006(Dollars)
Source: Congressional Budget Office.
Note: The income ranges refer to adjusted gross income.
Rate of Credit Income Range
Single or Married Filing Separately
50 Percent 0 to 14,99920 Percent 15,000 to 16,24910 Percent 16,250 to 24,999
Married Filing Jointly
50 Percent 0 to 29,99920 Percent 30,000 to 33,49910 Percent 33,500 to 49,999
Filing as Head of Household
50 Percent 0 to 22,49920 Percent 22,500 to 24,37410 Percent 24,375 to 37,499
e saver’s credit was introduced by EGTRRA encourage retirement saving by providing tax dits to qualifying taxpayers whose adjusted ss income falls below particular thresholds. qualify, a worker must contribute either to a
1(k)-type plan or to an IRA. The rate of the dit is determined by a worker’s adjusted gross ome and filing status, and it is applied to the
st $2,000 of qualifying contributions (see the le to the right).
the credit (up from 59 percent
Taxpayers whose income was loify for the top credit rate (50 peleast likely either to make qualior to claim the credit if they didincome placed them in the lowcent) were the most likely to mcontributions and to claim the amount of the credit was $156.
RODUCTION
ual to or greater than the pre-EGTRRA limits d presumably would have made the maximum owable contributions in the absence of TRRA. Therefore, EGTRRA reduced the
oportion of participants who were constrained the contribution limits for 401(k)-type plans by ercentage points. For traditional IRAs, TRRA reduced the proportion of participants
nstrained by the contribution limits in 2006 m 73 percent to 52 percent, a decline of 21 per-tage points; for Roth IRAs, the corresponding
oportions were 62 percent and 39 percent, for a cline of 23 percentage points.
e Saver’s Credit
The saver’s credit is nonrefundacannot exceed a taxpayer’s incomThus, workers without any incocannot claim the credit, even ifing contributions. The saver’s cscheduled to expire after 2006, permanent (and the top threshoinflation) by the Pension Protec
In 2006, 25 percent of all workreturns were eligible to take the from 30 percent in 2003) on thincome and tax liability. Only 2eligible actually contributed to account (down slightly from 21and 65 percent of those who co
CBO
articipation Rates and Contributions
P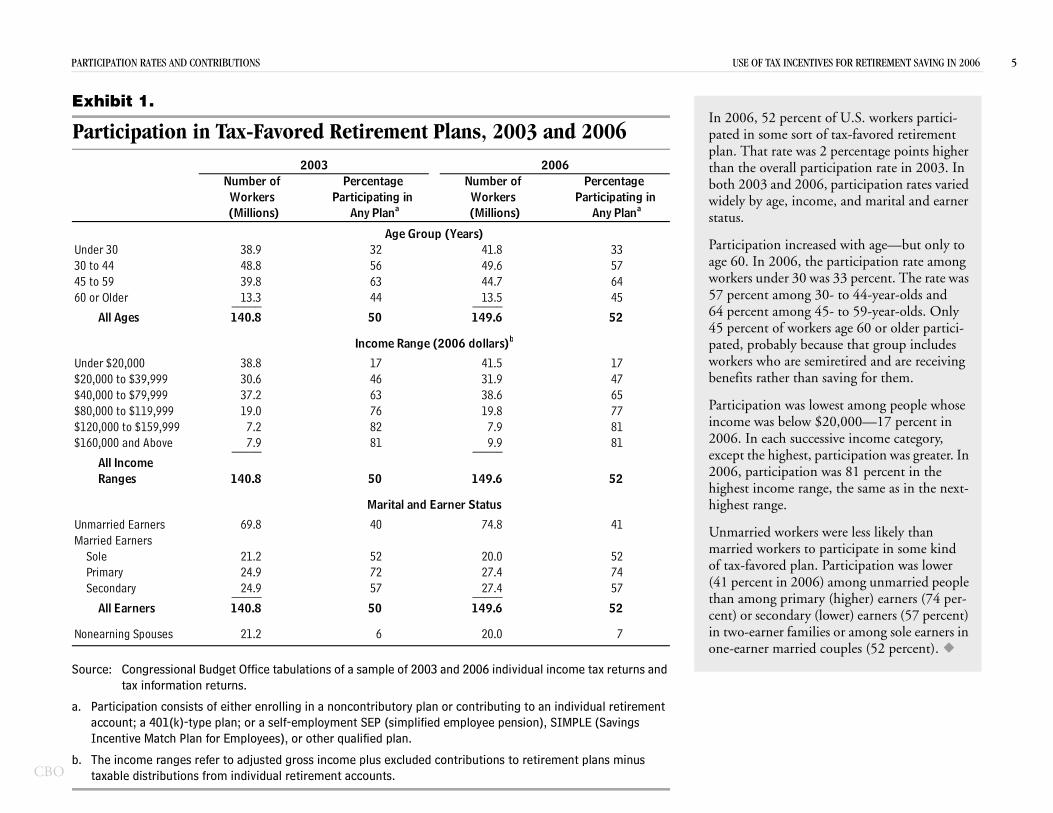
PAR USE OF TAX INCENTIVES FOR RETIREMENT SAVING IN 2006 5
CBO
Ex
P
So
a.
b.
Un304560
Un$2$4$8$1$1
UnMa
No
In 2006, 52 percent of U.S. workers partici-pated in some sort of tax-favored retirement plan. That rate was 2 percentage points higher than the overall participation rate in 2003. In both 2003 and 2006, participation rates varied widely by age, income, and marital and earner status.
Participation increased with age—but only to age 60. In 2006, the participation rate among workers under 30 was 33 percent. The rate was 57 percent among 30- to 44-year-olds and 64 percent among 45- to 59-year-olds. Only 45 percent of workers age 60 or older partici-pated, probably because that group includes workers who are semiretired and are receiving
n saving for them.
lowest among people whose $20,000—17 percent in cessive income category, , participation was greater. In n was 81 percent in the nge, the same as in the next-
rs were less likely than o participate in some kind . Participation was lower 6) among unmarried people
ary (higher) earners (74 per- (lower) earners (57 percent) ilies or among sole earners in d couples (52 percent).
urce: Congressional Budget Office tabulations of a sample of 2003 and 2006 individual income tax returns and tax information returns.
Participation consists of either enrolling in a noncontributory plan or contributing to an individual retirement account; a 401(k)-type plan; or a self-employment SEP (simplified employee pension), SIMPLE (Savings Incentive Match Plan for Employees), or other qualified plan.
The income ranges refer to adjusted gross income plus excluded contributions to retirement plans minus taxable distributions from individual retirement accounts.
0,000 to $39,999 30.6 46 31.9 470,000 to $79,999 37.2 63 38.6 650,000 to $119,999 19.0 76 19.8 7720,000 to $159,999 7.2 82 7.9 8160,000 and Above 7.9 81 9.9 81_____ _____
All Income Ranges 140.8 50 149.6 52
married Earners 69.8 40 74.8 41rried Earners
Sole 21.2 52 20.0 52Primary 24.9 72 27.4 74Secondary 24.9 57 27.4 57_____ _____
All Earners 140.8 50 149.6 52
nearning Spouses 21.2 6 20.0 7
Marital and Earner Status
benefits rather tha
Participation was income was below2006. In each sucexcept the highest2006, participatiohighest income rahighest range.
Unmarried workemarried workers tof tax-favored plan(41 percent in 200than among primcent) or secondaryin two-earner famone-earner marrie
TICIPATION RATES AND CONTRIBUTIONS
hibit 1.
articipation in Tax-Favored Retirement Plans, 2003 and 2006
der 30 38.9 32 41.8 33 to 44 48.8 56 49.6 57 to 59 39.8 63 44.7 64 or Older 13.3 44 13.5 45_____ _____
All Ages 140.8 50 149.6 52
der $20,000 38.8 17 41.5 17
Workers
Income Range (2006 dollars)b
Age Group (Years)
2006Number of Percentage
Any Plana (Millions) Any Plana
Number of Participating in
Percentage Workers
2003
Participating in (Millions)
PAR NTIVES FOR RETIREMENT SAVING IN 2006 6
CBO
Ex
PR(P
So
a.
b.
c.
Un30 45 60
Un$20$40$80$12$16
UnMa
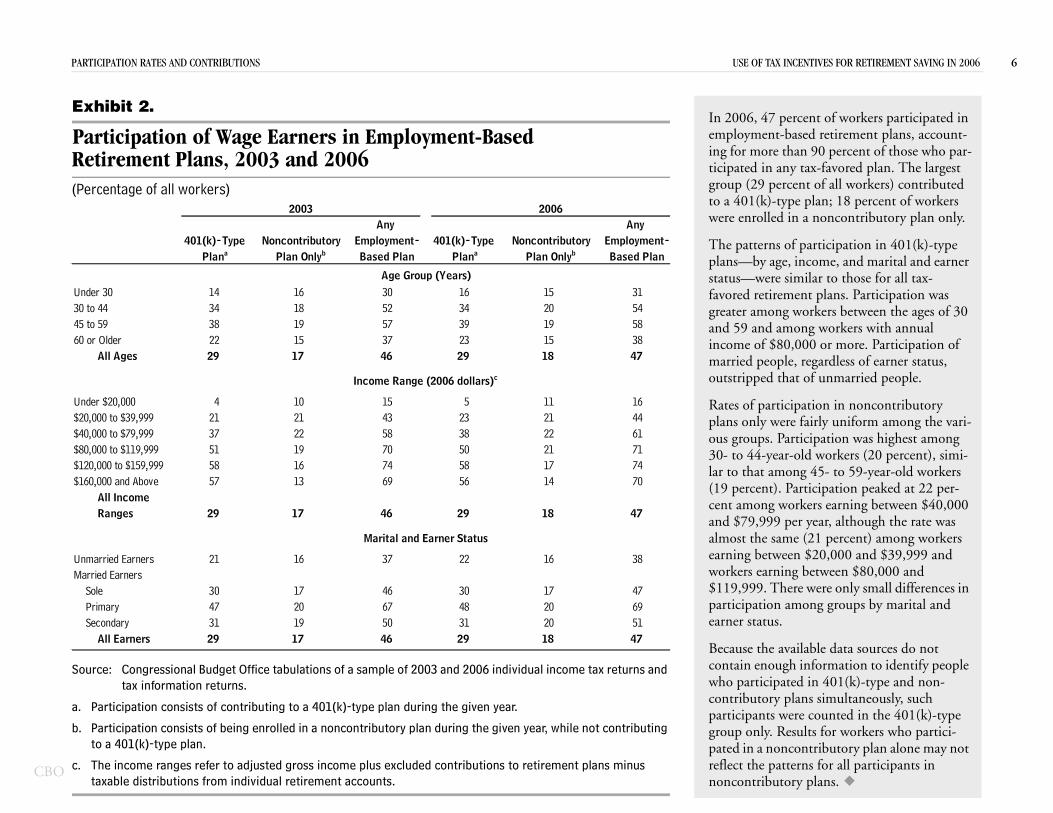
ent of workers participated in ed retirement plans, account- 90 percent of those who par-ax-favored plan. The largest t of all workers) contributed plan; 18 percent of workers a noncontributory plan only.
articipation in 401(k)-type come, and marital and earner ilar to those for all tax-t plans. Participation was
orkers between the ages of 30 g workers with annual 0 or more. Participation of egardless of earner status,
unmarried people.
on in noncontributory ly uniform among the vari-ation was highest among
workers (20 percent), simi-5- to 59-year-old workers ipation peaked at 22 per-s earning between $40,000 ar, although the rate was 1 percent) among workers 0,000 and $39,999 and
tween $80,000 and ere only small differences in g groups by marital and
le data sources do not ormation to identify people 401(k)-type and non-simultaneously, such unted in the 401(k)-type
for workers who partici-ibutory plan alone may not for all participants in ans.
urce: Congressional Budget Office tabulations of a sample of 2003 and 2006 individual income tax returns and tax information returns.
Participation consists of contributing to a 401(k)-type plan during the given year.
Participation consists of being enrolled in a noncontributory plan during the given year, while not contributing to a 401(k)-type plan.
The income ranges refer to adjusted gross income plus excluded contributions to retirement plans minus taxable distributions from individual retirement accounts.
der $20,000 4 10 15 5 11 16,000 to $39,999 21 21 43 23 21 44,000 to $79,999 37 22 58 38 22 61,000 to $119,999 51 19 70 50 21 710,000 to $159,999 58 16 74 58 17 740,000 and Above 57 13 69 56 14 70
All IncomeRanges 29 17 46 29 18 47
married Earners 21 16 37 22 16 38rried EarnersSole 30 17 46 30 17 47Primary 47 20 67 48 20 69Secondary 31 19 50 31 20 51
All Earners 29 17 46 29 18 47
Marital and Earner Status
Income Range (2006 dollars)c outstripped that of
Rates of participatiplans only were fairous groups. Particip30- to 44-year-old lar to that among 4(19 percent). Particcent among workerand $79,999 per yealmost the same (2earning between $2workers earning be$119,999. There wparticipation amonearner status.
Because the availabcontain enough infwho participated incontributory plans participants were cogroup only. Resultspated in a noncontrreflect the patterns noncontributory pl
TICIPATION RATES AND CONTRIBUTIONS USE OF TAX INCE
hibit 2.
articipation of Wage Earners in Employment-Based etirement Plans, 2003 and 2006ercentage of all workers)
der 30 14 16 30 16 15 31to 44 34 18 52 34 20 54to 59 38 19 57 39 19 58or Older 22 15 37 23 15 38
All Ages 29 17 46 29 18 47
2006
401(k)-Type
2003Any
Employment- Noncontributory401(k)-Type Noncontributory
Age Group (Years)
Any Employment-Based PlanBased PlanPlan Onlyb Plana Plan OnlybPlana
In 2006, 47 percemployment-basing for more thanticipated in any tgroup (29 percento a 401(k)-type were enrolled in
The patterns of pplans—by age, instatus—were simfavored retiremengreater among wand 59 and amonincome of $80,00married people, r
PAR USE OF TAX INCENTIVES FOR RETIREMENT SAVING IN 2006 7
CBO
Ex
P ased R
So
No
a.
b.
Un 130 645 1160 10
8
Un$2$4$8$1$1
UnMa
2006
WorkersaSelf-EmployedPercentage of
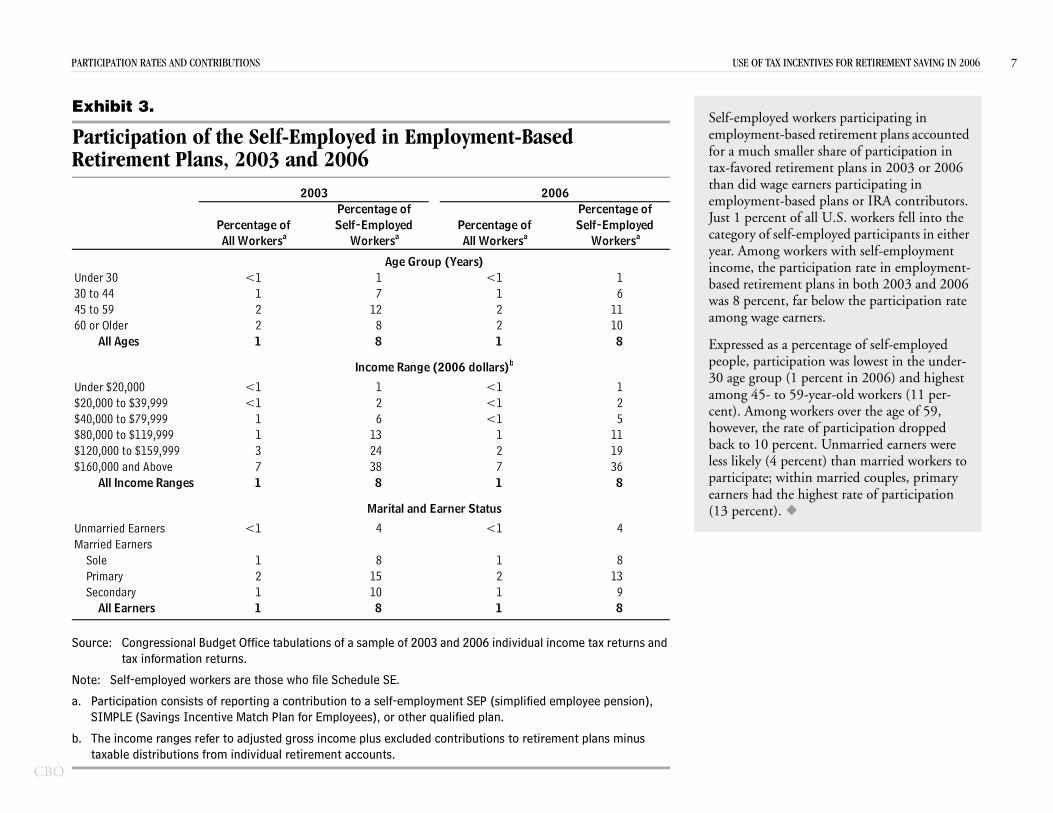
Self-employed workers participating in employment-based retirement plans accounted for a much smaller share of participation in tax-favored retirement plans in 2003 or 2006 than did wage earners participating in employment-based plans or IRA contributors. Just 1 percent of all U.S. workers fell into the category of self-employed participants in either year. Among workers with self-employment income, the participation rate in employment-based retirement plans in both 2003 and 2006 was 8 percent, far below the participation rate among wage earners.
Expressed as a percentage of self-employed people, participation was lowest in the under-
percent in 2006) and highest -year-old workers (11 per-
orkers over the age of 59, e of participation dropped nt. Unmarried earners were cent) than married workers to in married couples, primary highest rate of participation
urce: Congressional Budget Office tabulations of a sample of 2003 and 2006 individual income tax returns and tax information returns.
te: Self-employed workers are those who file Schedule SE.
Participation consists of reporting a contribution to a self-employment SEP (simplified employee pension), SIMPLE (Savings Incentive Match Plan for Employees), or other qualified plan.
The income ranges refer to adjusted gross income plus excluded contributions to retirement plans minus taxable distributions from individual retirement accounts.
der $20,000 <1 1 <1 10,000 to $39,999 <1 2 <1 20,000 to $79,999 1 6 <1 50,000 to $119,999 1 13 1 1120,000 to $159,999 3 24 2 1960,000 and Above 7 38 7 36
All Income Ranges 1 8 1 8
married Earners <1 4 <1 4rried Earners
Sole 1 8 1 8Primary 2 15 2 13Secondary 1 10 1 9
All Earners 1 8 1 8
Income Range (2006 dollars)
Marital and Earner Status
30 age group (1among 45- to 59cent). Among whowever, the ratback to 10 perceless likely (4 perparticipate; withearners had the (13 percent).
TICIPATION RATES AND CONTRIBUTIONS
hibit 3.
articipation of the Self-Employed in Employment-Betirement Plans, 2003 and 2006
der 30 <1 1 <1 to 44 1 7 1 to 59 2 12 2 or Older 2 8 2
All Ages 1 8 1
All WorkersaPercentage of
b
Age Group (Years)
Percentage of
Workersa All WorkersaPercentage of
2003
Self-Employed
PAR USE OF TAX INCENTIVES FOR RETIREMENT SAVING IN 2006 8
CBO
Ex
P ners in Em Range, 2006
So
No
$
$1
$
0
78
74
63
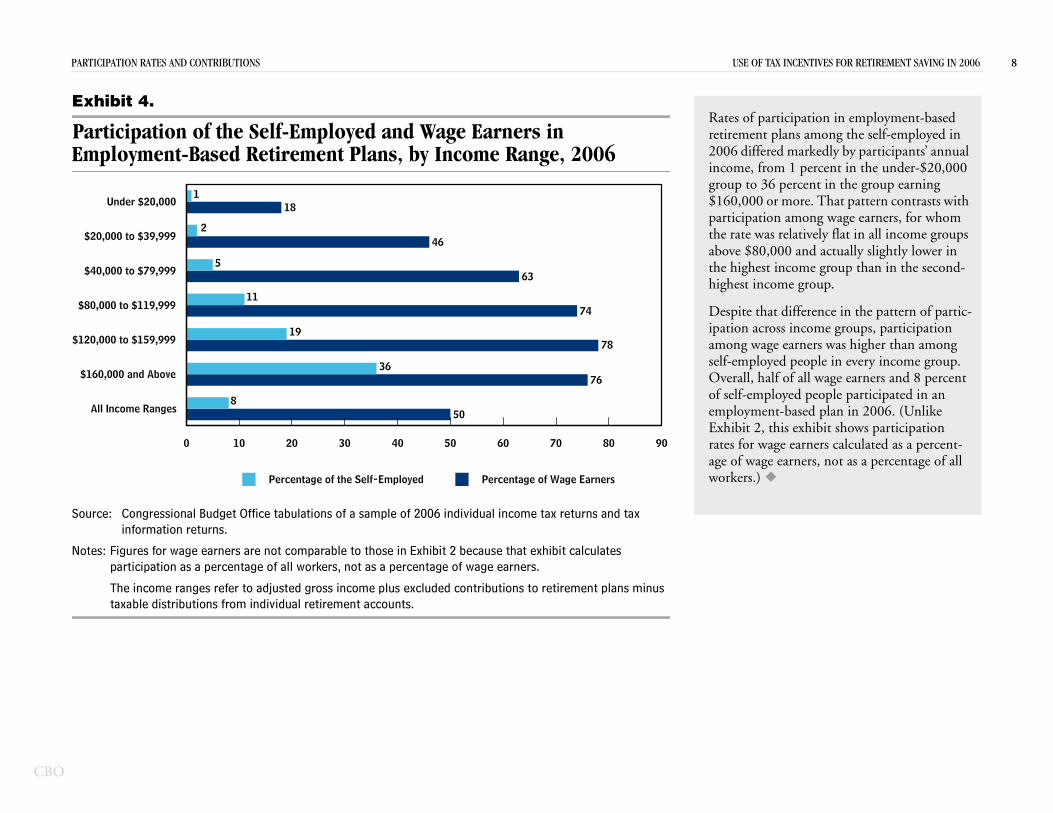
Rates of participation in employment-based retirement plans among the self-employed in 2006 differed markedly by participants’ annual income, from 1 percent in the under-$20,000 group to 36 percent in the group earning $160,000 or more. That pattern contrasts with participation among wage earners, for whom the rate was relatively flat in all income groups above $80,000 and actually slightly lower in the highest income group than in the second-highest income group.
Despite that difference in the pattern of partic-ipation across income groups, participation among wage earners was higher than among self-employed people in every income group. Overall, half of all wage earners and 8 percent of self-employed people participated in an employment-based plan in 2006. (Unlike Exhibit 2, this exhibit shows participation rates for wage earners calculated as a percent-age of wage earners, not as a percentage of all workers.)
urce: Congressional Budget Office tabulations of a sample of 2006 individual income tax returns and tax information returns.
tes: Figures for wage earners are not comparable to those in Exhibit 2 because that exhibit calculates participation as a percentage of all workers, not as a percentage of wage earners.
The income ranges refer to adjusted gross income plus excluded contributions to retirement plans minustaxable distributions from individual retirement accounts.
All Income Ranges
160,000 and Above
0 10 20 30 40 50 60 70 80 9
508
76
Percentage of Wage EarnersPercentage of the Self-Employed
TICIPATION RATES AND CONTRIBUTIONS
hibit 4.
articipation of the Self-Employed and Wage Earployment-Based Retirement Plans, by Income
20,000 to $159,999
80,000 to $119,999
$40,000 to $79,999
$20,000 to $39,999
Under $20,000
36
19
11
5
462
181
PAR USE OF TAX INCENTIVES FOR RETIREMENT SAVING IN 2006 9
CBO
Ex
IR(P
So
No
a.
b.
Ca
Un30456071
Un$2$4$8$1$1
UnMa
No
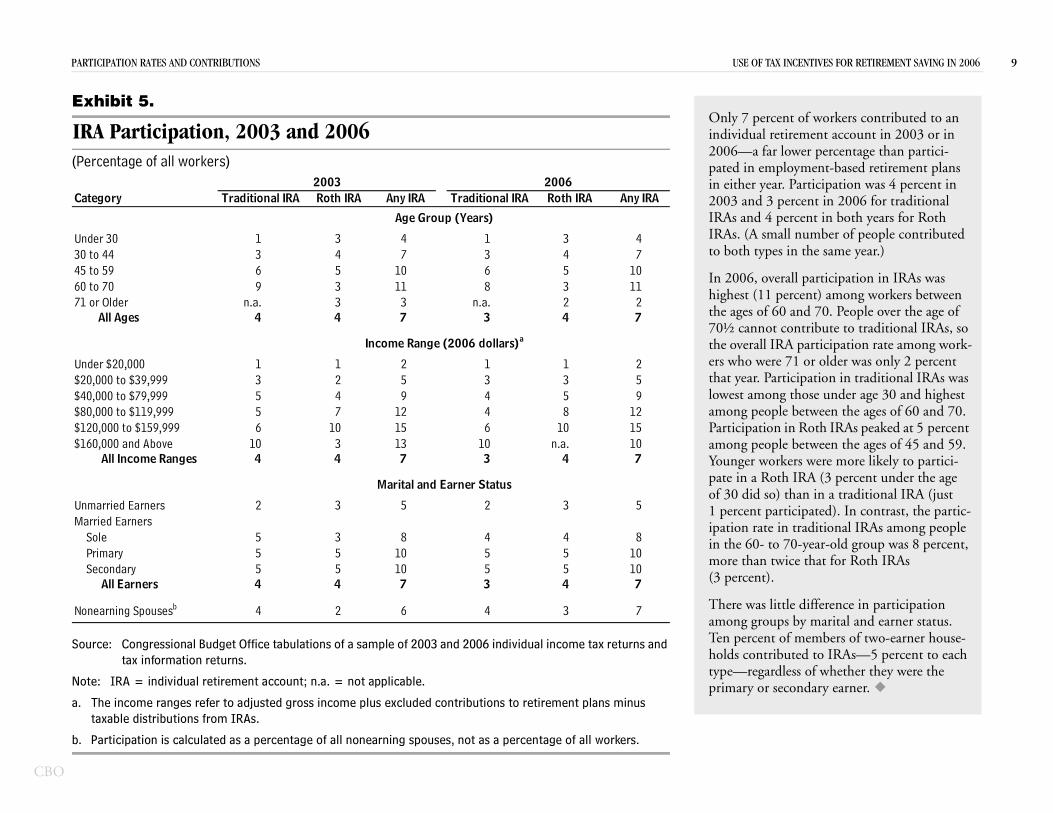
nly 7 percent of workers contributed to an ndividual retirement account in 2003 or in 006—a far lower percentage than partici-ated in employment-based retirement plans
n either year. Participation was 4 percent in 003 and 3 percent in 2006 for traditional RAs and 4 percent in both years for Roth RAs. (A small number of people contributed o both types in the same year.)
n 2006, overall participation in IRAs was ighest (11 percent) among workers between he ages of 60 and 70. People over the age of 0½ cannot contribute to traditional IRAs, so he overall IRA participation rate among work-rs who were 71 or older was only 2 percent
icipation in traditional IRAs was those under age 30 and highest
e between the ages of 60 and 70. in Roth IRAs peaked at 5 percent e between the ages of 45 and 59. ers were more likely to partici- IRA (3 percent under the age
than in a traditional IRA (just ticipated). In contrast, the partic- traditional IRAs among people
70-year-old group was 8 percent, ice that for Roth IRAs
le difference in participation s by marital and earner status. f members of two-earner house-uted to IRAs—5 percent to each less of whether they were the condary earner.
urce: Congressional Budget Office tabulations of a sample of 2003 and 2006 individual income tax returns and tax information returns.
te: IRA = individual retirement account; n.a. = not applicable.
The income ranges refer to adjusted gross income plus excluded contributions to retirement plans minus taxable distributions from IRAs.
Participation is calculated as a percentage of all nonearning spouses, not as a percentage of all workers.
0,000 to $39,999 3 2 5 3 3 50,000 to $79,999 5 4 9 4 5 90,000 to $119,999 5 7 12 4 8 1220,000 to $159,999 6 10 15 6 10 1560,000 and Above 10 3 13 10 n.a. 10
All Income Ranges 4 4 7 3 4 7
married Earners 2 3 5 2 3 5rried Earners
Sole 5 3 8 4 4 8Primary 5 5 10 5 5 10Secondary 5 5 10 5 5 10
All Earners 4 4 7 3 4 7
nearning Spousesb 4 2 6 4 3 7
Marital and Earner Status
that year. Partlowest amongamong peoplParticipation among peoplYounger workpate in a Rothof 30 did so) 1 percent paripation rate inin the 60- to more than tw(3 percent).
There was littamong groupTen percent oholds contribtype—regardprimary or se
TICIPATION RATES AND CONTRIBUTIONS
hibit 5.
A Participation, 2003 and 2006ercentage of all workers)
tegory
der 30 1 3 4 1 3 4 to 44 3 4 7 3 4 7 to 59 6 5 10 6 5 10 to 70 9 3 11 8 3 11 or Older n.a. 3 3 n.a. 2 2
All Ages 4 4 7 3 4 7
der $20,000 1 1 2 1 1 2
Any IRA
Age Group (Years)
Income Range (2006 dollars)a
20062003Traditional IRA Roth IRA Any IRA Traditional IRA Roth IRA
Oi2pi2IIt
Iht7te
PAR USE OF TAX INCENTIVES FOR RETIREMENT SAVING IN 2006 10
CBO
Ex
IR(P
So x
No minus
a.
$
$1
$
12
10
10
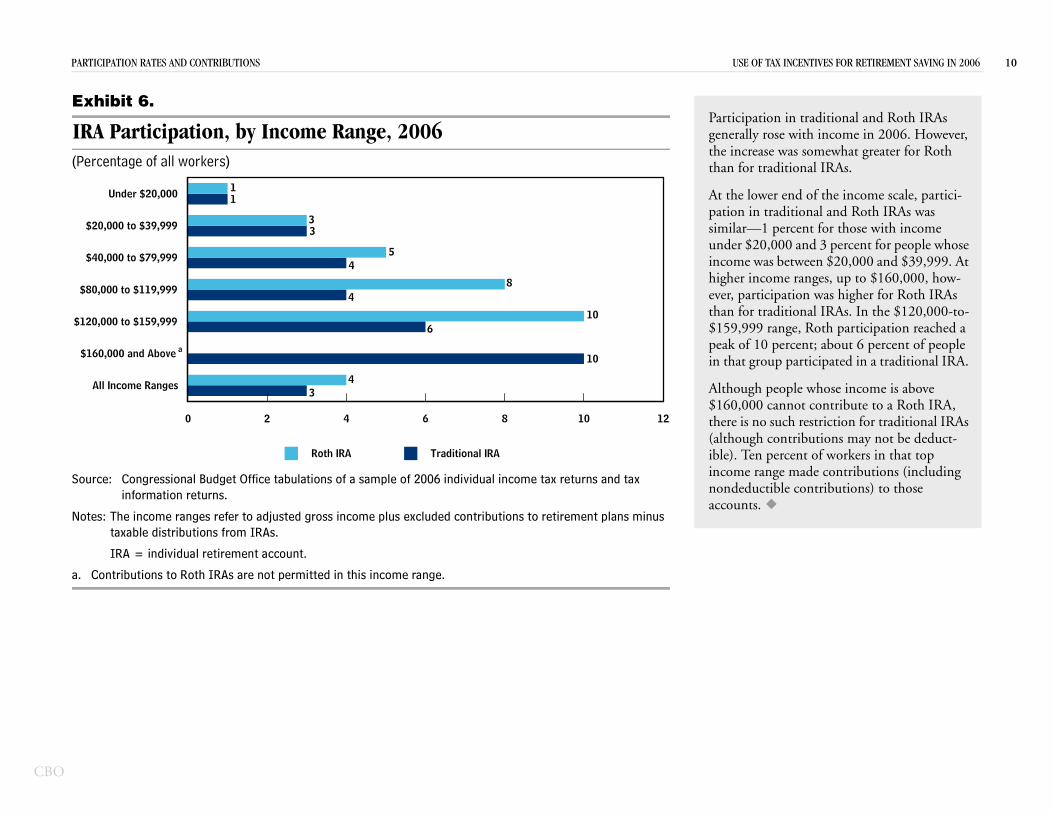
Participation in traditional and Roth IRAs generally rose with income in 2006. However, the increase was somewhat greater for Roth than for traditional IRAs.
At the lower end of the income scale, partici-pation in traditional and Roth IRAs was similar—1 percent for those with income under $20,000 and 3 percent for people whose income was between $20,000 and $39,999. At higher income ranges, up to $160,000, how-ever, participation was higher for Roth IRAs than for traditional IRAs. In the $120,000-to-$159,999 range, Roth participation reached a peak of 10 percent; about 6 percent of people in that group participated in a traditional IRA.
Although people whose income is above $160,000 cannot contribute to a Roth IRA, there is no such restriction for traditional IRAs (although contributions may not be deduct-ible). Ten percent of workers in that top income range made contributions (including nondeductible contributions) to those accounts.
urce: Congressional Budget Office tabulations of a sample of 2006 individual income tax returns and tainformation returns.
tes: The income ranges refer to adjusted gross income plus excluded contributions to retirement plans taxable distributions from IRAs.
IRA = individual retirement account.
Contributions to Roth IRAs are not permitted in this income range.
All Income Ranges
0 2 4 6 8 10
34
Traditional IRARoth IRA
TICIPATION RATES AND CONTRIBUTIONS
hibit 6.
A Participation, by Income Range, 2006ercentage of all workers)
160,000 and Above
20,000 to $159,999
80,000 to $119,999
$40,000 to $79,999
$20,000 to $39,999
Under $20,000
6
48
45
33
11
a
PAR USE OF TAX INCENTIVES FOR RETIREMENT SAVING IN 2006 11
CBO
Ex
R ation, 1997 to 2006(P
So dividual income
No
Em
T
60
2
4847
4648
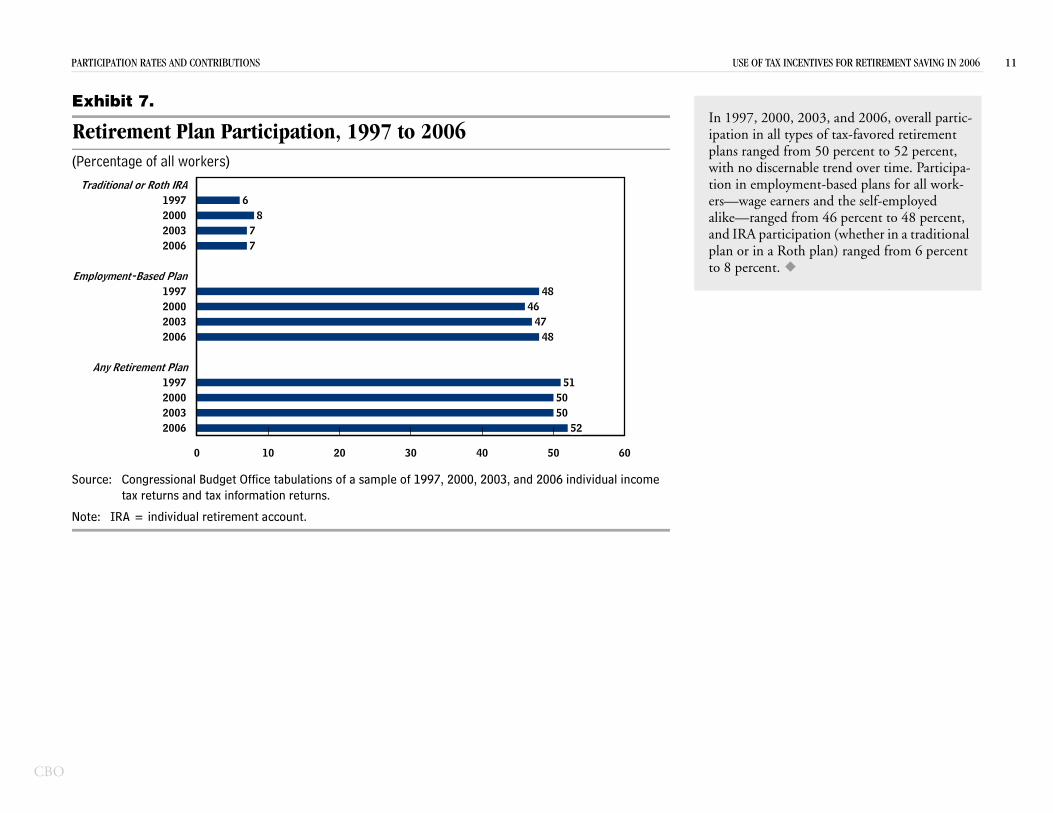
In 1997, 2000, 2003, and 2006, overall partic-ipation in all types of tax-favored retirement plans ranged from 50 percent to 52 percent, with no discernable trend over time. Participa-tion in employment-based plans for all work-ers—wage earners and the self-employed alike—ranged from 46 percent to 48 percent, and IRA participation (whether in a traditional plan or in a Roth plan) ranged from 6 percent to 8 percent.
urce: Congressional Budget Office tabulations of a sample of 1997, 2000, 2003, and 2006 intax returns and tax information returns.
te: IRA = individual retirement account.
2006200320001997
0 10 20 30 40 50
55050
51
TICIPATION RATES AND CONTRIBUTIONS
hibit 7.
etirement Plan Participercentage of all workers)
Any Retirement Plan
2006200320001997
ployment-Based Plan
2006200320001997
raditional or Roth IRA
77
86
PAR X INCENTIVES FOR RETIREMENT SAVING IN 2006 12
CBO
Ex
C20
So
a.
b.
Ca
Un30 45 60
Un$20$40$80$12$16
UnMa
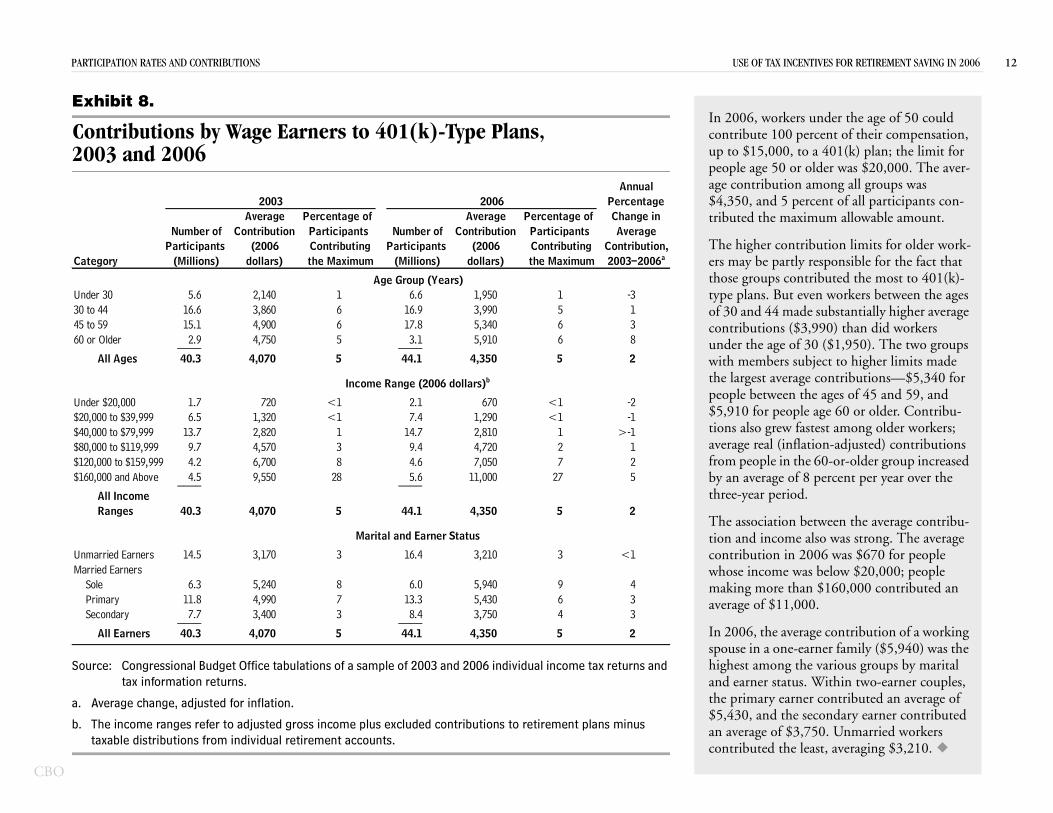
orkers under the age of 50 could 100 percent of their compensation, 00, to a 401(k) plan; the limit for
50 or older was $20,000. The aver-ution among all groups was 5 percent of all participants con- maximum allowable amount.
contribution limits for older work-partly responsible for the fact that s contributed the most to 401(k)-But even workers between the ages 4 made substantially higher average ns ($3,990) than did workers ge of 30 ($1,950). The two groups ers subject to higher limits made
rage contributions—$5,340 for n the ages of 45 and 59, and ople age 60 or older. Contribu- fastest among older workers;
nflation-adjusted) contributions the 60-or-older group increased
of 8 percent per year over the iod.
n between the average contribu-me also was strong. The average in 2006 was $670 for people was below $20,000; people
than $160,000 contributed an ,000.
verage contribution of a working e-earner family ($5,940) was the g the various groups by marital tus. Within two-earner couples, arner contributed an average of he secondary earner contributed $3,750. Unmarried workers e least, averaging $3,210.
urce: Congressional Budget Office tabulations of a sample of 2003 and 2006 individual income tax returns and tax information returns.
Average change, adjusted for inflation.
The income ranges refer to adjusted gross income plus excluded contributions to retirement plans minus taxable distributions from individual retirement accounts.
der $20,000 1.7 720 <1 2.1 670 <1 -2,000 to $39,999 6.5 1,320 <1 7.4 1,290 <1 -1,000 to $79,999 13.7 2,820 1 14.7 2,810 1 >-1,000 to $119,999 9.7 4,570 3 9.4 4,720 2 10,000 to $159,999 4.2 6,700 8 4.6 7,050 7 20,000 and Above 4.5 9,550 28 5.6 11,000 27 5____ ____
All Income Ranges 40.3 4,070 5 44.1 4,350 5 2
married Earners 14.5 3,170 3 16.4 3,210 3 <1rried EarnersSole 6.3 5,240 8 6.0 5,940 9 4Primary 11.8 4,990 7 13.3 5,430 6 3Secondary 7.7 3,400 3 8.4 3,750 4 3____ ____
All Earners 40.3 4,070 5 44.1 4,350 5 2
Income Range (2006 dollars)b
Marital and Earner Status
the largest avepeople betwee$5,910 for petions also grewaverage real (ifrom people inby an averagethree-year per
The associatiotion and incocontribution whose incomemaking moreaverage of $11
In 2006, the aspouse in a onhighest amonand earner stathe primary e$5,430, and tan average of contributed th
TICIPATION RATES AND CONTRIBUTIONS USE OF TA
hibit 8.
ontributions by Wage Earners to 401(k)-Type Plans, 03 and 2006
tegory
der 30 5.6 2,140 1 6.6 1,950 1 -3to 44 16.6 3,860 6 16.9 3,990 5 1to 59 15.1 4,900 6 17.8 5,340 6 3or Older 2.9 4,750 5 3.1 5,910 6 8____ ____
All Ages 40.3 4,070 5 44.1 4,350 5 2
Annual2003 2006
Age Group (Years)
2003–2006aContribution,
AverageChange in
PercentageAverage
the Maximum ContributingParticipants
Percentage of
(Millions)(Millions)Participants Number of
dollars)(2006
ContributionParticipants Number of
dollars)(2006
ContributionAverage
the Maximum ContributingParticipants
Percentage of
In 2006, wcontribute up to $15,0people age age contrib$4,350, andtributed the
The higherers may be those grouptype plans. of 30 and 4contributiounder the awith memb
PAR USE OF TAX INCENTIVES FOR RETIREMENT SAVING IN 2006 13
CBO
Ex
C ased R
So
a.
b.
Ca
Un 10 730 11 445 13 260 11 4
12 3
Un$20$40$80$12$16
UnMa
Annual
2003–2006aContribution,
AverageChange in
Percentage
Maximumntributingrticipantsentage of
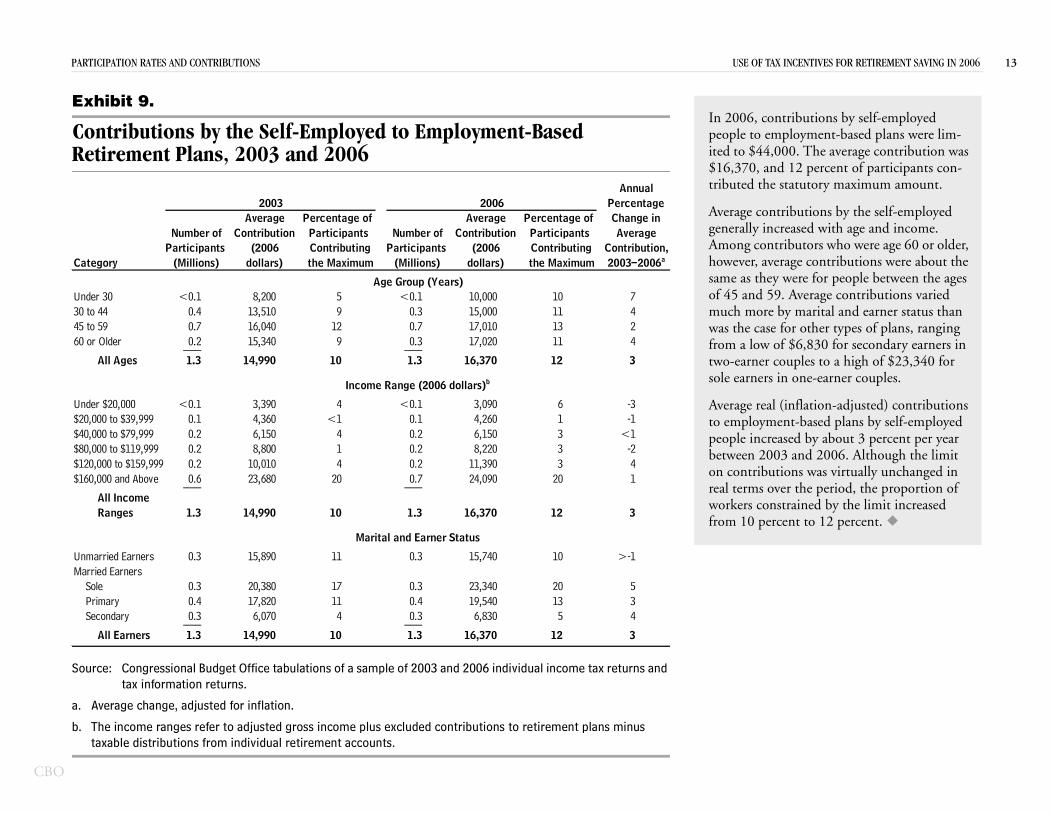
In 2006, contributions by self-employed people to employment-based plans were lim-ited to $44,000. The average contribution was $16,370, and 12 percent of participants con-tributed the statutory maximum amount.
Average contributions by the self-employed generally increased with age and income. Among contributors who were age 60 or older, however, average contributions were about the same as they were for people between the ages of 45 and 59. Average contributions varied much more by marital and earner status than was the case for other types of plans, ranging from a low of $6,830 for secondary earners in two-earner couples to a high of $23,340 for
one-earner couples.
nflation-adjusted) contributions t-based plans by self-employed ed by about 3 percent per year and 2006. Although the limit ns was virtually unchanged in
r the period, the proportion of rained by the limit increased nt to 12 percent.
urce: Congressional Budget Office tabulations of a sample of 2003 and 2006 individual income tax returns and tax information returns.
Average change, adjusted for inflation.
The income ranges refer to adjusted gross income plus excluded contributions to retirement plans minus taxable distributions from individual retirement accounts.
der $20,000 <0.1 3,390 4 <0.1 3,090 6 -3,000 to $39,999 0.1 4,360 <1 0.1 4,260 1 -1,000 to $79,999 0.2 6,150 4 0.2 6,150 3 <1,000 to $119,999 0.2 8,800 1 0.2 8,220 3 -20,000 to $159,999 0.2 10,010 4 0.2 11,390 3 40,000 and Above 0.6 23,680 20 0.7 24,090 20 1___ ___
All Income Ranges 1.3 14,990 10 1.3 16,370 12 3
married Earners 0.3 15,890 11 0.3 15,740 10 >-1rried EarnersSole 0.3 20,380 17 0.3 23,340 20 5Primary 0.4 17,820 11 0.4 19,540 13 3Secondary 0.3 6,070 4 0.3 6,830 5 4___ ___
All Earners 1.3 14,990 10 1.3 16,370 12 3
Income Range (2006 dollars)b
Marital and Earner Status
sole earners in
Average real (ito employmenpeople increasbetween 2003on contributioreal terms oveworkers constfrom 10 perce
TICIPATION RATES AND CONTRIBUTIONS
hibit 9.
ontributions by the Self-Employed to Employment-Betirement Plans, 2003 and 2006
tegory
der 30 <0.1 8,200 5 <0.1 10,000to 44 0.4 13,510 9 0.3 15,000to 59 0.7 16,040 12 0.7 17,010or Older 0.2 15,340 9 0.3 17,020___ ___
All Ages 1.3 14,990 10 1.3 16,370
2003 2006
Age Group (Years)
Average
the CoPa
Perc
(Millions)Participants Number of
dollars)(2006
Contribution
(Millions)Participants Number of
dollars)(2006
ContributionAverage
the Maximum ContributingParticipants
Percentage of
PAR X INCENTIVES FOR RETIREMENT SAVING IN 2006 14
CBO
Ex
C
So
Noa.
b.
Ca
Un30 45 60 71
Un$20$40$80$12$16
UnMa
No
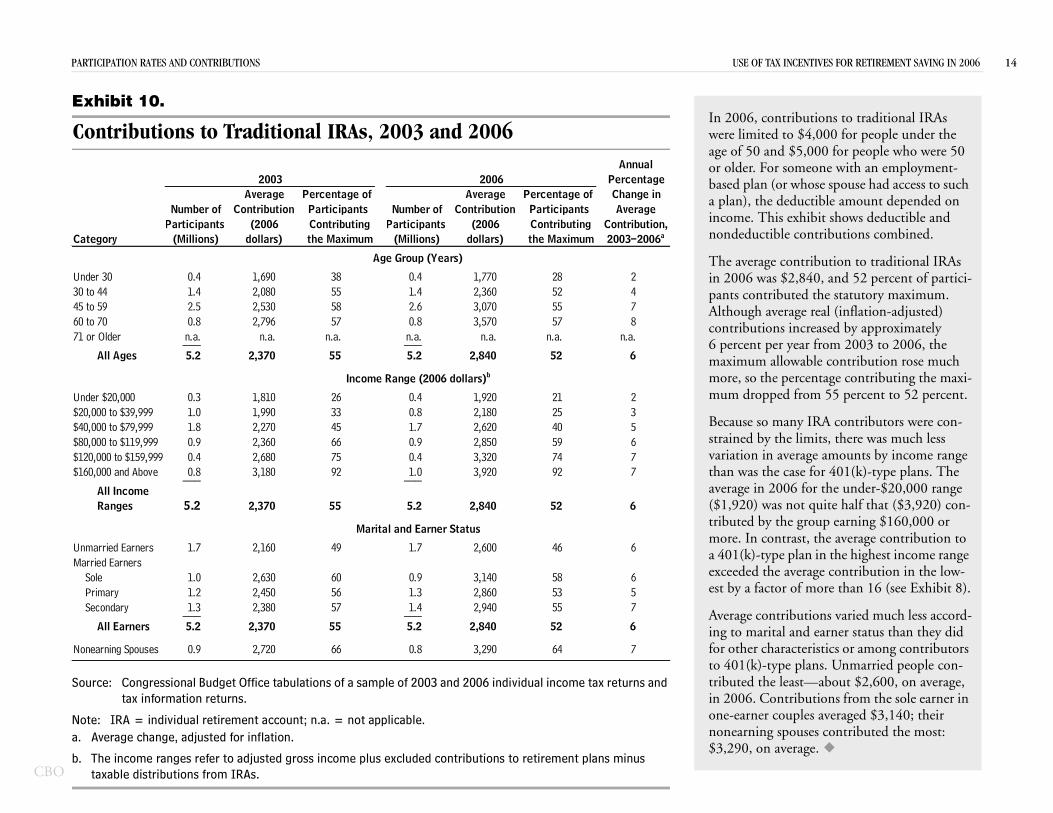
ntributions to traditional IRAs d to $4,000 for people under the d $5,000 for people who were 50 r someone with an employment-(or whose spouse had access to such deductible amount depended on is exhibit shows deductible and ble contributions combined.
e contribution to traditional IRAs s $2,840, and 52 percent of partici-ibuted the statutory maximum. verage real (inflation-adjusted) ns increased by approximately er year from 2003 to 2006, the allowable contribution rose much
entage contributing the maxi-m 55 percent to 52 percent.
IRA contributors were con-its, there was much less
ge amounts by income range for 401(k)-type plans. The or the under-$20,000 range quite half that ($3,920) con-oup earning $160,000 or , the average contribution to in the highest income range
age contribution in the low-more than 16 (see Exhibit 8).
ions varied much less accord- earner status than they did ristics or among contributors ans. Unmarried people con-
about $2,600, on average, utions from the sole earner in s averaged $3,140; their es contributed the most: e.
urce: Congressional Budget Office tabulations of a sample of 2003 and 2006 individual income tax returns and tax information returns.
te: IRA = individual retirement account; n.a. = not applicable.Average change, adjusted for inflation.
The income ranges refer to adjusted gross income plus excluded contributions to retirement plans minus taxable distributions from IRAs.
der $20,000 0.3 1,810 26 0.4 1,920 21 2,000 to $39,999 1.0 1,990 33 0.8 2,180 25 3,000 to $79,999 1.8 2,270 45 1.7 2,620 40 5,000 to $119,999 0.9 2,360 66 0.9 2,850 59 60,000 to $159,999 0.4 2,680 75 0.4 3,320 74 70,000 and Above 0.8 3,180 92 1.0 3,920 92 7___ ___
All Income Ranges 5.2 2,370 55 5.2 2,840 52 6
married Earners 1.7 2,160 49 1.7 2,600 46 6rried EarnersSole 1.0 2,630 60 0.9 3,140 58 6Primary 1.2 2,450 56 1.3 2,860 53 5Secondary 1.3 2,380 57 1.4 2,940 55 7___ ___
All Earners 5.2 2,370 55 5.2 2,840 52 6
nearning Spouses 0.9 2,720 66 0.8 3,290 64 7
Income Range (2006 dollars)b
Marital and Earner Status
more, so the percmum dropped fro
Because so many strained by the limvariation in averathan was the caseaverage in 2006 f($1,920) was nottributed by the grmore. In contrasta 401(k)-type planexceeded the averest by a factor of
Average contributing to marital andfor other characteto 401(k)-type pltributed the least—in 2006. Contribone-earner couplenonearning spous$3,290, on averag
TICIPATION RATES AND CONTRIBUTIONS USE OF TA
hibit 10.
ontributions to Traditional IRAs, 2003 and 2006
tegory
der 30 0.4 1,690 38 0.4 1,770 28 2to 44 1.4 2,080 55 1.4 2,360 52 4to 59 2.5 2,530 58 2.6 3,070 55 7to 70 0.8 2,796 57 0.8 3,570 57 8or Older n.a. n.a. n.a. n.a. n.a. n.a. n.a.___ ___
All Ages 5.2 2,370 55 5.2 2,840 52 6
Average
the Maximum ContributingParticipants
Percentage of
(Millions)Participants Number of
dollars)(2006
ContributionPercentage of
(Millions)Participants Number of
dollars)(2006
Contribution
Annual2003 2006
Age Group (Years)
2003–2006aContribution,
AverageChange in
PercentageAverage
the Maximum ContributingParticipants
In 2006, cowere limiteage of 50 anor older. Fobased plan a plan), theincome. Thnondeducti
The averagin 2006 wapants contrAlthough acontributio6 percent pmaximum
PAR NTIVES FOR RETIREMENT SAVING IN 2006 15
CBO
Ex
C
So
Noa.
b.
Ca
Un30 45 60 71
Un$20$40$80$12$16
UnMa
No
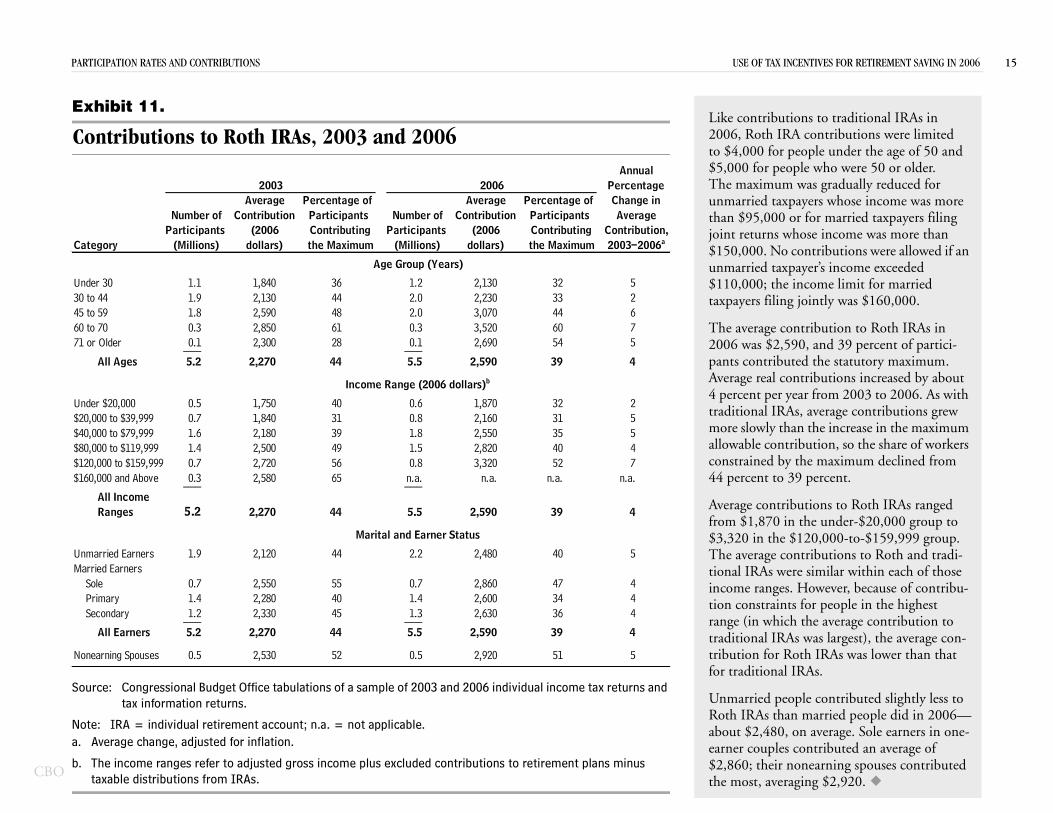
s to traditional IRAs in contributions were limited ple under the age of 50 and
e who were 50 or older. as gradually reduced for ers whose income was more for married taxpayers filing se income was more than ntributions were allowed if an er’s income exceeded
come limit for married intly was $160,000.
ribution to Roth IRAs in , and 39 percent of partici- the statutory maximum. butions increased by about from 2003 to 2006. As with verage contributions grew he increase in the maximum tion, so the share of workers maximum declined from ercent.
ons to Roth IRAs ranged e under-$20,000 group to 0,000-to-$159,999 group. ibutions to Roth and tradi-imilar within each of those wever, because of contribu-
r people in the highest e average contribution to as largest), the average con- IRAs was lower than that s.
contributed slightly less to arried people did in 2006—average. Sole earners in one-tributed an average of arning spouses contributed g $2,920.
urce: Congressional Budget Office tabulations of a sample of 2003 and 2006 individual income tax returns and tax information returns.
te: IRA = individual retirement account; n.a. = not applicable.Average change, adjusted for inflation.
The income ranges refer to adjusted gross income plus excluded contributions to retirement plans minus taxable distributions from IRAs.
der $20,000 0.5 1,750 40 0.6 1,870 32 2,000 to $39,999 0.7 1,840 31 0.8 2,160 31 5,000 to $79,999 1.6 2,180 39 1.8 2,550 35 5,000 to $119,999 1.4 2,500 49 1.5 2,820 40 40,000 to $159,999 0.7 2,720 56 0.8 3,320 52 70,000 and Above 0.3 2,580 65 n.a. n.a. n.a. n.a.___ ___
All Income Ranges 5.2 2,270 44 5.5 2,590 39 4
married Earners 1.9 2,120 44 2.2 2,480 40 5rried EarnersSole 0.7 2,550 55 0.7 2,860 47 4Primary 1.4 2,280 40 1.4 2,600 34 4Secondary 1.2 2,330 45 1.3 2,630 36 4___ ___
All Earners 5.2 2,270 44 5.5 2,590 39 4
nearning Spouses 0.5 2,530 52 0.5 2,920 51 5
Income Range (2006 dollars)b
Marital and Earner Status
Average real contri4 percent per year traditional IRAs, amore slowly than tallowable contribuconstrained by the44 percent to 39 p
Average contributifrom $1,870 in th$3,320 in the $12The average contrtional IRAs were sincome ranges. Hotion constraints forange (in which thtraditional IRAs wtribution for Rothfor traditional IRA
Unmarried peopleRoth IRAs than mabout $2,480, on earner couples con$2,860; their nonethe most, averagin
TICIPATION RATES AND CONTRIBUTIONS USE OF TAX INCE
hibit 11.
ontributions to Roth IRAs, 2003 and 2006
tegory
der 30 1.1 1,840 36 1.2 2,130 32 5to 44 1.9 2,130 44 2.0 2,230 33 2to 59 1.8 2,590 48 2.0 3,070 44 6to 70 0.3 2,850 61 0.3 3,520 60 7or Older 0.1 2,300 28 0.1 2,690 54 5___ ___
All Ages 5.2 2,270 44 5.5 2,590 39 4
Average
the Maximum ContributingParticipants
Percentage of
(Millions)Participants Number of
dollars)(2006
ContributionPercentage of
(Millions)Participants Number of
dollars)(2006
Contribution
Annual2003 2006
Age Group (Years)
2003–2006aContribution,
AverageChange in
PercentageAverage
the Maximum ContributingParticipants
Like contribution2006, Roth IRA to $4,000 for peo$5,000 for peoplThe maximum wunmarried taxpaythan $95,000 or joint returns who$150,000. No counmarried taxpay$110,000; the intaxpayers filing jo
The average cont2006 was $2,590pants contributed
PAR USE OF TAX INCENTIVES FOR RETIREMENT SAVING IN 2006 16
CBO
Ex
Av ditional IRAs, by Ag(D
So ax
No
a.
71
4,000
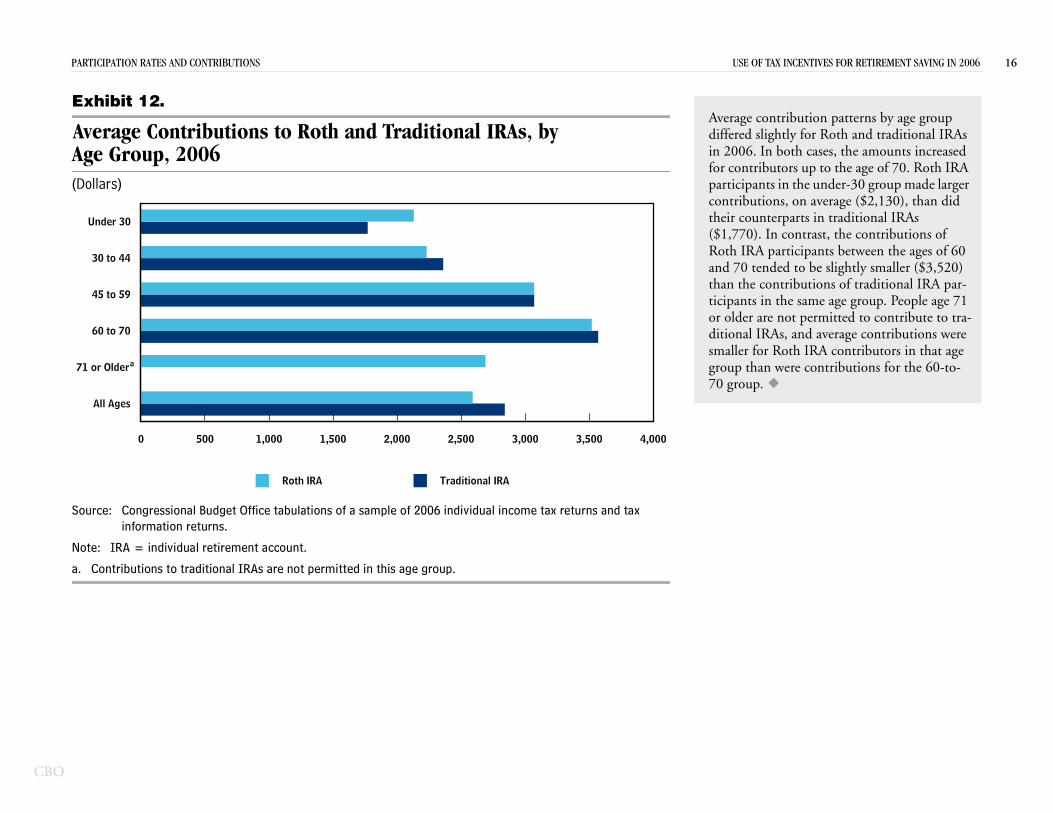
Average contribution patterns by age group differed slightly for Roth and traditional IRAs in 2006. In both cases, the amounts increased for contributors up to the age of 70. Roth IRA participants in the under-30 group made larger contributions, on average ($2,130), than did their counterparts in traditional IRAs ($1,770). In contrast, the contributions of Roth IRA participants between the ages of 60 and 70 tended to be slightly smaller ($3,520) than the contributions of traditional IRA par-ticipants in the same age group. People age 71 or older are not permitted to contribute to tra-ditional IRAs, and average contributions were smaller for Roth IRA contributors in that age group than were contributions for the 60-to- 70 group.
urce: Congressional Budget Office tabulations of a sample of 2006 individual income tax returns and tinformation returns.
te: IRA = individual retirement account.
Contributions to traditional IRAs are not permitted in this age group.
All Ages
0 500 1,000 1,500 2,000 2,500 3,000 3,500
Traditional IRARoth IRA
TICIPATION RATES AND CONTRIBUTIONS
hibit 12.
erage Contributions to Roth and Trae Group, 2006
ollars)
or Older
60 to 70
45 to 59
30 to 44
Under 30
a
CBO
Effe f EGTRRA’s Increases in Contribution Limits
cts o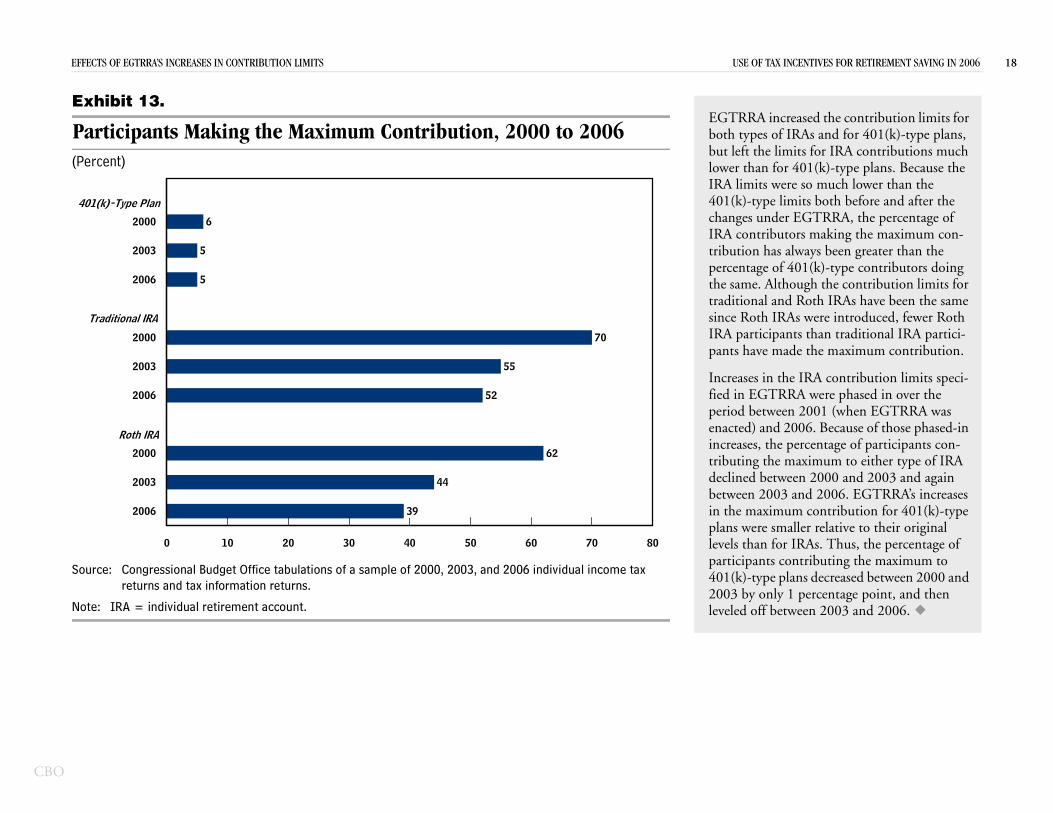
EFF USE OF TAX INCENTIVES FOR RETIREMENT SAVING IN 2006 18
CBO
Ex
P(P
So
No
4
EGTRRA increased the contribution limits for both types of IRAs and for 401(k)-type plans, but left the limits for IRA contributions much lower than for 401(k)-type plans. Because the IRA limits were so much lower than the 401(k)-type limits both before and after the changes under EGTRRA, the percentage of IRA contributors making the maximum con-tribution has always been greater than the percentage of 401(k)-type contributors doing the same. Although the contribution limits for traditional and Roth IRAs have been the same since Roth IRAs were introduced, fewer Roth IRA participants than traditional IRA partici-pants have made the maximum contribution.
Increases in the IRA contribution limits speci-fied in EGTRRA were phased in over the period between 2001 (when EGTRRA was enacted) and 2006. Because of those phased-in increases, the percentage of participants con-tributing the maximum to either type of IRA declined between 2000 and 2003 and again between 2003 and 2006. EGTRRA’s increases in the maximum contribution for 401(k)-type plans were smaller relative to their original levels than for IRAs. Thus, the percentage of participants contributing the maximum to 401(k)-type plans decreased between 2000 and 2003 by only 1 percentage point, and then leveled off between 2003 and 2006.
urce: Congressional Budget Office tabulations of a sample of 2000, 2003, and 2006 individual income tax returns and tax information returns.
te: IRA = individual retirement account.
2006
2003
2000
Roth IRA
2006
0 10 20 30 40 50 60 70 80
39
44
62
52
ECTS OF EGTRRA’S INCREASES IN CONTRIBUTION LIMITS
hibit 13.
articipants Making the Maximum Contribution, 2000 to 2006ercent)
2003
2000
Traditional IRA
2006
2003
2000
01(k)-Type Plan
55
70
5
5
6
EFF USE OF TAX INCENTIVES FOR RETIREMENT SAVING IN 2006 19
CBO
Ex
Av 1997 to 2006(20
So ual income
No
B
To
000 18,000
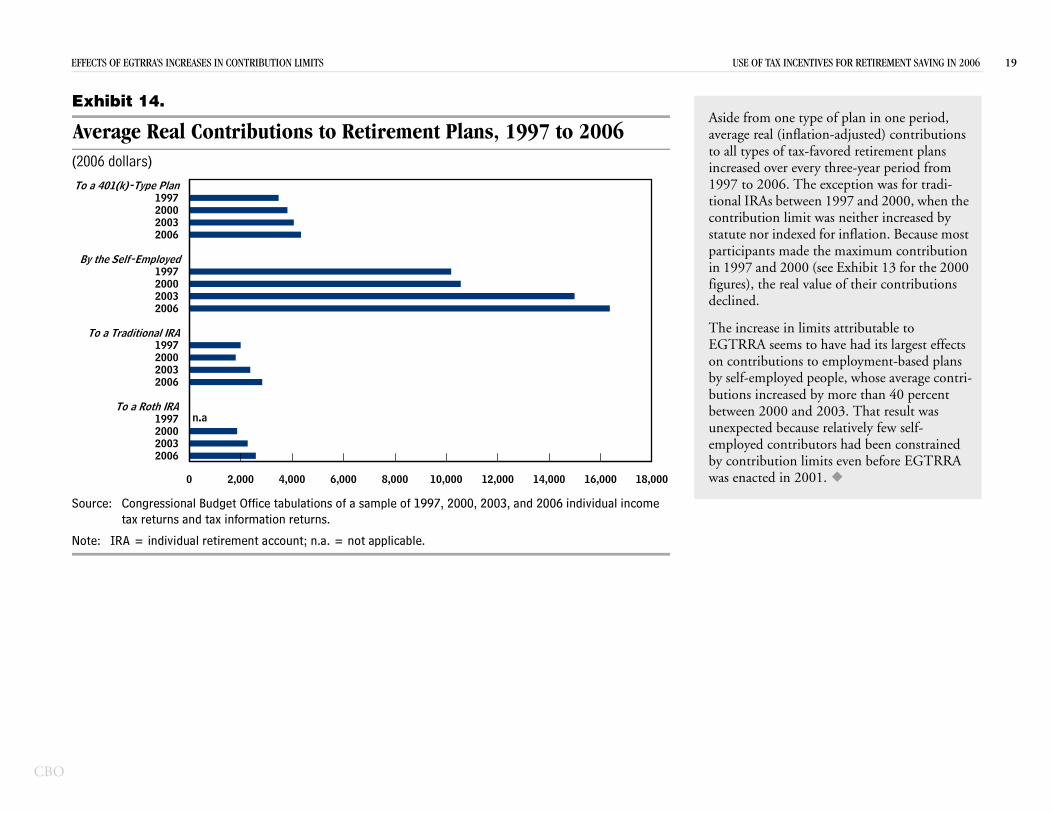
Aside from one type of plan in one period, average real (inflation-adjusted) contributions to all types of tax-favored retirement plans increased over every three-year period from 1997 to 2006. The exception was for tradi-tional IRAs between 1997 and 2000, when the contribution limit was neither increased by statute nor indexed for inflation. Because most participants made the maximum contribution in 1997 and 2000 (see Exhibit 13 for the 2000 figures), the real value of their contributions declined.
The increase in limits attributable to EGTRRA seems to have had its largest effects on contributions to employment-based plans by self-employed people, whose average contri-butions increased by more than 40 percent between 2000 and 2003. That result was unexpected because relatively few self-employed contributors had been constrained by contribution limits even before EGTRRA was enacted in 2001.
urce: Congressional Budget Office tabulations of a sample of 1997, 2000, 2003, and 2006 individtax returns and tax information returns.
te: IRA = individual retirement account; n.a. = not applicable.
2006200320001997
To a Roth IRA
20062003
0 2,000 4,000 6,000 8,000 10,000 12,000 14,000 16,
n.a
ECTS OF EGTRRA’S INCREASES IN CONTRIBUTION LIMITS
hibit 14.
erage Real Contributions to Retirement Plans,06 dollars)
20001997
To a Traditional IRA
2006200320001997
y the Self-Employed
2006200320001997
a 401(k)-Type Plan
EFF USE OF TAX INCENTIVES FOR RETIREMENT SAVING IN 2006 20
CBO
Ex
T40
So
No
a.
Ca
Un 130 645 560 0
Un$2$4$8$1$1
UnMa
A
RA Lawr Pre-rained
ntage ofcipants
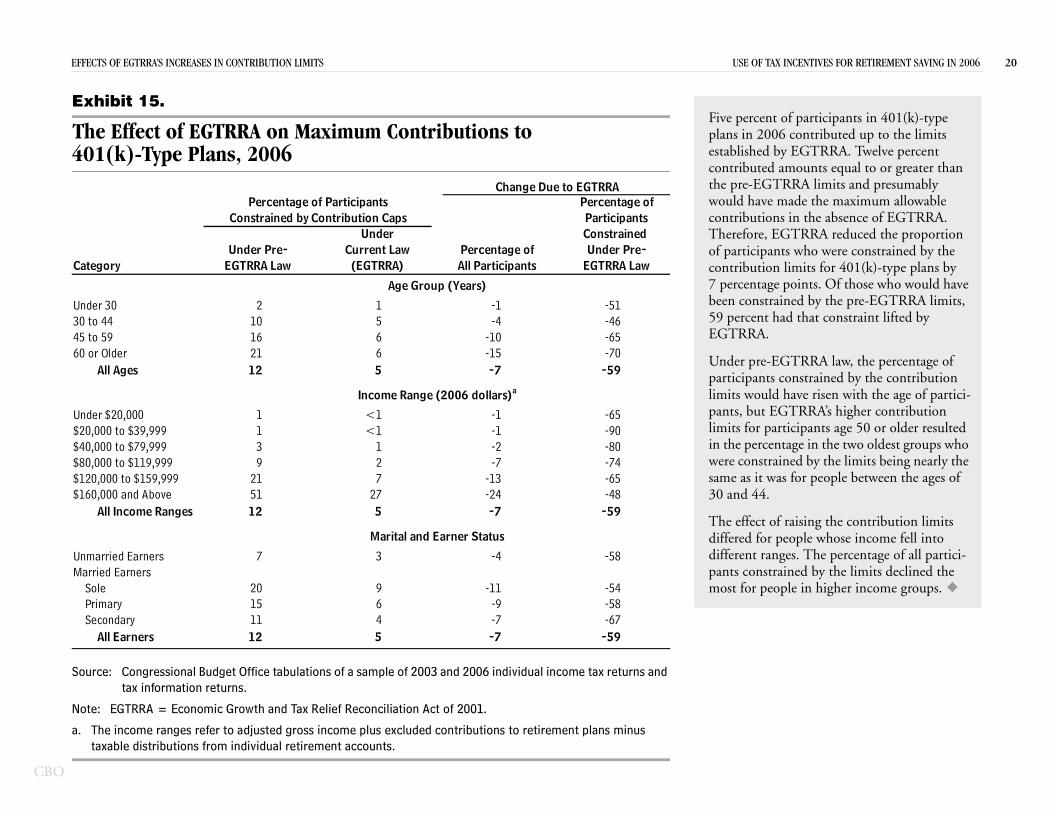
Five percent of participants in 401(k)-type plans in 2006 contributed up to the limits established by EGTRRA. Twelve percent contributed amounts equal to or greater than the pre-EGTRRA limits and presumably would have made the maximum allowable contributions in the absence of EGTRRA. Therefore, EGTRRA reduced the proportion of participants who were constrained by the contribution limits for 401(k)-type plans by 7 percentage points. Of those who would have been constrained by the pre-EGTRRA limits, 59 percent had that constraint lifted by EGTRRA.
Under pre-EGTRRA law, the percentage of trained by the contribution e risen with the age of partici-RA’s higher contribution ants age 50 or older resulted in the two oldest groups who by the limits being nearly the people between the ages of
ing the contribution limits le whose income fell into The percentage of all partici- by the limits declined the n higher income groups.
urce: Congressional Budget Office tabulations of a sample of 2003 and 2006 individual income tax returns and tax information returns.
te: EGTRRA = Economic Growth and Tax Relief Reconciliation Act of 2001.
The income ranges refer to adjusted gross income plus excluded contributions to retirement plans minus taxable distributions from individual retirement accounts.
All Ages 12 5 -7 -59
der $20,000 1 <1 -1 -650,000 to $39,999 1 <1 -1 -900,000 to $79,999 3 1 -2 -800,000 to $119,999 9 2 -7 -7420,000 to $159,999 21 7 -13 -6560,000 and Above 51 27 -24 -48
All Income Ranges 12 5 -7 -59
married Earners 7 3 -4 -58rried Earners
Sole 20 9 -11 -54Primary 15 6 -9 -58Secondary 11 4 -7 -67
All Earners 12 5 -7 -59
Income Range (2006 dollars)a
Marital and Earner Status
participants conslimits would havpants, but EGTRlimits for participin the percentagewere constrainedsame as it was for30 and 44.
The effect of raisdiffered for peopdifferent ranges. pants constrainedmost for people i
ECTS OF EGTRRA’S INCREASES IN CONTRIBUTION LIMITS
hibit 15.
he Effect of EGTRRA on Maximum Contributions to 1(k)-Type Plans, 2006
tegory
der 30 2 1 -1 -5 to 44 10 5 -4 -4 to 59 16 6 -10 -6 or Older 21 6 -15 -7
Change Due to EGTRRPercentage of Participants
EGTRRA LawUnder Pre-
(EGTRRA)Current Law
Under
All Participants EGTRUnde
Constrained by Contribution CapsConst
PerceParti
Percentage of
Age Group (Years)
EFF INCENTIVES FOR RETIREMENT SAVING IN 2006 21
CBO
Ex
TTr
So
No
a.
Ca
Un304560
Un$2$4$8$1$1
UnMa
No
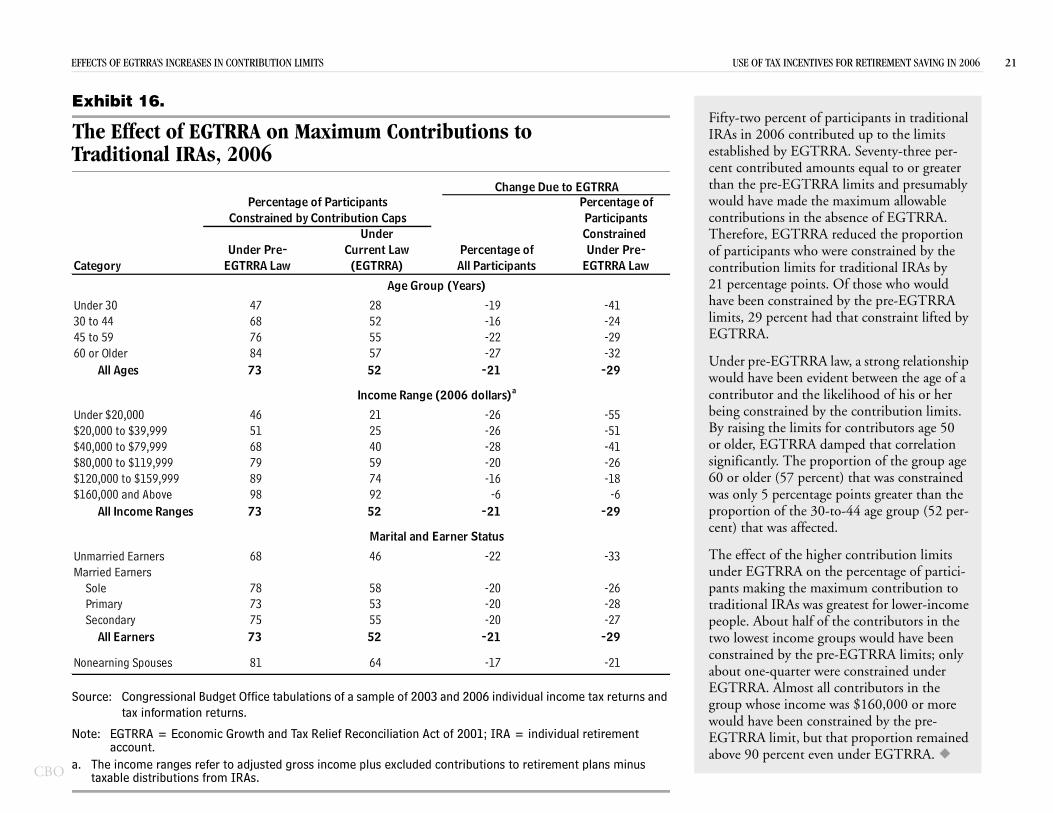
rcent of participants in traditional 6 contributed up to the limits y EGTRRA. Seventy-three per-uted amounts equal to or greater -EGTRRA limits and presumably made the maximum allowable s in the absence of EGTRRA. GTRRA reduced the proportion ts who were constrained by the limits for traditional IRAs by e points. Of those who would nstrained by the pre-EGTRRA rcent had that constraint lifted by
GTRRA law, a strong relationship vident between the age of a e likelihood of his or her by the contribution limits. ts for contributors age 50 damped that correlation
proportion of the group age rcent) that was constrained tage points greater than the 30-to-44 age group (52 per-cted.
igher contribution limits n the percentage of partici-maximum contribution to as greatest for lower-income f of the contributors in the groups would have been pre-EGTRRA limits; only were constrained under t all contributors in the
e was $160,000 or more onstrained by the pre-ut that proportion remained ven under EGTRRA.
urce: Congressional Budget Office tabulations of a sample of 2003 and 2006 individual income tax returns and tax information returns.
te: EGTRRA = Economic Growth and Tax Relief Reconciliation Act of 2001; IRA = individual retirement account.
The income ranges refer to adjusted gross income plus excluded contributions to retirement plans minus taxable distributions from IRAs.
All Ages 73 52 -21 -29
der $20,000 46 21 -26 -550,000 to $39,999 51 25 -26 -510,000 to $79,999 68 40 -28 -410,000 to $119,999 79 59 -20 -2620,000 to $159,999 89 74 -16 -1860,000 and Above 98 92 -6 -6
All Income Ranges 73 52 -21 -29
married Earners 68 46 -22 -33rried Earners
Sole 78 58 -20 -26Primary 73 53 -20 -28Secondary 75 55 -20 -27
All Earners 73 52 -21 -29
nearning Spouses 81 64 -17 -21
Income Range (2006 dollars)a
Marital and Earner Status
would have been econtributor and thbeing constrained By raising the limior older, EGTRRAsignificantly. The 60 or older (57 pewas only 5 percenproportion of the cent) that was affe
The effect of the hunder EGTRRA opants making the traditional IRAs wpeople. About haltwo lowest incomeconstrained by theabout one-quarterEGTRRA. Almosgroup whose incomwould have been cEGTRRA limit, babove 90 percent e
ECTS OF EGTRRA’S INCREASES IN CONTRIBUTION LIMITS USE OF TAX
hibit 16.
he Effect of EGTRRA on Maximum Contributions to aditional IRAs, 2006
tegory
der 30 47 28 -19 -41 to 44 68 52 -16 -24 to 59 76 55 -22 -29 or Older 84 57 -27 -32
Age Group (Years)
Percentage of Participants
EGTRRA LawUnder Pre-
(EGTRRA)Current Law
Under
All Participants EGTRRA LawUnder Pre-
Constrained Constrained by Contribution Caps
Percentage ofParticipants
Percentage of
Change Due to EGTRRA
Fifty-two peIRAs in 200established bcent contribthan the prewould have contributionTherefore, Eof participancontribution21 percentaghave been colimits, 29 peEGTRRA.
Under pre-E
EFF E OF TAX INCENTIVES FOR RETIREMENT SAVING IN 2006 22
CBO
Ex
TR
So
No
a.
Ca
Un304560
Un$2$4$8$1$1
UnMa
No
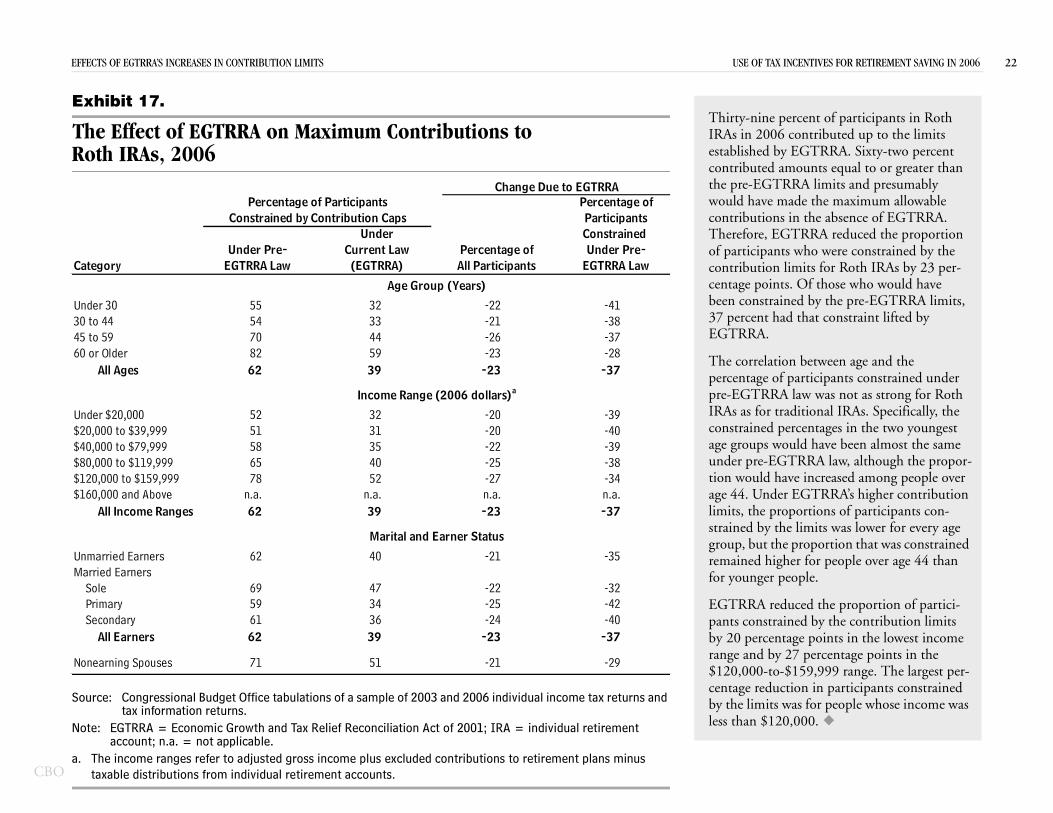
-nine percent of participants in Roth n 2006 contributed up to the limits shed by EGTRRA. Sixty-two percent buted amounts equal to or greater than e-EGTRRA limits and presumably have made the maximum allowable butions in the absence of EGTRRA. fore, EGTRRA reduced the proportion icipants who were constrained by the
bution limits for Roth IRAs by 23 per-e points. Of those who would have onstrained by the pre-EGTRRA limits, cent had that constraint lifted by RA.
rrelation between age and the ipants constrained under as not as strong for Roth al IRAs. Specifically, the
ages in the two youngest ave been almost the same law, although the propor-
reased among people over RRA’s higher contribution ns of participants con-
ts was lower for every age ortion that was constrained people over age 44 than
the proportion of partici-y the contribution limits ints in the lowest income centage points in the
999 range. The largest per- participants constrained people whose income was
urce: Congressional Budget Office tabulations of a sample of 2003 and 2006 individual income tax returns and tax information returns.
te: EGTRRA = Economic Growth and Tax Relief Reconciliation Act of 2001; IRA = individual retirement account; n.a. = not applicable.
The income ranges refer to adjusted gross income plus excluded contributions to retirement plans minus taxable distributions from individual retirement accounts.
All Ages 62 39 -23 -37
der $20,000 52 32 -20 -390,000 to $39,999 51 31 -20 -400,000 to $79,999 58 35 -22 -390,000 to $119,999 65 40 -25 -3820,000 to $159,999 78 52 -27 -3460,000 and Above n.a. n.a. n.a. n.a.
All Income Ranges 62 39 -23 -37
married Earners 62 40 -21 -35rried Earners
Sole 69 47 -22 -32Primary 59 34 -25 -42Secondary 61 36 -24 -40
All Earners 62 39 -23 -37
nearning Spouses 71 51 -21 -29
Income Range (2006 dollars)a
Marital and Earner Status
percentage of particpre-EGTRRA law wIRAs as for traditionconstrained percentage groups would hunder pre-EGTRRAtion would have incage 44. Under EGTlimits, the proportiostrained by the limigroup, but the propremained higher forfor younger people.
EGTRRA reduced pants constrained bby 20 percentage porange and by 27 per$120,000-to-$159,centage reduction inby the limits was forless than $120,000.
ECTS OF EGTRRA’S INCREASES IN CONTRIBUTION LIMITS US
hibit 17.
he Effect of EGTRRA on Maximum Contributions to oth IRAs, 2006
tegory
der 30 55 32 -22 -41 to 44 54 33 -21 -38 to 59 70 44 -26 -37 or Older 82 59 -23 -28
Age Group (Years)
Percentage of Participants
EGTRRA LawUnder Pre-
(EGTRRA)Current Law
Under
All Participants EGTRRA LawUnder Pre-
Constrained Constrained by Contribution Caps
Percentage ofParticipants
Percentage of
Change Due to EGTRRA
ThirtyIRAs iestablicontrithe prwouldcontriThereof partcontricentagbeen c37 perEGTR
The co

CBO
Use of the Saver’s Credit
USE USE OF TAX INCENTIVES FOR RETIREMENT SAVING IN 2006 24
CBO
Ex
E
So urns and
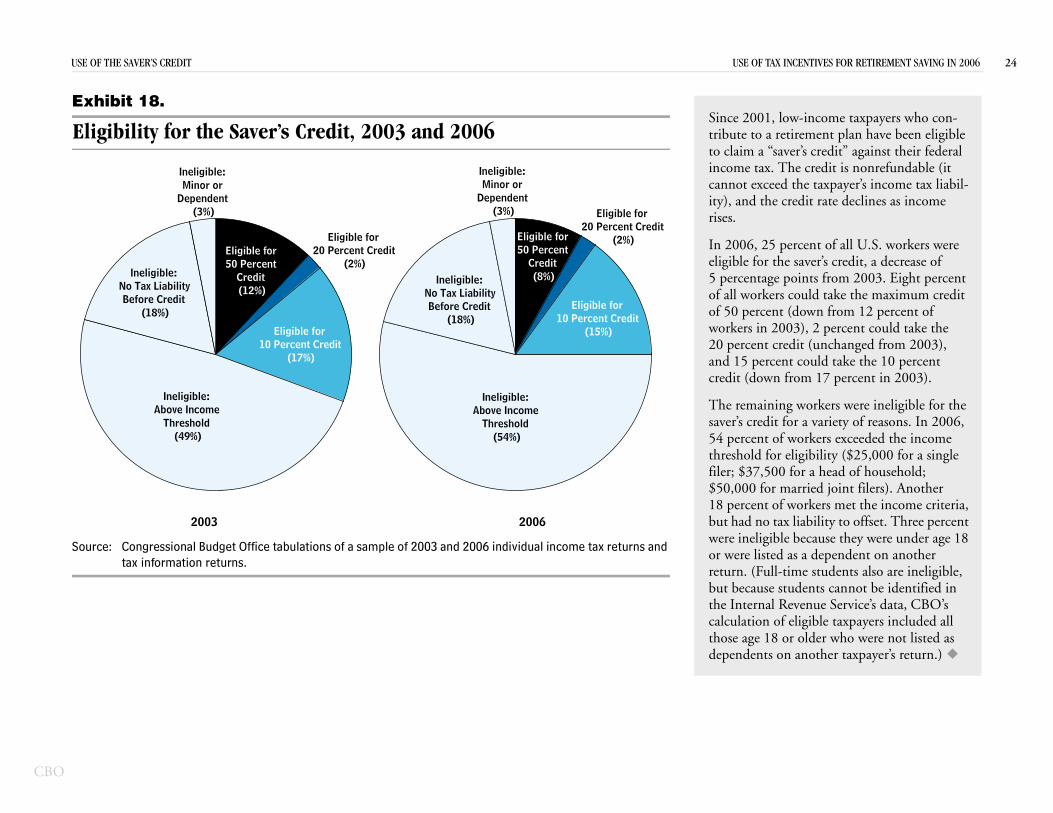
Since 2001, low-income taxpayers who con-tribute to a retirement plan have been eligible to claim a “saver’s credit” against their federal income tax. The credit is nonrefundable (it cannot exceed the taxpayer’s income tax liabil-ity), and the credit rate declines as income rises.
In 2006, 25 percent of all U.S. workers were eligible for the saver’s credit, a decrease of 5 percentage points from 2003. Eight percent of all workers could take the maximum credit of 50 percent (down from 12 percent of workers in 2003), 2 percent could take the 20 percent credit (unchanged from 2003), and 15 percent could take the 10 percent credit (down from 17 percent in 2003).
The remaining workers were ineligible for the saver’s credit for a variety of reasons. In 2006, 54 percent of workers exceeded the income threshold for eligibility ($25,000 for a single filer; $37,500 for a head of household; $50,000 for married joint filers). Another 18 percent of workers met the income criteria, but had no tax liability to offset. Three percent were ineligible because they were under age 18 or were listed as a dependent on another return. (Full-time students also are ineligible, but because students cannot be identified in the Internal Revenue Service’s data, CBO’s calculation of eligible taxpayers included all those age 18 or older who were not listed as dependents on another taxpayer’s return.)
urce: Congressional Budget Office tabulations of a sample of 2003 and 2006 individual income tax rettax information returns.
Ineligible:Above Income
Threshold (49%)
Ineligible:Above Income
Threshold (54%)
2003 2006
OF THE SAVER’S CREDIT
hibit 18.
ligibility for the Saver’s Credit, 2003 and 2006
Eligible for50 Percent
Credit (12%)
Eligible for20 Percent Credit
(2%)
Eligible for10 Percent Credit
(17%)
Ineligible:No Tax LiabilityBefore Credit
(18%)
Ineligible:Minor or
Dependent (3%)
Eligible for50 Percent
Credit (8%)
Eligible for20 Percent Credit
(2%)
Eligible for10 Percent Credit
(15%)
Ineligible:No Tax LiabilityBefore Credit
(18%)
Ineligible:Minor or
Dependent (3%)
USE USE OF TAX INCENTIVES FOR RETIREMENT SAVING IN 2006 25
CBO
Ex
C
So
Ca
Un304560
502010
UnMa
No
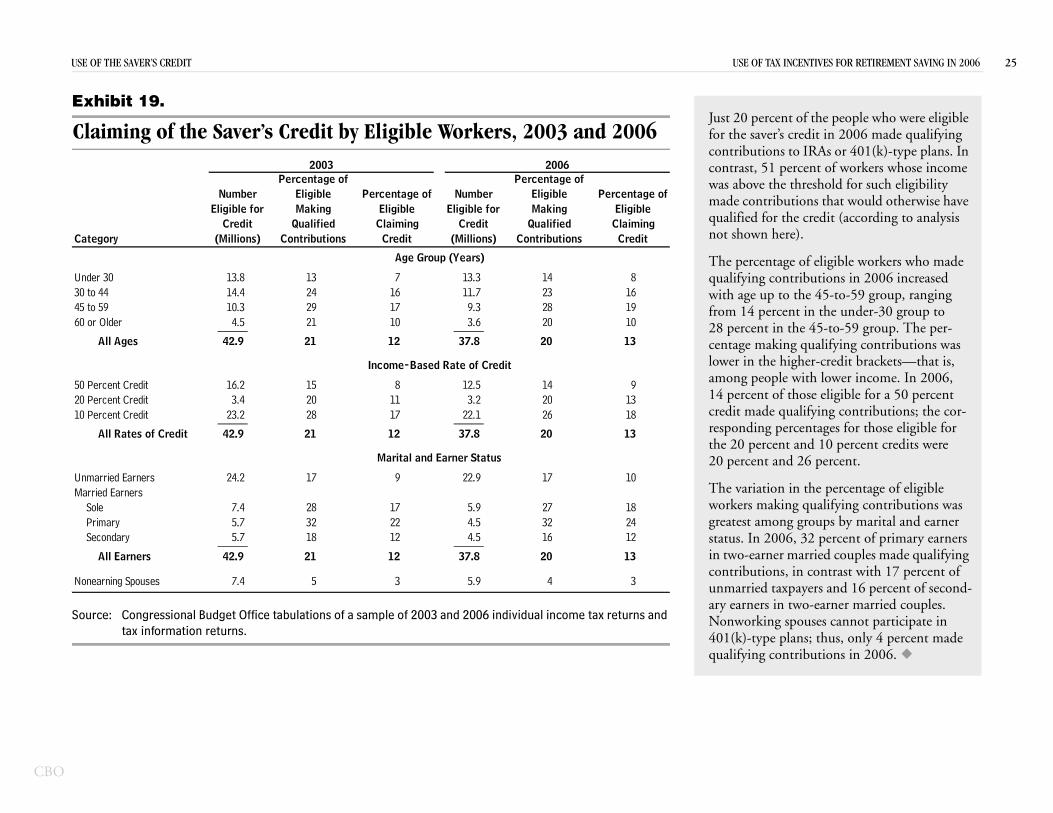
Just 20 percent of the people who were eligible for the saver’s credit in 2006 made qualifying contributions to IRAs or 401(k)-type plans. In contrast, 51 percent of workers whose income was above the threshold for such eligibility made contributions that would otherwise have qualified for the credit (according to analysis not shown here).
The percentage of eligible workers who made qualifying contributions in 2006 increased with age up to the 45-to-59 group, ranging from 14 percent in the under-30 group to 28 percent in the 45-to-59 group. The per-centage making qualifying contributions was lower in the higher-credit brackets—that is, among people with lower income. In 2006, 14 percent of those eligible for a 50 percent credit made qualifying contributions; the cor-responding percentages for those eligible for the 20 percent and 10 percent credits were 20 percent and 26 percent.
The variation in the percentage of eligible workers making qualifying contributions was greatest among groups by marital and earner status. In 2006, 32 percent of primary earners in two-earner married couples made qualifying contributions, in contrast with 17 percent of unmarried taxpayers and 16 percent of second-ary earners in two-earner married couples. Nonworking spouses cannot participate in 401(k)-type plans; thus, only 4 percent made qualifying contributions in 2006.
urce: Congressional Budget Office tabulations of a sample of 2003 and 2006 individual income tax returns and tax information returns.
Percent Credit 16.2 15 8 12.5 14 9 Percent Credit 3.4 20 11 3.2 20 13 Percent Credit 23.2 28 17 22.1 26 18_____ _____
All Rates of Credit 42.9 21 12 37.8 20 13
married Earners 24.2 17 9 22.9 17 10rried EarnersSole 7.4 28 17 5.9 27 18Primary 5.7 32 22 4.5 32 24Secondary 5.7 18 12 4.5 16 12_____ _____
All Earners 42.9 21 12 37.8 20 13
nearning Spouses 7.4 5 3 5.9 4 3
Marital and Earner Status
OF THE SAVER’S CREDIT
hibit 19.
laiming of the Saver’s Credit by Eligible Workers, 2003 and 2006
tegory
der 30 13.8 13 7 13.3 14 8 to 44 14.4 24 16 11.7 23 16 to 59 10.3 29 17 9.3 28 19 or Older 4.5 21 10 3.6 20 10_____ _____
All Ages 42.9 21 12 37.8 20 13
Age Group (Years)
Income-Based Rate of Credit
Eligible forCredit
Making
(Millions) Contributions Credit (Millions) Contributions Credit
MakingQualified
EligibleNumber Eligible
Percentage of
Claiming
2006
QualifiedEligible
Percentage of
ClaimingEligible for
Credit
Percentage ofNumber Eligible Percentage of
2003
USE USE OF TAX INCENTIVES FOR RETIREMENT SAVING IN 2006 26
CBO
Ex
E(P
So urns and tax
Inc
70 80
65
657575
65
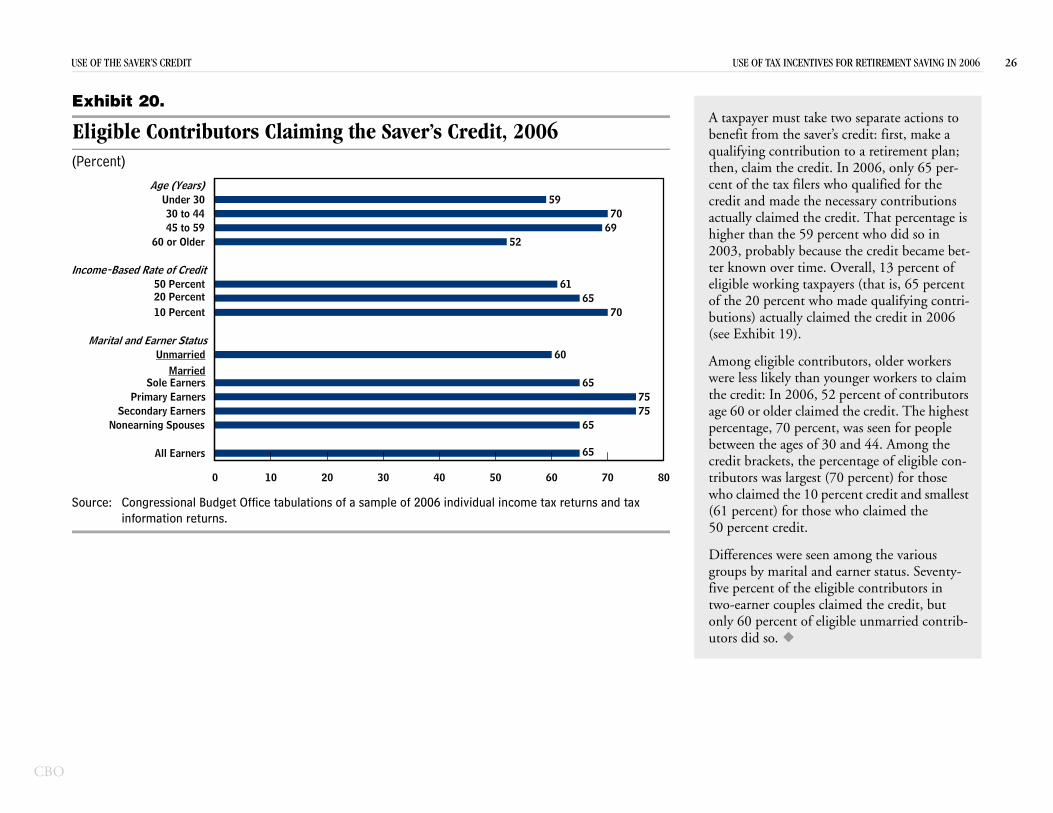
A taxpayer must take two separate actions to benefit from the saver’s credit: first, make a qualifying contribution to a retirement plan; then, claim the credit. In 2006, only 65 per-cent of the tax filers who qualified for the credit and made the necessary contributions actually claimed the credit. That percentage is higher than the 59 percent who did so in 2003, probably because the credit became bet-ter known over time. Overall, 13 percent of eligible working taxpayers (that is, 65 percent of the 20 percent who made qualifying contri-butions) actually claimed the credit in 2006 (see Exhibit 19).
Among eligible contributors, older workers were less likely than younger workers to claim the credit: In 2006, 52 percent of contributors age 60 or older claimed the credit. The highest percentage, 70 percent, was seen for people between the ages of 30 and 44. Among the credit brackets, the percentage of eligible con-tributors was largest (70 percent) for those who claimed the 10 percent credit and smallest (61 percent) for those who claimed the 50 percent credit.
Differences were seen among the various groups by marital and earner status. Seventy-five percent of the eligible contributors in two-earner couples claimed the credit, but only 60 percent of eligible unmarried contrib-utors did so.
urce: Congressional Budget Office tabulations of a sample of 2006 individual income tax retinformation returns.
All Earners
Nonearning SpousesSecondary Earners
Primary EarnersSole Earners
Married
0 10 20 30 40 50 60
OF THE SAVER’S CREDIT
hibit 20.
ligible Contributors Claiming the Saver’s Credit, 2006ercent)
UnmarriedMarital and Earner Status
10 Percent20 Percent50 Percent
ome-Based Rate of Credit
60 or Older45 to 5930 to 44
Under 30Age (Years)
60
7065
61
526970
59
USE USE OF TAX INCENTIVES FOR RETIREMENT SAVING IN 2006 27
CBO
Ex
Av ns, 20
So
Ca
Un 950 12030 1,400 14745 2,080 18360 2,870 214
1,590 156
502010
UnMa
No
(2006 dollars) (2006 dollars)
AverageContribution
AverageCredit
2006
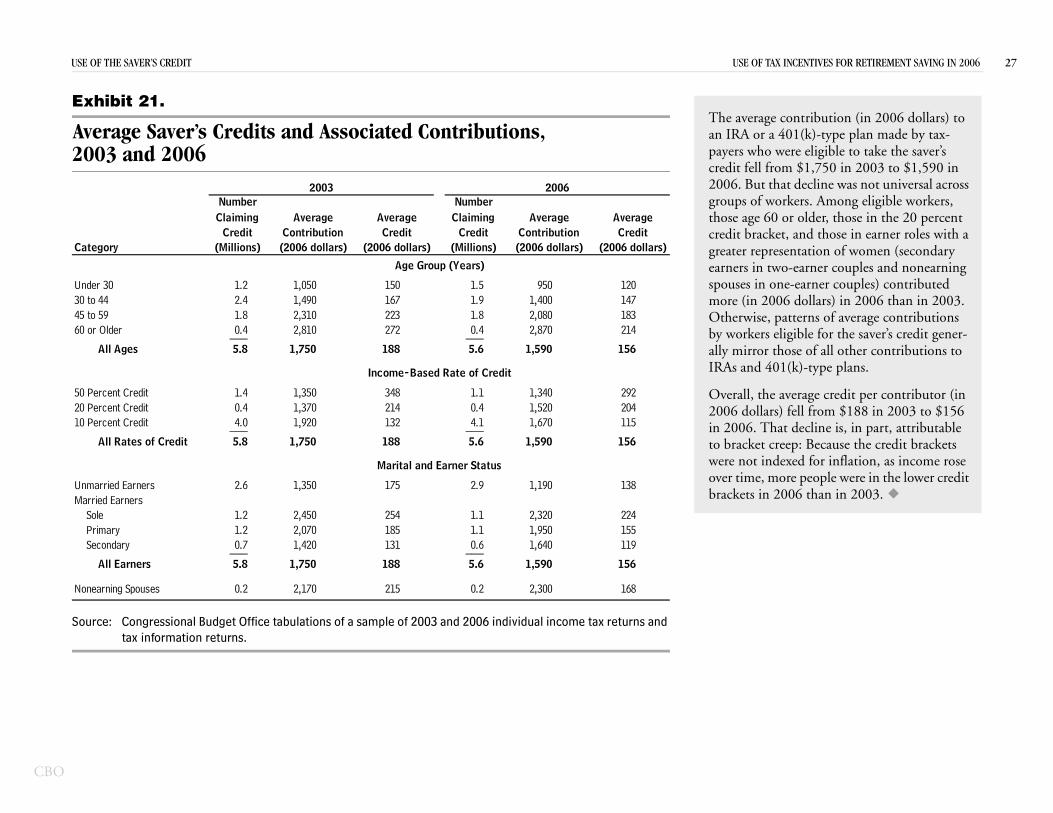
The average contribution (in 2006 dollars) to an IRA or a 401(k)-type plan made by tax-payers who were eligible to take the saver’s credit fell from $1,750 in 2003 to $1,590 in 2006. But that decline was not universal across groups of workers. Among eligible workers, those age 60 or older, those in the 20 percent credit bracket, and those in earner roles with a greater representation of women (secondary earners in two-earner couples and nonearning spouses in one-earner couples) contributed more (in 2006 dollars) in 2006 than in 2003. Otherwise, patterns of average contributions by workers eligible for the saver’s credit gener-ally mirror those of all other contributions to IRAs and 401(k)-type plans.
Overall, the average credit per contributor (in 2006 dollars) fell from $188 in 2003 to $156 in 2006. That decline is, in part, attributable to bracket creep: Because the credit brackets were not indexed for inflation, as income rose over time, more people were in the lower credit brackets in 2006 than in 2003.
urce: Congressional Budget Office tabulations of a sample of 2003 and 2006 individual income tax returns and tax information returns.
Percent Credit 1.4 1,350 348 1.1 1,340 292 Percent Credit 0.4 1,370 214 0.4 1,520 204 Percent Credit 4.0 1,920 132 4.1 1,670 115___ ___
All Rates of Credit 5.8 1,750 188 5.6 1,590 156
married Earners 2.6 1,350 175 2.9 1,190 138rried EarnersSole 1.2 2,450 254 1.1 2,320 224Primary 1.2 2,070 185 1.1 1,950 155Secondary 0.7 1,420 131 0.6 1,640 119___ ___
All Earners 5.8 1,750 188 5.6 1,590 156
nearning Spouses 0.2 2,170 215 0.2 2,300 168
Income-Based Rate of Credit
Marital and Earner Status
OF THE SAVER’S CREDIT
hibit 21.
erage Saver’s Credits and Associated Contributio03 and 2006
tegory
der 30 1.2 1,050 150 1.5 to 44 2.4 1,490 167 1.9 to 59 1.8 2,310 223 1.8 or Older 0.4 2,810 272 0.4___ ___
All Ages 5.8 1,750 188 5.6
Age Group (Years)
ClaimingCredit
Average
(Millions) (2006 dollars) (2006 dollars) (Millions)
Number
ContributionAverageCredit
ClaimingCredit
Number2003
USE E OF TAX INCENTIVES FOR RETIREMENT SAVING IN 2006 28
CBO
Ex
OM
So
No
Ca
Un304560
502010
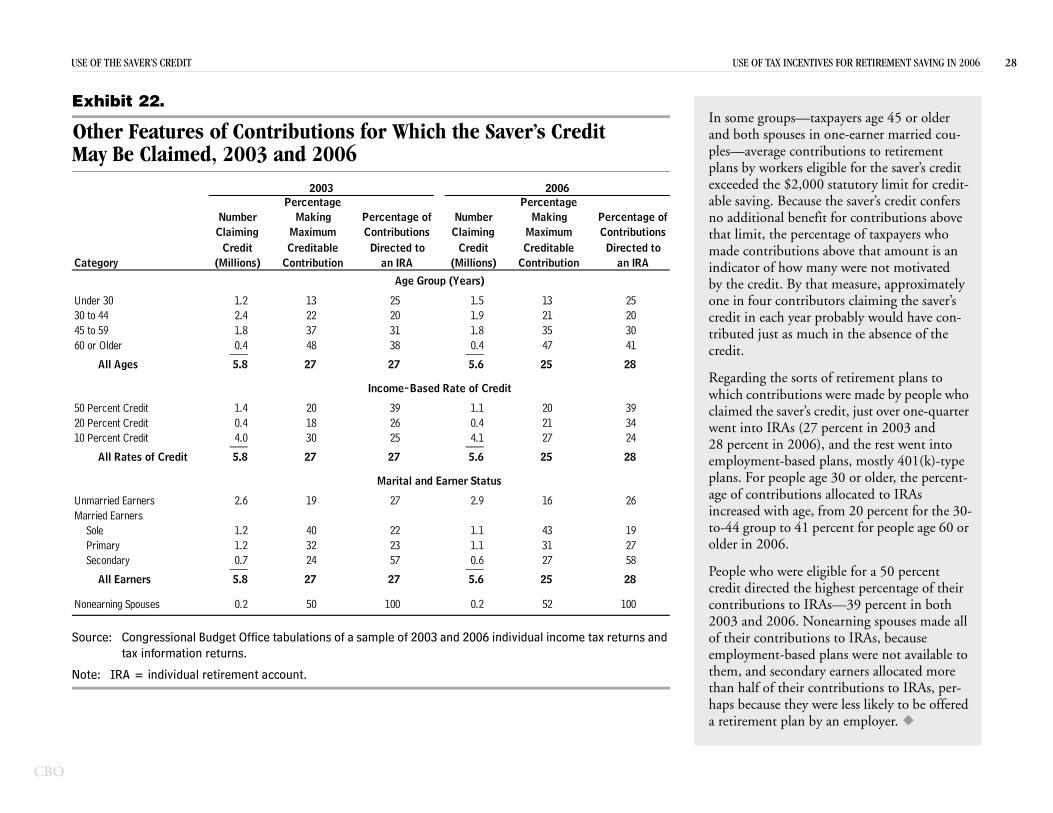
UnMa
No
e groups—taxpayers age 45 or older th spouses in one-earner married cou-average contributions to retirement y workers eligible for the saver’s credit ed the $2,000 statutory limit for credit-ving. Because the saver’s credit confers itional benefit for contributions above it, the percentage of taxpayers who
contributions above that amount is an tor of how many were not motivated credit. By that measure, approximately four contributors claiming the saver’s in each year probably would have con-d just as much in the absence of the
arding the sorts of retirement plans to h contributions were made by people who ed the saver’s credit, just over one-quarter
t into IRAs (27 percent in 2003 and ercent in 2006), and the rest went into loyment-based plans, mostly 401(k)-type s. For people age 30 or older, the percent-of contributions allocated to IRAs eased with age, from 20 percent for the 30-4 group to 41 percent for people age 60 or r in 2006.
le who were eligible for a 50 percent it directed the highest percentage of their ributions to IRAs—39 percent in both 3 and 2006. Nonearning spouses made all eir contributions to IRAs, because loyment-based plans were not available to , and secondary earners allocated more
half of their contributions to IRAs, per- because they were less likely to be offered irement plan by an employer.
urce: Congressional Budget Office tabulations of a sample of 2003 and 2006 individual income tax returns and tax information returns.
te: IRA = individual retirement account.
Percent Credit 1.4 20 39 1.1 20 39 Percent Credit 0.4 18 26 0.4 21 34 Percent Credit 4.0 30 25 4.1 27 24___ ___
All Rates of Credit 5.8 27 27 5.6 25 28
married Earners 2.6 19 27 2.9 16 26rried EarnersSole 1.2 40 22 1.1 43 19Primary 1.2 32 23 1.1 31 27Secondary 0.7 24 57 0.6 27 58___ ___
All Earners 5.8 27 27 5.6 25 28
nearning Spouses 0.2 50 100 0.2 52 100
Income-Based Rate of Credit
Marital and Earner Status
Regwhicclaimwen28 pempplanage incrto-4olde
Peopcredcont200of thempthemthanhapsa ret
OF THE SAVER’S CREDIT US
hibit 22.
ther Features of Contributions for Which the Saver’s Credit ay Be Claimed, 2003 and 2006
tegory
der 30 1.2 13 25 1.5 13 25 to 44 2.4 22 20 1.9 21 20 to 59 1.8 37 31 1.8 35 30 or Older 0.4 48 38 0.4 47 41___ ___
All Ages 5.8 27 27 5.6 25 28
2006Percentage
Contribution an IRADirected to
ClaimingCredit
Number Making Percentage of
2003
MakingPercentage
Percentage ofNumberMaximum
Age Group (Years)
ClaimingCredit Creditable
(Millions) (Millions) Contribution an IRA
MaximumCreditable
Contributions ContributionsDirected to
In somand boples—plans bexceedable sano addthat limmade indicaby theone incredit tributecredit.
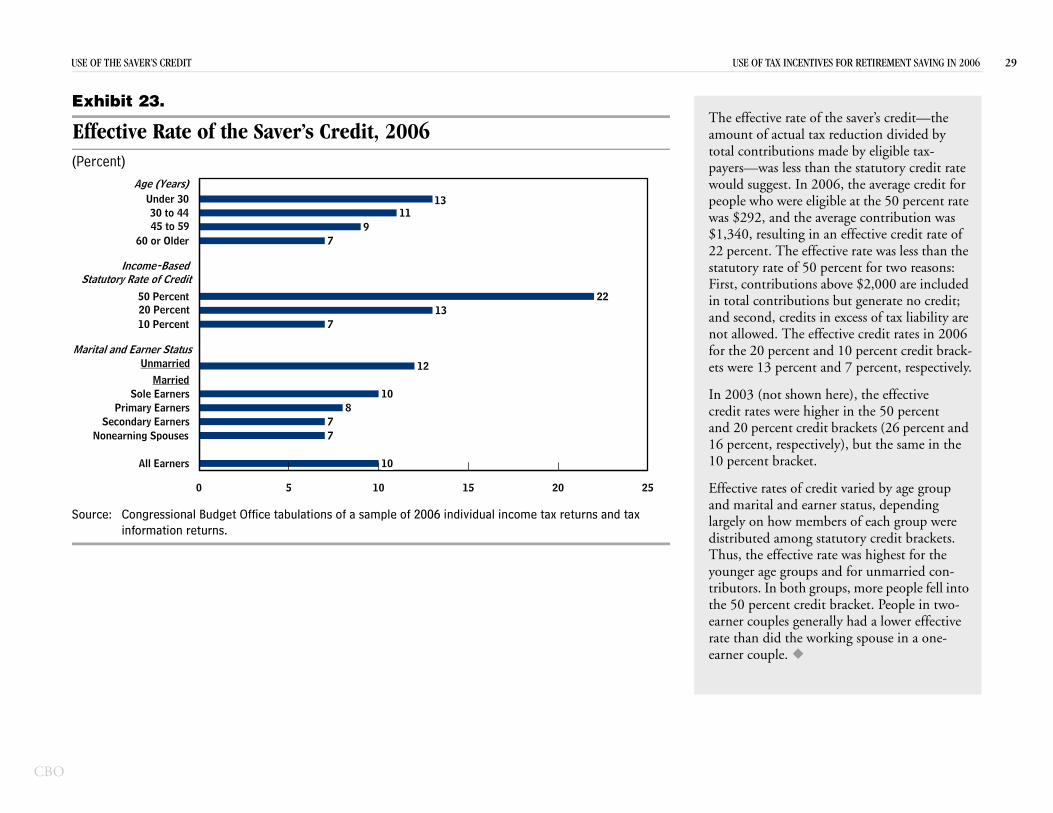
USE USE OF TAX INCENTIVES FOR RETIREMENT SAVING IN 2006 29
CBO
Ex
E(P
So s and tax
Ma
S
25
The effective rate of the saver’s credit—the amount of actual tax reduction divided by total contributions made by eligible tax-payers—was less than the statutory credit rate would suggest. In 2006, the average credit for people who were eligible at the 50 percent rate was $292, and the average contribution was $1,340, resulting in an effective credit rate of 22 percent. The effective rate was less than the statutory rate of 50 percent for two reasons: First, contributions above $2,000 are included in total contributions but generate no credit; and second, credits in excess of tax liability are not allowed. The effective credit rates in 2006 for the 20 percent and 10 percent credit brack-ets were 13 percent and 7 percent, respectively.
In 2003 (not shown here), the effective credit rates were higher in the 50 percent and 20 percent credit brackets (26 percent and 16 percent, respectively), but the same in the 10 percent bracket.
Effective rates of credit varied by age group and marital and earner status, depending largely on how members of each group were distributed among statutory credit brackets. Thus, the effective rate was highest for the younger age groups and for unmarried con-tributors. In both groups, more people fell into the 50 percent credit bracket. People in two-earner couples generally had a lower effective rate than did the working spouse in a one-earner couple.
urce: Congressional Budget Office tabulations of a sample of 2006 individual income tax returninformation returns.
All Earners
Nonearning SpousesSecondary Earners
Primary EarnersSole Earners
Married
0 5 10 15 20
10
77
810
OF THE SAVER’S CREDIT
hibit 23.
ffective Rate of the Saver’s Credit, 2006ercent)
Unmarriedrital and Earner Status
10 Percent20 Percent50 Percent
Income-Basedtatutory Rate of Credit
60 or Older45 to 5930 to 44
Under 30Age (Years)
12
713
22
79
1113
CBO
as bata fo indiual inatione (IReoplsed tribuoun
o retise em in thd to
tes inrage a sam IRSs Winando nckinTherts reudg
ures
of wsed pr “ret
d-compensation amounts. Participants in tributory plans only were those with zero
d compensation but for whom the “retire-lan” box had been checked.
ployed participants in employment-based ere defined as those who reported some t on the line of Form 1040 labeled “Self-ed SEP [simplified employee pension], E [Savings Incentive Match Plan for yees], and qualified plans.” No subgroups e identified.
rticipants also were divided into two ups (in this case, not mutually exclusive): ontributing to a traditional IRAs and those uting to a Roth IRA. The subgroups were
ied on the basis of the plan type checked in of Form 5498. Because each plan issues a e Form 5498, taxpayers could fit into both ups, although only 3 percent of IRA partici-id so in 2006.
in Exhibit 4, participation rates are ed as a percentage of all workers represented database; that is, those who reported wages aries or attached at least one Schedule SE rm filled out by self-employed filers). There 50 million such workers in 2006 (including ho were claimed as a dependent on another r’s return). CBO estimates, on the basis of
This analysis wcontribution dament plans and(IRAs). Individated tax informRevenue Servicself-employed pemployment-bapayers who conplan and the amcontributions tered here becauto the IRS onlycannot be linke
Participation raIRAs—and avetabulated from prepared by thedata from Form5498 (filed by fmation returns consistency chethemselves do. with the amounCongressional Bseparate proced
The subgroupsemployment-babasis of whethe
lans were defined on the irement plan” was checked in
those wtaxpaye
2. The procedures are described in Congressional Budget Office, Utilization of Tax Incentives for Retirement Saving (August 2003), Appendix A, pp. 15–19.
rement plans are not consid-ployers report those amounts e aggregate, and the amounts
individual taxpayers.
employment-based plans and contributions to each—were ple of tax returns for 2006
and enhanced by attaching -2 (filed by employers) and cial institutions).1 Those infor-ot undergo the same degree of g at the IRS that the tax returns efore, to impose consistency ported on Forms 1040, the et Office (CBO) developed for the two files.2
age-earning participants in
Emplocould b
IRA pasubgrothose ccontribidentifBox 7 separatsubgropants d
Exceptexpressin the and sal(the fowere 1
1. Because the tabulations are from a sample, some sampling error is inevitable. The IRS publishes coefficients of varia-tion (CVs) for most of the fields that can be extracted from Forms 1040. For IRA and self-employed contribu-tions in 2006, the CV for those fields (both the number of returns and the amounts) was between 1.5 and 1.8 percent (see Internal Revenue Service, Statistics of Income 2006: Individual Income Tax Returns [July 2008], pp. 66–67). A CV of 1.8 percent implies that the value in the full popu-lation will fall within a range that is within 3.6 percent (higher or lower) of the tabulated average in 19 samples out of 20. For a tabulated dollar amount of $1,000, that would correspond to a range of $964 to $1,036. Corre-sponding CVs in 1997 were slightly higher but still less than 3 percent (see Internal Revenue Service, Statistics of Income 1997: Individual Income Tax Returns [December 1999], pp. 58–59). CVs for contributions to 401(k)-type plans are not published but probably would be lower than for contributions to IRAs or retirement plans for the self-employed.
Appendix:Data and Methods
sed on participation and r employment-based retire-vidual retirement accounts come tax returns and associ- returns filed with the Internal S) identify wage earners and e who are covered by an retirement plan as well as tax-te to an IRA or 401(k)-type ts they contribute. Employer
Box 13 of Form W-2 and whether there was a deferred-compensation amount shown in Box 12 of that form. Wage-earning participants in employ-ment-based plans were separated into two discrete subgroups: those who contributed to a 401(k)-type plan (and, possibly, also participated in non-contributory plans) and those who participated in a noncontributory plan only. Participants in 401(k)-type plans were those with positive
deferrenoncondeferrement p
Self-emplans wamounemploySIMPL
CBO
APP USE OF TAX INCENTIVES FOR RETIREMENT SAVING IN 2006 31
codaselamtheweretratrat
Acmaco45lim40
some participants who were nearing retirement. Those to whom the higher limits applied could not be identified in the data and were counted as con-tributing the maximum amount if they exceeded the 401(k) limit. Furthermore, those participating in both a 457 plan and either a 401(k) plan or a 403(b) plan could contribute up to the maximum amount to each plan independently. That feature of the law could not be simulated with the avail-able data. Thus, the percentages constrained by the maximum amount presented in this study are somewhat overstated.
In analyzing the saver’s credit, CBO maintained the convention of treating the individual worker, rather than the tax return, as the unit of analysis,
even though credits are calculated on the basis of the income of the tax-filing unit rather than of the individual.3 Credits were allocated between spouses on a joint return in proportion to their qualifying contributions, up to $2,000. In the few cases in which a credit was claimed but no qualifying contributions could be identified, the credit was distributed in proportion to earnings.
3. To date, the only other analysis of the saver’s credit that is based on IRS data is that of Gary Koenig and Robert Harvey, “Utilization of the Saver’s Credit: An Analysis of the First Year,” National Tax Journal, vol. 53, no. 4 (December 2005), pp. 787–806. That article focused on the tax return as the unit of analysis, however, so direct comparisons with this study are difficult.
ENDIX
mparisons between tax returns and survey ta, that about 3 million people with wage or f-employment income (usually in small ounts) did not file tax returns; those people are refore not represented in the data here. If they re included and if they did not contribute to any irement plan, the overall average participation e would be about 1 percentage point below the e reported in this study.
curately identifying participants making the ximum contribution to 401(k)-type plans was
mplicated by the rules governing 403(b) and 7 plans. In most cases, statutory contribution its on 403(b) and 457 plans matched those for
1(k) plans, although higher limits applied for