Use of Shoulders and Narrow Lanes to Increase Freeway Capacity
86
I NATIONAL COOPERATIVE HI G H W AY RESEARCH PROGRAM I Use of Shoulders and Narrow Lanes to Increase Freeway Capacity Transpo . rtation Research Board National Research Council
Transcript of Use of Shoulders and Narrow Lanes to Increase Freeway Capacity
I NATIONAL COOPERATIVE HI G H W AY RESEARCH PROGRAM I
Use of Shoulders and Narrow Lanes to Increase Freeway Capacity
Transpo . rtation Research Board National Research Council

TRANSPORTATION RESEARCH BOARD EXECUTIVE COMMITTEE 1995
OFFICERS
Chair: Lillian C. Borrone, Director, Port Authority, The Port Authority of New York and New Jersey
Vice Chair: James W. VAN Loben Sels, Director, California Department of Transportation
Executive Director: Robert E. Skinner, Jr., Transportation Research Board
MWAMERS
EDWARD H. ARNOLD, Chair and President, Arnold Industries, Lebanon, PA
SHARON D. BANKS, General Manager, AC Transit, Oakland, CA
BRIAN J. L. BERRY, Lloyd Viel Berkner Regental Professor & Chair, Bruron Centerfor Development Studies, University of Texas at Dallas
DWIGHT M. BOWER, Director, Idaho Department of Transportation
JOHN E. BREEN, The Nasser L Al-Rashid Chair in Civil Engineering, Tile University of Texas at Austin
DAVID BURWELL, President, Rails-to-Trails Conservancy
A. RAY CHAMBERLAIN, Vice President, Freight Policy, American Trucking Associations, Inc. (Past Chair, 1993)
RAY W. CLOUGH, Nishkian Professor of Structural Engineering, Emeritus, University of California, Berkeley
JAMES N. DENN, Commissioner, Minnesota Department of Transportation
JAMES C. DELONG, Director ofAviation, Denver International Airport, Denver, Colorado
DENNIS J. FITZGERALD, Executive Director, Capital District Transportation Authority, Albany, IVY
JAMES A. HAGEN, Chairimin of the Board and CEO, CONRAIL
DELON HAMPTON, Chairman & CEO, Delon Hampton & Associates
LESTER A. HOEL, Hamilton Professor, Civil Engineering, University of Virginia
DON C. KELLY, Secretary and Commissioner of Highways, Transportation,Cabiner, Kentucky
ROBERT KOCHANOWSKI, Executive Director, Southwestern Pennsylvania Regional Planning Commission
JAMES L. LAMMEE, President & CEO. Parsons Brinckerhoff, Inc.
CHARLES P. O'LEARY, JR., Commissioner, New Hampshire Department of Transportation
JUDE W. P. PATIN, Secretary, Louisiana Department of Transportation and Development
CRAIG E. PHILIP, President, Ingram Barge Co., Nashville, 77V
DARREL RENSINK, Director, Iowa Department of Transportation
JOSEPH M. iUSSMAN, JR East Professor, Civil and Environmental Engineering, MIT
MARTIN WACHS, Director, Institute of Transportation Studies, University of California
DAVID N. WORMLEY, Dean of Engineering, Pennsylvania State University
HOWARD YERUSALIM, Secretary of Transportation, Pennsylvania Department of Transportation
MIKE ACOTT, President, National Asphalt Pavement Association (ex officio)
ROY A. ALLEN, Vice President, Research and Test Department, Association ofAmerican Railroads (ex officio)
ANDREW H. CARD, JR., President and CEO, American Automobile Manufacturers Association
THOMAS J. DONOHUE, President and CEO, American Trucking Associations (ex officio)
FRANCIS B. FRANCOIS, Executive Director, American Association of State Highway and Transportation Cifficials (ex officio)
JACK R. GILSTRAP, Executive Vice President, American Public Transit Association (ex officio)
ALBERT J. HERDERGER, Maritime Administrator, U.S. Department of Transportation (ex officio)
DAVID R. HINSON, Federal Aviation Administrator, U.S. Department of Transportation (ex officio)
GORDON J. LINTON, Federal Transit Administrator, U.S. Department of Transportation (ex officio)
RICARDO MARTINEZ, Federal Railroad Administrator, U.S. Department of Transportation (ex officio)
JOLENE M. MOLITORIS, Federal Railroad Administrator, US. Department of Transportation (ex officio)
DAVE SHARMA, Research and Special Programs Administrator, US. Department of Transportation (ex officio) RODNEY E. SLATER, Federal Highway Administrator. U.S. Department of Transportation (ex officio)
ARTHUR E. WILLIAMS, Chief of Engineers and Commander, US. Army Corps of Engineers (ex officio)
NATIONAL COOPERATIVE HIGHWAY RESEARCH PROGRAM
Transportation Research Board Executive Committee Subcommittee for NCHR
LILLIAN C. BORRONE, Port Authority of New York and New. Jersey (Chair)
FRANCIS B. FRANCOIS, American Association of State Highway and
Transportation Officials
LESTER A. HOEL, University of Virginia
ROBERT E. SKINNER, JR., Transportation Research Board
RODNEY E. SLATER, Federal Highway Administration
JOSEPH M. SUSSMAN Massachusetts Institute of Technology
JAMES W. VAN LOBEN SELS, California Department of Transportation
Field of Traffic Area of Operations and Control Project Panel G3-43
RONALD C. SONNTAG, Wisconsin Department of Transportation (Chair) JAMES R. ROBINSON, Federal Highway Administration MICHAEL M. CHRISTENSON, Minnesota Department of Transportation ROGER P. ROESSj Polytechnic University, Brooklyn,, NY
ALEX KENNEDY, California Department of Transportation DAVID L. TOLLET7, Federal Highway Administration
JEFFREY A. LINDLEY, Federal Highway Administration HENRY LIEU, FHWA Liaison Representative JOHN C. POWERS, New Jersey Department of Transportation RICHARD A. CUNARD, TRB Liaison Representative TIMOTHY R. NEUMAN, CH2M Hill, Chicago, IL
Program S
ROBERT J. REILLY, Director, Cooperative Research Programs RONALD McCREADY, Senior Program Officer CRAWFORD F. JENCKS, Manager, NCHRP FRANK R. McCULLAGH, Senior Program Officer LLOYD R. CROWTHER, Senior Program Officer KENNETH S. OPIELA, Senior Program Officer B. RAY DERR, Senior Program Officer SCOTT A. SABOL, Senior Program Officer AMIR N. HANNA, Senior Program Officer EILEEN P. DELANEY, Editor
KAMI CABRAL, Editorial Assistant

NATIONAL COOPERATIVE HIGHWAY RESEARCH PROGRAM
Report 369
Use of Shoulders and Narrow Lanes to Increas
I le Freeway Capacity
J.E. CURREN JHK & Associates
Alexandria, VA
Subject Areas
Highway and Facility Design Highway Operations, Capacity, and Traffic Control
Research Sponsored by the American Association of State Highway and Transportation Officials in Cooperation with the
Federal Highway Administration
TRANSPORTATION RESEARCH BOARD NATIONAL RESEARCH COUNCIL
NATIONAL ACADEMY PRESS Washington, D.C. 1995

NATIONAL COOPERATIVE HIGHWAY RESEARCH PROGRAM
Systematic, well-designed research provides the most effective approach to the solution of many problems facing highway admin-istrators; and engineers. Often, highway problems are of local inter-est and can best be studied by highway departments individually or in cooperation with their state universities and others. However, the accelerating growth of highway transportation develops in-creasingly complex'problems of wide interest to highway authori-ties. These problems are best studied through a coordinated pro-gram of cooperative research.
In recognition of these needs, the highway administrators of the American Association of State Highway and Transportation Officials initiated in 1962 an objective national highway research program employing modem scientific techniques. This program is supported on a continuing basis by funds from participating member states of the Association and it receives the full cooperation and support of the Federal Highway Administration, United States De-partment of Transportation.
The Transportation Research Board of the National Research Council was requested by the Association to administer the research program because of the Board's recognized objectivity and under-standing of modem research practices. The Board is uniquely suited for this purpose as it maintains an extensive committee structure from which authorities on any highway transportation subject may be drawn; it possesses avenues of cormnunications and cooperation with federal, state and local governmental agencies, universities, and industry; its relationship to the National Research Council is an insurance of objectivity; it maintains a full-time research correlation staff of specialists in highway transportation matters to bring the findings of research directly to those who are in a position to use them.
The program is developed on the basis of research needs identi-fied by chief administrators of the highway and transportation departments and by committees of AASHTO. Each year, specific areas of research needs to be included in the program are proposed to the National Research Council and the Board by the American Association of State Highway and Transportation Officials. Re-search projects to fulfill these needs are defined by the Board, and qualified research agencies are selected from those that have submitted proposals. Administration and surveillance of research contracts are the responsibilities of the National Research Council and the Transportation Research Board.
The needs for highway research are many, and the National Cooperative Highway Research Program can make significant con-tributions to the solution of highway transportation problems of mutual concern to many responsible groups. The program, how-ever, is intended to complement rather than to substitute for or duplicate other highway research programs.
Note: The Transportation Research Board, the National Research Council, the Federal Highway Administration, the American Association of State Highway and Transportation Officials, and the individual states participating in the National Cooperative Highway Research Program do not endorse products or manufac-turers. Trade or manufacturers names appear herein solely because they are considered essential to the object of this report.
NCHRP REPORT 369
Project 343 FY'91
ISSN 0077-5614
ISBN 0-309-05369-2
L. C. Catalog Card No. 94-62110
Price $23.00
NOTICE
The project that is the subject of this report was a part of the National Cooperative Highway Research Program conducted by the Transportation Research Board with the approval of the Governing Board of the National Research Council. Such approval reflects the Governing Board's judgment that the program concerned is of national importance and appropriate with respect to both the purposes and resources of the National Research Council.
The members of the technical committee selected to monitor this project and to review this report were chosen for recognized scholarly competence and with due consideration for the balance of disciplines appropriate to the project. The opinions and conclusions expressed or implied are those of the research agency that performed the research, and, while they have been accepted as appropriate by the technical committee, they are not necessarily those of the Transportation Research Board, the National Research Council, the American Association of State Highway and Transportation officials, or the Federal Highway Administration, U.S. Department of Transportation.
Each report is reviewed and accepted for publication by the technical committee according to procedures established and monitored by the Transportation Research Board Executive Committee and the Governing Board of the National Research Council.
Published reports of the
NATIONAL COOPERATIVE HIGHWAY RESEARCH PROGRAM
are available from:
Transportation Research Board National Research Council 2101 Constitution Avenue, N.W. Washington, D.C. 20418
Printed in the United States of America

FOREWORD This report will be of interest and use to the design and operations staffs of state departments of transportation and others responsible for urban freeways. Reducing lane
BY Staff widths and reducing or eliminating shoulders are ways to inexpensively add a freeway Transportation Research lane. The objective of the research was to quantify the.safety and operational effects of
Board this type of design.
The American Association of State Highway and Transportation Official's (AASHTO) Policy on Geometric Design for Highways and Streets, 1990 Edition (com-monly referred to as the AASHTO Green Book), recommends widths for freeway lanes and shoulders. It does not, however, discuss minimum widths for freeway lanes or shoul-ders or help the designer determine when a narrower width would suffice.
The 1985 Edition of the Highway Capacity Manual (HC* (TRB Special Report 209) includes factors for analyzing freeway lanes from 9 to 12 ft wide. There are also factors for obstructions less than 6 ft from the edge of the lane. These factors, however, were taken directly from the 1965 Edition because no more recent research had been done.
Tight budgets and right-of-way constraints limit the ability of state departments of transportation to add capacity to urban freeways. Although some states have used lane and shoulder widths narrower than recommended by the AASHTO Green Book to add another freeway lane to reduce congestion, most have refrained because of the lack of information on the safety and operational effects of these designs. Inadequate information and guidance are of particular concern when considering the agency's liability.
This report begins to quantify the effect of narrow lanes and shoulders on the safety and operation of a freeway. It includes an evaluation methodology and design guidelines to help freeway designers evaluate alternatives that minimize or eliminate the need to widen the roadway. It also includes sufficient background information so that designers can have confidence in the methodology and guidelines.
The limited data collected on this project preclude. recommending changes to the AASHTO Green Book or the HCM. Future research should build on this effort to further quantify the effects of narrow lanes and shoulders.

CONTENTS
SUMMARY
CHAPTER ONE Introduction and Research Approach Problem Statement, 3 Research Objectives and Scope, 4 Research Approach, 4 Organization of the Report, 5
CHAPTER TWO Study Corridors and Sites Rt 128—Boston, MA, 6 1-95/1-395 —Alexandria, VA, 9 1-5 Suburban—Seattle, WA, 13 1-5 Urban—Seattle, WA, 13 I-90—Seattle, WA, 15 I-85—Atlanta, GA, 17 I-94—Minneapolis, MN, 19 I-10 (Santa Monica Freeway)—Los Angeles, CA, 21 1-405—Los Angeles, CA, 23 SR 57—Los Angeles, CA, 25 SR 91—Los Angeles, CA, 27
32 CHAPTER THREE Findings Use of Shoulders and Narrow Lanes, 32 Safety Performance, 35 Operational Performance, 41 Findings and Observations, 48
64 CHAPTER FOUR Interpretation, Appraisal, and Application Speed-Flow Relationship, 64 Application Type, 65 Evaluation Methodology, 65 Design Guidelines, 69
71 CHAPTER FIVE Conclusions and Recommendations
73 REFERENCES
74 APPENDIX A Bibliography

ACKNOWLEDGMENTS
The work reported herein was performed under NCHRP Project 3-43 by JHK & Associates. The work was performed in the Transportation Consulting Division, directed by Mr. Morris J. Rothenberg.
Mr. James E. Curren, Senior Associate, was the principal investigator for Project 3-43 and the author of this report. Dr. Robert Dewar of the University of Calgary, Dr. Robert Kuehl of the University of Arizona, and Mr. Sheldon Pivnik of the Dade County Public Works Department served as consultants. Other staff members at JHK & Associates who contributed to the research include Dr. Adolf May, Mr. Eric Metheny, Mr. Stephen Read, Mr. William Reilly, and Mr. David Witheford.
The staffs of California, Georgia, Massachusetts, Minnesota, Virginia, and Washington state highway agencies made substantial contributions by providing operational, physical, and safety data for analysis by the research team. They also assisted in site selection and ensured that the necessary permits for data collection efforts were obtained. TIle authors are also grateful to traffic engineers in other state and local agencies throughout the United States who responded to questionnaires relating to the research.

USE OF SHOULDERS AND NARROW LANES TO INCREASE FREEWAY CAPACITY
SUMMARY The objectives of this research were to formulate a methodology to evaluate potential applications of strategies to increase the capacity of urban freeways by using shoulders with or without narrow lanes and to develop recommendations and design guidelines for the implementation of projects involving these strategies. The factors that influence the effectiveness include traffic volume, vehicle mix, capacity, horizontal and vertical align-ment, length of application, ability to provide emergency turnouts, and incident response considerations. This research addressed urban freeways with full access control and posted speeds of 55 mph or more.
The research focused on the operational and safety performance of various applications of these strategies in 11 corridors throughout the country. Forty-two altered sites and 10 unaltered sites were evaluated. Analysis of accident data for five corridors and operational data for all corridors was performed. Accident rates for unaltered and altered corridor segments were developed as well as accident rates for specific sites. Operational data were used to assess impacts on the speed-flow relationships and capacity resulting from the use of these strategies.
These strategies have been used to incorporate high-occupancy vehicle lanes and smooth traffic flow by addressing specific problems or bottleneck locations as well as construction zones. Sites studied in this research include applications involving either the left or right shoulder and in some cases both, with and without narrow lanes, under a wide range of geometric and operational conditions.
Traffic volumes in excess of 2000 passenger cars per hour per lane (pcphpl) were observed at both altered and unaltered sites. All sites exhibit "flat" speed-flow relation-ships, typically in the 55- to 65-mph range across the entire range of observed volumes with the exception being level of service (LOS) F conditions. Altered sites exhibited slightly lower speeds for a given volume range and a slightly greater tendency to fall into LOS F conditions. Accident rates for altered sites tend to be somewhat higher than unaltered sites. However, if strategies are carefully applied in concert with lane balance and lane continuity concepts, rates for altered sections may be lower than for unaltered. Truck accident rates are almost always higher on altered sections, compared with unaltered.
This research confirmed that shoulders and narrow lanes can be used effectively to

increase capacity in congested urban corridors. However, findings indicate that in many instances there may be measurable negative impacts to the overall safety performance of the corridor. These strategies should be considered for areas of limited length and having turbulent flow conditions as one alternative for achieving smoother flow. Such use should be typically limited to sections of I mi or less. The report includes a recommended process for evaluating proposed projects and guidelines for implementation of projects.

CHAPTER 1
INTRODUCTION AND RESEARCH APPROACH
PROBLEM STATEMENT
Congestion on urban freeways has reached staggering propor-tions in many metropolitan areas throughout the United States. The Federal Highway Administration (FHWA) estimates that in 1991, 70 percent of urban interstate freeway vehicle miles of travel (VN1T) driven during the peak hour were under congested conditions (Figure 1). For several metropolitan areas, Table I lists the percent of peak-period VMT on all roadways driven under congested conditions as estimated by a recent published study (1). In 1990 an estimated one billion vehicle hours of delay resulted from recurring congestion on urban freeways. The cost of this congestion is enormous. The total estimated cost of congestion in the urban areas studied by TTI (2) was $43.2 billion in 1990. The assumptions used for the TTI analysis were average vehicle occupancy of 1.25 persons per vehicle, 250 working days per year, average cost of time $10.00 per hour, and a vehicle mix of 95 percent passenger and 5 percent commercial vehicles.
At the same time, it has become increasingly difficult to ex-pand facilities to meet the demand. Funding is limited with most public agencies facing deficits. Acquiring right-of-way for facilities in urban areas is increasingly difficult and physical constraints often increase the cost of construction substantially.
One means of gaining additional capacity on urban freeways is by the use of shoulders, or a portion of shoulders, to increase the number of travel lanes. Projects implemented to date involve a wide variety of strategies. In some cases only one shoulder has been used, in other cases both shoulders have been used, in still others the lane width has been reduced as well. Some applications have been applied selectively for short distances to address a particular problem with lane balance or to meet a particularly high demand. In other cases a facility, in essence, has been widened with a lane being added for several miles. In some cases the use of the shoulder has been permitted during peak periods only.
The use of shoulders as a travel lane with or without narrower lanes to increase capacity has occurred since the late 1960s. While extensive use has been limited to four states (California, Texas, Virginia, and Washington), more than two dozen states have implemented projects involving the use of shoulders and/or narrow lanes. In addition to projects constructed specifically to increase capacity, there are numerous locations on the freeway system such as viaducts and bridges where shoulders have never been provided. Extensive use of shoulders, often combined with narrow lanes, is occurring in several metropolitan areas in order to provide HOV facilities. The FHWA (3) estimates that 3,830
Percent
69 70 61 6.4
41 49
53
mom I on 1975 1978 1981 1983 1985 1987 1989 1991
Percentage of Urban Interstate Peak Hour Traffic which Moves Less than 35 mph
Percent of Urban Interstate Mileage on which Peak Hour Traffic Moves Less than 35 mph
Source: Federal Highway Administration Highway Statistics, 1991
Figure 1. Urban interstate congestion.
100
90
so 70
60
so 40
30
20
10

TABLE 1. Percent of peak-period VMT driven under congested conditions
METROPOLITAN AREA %
San Francisco 80 Los Angeles 75 Seattle 70 Houston 70 Washington, D.C. 65 Miarni 60 Chicago 55 New York 55 Austin and Dallas 55
mi of urban freeway have cross sections that would permit proj-ects of this type.
In spite of increasing usage, the tradeoffs among facility de-sign, traffic performance, safety., enforcement, and maintenance impacts are not generally well understood. Most studies have found that there are significant increases in throughput and in most cases a decrease in the accident rate. However, many con-cerns remain, particularly in terms of safety. Most studies com-pleted have focused on specific applications on relatively short segments of freeway. These studies have often concluded, on the basis of an analysis of before and after conditions at the site, that increased throughput combined with a decreased accident rate had been achieved, and the project had been successful. Concerns with site-specific before and after studies have been that they were biased by the fact that the project in most cases addressed a problem area. In doing so, the project may have simply resulted in transferring the problem area downstream a short distance and to a location not observed in the study. Reservations were also expressed that while the immediate result may be an improvement in safety, the longer term effect as growth in traffic created a return to congestion, would be nega-tive, particularly if implemented on a continuous or frequent basis within a corridor.
RESEARCH APPROACH
The approach to this research included seven elements: 1) examination of current practice to identify concerns, existing guidelines, and evaluation methodologies; 2) performance of a pilot data collection effort; 3) development of a research frame-work for field and accident studies; 4) selection of sites and data collection to develop initial hypotheses with respect to opera-tional and safety performance; 5) testing and expansion of initial hypotheses; 6) development of an evaluation methodology; and 7) preparation of design guidelines. To accomplish these goals, a set of detailed tasks was defined and followed. Figure 2 pres-ents a flowchart of the tasks completed as part of this research. Each task is described briefly as follows.
To gain a thorough understanding of the current use and appli-cation of these strategies, pertinent literature and ongoing re-search were reviewed, and the experience of state and federal agencies surveyed. Detailed follow-up surveys and interviews with selected states and agencies were conducted as part of this task. In a parallel effort, a pilot study was conducted to test the field procedures for the collection of operational data. The data and information gained in this task were used to develop a research framework for field and accident studies. The research framework identified the critical variables for study in this re-search effort.
Site selection was conducted in a two-step process. First, a
Review Literature Pilot Data Collection Conduct Survey/interviews
Develop Hypothesis and Analytical Framework
RESEARCH OBJECTIVES AND SCOPE
The primary objectives of this research project have been to
* Formulate a methodology to evaluate potential applications of strategies to increase freeway capacity by using shoulders as travel lanes with or without narrow lanes and
* Develop recommendations and design guidelines for the implementation of projects involving such strategies.
NCHRP Project 3-43 was undertaken in two phases: Phase I comprised a literature search, a survey of experience, and the development of a research plan for Phase 11.
The research plan was implemented in Phase H. It involved the collection and analysis of extensive operational data and the analysis of accident data obtained from the state agencies. The research focused on the differences in the operating and safety performance of altered freeway segments versus unaltered free-way segments. "Unaltered segment" refers to a freeway segment built to standard. "Altered segment" refers to any segment that has an added lane through the use of shoulders or narrower lanes. Considerable emphasis was placed on the collection of field data, because much of the data used to develop current guidelines date from the 1960s or earlier.
Select Sites and Collect Date
Test and Expand Hypothesis
Formulate Evaluation Methodology
Develop Design Guidelines
Figure 2. Approach to analysis.

list of potential corridors and sites was developed on the basis of criteria that included geographical location, application type, commuter type, cross section, alignment features, and the ability to collect data. Final selection focused on covering a representa-tive range of each of the values of critical site variables identified in the research framework. Eleven corridors in five states were selected for analysis. Data were collected at 52 sites throughout the 11 corridors. Computerized accident databases in a format that would permit analysis were available for five of the corri-dors. These databases were reviewed and screened to determine the extent of analysis that could be undertaken. The operational data collected in the field and the accident databases obtained from the states were used to test and expand hypotheses regard-ing operational and safety performance. Finally, the data and analysis results were used in conjunction with information from
the literature review, surveys, and interviews to develop guide-lines for evaluation and implementation of proposed projects.
ORGANIZATION OF THE REPORT
The remainder of this report is organized in four chapters. Chapter 2 presents a description of the corridors and sites studied as part of this research. Chapter 3 summarizes the findings of the study including the results of the literature review, surveys, and research plan. Chapter 4 discusses the interpretation, ap-praisal, and application of the research findings. Chapter 4 also includes the recommended process for evaluating proposed proj-ects and guidelines for implementation of projects. Chapter 5 summarizes the conclusions of the study and presents recom-mendations for future research to assist highway agencies in programming such research.

CHAPTER 2
STUDY CORRIDORS AND SITES
The corridors chosen for study in NCHRP Project 3-43 were selected from a list of corridors and sites developed during Phase I of the research. The final corridors selected for field data collection and operational analyses are listed in Table 2, which summarizes key characteristics of each.
Within each corridor the freeway was divided into altered and unaltered segments to conduct accident and operational analysis. Within each segment the corridor was further subdivided into sections on the basis of operational characteristics and defined study sites for collection of operational data. Several study sites with reduced shoulder and lane width were chosen in each cor-ri-dor. A "benchmark" site was chosen in all but one corridor. Benchmark sites had full shoulders and 12-ft lanes. A full de-scription of the approach to data collection and analysis is pre-sented in more detail in Chapter 3. This chapter presents a description of the corridors and sites evaluated as part.of this research.
ROUTE 128—BOSTON, MA
The Route 128 corridor serves as a freeway bypass of the downtown Boston area and is part of the 1-95 corridor. The northern portion of the corridor has been widened to four lanes in each direction with full shoulders. In the southwest section of the corridor, three full-time travel lanes are supplemented by the use of the right-hand shoulder as a fourth travel lane during the hours of 6 to 10 Am and 3 to 7 Pm. At all other times of the day, travel in the shoulder lane is prohibited. The segment of the corridor studied and a typical cross section of this treatment are shown in Figure 3. In order to provide some safe areas for disabled vehicles to use during shoulder use periods, small paved turnouts are provided where possible. This treatment operates from the interchange with Route 9, to the interchange with Route 24, for a total length of 13 mi. Figure 4 illustrates typical condi-tions in the corridor.
For this study, data were collected from five overpass loca-tions: Kendrick Street (in both the northbound and southbound directions), Ponkapoag Road, South Street (benchmark site), and Washington Street. The key characteristics of each site are pre-sented in Table 3. A brief description of each site follows.
Kendrick Street— Northbound
The cross section at this site consists of three 12-ft, full-time travel lanes, a 12-ft right-hand shoulder used as a peak-hour travel lane, and a 3-ft left-hand shoulder. Immediately down-stream from the overpass, in the study area, is a paved turnout
intended for use for disabled vehicles by motorists who can no longer use the shoulder as a pulloff area. This study site has minimal grade and no horizontal curvature. There is no direct access to and from the freeway at this location. There is an exit ramp to Needham Street approximately 2000 ft downstream of the study area. This exit ramp was not observed to influence traffic operations.
Kendrick Street —South bound
The cross section at this location consists of three 12-ft, full-time travel lanes, a 12-ft right-hand shoulder used as a peak-hour travel lane, and a 3-ft left-hand shoulder. This study site has minimal grade and no horizontal curvature. There is no direct access to and from the freeway at this location. There is an entrance ramp from Highland Avenue approximately 2000 ft upstream of the study area. As was the case in the northbound direction, the ramp was not observed to influence traffic operations.
Ponkapoag Road—Northbound
The geometry at this site is a cross section consisting of three 12-ft, full-time travel lanes, a 12-ft right-hand shoulder used as a peak-hour travel lane, and a 2-ft left-hand shoulder. This study site has minimal grade and no horizontal curvature. Ponkapoag Road is fully accessible to/from Route 128 by means of a dia-mond interchange. In the northbound direction there is an exit ramp approximately 1000 ft upstream of the study area, and an entrance ramp that merges into traffic approximately 1400 ft downstream of the study area. Queuing or slowing from the ramps was not observed in the field.
South Street— Northbound
This site has a cross section consisting of four 12-ft, full-time travel lanes, a 10-ft fight-hand shoulder, and a 2-ft left-hand shoulder. This site is located to the north of the 1-90 interchange and was used as a benchmark site. There is an entrance ramp from Route 30 and 1-90 approximately 2500 ft upstream of the study area. When volumes were moderate through the study area, some influence from this entrance ramp on traffic operations was observed with an increased number of lane changes, from right to left, observed.

TABLE 2. Matrix of corridor conditions
Lane Left Shoulder Right Shoulder % Trucks Illumination Per Lane Width
Number Operational Safety Corridor of Sites Data Data 1-1, 12' <2' 2L&II. >8' <2' -2L8'~" >8' <5% 5-10% >10% Yes No,, AD`r
Boston, Rt. 128 5 X X X X X X 20,000
VA 1-95 2 X X X X X X 20,000 X X X X 20,000 X X
X X X 20,000
VA 1-395 5 X X :,X X X X X 23,000 X —X X 23,000
Sea ttle 1-5 (Urban) 4 X X X, X X X 25,000 (Suburban) 5 X X X X X
X
X X 25,000
Seattle 1-90 4 X X X X X
V%
X X 20,000
Atlanta 1-85 5 X X —X X
X X X
18,000
Minneapolis 1-94 X X X X X X 20,000
X
Us Angeles 1-10 5 X X X X 25,000
X X
Los Angeles 1-405 5 X X —X X X X 25,000 X X X X X 25,000 X X X X X 25,000
Los Angeles SR-57 4 X X X
X
X 22,000
Los Angeles SR-91 4 X X X X 20,000
Maximum Per Lane ADT Reported in Study Area -j

138 "(,400001
& Xx-
01>40 !D
Y fl Cr
11P
00
NOT TO SCALE
< Site Number and Direction
> Benchmark
2' , 12' 1 12'
12' 1 10-12'
Left Right Shoulder/
Shoulder Peak Hour Lane Typical Crbss-Section Rt. 128
Figure 3. Route 128 corridor, Boston.

Figure 4. Route 128 at Kendrick Street.
Washington Street— Northbound
This site has a cross section consisting of three 12-ft, full-
time travel lanes, a 10- to 12-ft right-hand shoulder used as a
peak-hour travel lane, and a 2-ft left-hand shoulder. This study
site has a 3 to 4 percent positive gradient and also displays a
horizontal curve downstream from the overpass. There is no
direct access to the freeway from Washington Street~ however,
there is full access to and from the freeway just upstream from
the site at US Route 1, a full cloverleaf interchanoe. Because of
the proximity of this interchange, several access ramps from US
Route I are considered as having influence on this study site.
There is an entrance ramp from westbound US Route I that
merges into the freeway directly through the study area. There is
also an entrance ramp from eastbound US Route I approximately
1000 ft upstream of the study area. The merging on-ramp traffic
and the geometry of the site combined to reduce travel speed
through this area.
1-95/1-395 —ALEXANDRIA, VA
The 1-95/1-395 corridor is one of the major freeway corridors
serving the metropolitan Washington, D.C. area. The corridor C,
runs in a north-south direction from suburban Virginia into
downtown Washington, D.C. This freeway carries a three- to
four-lane cross section in each direction.
The 1-95 portion of the corridor is part of the principal inter-
state corridor servin- the Eastern seaboard. As a consequence,
the percentage of trucks is significantly higher than on 1-395. 1- 0 It, V 95 carries four lanes of traffic in cacti direction throu-h the 0 study area. The 1-95 portion of the corridor was converted from
a six-lane to an eight-lane cross section to accommodate the C,
addition of a median HOV lane in each direction. In order to
accomplish this, the right shoulder was converted to be a general
use traffic lane, leaving the freeway with less than 2-ft of usable
shoulder in each direction on both the inside and outside shoul-
ders. Throu-hout the treated area, paved pullouts were located
periodically to provide areas for disabled vehicles. In. addition
to the revised geometrics, truck restrictions were placed on both
the median HOV lane and the converted shoulder lane.
On the 1-395 portion there is also a two-lane reversible HOV
facilitv located in the median from the Capital Beltway (1-95/1-
495) to the 14th Street Bridge. Interchange spacing varies from
approximately a 2-mi spacing to approximately I mi inside the
Capital Beltway. In an effort to relieve congestion and increase
capacity oil the 1-395 portion, a fourth general use lane was
added to the freeway between King Street and Glebe Road in
the northbound direction and from Shirlington Road to Duke
Street in the southbound direction. This was accomplished by
usina I I-ft lanes and capturing the shoulder for use as a travel
lane by restriping the freeway. Through the treated area, the left
shoulder has been reduced to less than 2 ft in width, while the
right shoulder varies between 4 and 10 ft.
Sites selected for data collection on 1-395 included Edsall
Road HOV Flyover (benchirlark site). King Street, N. Shirting-
ton Circle, and S. Shirlington Circle (in both directions). On I-
95, data were collected in both the northbound and southbound
directions. The location of these sites is shown in Figures 5 and
6. Typical conditions are illustrated in Figures 7 and 8. The key
characteristics of each site are presented in Table 4. The follow-
in- paragraphs include a brief description of each site.
Pohick Road—Northbound
The cross section at this site is the same as the southbound
section, except a 10-ft pullout with I-ft shoulder is provided on
the right side through the study area. In the AM peak period,
TABLE 3. Site conditions Rt. 128
site
Lane Width
Left Shoulder
Right Shoulder % Trucks
Application
TYPe Freeway Section
11' 12' <2'1 2-8'1 >8' <2' 2-8'1 >8' <5% 5-10% >10% HOV Add Lane
Merge/ Div Weave BFS
Kendrick Street, NB x x x P M X x
Kendrick Street, SB x x x P AM x x
Ponkapoag, NB x x x P A x x
South Street, NB X x X AP M BM x
Washington Street, NB x x x WP A x x
LEGEND: A—AM Peak P—PM Peak M—Mid-Day X—All Day W Weekend Period BM-11mchmaik

R CL
X Q CD
:3 (D K
m
~
-n
0 0
:2;
NOT TO SCALE
12' 12' 12' 12,
t
t __ - t
.H.- 0 Median Right
Guardrail Typical Cross-Section Shoulder
1-95 Figure 5. 1-95 corridor, Virginia.

4
C/) 3 2
CD
U)
Q,
0 :3
(D
G) See, CD Cr CD
M el-
< Site Number and Direction
Benchmark
NOT TO SCALE
Median
Right Barrier Typical Cross-Section
Shoulder
1-395
Figure 6 1-39S corridor, Virginia.

12
1 7-:7~
Figure 7. 1-95 in Virginia (it Pohick Road.
t
UW
X", 4
Figure 8. 1-395 in Arlington at South Shirlington Circle.
stop-and-go traffic is experienced throughout this portion of the
1-95 corridor.
Pohick Road—Southbound
with an cffcctivc width of I to 2 ft to a pavcmcnt ovcrlay edge. A I-ft shoulder is provided on the right side.'I here are no ramps C, within the analysis area at this location, The HOV 3 1 rule applies to the median lane for the peak period (3:30 PM to 6:00 PM). All lanes are open to all automobile traffic the remainder of the day. No trucks are permitted in the right lane.
Edsall Road—Southbound
This site has a three-lane cross section with 12-ft lanes and
full-width shoulders. This site, located just north of the Edsall
Road interchange, is used as a benchmark site for the corridor.
There is an exit ramp approximately 4900 ft downstream of the study area and an entrance ramp that merges into traffic
approximately 1480 ft upstream of the area. Neither of these ramps was observed to have an influence on the traffic flow.
King Sheet—SouthUound
This site consists of a four-lane cross section with I I-ft lanes and 2-ft left and standard right shoulders. There is an entrance
ramp approximately 1320 ft downstream of the study area and an exit ramp approximately 1160 ft upstream of the area. With ramps located before and after the study area, lane changes were
observed, but no slowing or queuing could be attributed to the
ramps.
North Shirlington Circle— Northbound
This site consists of a four-lane cross section with I I-ft lanes and 2-ft left and standard right shoulders. There is an exit ramp
approximately 1580 ft upstream and an exit ramp approximately 950 ft downstream of the study area. These ramps appear to have a minimal influence on the site.
South Shirlington Circle— Northbound
This site consists of a four-lane section of I I -ft lanes with This site has a four-lane cross section with I I -ft lanes and
the left lane being an HOV 3+ lane. The left shoulder is 3 ft with 2-ft left and standard fight shoulders. There is an exit ramp 41 C,
TABLE 4. Site conditions 1-95/1-395
Site
Lane Width
Left Shoulder
Right Shoulder % Trucks
Application
Type Freeway Section ir T.4 IV
2' 2-8' >8' <2' 2-8' >8, <5% 5_10% >10% HOV I Add
Lane Merge/ Div Weave BFS
Pohick Road, 1413 x X x AP M X X
Pohick Road, SB X X X PW AM X X
Edsall Road HOV, SB x x I X X , P AM BM x
King Street, SB x x X x x
N. Shirlington Circle, NB X X x X x
I S. Shirlington Circle, NB M X x
I S. Shirlington Circle. SB x 1_~Xti x X x
LEGEND: A—AM Peak P—PM Peak M—Mid-Day X—All Day W—Weekend Period BM—Benclunark

13
approximately 840 ft upstream of the study area and an entrance ramp approximately 1690 ft downstream of the area.
South ShirlIngton Circle—Southbound
This site consists of a four-lane cross section with 11 -ft lanes and with 2-ft left and standard right shoulders. There is an entrance ramp approximately 740 ft downstream of the study area. The study area is not in the influence area of any exit ramps. The entrance ramp carries a heavy volume of traffic during peak hours; however, the queuing and congestion in the corridor is not directly influenced by the ramp.
1-5 SUBURBAN —SEATTLE, WA
The 1-5 corridor is a major interstate corridor serving the Pacific Coast states in a north-south direction. The section of freeway using treatment strategies analyzed here covers an area from dow * ntown Seattle, extending south into the suburban Seat-tle area. The treatment strategies are discontinuous and vary in their usage and operating characteristics. Therefore, the 1-5 corridor has been divided into two individual analysis sections: Urban and Suburban.
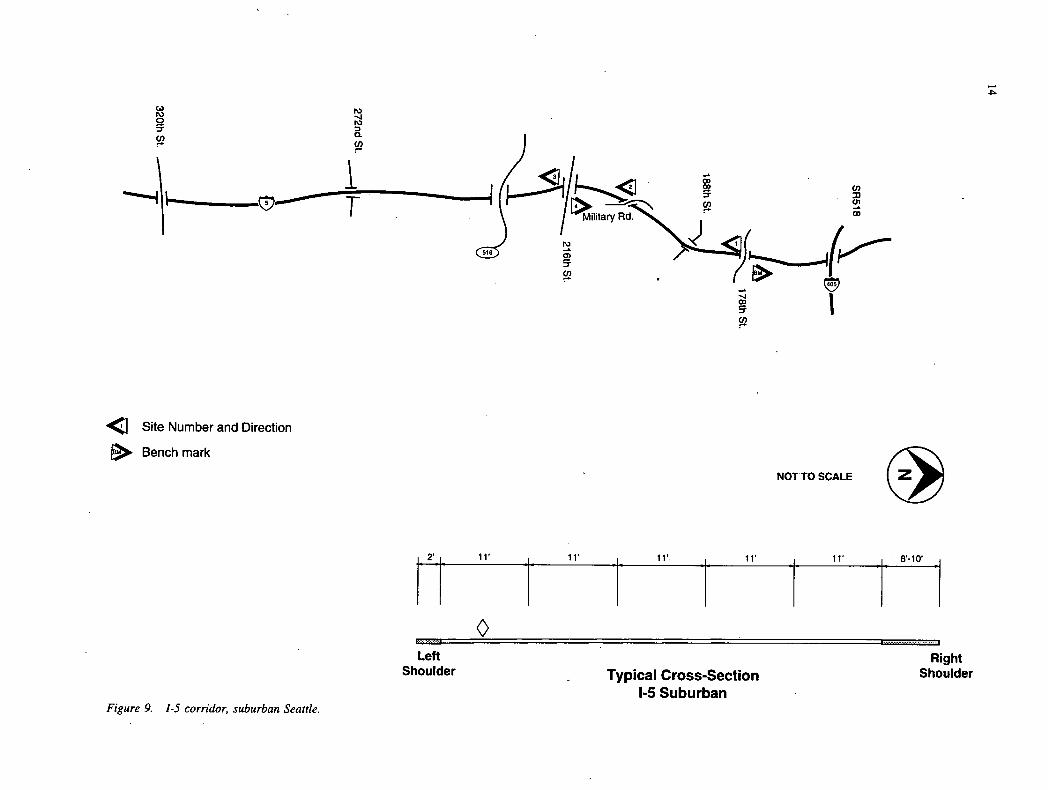
The Suburban section is located in the area of Tukwila and covers approximately 7 mi in both directions. To install a median HOV lane, the existing cross section was restriped from four 12-ft lanes to four I I -ft general use lanes plus one 11 -ft HOV lane. The additional width required was taken from the left shoulder, thus leaving a substandard shoulder. Throughout the treated area, a full right shoulder is maintained. Figure 9 illus-trates corridor alignment.
The sites selected for this study included 178th Street (in both directions, with the northbound direction being utilized as a benchmark site), 216th Street (in both directions), and Military Road southbound. The key characteristics of each site are pre-sented in Table 5. A brief description of each site follows.
178th Street —Northbound
This site is a benchmark location with four 12-ft travel lanes and full-width shoulders on both sides. The section is at a slight downgrade at this location, with no horizontal curvature.
178th Street —Southbound
With a cross section similar to that at Military Road, there are five 11 -ft lanes including the median HOV lane. The site has a 2-ft left shoulder clearance to a guardrail and a full right shoulder. This location is not an access point to the freeway; therefore, there are no ramp influences in the area. There is a slight upgrade through this area. Traffic queues into the site from downstream constraints for brief periods during the after-noon peak period.
216th Street— Northbound
This study site is similar to the southbound direction with a five-lane cross section of 11 -ft lanes, including a median HOV
lane. The left shoulder is 3 ft wide and the right shoulder is a full-width shoulder. The left shoulder has an additional 3 ft of clearance to a median guardrail.
216th Street— Southbound
This site comprises a five-lane cross section of 11-ft lanes, with the leftmost being an HOV lane. The left shoulder is 3 ft wide and the right shoulder is a full-width shoulder. Both shoul-ders exhibit additional clearance to a slope. This is a tangent section with no gradient. As with 178th Street, this location is not an access point to the freeway and, as such, does not experi-ence any influence from ramps.
Milltary Road—Southbound
The site has a five-lane cross section with four general use lanes and one HOV lane as the leftmost lane. All five lanes measure 11 ft in width. - There is a 3-ft left shoulder and a full right shoulder. There is a slight upgrade through the section, which combines with a horizontal curve about 500 ft down-stream of the area. There is an entrance ramp from Military Road that loops on through the study area, affecting traffic to some degree.
1-5 URBAN—SEATTLE, WA
This urban section of the freeway changes character frequently through downtown Seattle. A portion of the corridor is undergo-ing construction and has used narrow lanes and shoulders to accommodate traffic; other areas appear to use the strategy on a more permanent basis. Still other sections of the corridor carry an HOV lane, with various strategies used for its operation. As such, a general corridor description would not be appropriate, and each site will be detailed individually. The corridor serves a highly urbanized area, and therefore experiences frequent in-fluence from closely spaced interchanges. Figure 10 shows the alignment of the corridor.
A total of four study locations were observed in this corridor: one benchmark site (Albro Place) and three altered sites (Denny Way, Holgate Street, and Yesler Way). The key characteristics of each site are presented in Table 6. A brief description of each site follows.
Albro Place —Southbound
This site is a benchmark location with four 12-ft general use travel lanes and full-width shoulders on both the right and left sides. The ramps to and from Albro, Place use a service road thus removing the turbulence from the study area.
Denny Way—Southbound
This site comprises a cross section of four general use lanes plus a median HOV lane. The lanes are each approximately 11 ft wide, with less than a 2-ft left shoulder and a full right shoul-
N 4
CL Cl)
cf)
W
Military Rd. OD
516
=r cn i>
-4 CO
=r (n
Site Number and Direction
Benchmark
NOTTO SCALE 1: I I a-lu
Left Right Shoulder Typical Cross-Section Shoulder
1-5 Suburban Figure 9. 1-5 corridor, suburban Seattle.

TABLE 5. Site conditions 1-5 (suburban)
site
Lane Width
Left Shoulder
Right Shoulder % Trucks
Appliration Type Freeway Section
11' 1 2' <2' 2-8' 4 <2' 2-8' >8' <6% 1 6-10% >10% HOV Add Lane
Merge/ Div Weave BFS
178th Street, NIB X X x X AMP BM
178th Street, SB X X X A X X
216th Street, NB X X X AM X X
216th Street, SB. X X x AM X X
Military Road, SB X X X P M X X
LEGEND: A—AM Peak P—PM Peak M—Mid-Day X—All Day W—Weekend Period BM—Benchmark
15
der. There is a slight downgrade of I to 2 percent through the site. Immediately downstream is a series of ramps to the right, entering from and exiting to 1-90. This results in some weaving in the right side just past the study area; however, while traffic slows, it continues to move steadily with no stop-and-go condi-tions experienced.
Holgate Street— Southbound
This site is to the south of the 1-90 interchange. The freeway carries a four-lane section through the site, with three lanes coming from 1-5 and the fourth being added from 1-90. This lane is dropped further downstream creating an area where some weaving will occur. However, this distance is lengthy enough to minimize the impacts through the study area. The travel lanes are 11 ft wide, with a left shoulder less than 2 ft wide and no right shoulder at the study site. There is a downgrade of about 3 percent through the area.
Yesler Way—Northbound
This site comprises a three-lane cross section of I I-ft travel lanes. There is no right shoulder—the right lane runs immedi-ately beside a Jersey barrier. The left shoulder measures 4 ft wide. There is an upgrade of about 3 to 4 percent through the site. There is a left-hand exit ramp leading to the express lanes, which extend through the urban area approximately 700 ft north of the site. The express section is a reversible section and, there-fore, the ramp is not open during the Am period. When the ramp is open, volumes in the left lane are heavier due to exiting traffic; however, traffic does not slow enough to back into the study area.
1-90—SEATTLE, WA
The 1-90 corridor in the Seattle area runs in an east-west direction. The area with treatment strategies of using shoulders and/or narrow lanes to increase freeway capacity is located through the Mercer Island area, just to the east of Seattle. During data collection for this project, this section of the freeway was at an interim stage of construction to institute a reversible HOV
facility located in the freeway median. Each freeway section was physically separated by a median barrier enabling construc-tion on one section to proceed with minimal influence on traffic
on another section. The westbound direction carries a cross section of three I I-
ft general travel lanes plus one 11 -ft HOV lane to the left. The left shoulder varies but is generally less than 2 ft in width. The right shoulder remains approximately 4 to 6 ft wide through the area.
The eastbound direction on the freeway experienced opera-tional changes during the data collection period and was used as both altered and benchmark data sites. On July 12, 1992, a new phase of construction was begun in the eastbound direction. Prior to that time, the eastbound traffic was traveling in the median freeway section, which is designated for future reversible operation. The median section carried a cross section of three 11 -ft lanes with no HOV lane and substandard shoulders. After the changeover, the eastbound traffic was directed onto the newly constructed section of the freeway dedicated to permanent eastbound movement. This section carries a standard travelway section of three 12-ft lanes, and 10-ft shoulders on each side. The use of a common overpass location enabled the data collec-tion crew to observe and gather data on operations before and after the operational changeover. Figure I I illustrates the align-ment of the corridor.
The key characteristics of each site are presented in Table 7. A brief description of each site follows.
Island Crest Way—Westbound
A cross section as described earlier of three 11-ft general travel lanes plus one 11 -ft HOV lane existed. The left shoulder is 1 ft wide and the right shoulder is approximately 5 ft wide. There are no ramps in the study area that would influence driver behavior appreciably, nor is there any grade or significant hori-zontal curvature.
Island Crest Way—Eastbound, Altered
Prior to the conversion, traffic through the area used this section carrying three I I -ft general traffic lanes. The left shoul-

I _Y* 0 -*/
~P%
I . CO
-e NP"
11 \11, kl_0
-33 0
0 's !~ 0
=L (D
17
0.
2
9 5
Site Number and Direction
Benchmark
NOT TO SCALE
3' , ill
M
M
H
Median Barrier Typical Cross-Section
1-5 Urban
Wirrier
No Right Shoulder
Figure la 1-5 urban corridor, Seattle.

TABLE 6. Site conditions 1-5 (urban)
Site
Lane Width
Left Shoulder
Right - Shoulder % Trucks
Application Type Freeway Section
ill 12' <2'1 2-8'1 >8' <2' 2-8'1 >8' <5% 5-10% >1090 HOV Add Lane
Merge/ Div Weave BFS
Albro Place, SB x x x x AP BM X.
Denny Way, SB x AM X. x
Holgate Street, SB X Ix x AM x x
Yesler Way, NB X x M I I X x
LEGEND: A—AM Peak P—PM Peak M—Mid-Day X—All Day W—Weekend Period BM—Benchmark
17
der was 1 ft wide, and a right shoulder approximately 5 ft wide. No ramps were present that influenced traffic flow through the site.
Island Cresf Way—Eastbound, Benchmark
After traffic was transferred from the median section onto the permanent eastbound travel lanes, this location served as a benchmark location for the corridor. It carries a cross section of three 12-ft lanes with 10-ft shoulders on both the right and left sides. There is a right-side entrance ramp downstream of the study area. The volumes on the ramp are moderate at times but merge far enough away so as to not be a source of slowing through the area.
West Mercer Way—Westbound
This site has a section consisting of three 11 -ft general travel lanes plus a left-side HOV-only lane. The shoulders are variable through the study area—the right shoulder tapers from 2 to 4 ft through the site, while the left shoulder tapers from about 4 to 2 ft. This shift in pavement markings occurs as vehicles exit a tunnel at the study site and as they are entering a horizontal curve to the right. As with the previous sites, there are no ramps in the immediate area to influence traffic.
1-85—ATLANTA, GA
The 1-85 corridor is one of the major freeways serving the Atlanta metropolitan area. The corridor runs in a north-south direction ihrough the city, and then in a northeast-southwest direction when outside the central city area. The northeast corri-dor serves commuters from Dekalb and Gwinnett Counties, as well as areas further from the metropolitan area, and connects with downtown Atlanta. The freeway carries five to six lanes in each direction on the northeast side. Figure 12 shows the corridor and sites studied as well as a typical cross section of 1-85 south of the 1-285 interchange in Dekalb County. Figures 13 and 14 illustrate typical operating conditions in the corridor.
For the study, data were collected from five overpass loca-tions: Chamblee-Tucker Road, North Druid Hills Road, Shal-lowford Road (in both the northbound and southbound direc-tions), and Wood Parkway (benchmark site). The key
characteristics of each site are presented in Table 8. The follow-ing paragraphs provide a brief description of each site.
Chamblee-Tucker Road—Southbound
The site has a five-lane cross section with four I 1-ft lanes and one 12-ft lane, and full-width shoulders on both sides. The study area exhibits a slight negative gradient and no curvature. There is an exit ramp approximately 790 ft upstream of the study area and an entrance ramp that merges into traffic approxi-mately 950 ft downstream of the area. The study area appeared to be clear of the influences of these ramps.
North Druid Hills Road—Southbound
The site has a five-lane cross section with four I I -ft lanes and one 12-ft lane, and full-width shoulders on both sides. The study area exhibits a slight negative gradient and no curvature. There is an exit ramp approximately 680 ft upstream of the study area and an additional exit ramp to Lenox Road approxi-mately 5070 ft downstream of the overpass. There is an entrance ramp that adds a lane to the freeway approximately 840 ft down-stream of the area. The influence of these ramps appears to be well beyond the study area.
Shallowford Road—Northbound
The site comprises a five-lane cross section with four 11-ft lanes and one 12-ft lane and full-width shoulders on both sides. The study area exhibits minimal gradient and no curvature. There is an exit ramp approximately 950 ft upstream of the study area and an entrance ramp that merges into traffic approxi-mately 1000 ft downstream of the area. Observation during the data collection indicated that the site was clear of the influences of these ramps.
Shallowford Road—Southbound
The site comprises a five-lane cross section with four 11 -ft lanes and one 12-ft lane and full-width shoulders on both sides. The study area exhibits minimal gradient and no curvature. Ap-proximately 9600 ft downstream of the study area, the freeway

-4
L
=r
CD 90
1 10 000
(D -4 ::F CD -4 '1) CL
(D
8~
NOT TO SCALE
Site Number and Direction
After Conversion
Before conversion <2', ill
Median Barrier
ill I ill I ill 1 4'-6-
Barrier
Typical Cross-Section 1-90
Figure 11. 1-90 corridor, Seattle.

TABLE 7. Site conditions 1-90
Site
Lane Width
Left Shoulder
Right Shoulder % Trucks
Application Type Freeway Section
1 T112' T<22.8' >8' <2' 12-8'1 >8' <5% 6-10% >10% HOV Add Lane
MergeJ Div Weave BFS
Island Crest Way, EB x X X P A X x
Island Cr. Way, EB-After X I X X
M
BM X
Island Crest Way, VM _ _L — x W M X x
West Mercer Way UM x X I X I
LEGEND: A—AM Peak P—PM Peak M—Mid-Day X—All Day W—Weekend Period BM—Benchmark
19
has a sharp horizontal curve. There is an exit ramp approximately 1320 ft upstream of the study area and an entrance ramp that merges into traffic approximately 1060 ft downstream of the area. The study area appeared to be clear of the influences of these ramps.
Wood Parkway—Southbound
The geometry at this location is a six-lane cross section with 12-ft lanes and full-width shoulders. This site is located to the north of the 1-285 interchange and is used as a benchmark site for the corridor. The study area is not within the influence area of any entrance ramps and is 1050 ft upstream of an exit ramp to Pleasantdale Road. Some influence from the exit to Pleasantdale Road can be observed with traffic slowing under heavy volume conditions in the right-hand lanes.
1-94 —MINNEAPOLIS, MN
The 1-94 corridor travels in an east-west direction through the Minneapolis-St. Paul area. It serves as the central freeway corridor, which directly connects the two metropolitan areas. Along this corridor there are several sections with shoulder use treatments to alleviate bottlenecks in the corridor. Considerable data have been maintained by the highway department on the characteristics of the corridor with respect to these changes. The section of freeway researched for this effort included the area between the Mississippi River crossing east to Lexington Street. Through this area, shoulders are intermittently used to eliminate bottlenecks caused by lane drops.
Three altered sites were used (East River Road, Snelling Ave-nue, and University of Minnesota exit ramp)—one less than in other corridors—along with a benchmark site (Pascal Street). Figure 15 shows the alignment of the corridor and a typical cross section. Figure 16 illustrates typical conditions in the corridor. The key characteristics of each site are presented in Table 9. A brief description of each site follows.
East River Road—Westbound
This site overlooks the approach to the bridge over the Missis-sippi River. It has a cross section consisting of three 12-ft lanes, but it has no right or left shoulders. There is a metered entrance ramp, which merges into traffic upstream of the site. This traffic
has completely merged in prior to the site, and its influence is minimal due to the use of ramp metering. There is an exit ramp downstream across the bridge, but it appears to have no opera-tional influence through the study site. Approaching the site, both shoulders are tapered out just prior to a sharp (50 mph) curve. This acts to slow traffic through the site. Speeds do not resume until after the bridge. Therefore, the site is within the constrained or congested segment.
Pascal Street — Westbound
This benchmark site has a cross section of three 12-ft lanes with full-width shoulders on both the right and left sides: As with the Snelling Avenue site, this site is a tangent section with a slight uphill grade. There is an exit ramp 200 ft upstream of the site that carries a relatively light volume and does not appear to impact the study area.
Snelling Avenue —Westbound
The cross section consists of three 12-ft lanes, a 6-ft left shoulder to a barrier, and a full-width right shoulder. The site is a tangent section with a miriiinal uphill grade of less than 2 percent. There is a metered entrance ramp about 500 ft down-stream, which displays no negative influence on the traffic flow. This site is located about 600 ft downstream of the Pascal Street benchmark site and reflects a narrowing of the left shoulder through this area.
University of Minnesota Exit Ramp—Eastbound
This site is within the interchange area for the exit to the University of Minnesota and displays the typical treatment for using the shoulders to maintain lane continuity. The cross section consists of three 12-ft travel lanes with a 1-ft left shoulder to a barrier and a 3-ft right shoulder to a barrier. Traffic is traveling through a slight horizontal curve to the right as well as a slight upgrade of less than 2 percent immediately downstream from the site; however, this does not appear to have a negative influ-ence on the traffic flow. There is an exit ramp that diverges 500 ft'upstrearn of the site. There is also a metered entrance ramp that merges 500 ft downstream from the site. Neither ramp exhibits a negative influence on traffic through the study area.

C-D w
z 0 CL
CL
0
NOT TO S )CALE
Site Number and Direction
Benchmark
Figure 12. 1-85 corridor, Atlanta.
Median Barrier Typical Cross-Section
1-85
Right Shoulder

Figure 14 1-85 in Atlanta at Chamblee-Tucker Road.
1-10 (SANTA MONICA FREEWAY)—LOS ANGELES, CA
The 1-10 corridor is a heavily traveled urban corridor serving the downtown Los Angeles area in an east-west direction. It carries eight- to ten-lane cross section, with four continuous
21
lanes in each direction. The heavy volunies of traffic through this corridor combined with heavy entering and exiting traffic volumes at some ramps have resulted in several bottlenecks through the system, resulting in congested traffic flow. To im-prove traffic flow, the freeway was restriped to better balance demand and capacity by periodically adding a fifth travel lane using the available left shoulder and reducing the lane widths.
This treatment is intermittently in place from the 1-405 inter-change west of Los Angeles to the I- 10 State Route (SR) I 10 interchange in the downtown area. For this study. operational data were collected at four altered sites (Crenshaw Boulevard and 6th Avenue in both the eastbound and westbound direction) as well as one benchmark site at West Boulevard. Figure 17 illustrates the corridor location and Figure 18 shows corridor conditions. The key characteristics of each site are presented in Table 10. The following paragraphs provide a brief description of each site.
6th Avenue — Eastbound
The site has a cross section identical to the westbound direc-tion consisting of five I I-ft lanes, a 2-ft left shoulder, and a full right shoulder with a continuous auxiliary lane between an entrance and exit ramp. There is an exit ramp to Arlington Avenue approximately 500 ft downstream, and an entrance ramp from Crenshaw Boulevard approximately 1500 ft upstream from the study site. The influence of these ramps on traffic operations appears to be minimal. This site also mirrors the curvature of the westbound site in that it carries a slight downgrade of about I to 2 percent, with a slight horizontal curve upstream of the area.
6th Avenue —Westbound
The cross section at this site consists of five lanes of I I ft in width, with a full ri-ht shoulder of 8 to 10 ft, and a left shoulder of less than 2 ft in width. In addition to the right shoulder there is a continuous auxiliary lane present from an on ramp that is immediately upstream from the site. Due to the presence of this auxiliary lane, the impact of this ramp is minimal. The study area has a slight upgrade of about I to 2 percent. Approximately 500 ft downstream of the study site, a horizontal curve to the fight is present. Upstream of the area is a tangent section of C,
TABLE 8. Site conditions 1-85
site
Lane Width
Left Shoulder
Right Shoulder % Trucks
Application Type Freeway Section
11'112' <2'12-8'1>8' <2' 2-8'1 >8' <5% 5_10% >10% HOV Add
Lane Merge/
Div I Weave BFS
Charnbee - Tucker, SB X X X A x X
N. Druid Hills, SB X X AP
W M X X
Shallowford Rd, N-B X X X P x X
Shallowford Rd, SB x X AP X
Wood Parkway, SB +X X
, X + X
BM X
LEGEND: A—AM Peak P—PM Peak M—Mid-Day X—All Day W—Weekend Period BM—Benchm3rk

(D Q <
CL CD 0 0
> < U3 5D
5D CD
tj tj
0 a 0
S
fD
Site Number -and Direction
Benchmark NOT TO SCALE
<0 1 12' 21 12'
1 4'
Median Right
Barrier Typical Cross-Section Shoulder
1-94 Figure 15. 1-94 corridor, Minneapolis, St. Paul. -

Figure 16. 1-94 corridor in Minneapolis at East River Road.
at least 1500 ft. Stop-and-go traffic backs into the site from downstream congestion for significant periods. 0
Crenshaw Boulevard — Eastbound
The cross section consists of five lanes of I I ft in width, with a full right shoulder of 8 to 10 ft, and a left shoulder between I and 2 ft wide. This study site is immediately downstream of the benchmark site at West Boulevard. There is an exit ramp 600 to 700 ft upstream and an entrance ramp is located about 700 to 800 ft downstream of the site. The influence from these ramps was observed to be minimal on the study site.
Crenshaw Boulevard — Westbound
This site has a cross section consisting of five lanes of I I ft in width, with a full right shoulder of 8 to 10 ft, and a left shoulder between I and 2 ft wide. There is a slight upgrade of between I and 2 percent through the study area. There is an exit ramp approximately 1000 ft upstream and an entrance ramp approximately 500 ft downstream of the study site. Neither of these ramps appears to have an appreciable influence through the study area.
23
West Boulevard— Eastbound
This site has a cross section consisting of five lanes of 12 ft in width, with full shoulders on both the left and right sides. An entrance ramp from an upstream interchange merges into traffic approximately 1000 ft upstrearn of the site but does not appear to influence traffic in the study area. Approximately 500 ft down-stream of the site an exit ramp leading to Crenshaw Boulevard is present. Influence through the study area on traffic operations is noticeable due to vehicles slowing for the exit. This bench-mark site is located within the section of the corridor that dis-plays intermittent treatments for shoulder use and immediately precedes a transition area into a treated section.
1-405—LOS ANGELES, CA
The 1-405 corridor travels in a north-south direction to the west of the Los Angeles area. The corridor ties in with 1-5 at both the north and south extremes of the metropolitan Los Angeles area. The section of the freeway using treatment strate- a -605 interchan-e. The freeway ,0es is located to the south of the 1 0
generally carfies four or five lanes in each direction. In the treated sections, the implementation of a left-side HOV lane has required the use of a portion of the left shoulder to accommodate the additional travel lane. Although the left shoulder has been used in part to provide for the HOV lane, the fight-shoulder width and the travel-lane widths have not been affected. This freeway was analyzed as a full corridor with four altered sites (Bolsa Chica Road, Golden West Street, and Newland Street northbound and southbound) and one benchmark site (Cherry Avenue) being observed. Figures 19 and 20 show the corfidor alignment and conditions, respectively. The key characteristics of each site are presented in Table 11. The following paragraphs provide a brief descfiption of each site.
Boise Chica Road—Southbound
This site is sirrular to the Golden West Street site in that it has a cross section of five 12-ft lanes, with the leftmost lane being an HOV lane. There is a 2-ft left shoulder and a full right shoulder of at least 10-ft. 'Mere is an entrance ramp that merges into traffic approximately 200 ft downstream from the study site, which will have some influence on right-side traffic, al-
TABLE 9. Site conditions 1-94
site
Lane Width
Left Shoulder
Right Shoulder % Trucks
Application Type Freeway Section
11] 12' <2'1 2-8'1 L8L <2' 2-8'1 >8' <5% 5_10% >10% HOV Add
Lane Merge/
Div lWeave BFS,
East River Road, WB x x X P AM X x
Pascal Street, WB X X I P A BM X
Snelling Avenue, WB
1XXX
X X I M I X X
U of M Exit, EB __ x P I AM I _ X X
LEGEND: A—AM Peak P—PM Peak M—Mid-Day X—All Day W—Wcckcnd Period BM—Bcnchmark

z 0
0 < 0
M M
0 3 0 >
CD T > < 13 --1 (1) < fD a) fD
IC& A
A~ 3
0 0
Site Number and Direction
Benchmark
NOT TO SCALE
Median Right Barrier Typical Cross4Section
Shoulder
Figure 17. 1-10 corridor, 1.os Angeles. 1-10

Figure 18. 1-10 in Los Angeles at 61h Ai-enue.
though the ramp volume was never heavy enough to cause sig-nificant slowing or stopping. There is no appreciable grade or horizontal curvature through the study area.
Cherry Avenue— Northbound
This benchmark location has a four-lane cross section of 12-ft general use lanes with a full right shoulder and a full left shoulder. It lies on an upgrade of about 2 to 3 percent with a horizontal curve to the left beginning 1000 ft downstream of the area. There are two exit ramps in the immediate vicinity of the site. The first is located 1000 ft upstream and exits onto Cherry Avenue. The second exit occurs in the study area and exits onto Orange Avenue. There is an entrance ramp from Cherry Avenue located approximately 1500 ft downstream, which has negligible influence on the area.
Golden West Street — Southbound
This site has a five-lane section with the leftmost lane being an HOV lane. All lanes are a full 12 ft in width. There is a I to 2-ft left shoulder from the edge of the HOV lane to a median barrier. The right shoulder is a full-width shoulder. There is a 2-ft separation from the HOV lane to the leftmost general travel C,
25
lane. This interchanoe area is serviced by a collector-distributor road that parallels the freeway and effectively removes any influ-ence that ramps have on the study site.
Newland Street— Northbound
This is a mirror image of the southbound direction at the same overpass. It has a five-lane cross section of 12-ft lanes with the leftmost lane being used as an HOV lane. There is a 2-ft left shoulder and a full riaht shoulder. There is also a 3-ft separation between the leftinost general travel lane and the HOV lane. This separation is set off by the use of the double yellow pavement markers. Approximately 900 ft downstream is an exit ramp to Beach Boulevard. Upstream of the site about 1500 ft is an en-trance ramp from Wagner Street. Neither ramp appears to influ-ence traffic in the study area. There is no grade or horizontal curvature through this area.
Newland Street— Southbound
The site has a five-lane cross section of 12-ft lanes with the leftmost lane being used as an HOV lane. There is a 2-ft left shoulder and a full riaht shoulder. There is also a 3-ft separation between the leftmost aeneral travel lane and the HOV lane. This separation is set off by the use of a pair of double yellow pave-ment markings. This is a tanuent section with no appreciable grade. There is an entrance ramp approximately 1000 ft down-stream, which appears to have minimal influence through the study area.
SR 57—LOS ANGELES, CA
The SR 57 corridor travels in a north-south direction from the interchange of 1-10 to the interchange of 1-5 to the east of Los Anaeles. The freeway generally carries four to five lanes in each direction and has two distinct sections across its length: one portion with standard- width lanes and shoulders, and another section that was converted to an HOV corridor with the leftmost lane being used for an HOV lane. This was accomplished by narrowing the general travel lanes and by capturing the left shoulder. Data were collected at four altered sites: Imperial Highway in both the southbound and northbound directions, and
TABLE 10. Site conditions I-10
site
Lane Width
Left Shoulder
Right Shoulder % Trucks Application
Type Freeway Section
ill 12' <2' 2-8' 81 <2' 2-8' I
- 8' <5% 5-10% >10% HOV Add Lane Merge/
Div Weave BFS
6th Avenue, EB X X ix W MP X X
6th Avenue, WB X X X I P AM X X
Crenshaw Blvd., EB X
X I X
Crenshaw Blvd., WB X
X X X
P
]tA
X
X
X
X
West Boulevard, EB ?'I A MP BM X
LEGEND: A—AM Peak P—PM Peak M—Mid-Day X—All Day W—Weekcnd Period BM—Benchmark

=r 03
PL
NOT TO SCALE
12' 1 2', 12' 1 12' 1 12' 1 12' 1 10,
Median Typical Cross-Section Right Barrier Shoulder
1-405 Figure 19. 1-405 corridor, Orange Couniy.
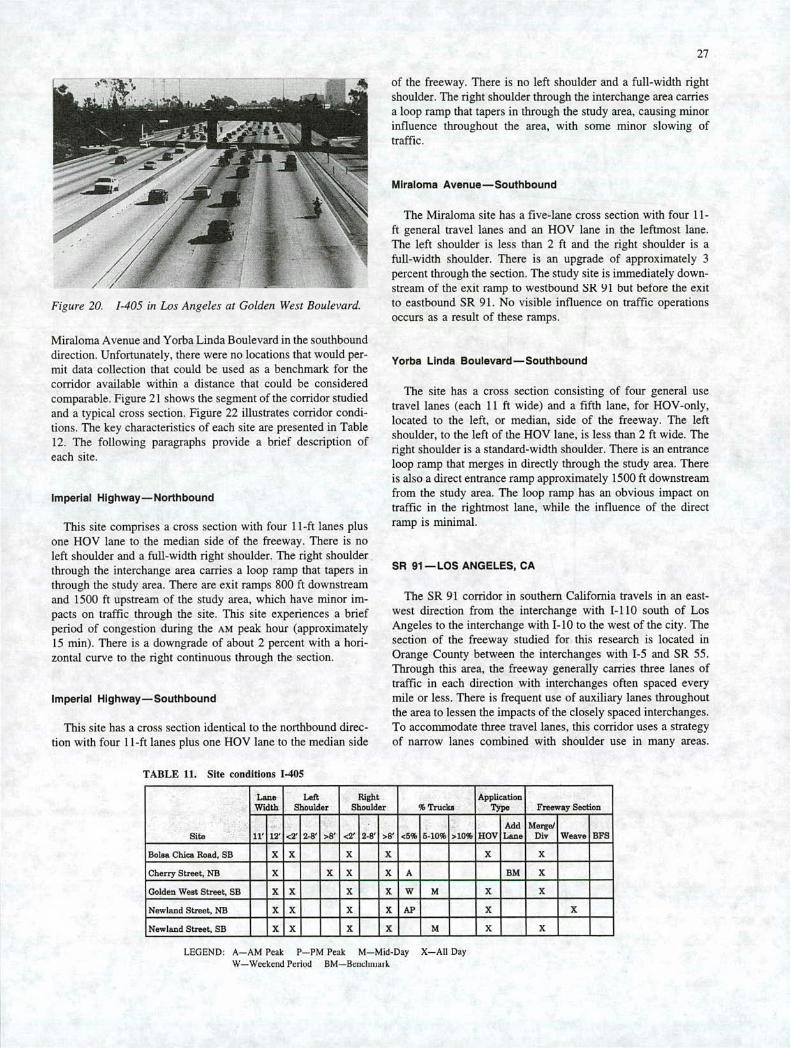
Figure 20. 1-405 in Los Angeles at Golden West Boulevard.
Miraloma Avenue and Yorba Linda Boulevard in the southbound direction. Unfortunately, there were no locations that would per-mit data collection that could be used as a benchmark for the corridor available within a distance that could be considered comparable. Figure 21 shows the segment of the corridor studied and a typical cross section. Figure 22 illustrates corridor condi-tions. The key characteristics of each site are presented in Table 12. The following paragraphs provide a brief description of each site.
Imperial Highway— Northbound
This site comprises a cross section with four I I-ft lanes plus one HOV lane to the median side of the freeway. There is no left shoulder and a full-width right shoulder. The right shoulder through the interchange area carries a loop ramp that tapers in through the study area. There are exit ramps 800 ft downstrearn and 1500 ft upstream of the study area, which have minor im-pacts on traffic through the site. This site experiences a brief period of congestion during the AM peak hour (approximately C, 15 min). There is a downgrade of about 2 percent with a hori-
c' zontal curve to the right continuous through the section. C,
Imperial Highway— Southbound
This site has a cross section identical to the northbound direc-tion with four I I-ft lanes plus one HOV lane to the median side
TABLE 11. Site conditions 1405
27
of the freeway. There is no left shoulder and a full-width right T
shoulder. The right shoulder through the interchange area cames C, a loop ramp that tapers in through the study area, causing rninor 0
influence throughout the area, with some minor slowing of traffic.
Miraloma Avenue — Southbound
The Miraloma site has a five-lane cross section with four I I-ft -eneral travel lanes and an HOV lane in the leftmost lane. The left shoulder is less than 2 ft and the right shoulder is a full-width shoulder. There is an upgrade of approximately 3 percent through the section. The study site is immediately down-stream of the exit ramp to westbound SR 91 but betore the exit to eastbound SR 91. No visible influence on traffic operations occurs as a result of these ramps.
Yorba Linda Boulevard — Southbound
The site has a cross section consisting of four general use travel lanes (each I I ft wide) and a fifth lane, for HOV-only, located to the left, or median, side of the freeway. The left shoulder, to the left of the HOV lane, is less than 2 ft wide. The right shoulder is a standard-width shoulder. There is an entrance loop ramp that merges in directly through the study area. There is also a direct entrance ramp approximately 1500 ft downstream from the study area. The loop ramp has an obvious impact on traffic in the rightmost lane, while the influence of the direct ramp is minimal.
SR 91 —LOS ANGELES, CA
The SR 91 corridor in southern Califorriia travels in an east-west direction from the interchange with 1-110 south of Los Angeles to the interchange with 1-10 to the west of the city. The section of the freeway studied for this research is located in Orange County between the interchanges with 1-5 and SR 55. Through this area, the freeway generally carries three lanes of traffic in each direction with interchanges often spaced every mile or less. There is frequent use of auxiliary lanes throughout the area to lessen the impacts of the closely spaced interchanges. To accommodate three travel lanes, this corridor uses a strategy of narrow lanes combined with shoulder use in many areas.
Site
Lane Width
Left Shoulder
Right Shoulder % Trucks
Application Type Freeway Section
11' 12' <2'12-S'l >8' <2' 2-8' >8' <5% 6-10% >10% HOV Add Lane
Merge/ Div Weave BFS
Bolas Chica Road, SB X X X X X X
Cherry Street, NB X X X X A BM X
Golden West Street, SB X X x x W M X X
Newland Street, NB X X X X AP X X
Newland Street. SB X X X X M X X
LEGEND: A—AM Peak P—PM Pcak M—Mid-Day X—All Day W—Weekend Period BM—Betichmaik

00
67 >
Placentia.4ve.
CD
0 0 SL
74
Site Number and Direction
4
Benchmark
NOT TO SCALE
Ill . 8'-10' 2' 12' 1 2' 1 ill I Ill
Median Barrier Typical Cross-Section
SR 57 Figure 21. SR 57 corridor, California
Right Shoulder

29
14- 7'
" , ~V.5
Figure 22. SR 57 in Los Angeles tit Yorba Linda Boulevard.
Often where both shoulders were captured for travel lanes, clear-
ance is present on the right side to enable disabled vehicles to
pull onto turf areas. Because of the lack of acceptable data
collection sites, only three altered sites were included in the
effort (Harbor Boulevard, Lemon Street, and Placentia Avenue)
in addition to the benchmark site at Kraemer Boulevard. Figure
23 illustrates typical conditions. Figure 24 shows the section
of the corridor studied and a typical cross section. The key
characteristics of each site are presented in Table 13. The follow-
ing paragraphs provide a brief description of each site.
Harbor Boulevard —Westbound
This site has a cross section consisting of four 11 -ft lanes,
with a I-ft left shoulder to a median barrier, and no right shoulder
Figure 23. SR 91 in Los Angeles at Harbor Boulevard.
present. Although there is no right shoulder, a mountable curb
exists, which would allow a vehicle to pull off to the side of
the road to a turf area. The section exhibits an upgrade of approx-
imately 4 percent, which ineets with a horizontal curve to the
right approximately 300 ft downstream. At a distance of 600 to
700 ft downstream of the section there is an entrance ramp from
Harbor Boulevard that appears to have negligible influence on
operations in the study area. Entrance ramps are present approxi-
mately 1000 ft and 1500 ft upstream of the site from Harbor
Boulevard and Lemon Street. respectively. These ramps appear
to have minimal influence through the study area.
Kraemer Boulevard— Eastbound
This benchmark site carries three 12-ft travel lanes with full-
width shoulders on both the right and left sides. To the right of C, C, the outside shoulder is a 20-ft raised separation from a collector-
distributor road, which appears to be mountable, thus giving Z' extra clearance for disabled vehicles. This interchange in the
eastbound direction is served by a collector-distributor road,
therefore, there are no ramp influences through the study area.
Lemon Street— Eastbound
This study site has a cross section consisting of four I I -ft
lanes, with a 0- to 2-ft left shoulder to a median barrier and a
0- to 2-ft right shoulder. There is a short auxiliary lane weaving
section between an entrance and exit ramp for Lemon Street.
These ramps are not heavy volume ramps, thus their impact is
minor. To the right of the auxiliary lane is a mountable curb
leading to an area capable of receiving disabled vehicles. There
is a 3 percent upgrade through the site, with slight curvature to
the right approximately 300 ft downstream.
Placentia Avenue —Westbound
This site has a cross section consisting of three I I-ft lanes,
with a left shoulder to a median barrier tapering through the
study area from 6 ft at the overpass structure to about 2 ft
approximately 100 ft downstream, and finally tapering to no
shoulder at approximately 200 ft downstream. The right shoulder
is approximately 4 ft wide, however, there is a continuous auxil-
iary lane at this location between an entrance ramp upstream
from SR 57 to an exit ramp to State College Boulevard in
Anaheim. This appears to eliminate, or at least minimize, the
influence of these ramps on traffic operations. There is an up-
grade of approximately 3 percent through the area, and at a
distance of 200 ft upstream a horizontal curve to the left begins
that carries through the study area.

W 0
0 %D
:3 U) CL R
CD 0) CD
< 0 1 CL CD
(COD 0 9, 2) <
CD
0)
NOT TO SCALE
Site Number and Direction
Benchmark V. Ill <2'
Median
Barrier
Typical Cross-Section
Mountable Curb
SR 91
Figure 24. SR 91 corridor, Califomia.

TABLE 12. Site conditions SR 57
Site
Lane Width
Left Shoulder
Right Shoulder % Trucks
Application Type Freeway Section
11' 12' <2'1*2-8'1 >8' <2' 2-8'1 >8' <6% 5-10% >10% HOV Add Lane
Merge/ Div Weave BFS
Imperial Highway, NB x x x A M x x
Imperial Highway, SB x x M x x
Miraloma Avenue, SB X x x
Yorba Linda Blvd., NB X x _~~Pxx
LEGEND: A—AM Peak P—PM Peak M—Mid-Day X—All Day W—Weekend Period BM—Benchmark
TABLE 13. Site conditions SR 91
site
Lane Width
Left Shoulder
Right Shoulder % Trucks
Application Type Freeway Section
11' 12' <2'1 2-8'1 >8' <2' 12-8'1 >8' <5% 5-10% >10% HOV Add Lane
Merge/ Div Weave BFS
Harbor Blvd., WB x x x W M A x x
Kraemer Blvd., EB x x AP BM x
Lemon Street, EB X x I M x x
Placentia Avenue, X x A I x I x L
LEGEND: A—AM Peak P—PM Peak M—Mid-Day X—All Day W—Weekend Period BM—Bcnchmark
UH

32
CHAPTER 3
FINDINGS
The primary focus of this research was concentrated on gain-ing an understanding of the differences in operational and safety characteristics between full standard or "unaltered" freeways and "altered" freeways where shoulders and narrower lanes have been used to increase capacity by adding lanes. To accomplish this, a variety of application types were included in the sites chosen. This chapter summarizes current use of shoulders and narrow lanes to increase freeway capacity and presents research findings that could influence the decision to implement a project using such strategies. Findings have been presented under four headings. The current use of shoulders and narrow lanes is sum-marized both in terms of use throughout the country and the various implementation strategies. Following this, the findings regarding safety performance based on accident analysis are presented. The results of the operational field studies are pre-sented under operational performance. Finally, other findings and observations are presented. Some findings are anecdotal and subjective in nature or at least will require further investigation beyond the scope of this research to strengthen the basis for the finding. Care has been taken to distinguish between analytical findings and anecdotal findings or qualitative observations. Rec-ommended guidelines and an evaluation methodology are pre-sented in Chapter 4.
USE OF SHOULDERS AND NARROW LANES
Historical
The use of shoulders and narrow lanes on freeway or express-way type facilities has occurred since construction of the first facilities. The earliest urban freeways, or their equivalent (such as the East River Drive and West Side ffighway in New York City, Davidson Expressway in Detroit, Lake Shore Drive in Chicago, and the Pasadena Freeway in Pasadena), generally were constructed with narrow lanes and with little or no shoulder width. True urban freeways came into being after World War 11 for most states, with the evolution of the Interstate System, which was mapped out in the 1930s and 1940s and begun in the 1950s.
One of the first works that led to standards of lane widths was published by Stonex and Noble in 1940 (4). Their study showed vehicle placements within lanes on high-speed hori-zontal curves. This led to a recommendation for 12-ft lanes.
In The Effect of Roadway Width on Vehicle Operations (5), Taragin reported on how the lateral clearance between vehicles in opposing flows changed as traffic lane widths varied from 9 to 12 ft. The reported driver reactions were later summarized in Traffic Engineering (6), as follows: "From the point of view of
driver comfort ' , 11 feet is about the ideal lane for passenger-car traffic, and 12 feet is ideal where there is mixed traffic of trucks and passenger vehicles."
At about the same time, in 1946, a National Safety Council study reported to AASHO by David M. Baldwin (7), showed a decline in accident rates associated with increases in lane widths from 8 or 9 ft up to 12 ft, suggesting the desirability of wider lanes. Then the impact on highway capacity of different lane widths was documented in the 1950 Highway Capacity Manual (8). For multilane highways, a table showed that the theoretical design capacity of an 11 -ft lane should be reduced to 97 percent of that for a 12-ft lane, while a 10-ft lane would have only 91 percent of the 12-ft lane capacity.
Thus, by 1950, the Traffic Engineering Handbook (9) was reporting an AASHO standard of 12-ft lanes where volumes exceeded 200 vehicles per hour. I
Meanwhile, the value of shoulders was being made suffi-ciently clear, and design manuals were including them on urban as well as rural projects. For example, Matson, et al. (6) cited a California study of accidents on a highway without shoulders (Report of an Investigation of Accidents on the Arroyo Seco Parkway, 1948), indicating that 15 percent of all accidents in-volved vehicles parked on the traveled way. In A Policy on Design Standards (10), AASHO in 1950 prescribed the follow-ing Interstate System standards:
Traffic lanes shall be not less than 12 feet wide. Medians in urban areas and mountainous areas shall be at least
16 feet wide ... [can be less in urban areas] ... but no median shall be less than four feet wide.
Shoulders usable by all classes of vehicles in all weather condi-tions shall be provided on the right of traffic. The usable width of shoulder shall be not less than 10 feet.
A Policy on Arterial Highways in Urban Areas (11), AASHO's 1957 "Red Book," shows the same figures and notes that "On expressways and freeways, shoulders should be con-structed throughout." The recommended clear shoulder width for the Interstate System was 10 ft, with 12 ft desirable for the urban system. Median shoulders were not specifically discussed, and median widths recommended for urban facilities were too narrow to provide shoulders. A minimum lateral clearance of 41/2 ft to median bridge piers, with 6 to 8 ft preferred, was recommended.
Publications in the 1960s do show consideration of median shoulders. The Freeway in the City (12), from the U.S. DOT, says the following: "All freeways should provide a continuous shoulder on both sides of each roadway for disabled vehicles. No moving vehicles should be separated from a pulloff shoulder by more than one traffic lane. Both the safety of the highway

33
Wig LIMITED USE
Note: Hawaii has also Implemented a project utilizing shoulders = EXTENSIVE USE
Figure 25. States that have implemented a project using shoulders with or without narrow lanes (past or present) for nonconstruction application.
users and the elimination of tieups are involved. Where a contin-uous shoulder strip is not feasible, frequent emergency pulloff bays should be provided." A teaching aid of the same period. Fundamentals of Traffic Engineering— 7th Edition (13), illus-trates an urban freeway with a median shoulder of 5 to 8 ft in a 22-ft median, and 10-ft right shoulders with a 3-ft transition to back slopes.
In summary, as urban freeway design standards evolved, cross sections became increasingly generous, despite the costs of right of way and impacts of these highway facilities on adjacent com-munities. However, by the late 1960s congestion had reached significant levels on some freeways and the use of shoulders or narrow lanes to increase capacity on facilities originally con-structed with shoulders and 12-ft lanes was employed in the Los Angeles area.
The use of shoulders with or without the use of narrow lanes for purposes other than maintenance of traffic through temporary work zones is restricted to a relatively small number of states. California, Texas, Washington, and Virginia have used these strategies extensively. Usage in other states has been much more limited. Figure 25 summarizes the use across the country. A listing of corridors using these strategies is presented in Table 14. This listing of corridors is based on the literature review, survey, and findings of this research and is not likely to be all inclusive. Additional projects, modifications to projects, and elimination of some applications are at various stages of plan-ning or implementation. Typical applications include the following:
HOV Applicatlons
ders. In some cases, lanes for single occupancy vehicles (SOVs) have been narrowed as well. Details of implementation vary; most desi-nate the left (median) lane as the HOV and use the shoulder to maintain the same number of re-ular lanes as existed prior to project implementation. Figure 26 illustrates a typical HOV application. Specific examples of this type of application include: 1-405, SR-57, and SR-91 in Los Angeles; 1-66 and I-95 in Virginia, and 1-5 in Seattle. In most cases, lanes have been open to traffic all day but in some cases the shoulder lane has been open to traffic only during peak periods.
Auxillary Lanes
One of the most common uses to date for shoulders or nar-rower lanes is the construction of an auxiliary lane between closely spaced interchanges in an urban area. This type of appli- C
cation is illustrated in Figure 27. Implementation approach var- L ies; typically the rightmost lane(s) have been narrowed in conibi-
nation with the use of the riaht shoulder to gain an extra lane. In some cases. the entire roadway section has been restriped to achieve uniform lane widths. In still other situations, the left shoulder has been used and the roadway restriped for a consider-able distance. Using only the fight shoulder and fightniost lanes is often the least expensive method: however, trucks tend to travel in these lanes and these lanes experience more vehicle maneuvers. Narrow lane widths are, therefore, more likely to affect traffic operations.
Merge Areas
High occupancy vehicle (HOV) lanes have often been imple- At heavy merge areas, such as those that occur where two
mented by adding a lane through the use of one or both shoul- lane ramps from other major facilities join the mainline, the

TABLE 14. Corridors or sites with narrow lanes / shoulder use State City/County Facility Application Type
California Los Angeles/ 1-5 Numerous sections beginning in Orange Add Lane Orange County County at 17" Street to the Simi Valley Freeway
in Los Angeles County.
Los Angeles 1- 10 Extensive use of shoulder between 1-405 and Add Lane 1-605.
L,Ds Angeles SR 60 Numerous sections between 1-5 and Add Lane Hacienda Road.
Los Angeles SR 91 Extended sections between 1-405 and 1-605. HOV
Los Angeles U.S. 101 Numerous short sections from Downtown Add Lane Los Angeles to Reseda Boulevard.
Los Angeles 1-110 Three sections approximately one mile in Add Lanes length.
Los Angeles 1-210 Four auidliary lanes with HOV Add Lanes/HOV Implemented in 1991.
Los Angeles 1-405 Extensive use of shoulder for HOV implementation of HOV lanes in Los Angeles and Orange Counties.
Los Angeles 1-710 Slauson to 1-5. Add Lanes Santa Clara/ 1-280 Several short sections in both directions. San Mateo
Alameda 1-580 Several sections from Milepost 42 to 46 Add Lane through Oakland.
Contra Costra 1-680 (Southbound) Short auxiliary lane nea? Add Lane Walnut Creek.
Marin Several sections on Route 101 between the Golden Add Lane Gate Bridge and Milepost 18.
San Jose 1-280 from Wolfe Road to DeAnza Boulevard. Add Lane (Part-Time Operation)
San Mateo Route 101 (Both Directions) between Extended Section Milepost 12.0 - 13.3.
California San Mateo Route 92 (Eastbound) between HOV Milepost 12.9 - 14.0.
San Mateo Route 92 (Westbound) between HOV Milepost 2.8 - 4.4.
California Sacramento Route 51 (Southbound) from Camino Street Add Lane to Marconi Road (Part-time
Auxiliary Lane)
Sacramento Route 51 (Northbound) Over Route 244 Add Lane
Colorado Denver 1-25 (Northbound ) from Steel Street Add Lane to Emerson Street.
34
queues that form impede upstream traffic movements on the mainline. By using the shoulder and narrower lanes, an added lane can be achieved—thus providing greater opportunities to merge. The added line is then dropped at a convenient down-stream location (see Figure 27).
Deceleration Lanes
Another use has been the extension of deceleration lanes to allow traffic destined to another freeway or arterial to bypass a queue on the mainline or to keep a traffic queue from a ramp from backing onto the mainline. Applications of this type may have a limited useful life due to the growth in congestion. Figure 28 illustrates an application of this type.
Extended Sections
Shoulders with or without narrow lanes have been used to provide additional capacity in areas of recurring congestion.
Unlike the applications identified above, the altered cross section is continued for an extended length through several interchanges (Figure 29) and the lane is adopted as another mainline lane. Applications of this type studied previously are more limited but were initially considered to have been successful with most applications occurring within four states: California, Texas, Vir-ginia, and Washington. With the congestion facing many urban areas, this was perhaps the key issue facing this research effort. That is, can narrower lanes and use of the shoulders be consid-ered as a means to provide an increase in basic mainline capacity without compromising safety or other considerations? This is of particular concern given that the implementation of a concurrent HOV lane on an existing facility may be a variation of this application type.
Work Zones
The use of narrow lanes is a common practice during the reconstruction or maintenance of freeways. Figure 28, presented previously, illustrates how narrow lanes and/or reduced shoulder
I

TABLE 14. Corridors or sites with narrow lanes / shoulder use (continued) State City/County Facility Application Type
Denver 1-25 (Southbound) from Emerson Street Add Lane to University Boulevard.
Connecticut West Hartford 1-84 EB Trout Brook Connector Auxiliary Lane
Wethersfield 1-91 (Southbound) from Route 3 Add Lane to Elm Street. Eliminate
Left merge
Georgia Dekalb County 1-85 (Northbound and Southbound) from Route 23 Add Lane to 1-285.
Atlanta 1-20 (Westbound) from 1-75 Add Lane to Hightower Road. (Extended
Section)
Massachus Boston Route 128 from 1-95 to 1-93. Add Lane etts (Part Time)
Minnesota Minneapolis 1-94 Restriping to eliminate lane drops. Add Lane
Missouri St Louis 1-70 from Airport Road to Frost Avenue. Add Lane
New Jersey Garden State Parkway has extensive use of Add Lane Shoulders.
New Albuquerque 1-25 Add Lane Mexico
New York Long Island Expressway - Several sections HOV implemented in the summer of 1991.
Oregon Portland 1-5/1-405 Marquan Bridge. Add Lane
Portland Banfield Freeway. HOV
Tennessee Nashville 1-65/1-265 (Northbound) from 1-65/1-265 merge Add Lane to Trinitv Lane Interchange. (Lane Auxiliary I
Darison County 1-24/140 (Eastbound) from 1-65 Interchange Add Lane to Fessler's Lane.
Texas Houston 1-610 at Route 288 Interchange Add Lane (Auxiliary Lane)
Houston 1-610 from 1-10 Interchange to Add Lane Woodway Street. (Elimination
of Merge)
Houst,on 1-45 North Freeway from 1-610 Interchange Add Lane to Cavalcade Street. (Elimination
of Merge)
Houston US-59 (Southbound) on Southwest Freeway from Add Lane Wesleyan. (Extended)
Houston US-59 (Northbound) on Southwest Freeway Add Lane from New Castle to Edlone. (Part-time)
Houston 1-610 Northbound Add Lane
35
widths are implemented at a construction site. Such construction zone applications are primarily concerned with short-term main-tenance of as much of the previous capacity as possible. As the primary purpose of this research project was to study applica-tions that were implemented for the purpose of increasing capac-ity, work zone applications received only limited attention dur-ing the research.
Driver behavior through construction zones is influenced by a myriad of other factors. In the majority of construction proj-ects, the detour route through the site changes frequently. Study of these sections would have required a significantly different research approach. The urban 1-5 corridor in Seattle could tech-nically be considered a construction zone although traffic pat-terns were not changing and, therefore, conditions were compa-rable to many other so-called "interim" applications.
Application Groupings
To conduct this research, it was essential that applications be grouped by similarities. Initially, during the proposal stage, sites
were grouped by the categories discussed above. As the project proceeded it became apparent that these were sub-groups of larger groupings distinguished by purpose and operational char-acteristics. In terms of purpose, the three main groupings used were HOV, Add Lanes, and Work Zones. As the research contin-ued, the most important distinction became whether or not shoul-ders with or without narrow lanes had been used continuously to add travel lanes or selectively to address specific problems. Figure 30 illustrates the initial groupings assumed at the begin-ning of Phase 11 and the final groupings based on the results of the research.
SAFETY PERFORMANCE
Previous research generally conducted safety evaluations based on an analysis of data from specific sites on a before and after basis; however, concerns as to whether this approach was too narrowly focused remained. Projects implemented for short distances that addressed a specific problem often showed a de-crease in accident rates; however, as these strategies are being

36
TABLE 14. Corridors or sites with narrow lanes / shoulder use (continued)
State City/County Facility Application Type
Texas Houston 1-45 North Freeway from Airline Drive HOV Contra to Little York Road. Flow Lane
Houston 1-10 Katy Freeway from Gessner Interchange HOV to North Post Oak Overpass.
Houston 1-45 North Freeway from Downtown Add Lane to North Belt. (Transit in
the median)
Houston 1-45 Gulf Freeway from Downtown Add Lane to Choate Road. (Transit in
the median)
Alexandria 1-395 (Northbound) from King Strppt Add Lane to Glebe Road. (Extended
Section)
Virginia Alexandria 1-395 (Southbound) from Glebe Road Add Lane to Duke Street. (Extended
Section)
Fairfax County 1-95 from Fairfax County Line HOV to Capital Beltway. (Part-time
Operation)
Fairfax County 1-66 from Route 50 HOV to Capital Beltway. (Part-time
Operation)
Washington Seattle SR-520 (Westbound) from 1-5 HOV to Evergreen Point Bridge. (Part-time
Operation)
Seattle 1-405 from 1-5 through Renton. HOV
Seattle 1-5 from Spokane Street to Route 527. HOV
Seattle 1-90 (Eastbound) Across Mercer Island Work Zone
a. The approach used in this study was to examine accident rates
12' on a corridor basis (by comparing the performance of unaltered — — — — — — — — — — — — — — — — —
Before 12' - — — — — — — — — — freeway segments with altered freeway segments) and on a seg-
12' ment basis (by sectioning the freeway according to operational
10, characteristics, e.g., basic freeway, merge, diverge, and weave).
2 14' <> <>
ill - — — — — — — — — —
After 11'
Figure 26 Typical use of shoulders to incorporate an HOV lane.
applied throughout significant portions of urban corridors, either in an intermittent or continuous manner, it was hypothesized that the location of accidents may shift, reducing the accident rate on certain segments and increasing the rate on others. If this was the case it was not clear as to the impact on accident rates for the corridor as a whole. Another concern was that reductions reported in accident rates may be attributable to re-duced congestion. If so, when the per lane volumes or congestion reached previous levels the accident rate may actuaUy increase. This research hypothesized that by analyzing a large number of sites contained within several corridors these concerns would be overcome.
Development of Database
Accident data covering a 3-year period were requested from each agency in computerized format to facilitate analysis. In each case, accident data were requested for the portion of the freeway that included the altered sites and for a similar portion of the corridor that was unaltered. Accident data suitable for analysis were provided by Virginia, Washington, Georgia, and California for the following corridors: 1-95,1-395, 1-5,1-90,1-85, and I- 10. The data were then screened to ensure that meaningful analysis could be conducted. Each database was examined and compared by reviewing its respective accident report and the coding conventions used. This is important because each state has slight variations on how each accident is recorded. For exam-ple, in some cases, sideswipe accidents are subdivided into side-swipe and angle accidents. Care was exercised to ensure a con-sistent data structure for analysis. Multiple vehicle accidents are typically coded as two or more records. These were reduced to single records containing the information required for this research. Only accidents occurring on the mainline, shoulders,
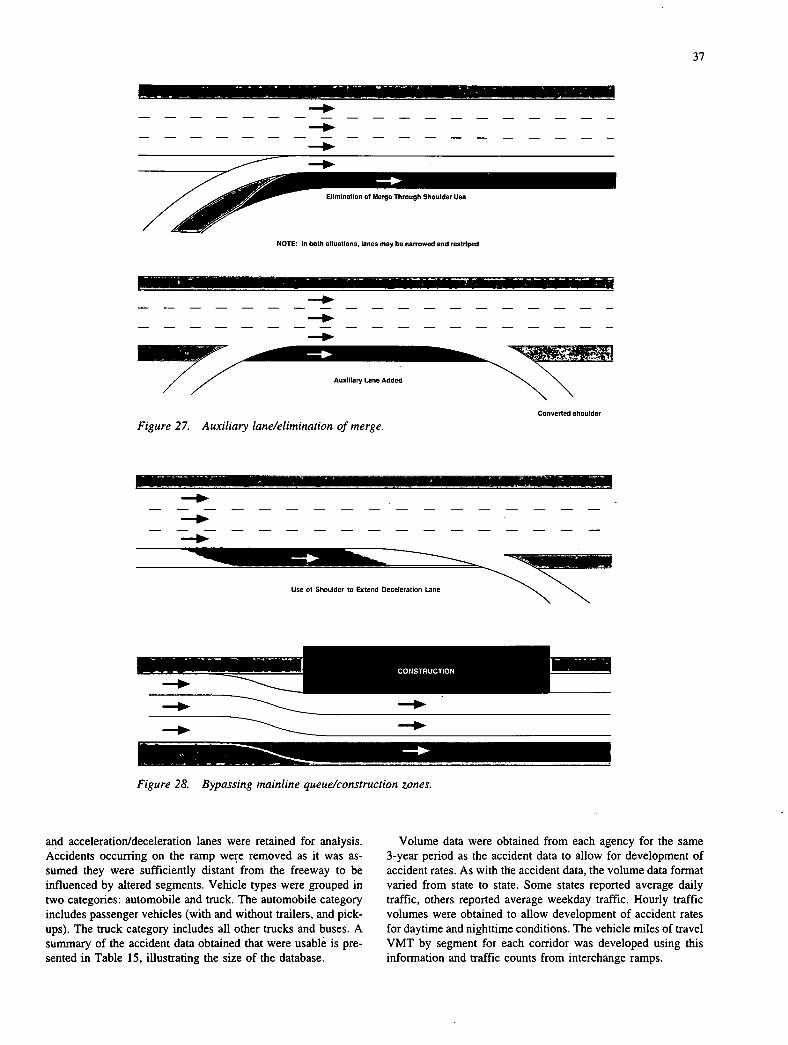
— — — — — — — — — — — — — — — — — — — __0_ — — — — — — — — — — — — — — — — — — —
Elimination of Merge Through Shoulder Use
NOTE: In both situations, lanes may be nanrowed and restriped
— — — — — — — --- 0 - — — — — — — — — — — —
— — — — — — — — — — — — — — — — — — —
m77~~ Auxiliary Lane Added Converted shoulder
Figure 27. Auxiliary lanelelimination of merge.
4111- - — — — — — — — -- — — — — — — — — — — — — — — — — — — — — — — — — —
___0_
Use of Shoulder to Extend Deceleration Lane
Figure 28. Bypassing mainline queuelconstruction zones.
37
and acceleration/deceleration lanes were retained for analysis.
Accidents occurring on the ramp were removed as it was as-
sumed they were sufficiently distant from the freeway to be
influenced by altered segments. Vehicle types were grouped in two categories: automobile and truck. The automobile category
includes passenger vehicles (with and without trailers, and pick-
ups). The truck category includes all other trucks and buses. A summary of the accident data obtained that were usable is pre-
sented in Table 15, illustrating the size of the database.
Volume data were obtained from each agency for the same
3-year period as the accident data to allow for development of
accident rates. As with the accident data, the volume data format
varied from state to state. Some states reported average daily
traffic, others reported average weekday traffic. Hourly traffic
volumes were obtained to allow development of accident rates
for daytime and nighttime conditions. The vehicle miles of travel
VMT by segment for each corridor was developed using this information and traffic counts from interchange ramps.

8.
12' — — — — — — — — — — — — — — —
Before 12' ---0- - — — — — — — — — — — — — — —
12'
10,
2-
- — — — — — — — — — — — — — — After ill
— — — — — — — — — — — — — — —
8'
Note re: Shoulder width Full width varies by jurisdiction
Figure 29. Extended sections.
38
Work Zone
Short Te rm
HOV
Elimination of a Merge Auxiliary Lanes Queue Bypass -
Extended Sections
Work Zone
~
Short
D,
Initial Grouping in Phase 11
M[Se=ve Lanes
LW
Extended Sections
I
eft Light ..j ouj
Ider I der
- Elimination of a Merge - Add Lane
Auxiliary Lanes - HOV
Queue Bypass
Final Grouping after Phase VI
Figure 30. Application groupings.

TABLE 15. Summary of accident data by corridor
Corridor Years of Data
Total Number of Accidents
Length (Miles)
Total Exposure (Million Vehicle Miles)
Unaltered Altered Unaltered Altered
1-395 3.0 1,377 15.10 4.24 1443.3 402.5
1-5 Suburban 3.5 1,598 11.55 8.45 1 1468.6' 292.9
1-5 Urban 3.5 4,656 9.40 8.04 1523.8' 485.6
1-85 3.0 2,819 5.73 6.67 1023.1 1158.2
1-10, 3.0 2,345 7.71 7.63 1244.1 1258.3
Total: - . 12,795 49.49 35.03 6,693.9
'Includes miles traveled both before and after freeway segment was altered.
39
Analysis Approach
To conduct the analysis, each freeway was segmented-first
into altered and unaltered segments, then into sections based
on operational characteristics using the guidelines contained in
Chapter 3 of the Highway Capacity Manual. In addition, the
sites (both benchmark and altered) used for operational analysis
were identified. The term "benchmark" refers to a specific site
within the unaltered segment of the corridor. For the purpose
of the accident analysis, sites were defined as the area where
operational data were collected and 2500 ft upstream and down-
stream of the count area, for a total site distance of approximately
6000 ft. Accidents were then tabulated by segment, section, and
site. Within each corridor, each site was assigned a number that
has been used to reference each site. In two cases, the site
numbers assigned for accident analysis varied from those as-
signed for operational analysis because the definition of the sites
for accident analysis resulted in an overlap between sites. Table
16 provides a key to sites by corridor. VMT on an annual basis
were developed for each segment, section, and site using the
volume data provided by each agency. For the purpose of this
study, it was hypothesized that the safety performance of a free-
way section may be effectively represented by the accident rate.
The effects of shoulder use and reduced lane width on the acci-
dent rate may then be estimated by comparing the accident
rate for differing field conditions. It was also assumed that the
following measures were significant indicators of safety
performance:
Accident severity
Daytime accident rate versus nighttime accident rate
Accident rate by type (rear end, side swipe, fixed object)
Accident rate by vehicle type (automobile, truck)
Accident rate by freeway characteristic (weaving area,
merge or diverge area, basic freeway)
These measures are all influenced by a variety of factors, which
will vary from corridor to corridor and site to site. Many of the
potential variables are listed in Table 17. Accident rates were
developed for a variety of stratifications. A list of-the primary
stratifications tested is given in Table 18. In this research, the
major concern was with isolating the influence of shoulder use
and lane width. To determine if any differences found in the
accident rate for altered segments versus unaltered segments of
freeway were significant, it was assumed that the only significant
differences between the altered sites and their respective bench-
mark sites were the differences in shoulder use and lane width.
While not precisely correct, this assumption allowed for paired
comparisons of rates on the various stratifications of accidents
from the population (exposure to the risk of an accident). Testing
was done using the nonparametric Wilcoxon Signed Ranked
Test. A nonparametric test was chosen because no assumption
concerning the distribution of accidents among the population
was made. Results were tested using the following hypotheses:
Ho Unaltered Altered versus
HA Unaltered Altered
Using a two-sided test, if the probability of the calculated test
statistic is greater than the chosen level of significance, then the
null hypothesis cannot be rejected. Testing was conducted at a
5 percent level of confidence (i.e., 95 percent confidence level).
Accident rates were expresse~ as the number of accidents per
100 million vehicle miles. Accident rates were calculated by
year and by total period using the equation:
Accident Rate (AR) = Number of Accidents
100 million vehicle miles
Analysis Results
The results of the accident analysis are surnmarized in Tables
19 through 27. A summary of statistical results is given in Table
28 with statistically significant differences noted. Accident rates
vary by corridor, from 69 accidents to 288 accidents per 100
million vehicle miles. All corridors, with the exception of the
urban 1-5 corridor, have accident rates within the range that
could be expected on urban freeways based on agency statewide
statistics. (The urban 1-5 corridor has a higher accident rate
because it is constrained and heavily traveled, interchanges are
closely spaced with many weaving areas, and many merge-di-
verge areas to and from ramps are very abrupt.)
Accident rates for altered segments were higher in three out
of five corridors (Table 19). If all corridors are considered to

TABLE 16. Key for study site identification
Corridor Site Operational Site Number
Accident Study Section Number
RT 128 Kendrick Street. NB 3 Kendrick Street, SB 2 Ponkapoag ~ NB I
BM S
o:
t h; Street-
NB ngton Street, N713 4
1-95 Pohick Road- N13 2 Pohick Road. SB 1
1-395 Edsall Road. SB BM BM Kine Street. SB I N. ShirlinFfton Circle, NB 2 1 S. Shirlinpton Circle. NE 3 S. Shirlington Circle, SB 4 3
1-5 Suburban 178th Street, M BM BM 178th Street. SB 1 2 216th Street. NB 4 1 216th Street, SB 3 4 Military Road, SB 2 3
1-5 Urban Albro Place, SB BM BM Denny Way, SB 2 3 Holgate Street, SB I I Yesler Way.. XB 3 2
1-90 Island Crest Way, WB 1 Island Crest Way. Before, EB 2 Island Crest Way, After, EB BM West Mercer W Y. WB . R
1-86 Chamblee-Tucker Road, SB 4 2 N. Druid Hills Road, SB 3 3 Shallowford Road, NB 1 1 Shallowford Road. SB 2 Wood Parkway. SB 13M EM
1-94 East River Road. WB I Pascal Street, WB BM Snelling Avenue, WB 3 U of M E)dt, EB 2
1-10 Sixth Avenue. EB 1 1 Sixth Avenue. VVB 2 2 Crenshaw Boulevard, WB 3 2 Crenshaw Boulevard, EB 4 1 West Boulevard. EB BM BM
1-405 Bolsa Chica Road, SB 3 Cherry NB BM Golden West Street. SB 4 Newland Street. NB I Newland Street, SB 2
SR 57 Imperial Highway, NB 1 Imperial Highway, SB 2 Miraloma Avenue, SB 3 Yorba Linda Boulevard, NB 4
SR 91 Harbor Boulevard, WB 2 Kraemer Boulevard, EB BM Lemon Street. EB 3 Placentia — WB 1
40
be from one population, statistical testing indicates no significant
difference between altered and unaltered segments. However,
when corridors are stratified or ranked by character, the finding
is a significant increase in the accident rate for one population.
The accident rate increase for a grouping of the 1-395 and 1-5
corridors is significant, increasing by up to 36 percent. Interstate 395 and the 1-5 corridors are similar in that they use both shoul-
ders and narrow lanes on a continuous basis for an extended
length (more than a mile). Shoulder widths varied somewhat but
are minimal in all cases (see Table 2). Throughout these corri-
dors, 1 I-ft lanes have been used.
In Atlanta on 1-85, 11 -ft lanes have been used but there are
generous shoulders. In the Santa Monica corridor, shoulders
and narrow lanes have been used extensively for a considerable
length; however, the additional lane is not continuous. Shoulders
and narrow lanes have been used to relieve specific bottlenecks
and improve lane balance and continuity. The result has been a
"smoothing" of traffic with a better balance between supply and
demand. In both cases, the accident rate has gone down slightly.
However, the null hypothesis holds; in the I-10 corridor the
change is relatively small, and in the 1-85 corridor the rate has varied up and down by year.

TABLE 17. Variables that influence safety performance
Number of Mainline Traffic Lanes Width of Traffic Lanes Width of Shoulders Proximity of Physical Structures Proportion of Trucks in Traffic
- Percent of Commuters Horizontal Alignment Vertical Alignment Level of Nighttime Illumination Proximity of Entrance/Exit Ramp Interchange Spacing Volume of Entering Traffic Speed Speed Differential (where concurrent-flow HOV lanes exist) Level of Service Condition of Road Surface Weather Driver Age Alcohol
TABLE 18. Primary stratifications tested
Accident Rates by Year Accident Rates by Vehicle Type Accident Rates by Freeway Section Accident Rates by Light Conditions Accident Rates by Severity Accident Rates by Site Accident Rates by Collision Type
41
milepost. Resectioning the freeway with relatively small changes in boundaries results in significant changes in the accident rate. In many cases, the number of accidents within each segment is low. The conclusion of the research team was that this type of detailed analysis would require an extensive effort involving tighter procedures for locating accidents. This concern is similar to the concerns raised with respect to the migration of accidents in response to changed conditions on the freeway. In both cases, conclusions with respect to overall safety performance based on analysis of short sections must be considered carefully.
Table 23 presents the results of analysis based on light condi-tions. Accident rates for nighttime conditions are higher but are in about the same ratio to daytime accident rates for both unal-tered segments and altered segments.
Accident rates by collision type are presented in Table 24. A slight increase in the proportion of sideswipe to rearend accident can be detected. This may indicate drivers are having some difficulty dealing with the narrower lanes; however, on a statisti-cal basis, the proportion throughout the corridor remains unchanged.
The results of an analysis of accident severity are shown in Table 25. Fatal accidents were dropped from further consider-ation due to the extremely low number of fatalities. No statisti-cally significant change in the ratio of injury accidents to prop-erty-damage-only accidents is detectable.
Tables 26 and 27 show the results by site for total accidents and by vehicle type. Similar stratifications to those conducted on a corridor basis were tested but were dropped because the number of accidents in each stratification quickly drops. In 11 of 15 cases, the accident rate was higher for the altered site than for the corridor benchmark (i.e., unaltered) site. This finding reinforces the findings from the corridor analysis.
Because the 1-5 corridors were implemented during the period covered by the accident data, a before and after comparison was performed. As shown in Table 20, the accident rate increased for the segments where shoulders and narrow lanes were used. In the unaltered segments where the shoulder and 12-ft lanes have been maintained, the accident rate remained relatively con-stant. Also notable is that the increase in the accident rate for the altered segments is similar to the difference between unal-tered and altered corridors in the 1-395 corridor.
Table 21 compares the accident rate by vehicle type. Truck accidents represent all accidents that involved one or more trucks. The accident rate for trucks showed an increase in most cases; however, on a corridor basis, the increases were not found to be statistically significant.
Table 22 shows accident rates for freeway sections as de-scribed in the analysis approach. Increases are shown in many cases. However, the research team is reluctant to draw conclu-sions for the following reasons. In urban corridors the sectioning of the freeway is subject to judgment. Close spacing of inter-changes means that many areas of influence overlap. A limited review of accident reports raises concern as to whether the loca-tion of accidents is recorded precisely enough for this type of analysis. Accidents are recorded by milepost usually by the offi-cer on the scene (in some cases a milepost is assigned during the data entry process) and is often an estimate of the nearest
OPERATIONAL PERFORMANCE
In order to isolate the impacts of shoulder use and narrow lanes from other influencing factors in field studies, two ap-proaches can be taken. A before and after study can be conducted at a site where a project is implemented; however, opportunities for this type of study are limited. Another approach and the one used for this research is to collect data at as many sites as possible where shoulders and narrow lanes have been used and compare them to sites that have remained unaltered and have maintained full shoulders and lane widths. Ideally, comparison or control sites that matched the study sites with the exception of shoulder use or lane width would be chosen. In practice this is virtually impossible. To overcome this constraint, several study sites were chosen in each corridor along with a benchmark site. The benchmark site had full shoulders and 12-ft lanes. Thus two sets of sites were established. The term benchmark was used because it better described the use of the sites (i.e., to establish a point of reference). In total, data were collected at 52 sites: 42 altered sites and 10 benchmark sites.
Development of Database
Operational data were collected at 52 sites in 11 corridors located in 6 states. The corridors studied were listed previously

TABLE 19. Corridor accident rates by year
Unaltered Altered Aggregate Time Accident Accident % Accident
Corridor Period Rate Rate Difference Rate
1-395 Year 1 64 99 54.7% 72
Year 2 69 110 59.4% 78
Year 3 72 81 12.5% 73
Total 69 97t 40.6% 75
1-5 SUBURB Total 86 . 122t 41.9% 100
1-5 URBAN Total 257 287t 11.7% 275
1-85 Year 1 176 133 -24.4% 154
Year 2 127 123 -3.2% 125
Year 3 122 101 -17.2% ill
Total 1 142 118 -16.9 129
1-10 Year 1 91 74 -18.7% 85
Year 2 95 89 -6.3% 92
Year 3 109 105 -3.7% 107
Total 98 89 -9.2% 94
Notes: 1. The use of shoulders and narrow lanes in the 1-5 corridors was implemented during the three year
period for which the accident analysis was conducted. A before and after comparison is presented in Table 28. Shading indicates cases where higher accident rates were observed for altered segments. Accident rates are given by year and for the total period available. Accident rates expressed as accidents per 100 million vehicle miles.
t. Possible difference from unaltered segments inferred by Wilcoxon Test (Table 28)
TABLE 20. 1-5 before and after accident rate comparison
All Accidents Auto Accidents Truck Accidents
Before After Before After Before After Corridor
Suburban Segment A 89 75 79 69 224 154 Segment B 86 122 86 131 190 148
Urban Segment A 206 183 197 174 324 291 Segment B 257 287 242 271 438 495
Notes: 1. Segment A in both corridors remained unchanged at full standards for the whole time period. 1
Segment B in both corridors was altered to provide an additional lane by utilizing the shoulder~s) and narrow lanes. Accident rates are expressed as accidents per 100 million vehicle miles, 100 million auto miles, and 100 million truck miles. Urban Corridor: 608 Days Before, 791 Days After Suburban Corridor: 781 Days Before, 428 Days After
42
in Table 2 and described earlier in this chapter. Table 29 provides
further information on corridor and site characteristics. These
corridors were selected to provide a broad coverage of the appli-
cation types in use. Criteria used in their selection included:
geometric design features, geographic location, vehicle mix,
alignment features, availability of comparison or benchmark
sites, ability to collect data, and cooperation from the agencies.
Data were collected in a two-step process. First, information
was collected from the responsible agency for all potential sites
and corridors. This included operational data and physical data
necessary to evaluate corridors based on the established criteria.
This information was used to make the final selection of sites
and corridors. Once the sites and corridors had been collected,
contact with the agencies was maintained to verify information
and obtain any permits required for data collection.
Operational data were collected in the field during 1992. The
primary means of data collection was videotaping. Filming was
conducted from freeway overcrossings with traffic filmed from
the rear. This procedure ensured that the filming crew was not
visible to the traffic being filmed, thus avoiding any influence on the traffic stream. Figure 31 illustrates a typical set-up. 'At each site, data were collected for a minimum of 6 hours and
supplemented as necessary by manual or tube counts. In addi-
tion, travel time runs were conducted at each site to allow verifi-
cation of speed data obtained. When feasible, data were obtained
from the videotapes using a system developed by JHK, the Video

TABLE 21. Corridor accident rates by vehicle type
CORRIDOR Time Period
AUTO TRUCK
Unaltered Altered % Diff. Unaltered Altered % Diff.
1-395 Year 1 Year 2
Year 3
Total
60 62
68
1 63
95 108
77
93t
58.3 74.2
13.2
47.6
141
208
150
1 167
189 151
34.0
-27.4
10.7
0.6 1
166
168
1-5 SUBURB Total 77 131t 70.1 191 148 -22.5
1-5 URBAN Total 204 271t 32.8 344 495 43.9
1-85 Year 1 Year 2
Year 3
Total
136 91
95 108
105 -22.8 10.9
-6.3
-9.3
594
505
410
501
742
580 24.9
14.8
-11.7
10.2
101 89
98
362
552
I-10 Year 1 Year 2
Year 3 Total
85 90
105
93
64
77
98 80
-24.7
-14.4
-6.7
-14.0
218 208
181 202
289 355
257
300
32.6 70.7
42.0
48.5
Notes: 1. Truck Accident Rates are the number of accidents involving at least one truck per 100 Million Truck
Miles. The Total Accident Rate is based on the total three year period. Shading indicates cases where higher accident rates were observed for altered segments.
Accident rates are given by year and for the total period available.
Accident rates are expressed as accidents per 100 million vehicle miles.
t. Possible difference from unaltered segments inferred by Wilcoxon Test (Table 28)
TABLE 22. Corridor accident rates for freeway sections
Corridor Time Period
BASIC RAN? WEAVE
Unaltered Altered Unaltered Altered Unaltered Altered
1-395 Year 1 110 109 55 65 64 1121
94 75, Year 2 70 108 60 120
58 Year 3 84 65 68 78 103
I Total 88 87 61 71t-' 75 121
1-5 SUBURB Total 87 153, 84 112t 73 64
1-5 URBAN Total 217 265 236 303t 183 2187
1-85 Year 1 190 188 166 114
Year 2 127 128 109
Year 3 113 118- 129 95
Total 143 154, 141 106
I-10 Year 1 93 A 163 92 69 74 104,1
Year 2 115 230 92 77 65 1q1 105 Year 3 119
~_;' '_'~273 105 91 115
103 Total log `222 96 77 85
Notes- 1. * No weave sections in the corridor. Shading indicates cases where higher accident rates were observed for altered segments.
Accident rates are given by year and for the total period available.
Accident rates are expressed as accidents per 100 mil[lion vehicle miles.
t. Possible difference from unaltered segments inferred by Wilcoxon Test (Table 28)
43
Traffic Data Acquisition System (VTRACS). VTRACS allows
the operator to set analysis parameters -marker length, length
of count, number of counts, file names, etc. -control the video-
cassette recorder, extract all the necessary data, and print a con-
cise report of volumes and speed by lane for the time period specified. For some sites having difficult lighting conditions, the
videotapes were studied using more traditional manual methods.
. Speed, volumes, and percent trucks were obtained for all sites. At sites selected for in-depth analysis, lateral placement, the
number of line crossings (line crossings refer to inadvertent line
crossings when no lane changes are made), lane changes, brake
applications, and lane distribution of traffic were also obtained.
Speed and volume data were reduced by lane for each 5-min period for all videotapes. The 5-min periods were chosen as

TABLE 23. Corridor accident rates for light conditions
Time DAY NIGHT
Unaltered Altered Unaltered Altered CORRIDOR Period
1-395 Year 1 61 94 72 114 Year 2 61 100 91 135 Year 3 64 71" 84 108
Total 61 88t 83 119t
1-5 SUBURB Total 71 119 127t
1-5 URBAN Total 216 295t 207 268t
1-85 Year 1 162 121 225 161 Year 2 115 120 169 132
96 Year 3 115 147 117
Total 131 112 180 140
I-10 Year 1 71 66 151 98 Year 2 78 146 118
Year 3 99 100 136 121
82 Total 1 83 144 113
Notes: 1. Shading indicates cases where higher accident rates were observed for altered segments. 2. Accident rates are given by year and for the total period available. 3. Accident rates are expressed as accidents per 100 million vehicle miles. t. Possible difference from unaltered segments inferred by Wilcoxon Test (Table 28)
TABLE 24. Corridor accident rates by coffision type
Corridor lime Period
SIDESWIPE REAR ND FDCME / ECT OTHER
Unaltered Altered Unaltered Altered Unaltered Altered Unaltered Alteed
1-395 Year 1
Year 2
Year 3
Total
14
14
10
z,
22-
.17'
i8t
32
34
43
37
',,53
65
57'
54
15
18
13
16
19,
21
151.
18'
4
2
4
3
12'
7 ,
2
7
1-5 SUBURB Total 17 Ot 38 7C 12 .13 18 8
1-5 URBAN Total 37 56t - . 132 26 26 19 16
1-85 Year 1
Year 2
Year 3
Total
43
32
30
35
31
21
20
23
80
63
67
70
66 28
11
16
18
13 25
16
13
18
24
13
17
'69-1 16 16
14 65
1-10 Year 1
Year 2
Year 3
Total
18
21
14
18
Z_L19 55
59
75
63
38
54
71
1 55
11
12
13
1 12
11 5
3
6
5
19 M 4.
17 12
1 12
5
5 18
Notes: 1. Shading indicates cases where higher accident rates were observed for altered segments. Accident rates are given by year and for the total period available. Accident rates are expressed as accidents per 100 million vehicle miles.
t. Possible difference from unaltered segments infen-ed by Wilcoxon Test (Table 28)
LVJ
opposed to the traditional 15-min period used in the Highway Capacity Manual because this research was focused on a specific question, i.e., "Does the lack of shoulders or the use of narrow lanes result in different operating conditions?" The database used can be aggregated into 15-min periods for use in the study of speed-flow relationships in general. Lateral placement, line crossings, and brake applications were obtained for one 5-min period out of each 15 min for a minimum of one site in each corridor.
Traffic volumes presented in this report are presented in pas-
senger cars per hour. Traffic volume data were collected in terms of vehicles per hour and then converted to passenger cars per hour using site- and time-specific truck percentages following the procedures of the Highway Capacity Manual.
Analysis Approach
Analysis was conducted on a site-by-site (disaggregate) basis, on a corridor (aggregate) basis, and by stratifications (groupings)

TABLE 25. Corridor accident rates by severity
Corridor Time Period
PROPERTY DAMAGE ONLY INJURY
Unaltered Altered Unaltered Altered
1-395 Year 1
Year 2
Year 3
Total
43
40
48
43
66
74
21
29
25
25
38
36
34
36t
47
60
1-5SUBURB Total 46 67 - 38 55t
1-5 URBAN Total 119 165 94 123t
1-85 Year 1
Year 2
Year 3
Total
135
95
97
109
100
92
85
88
40
27
29
32
35
so
31
30
I-10 Year 1
Year 2
Year 3
Total
70
79
83
78
58
68
82
70
20
15
24
20
16
18
23
19
Notes: 1. Shading indicates cases where higher accident rates were observed for altered segments.
Accident rates are given by year and for the total period available. Accident rates are expressed as accidents per 100 million vehicle miles.
t. Possible difference from unaltered segments inferred by Wilcoxon Test (Table 28)
TABLE 26. Study site accident rates
Corridor Year Benchmark Site I Site 2 Site 3 Site 4
1-395 1 32 120, 3T' 64.
2 49 126. 59- 60
3 40 80 50 , 63
Total 40 108t 49t 62t
1-5 SUBURBAN Total 65 105t 201t ~85t 47
1-5 URBAN Total 58 91t 176t 544t
1-85 1 248 122 243 144
'299 2 147 106 58
3 173 55 237 128
Total 190 92 260 146
1-10 1 50 _6p, li7'
2 82 61 133.'.
3 94 87 174
Total 76 72 141,
Notes: 1. Accident rates per 100 million vehicle miles 2. Shaded blocks indicate a higher accident rate was recorded at the altered site than at the corridor
benchmark site. Benchmark sites are specific research sites within unaltered segments of the corridor. t. Possible difference from unaltered segments inferred by Wilcoxon Test (Table 28)
45
of sites by physical and operational characteristics. Speed-vol-
ume data were plotted by lane and as per lane averages. A
variety of plots were used, including a standard speed-flow plot,
time-sequenced plots, and two Y-axis plots. Plots were prepared
for each site on a corridor basis, and for stratifications of sites.
The stratifications examined included: lane width, shoulder
width, percentage of trucks, wearing areas, number of lanes, and
alignment. Time-sequenced plots were used to identify stable
portions of the speed-volume curve and then regression analysis
was used to compare "narrow lane" curves with "benchmark"
curves. The findings of this research are presented in the follow-
ing sections primarily through the use of summary plots on a
corridor (aggregate) basis because the research team believes
that these best show the results.
For the purpose of this research, it was hypothesized that
the operational performance of a freeway could be effectively

46
TABLE 27. Study site accident rates by vehicle type
Benchmark Site I Site 2 Site 3 Site 4 Average
CORRIDOR YEAR AUTO TRUCK AUTO TRUCK AUTO TRUCK AUTO TRUCK AUTO TRUCK AUTO TRUCK
1-395 1 34 0 108 350 39- 0 67. 0
0 13 7 2 49 52 59 ~7` 5 7 77
3 42 0
84 0 46 114 60 136 61 91
112 Total 42 18 108 41~. %,41 79 61 94 68 85
1-5SUBURBAN Total 57 169 11 0 37 lq~r "'306: 81 134 49 31 104 122
1-5 URBAN Total 49 172 79 , 240 176,- 1184~ F0 797 260 7
407
1-85 1 201 612 98 674 218 751 121 605 145 677
2 103 562 92 423 238 15S5 142 729 153 04'
102 115 3 139 491 53 117 ;M W5 639, 523
Total 148 584 79 381 2119~ 1065' 121 656 137 697
1-10 1 45 158 52 278 104- 387' 79 334
2 73 286 55 413 Ill 608 84 516
3 97 38 81 208 162 '416 122 312
Total 72 156 63 267 126 472 95 371
Notes: 1. Auto accident rate per 100 million auto miles Truck accident rate per 100 million truck miles Shaded blocks indicate a higher accident rate than Benchmark.
TABLE 28. Wilcoxon ranked results of paired tests (refer to Tables 19 through 26)
1-395; 1-5 SUBURBAN; 1-5 URBAN (5 SAMPLES) 1-85 CI SAM I'LES) 1- 10 (3 SAM I'LES)
VARIABLE WILCOXON CONC'N INFERENCE WILCOXON CONC'N INFERENCE WILCOXON CONC'N INFERENCE PROB. PROB. PROB.
VEHICLETYPE
AUTO 0.043 Reject Poss. Dill*. 0.59 DNR No Diff. 0A I DNR No Dill'.
TRUCK 0.69 DNR No Diff.' 0.29 DNH No Diff. 0.11 DNR No Dill'.
LIGHT CONDITION DAY 0.0-43 Reject Poss. Dilr 0.29 DNR No Dilf. I DNR No Dill'.
NIGHT 0.0113 It'ject Po.'s. DilE 0.11 DNIt No Dill'. 0.11 DNR No Dill'
FWY SECTION
BASIC 0.35 DNR No DilE 0.29 DNR No Dill'. 0A I DNR No Dill'
RAMP 0.04 Reject, Poss. Difl! 0.11 DNR No Diff. 0.29 DNR No Diff.
(No Weave Sections in BM) WEAVE 0.08 DNR No IN If. 0.11 DNR No Diff.
SEVERITY
PDO 0.08 DNI( No Dill*. 0A I DISIR No Din. 0.11 DNR No Dill'.
INJURY 0.04 Reject Poss. Dill'. I DN It No Diff. 0.59 DNl( No Diff.
FATA 1, 0.72 DNII No Diff. 0A I DNR No Diff. 0A I DNI( No Dill'.
COLLISION TYPE
SIDESWIPE 0.04:3 RLJCLt Poss. Dill'. 0A I DN It No Dill'. 0.59 DINIR Nu Dill'.
REAR END 0.08 DNR No Diff. I DIq it No Diff. 0.11 DNII No Diff.
FIXED 013J. 0.07 DNR No Dill'. 0.65 DN It No Diff. I DNR No Diff.
o,riwit 0.89 DNR No Dill'. 0.65 DNR I No Diff. I DNR No Diff.
I SEGMENT 1 0.04:1 Reject Poss. Difl~ 0.29 DNR I No D i IT. 1 0.11 DNR No Diff.
NOTE: DNR = Do Not Reject
represented by the relationship between speed and volume over primary focus of the analysis was on the speed volume a range of LOS from C to E, lateral placement, number of line relationship. crossings, number of lane changes, and brake applications. A The relationship between speed and volume is influenced by limited number of site-specific plots are also presented. The a number of factors including the following:

47
TABLE 29. Site conditions
Freeway Site Shaul er t Sho Mer % Trucks Applil tion Troe x Secti IV 12' < Z 2'- 8' > 8' <2! 2.8' >:8' <5% 5-10% >10% HOV AddLane -Mernmix Wey. 13FS
Rt 128 Kendrick Street, NB x x x P M x x Kendrick Street, SB X X x P AM X x Ponkapoag NB x x x P A x x South Street, NB x x X AP M BM x Washington Sir t. NB x x x WP A X x
1-95 Pohick Road, NB x x x AP M X x 1 Pohick Road. SB X x x PW AM X x
1-395 Edaall Road HOV, SB x X X X P AM BM X King Street, SB x x x x x N. Shirlington Circle, NB X x X x x S. Shirlington Circle, NB X x x M x X S. Shirlington C e, SB X x x x X
1-5 178th Street, NB x X x x AMP BM X 178th Street, SB x x x A x x 216th Street, NB x x x AM x x 216th Street, SB x x x AM x x Albro Place, SB x X x x AP BM x Denny Way, SB x x x P AM x x Military Road, SB x x x P M x x Holgate Street, SB x x X AM x X Yesler Way. NB x x x P M x x
1-90 Island Crist Way, EB x x X A Island Cr. Way, EB-After x X x BM x
I Island Crest Way, WB x x x W x x West Mercer Way, WB x x x
1-85 Chamblee - Tucker, SB x X x A x x N. Druid Hills, SB x x X AFW M x X Shallowford Rd, NB x x x P M x x Shallowford Rd, SB x x x AP x x Wood Parkway. SB x X x x BM x
1-94 East River Road, WB x X X P AM X X Pascal Street, WB
I
x x P A BM X Snelling Avenue, WB x x x M x x U of M Exit, EB x x x P AM x x
1.10 6th Avenue, EB x 6th Avenue, WB x x x P AM x x Crenshaw Blvd., EB x
x
x
x
x
W
AP
Mp x
x x
x Crenshaw Blvd., WB x x x M x x West Boulevard, EB x x x x A NIP BM x
1405 B.Isa Chica Road, SB x x x X X X Cherry NB x X x x A BM X Golden West Street, SB x x x x W M x X Newland Street, NB x x x x AP X
I
x Newland Street, B x x x x M x x
SR 57 Imperial Highway, NB X x X A M X X Imperial Highway, SB x x x W M X x Miraloma Avenue, SB X x x M x X X Yorba Linda Blvd., NB X x x AMP x x
SR 91 Harbor Blvd., WB X x X W M A X X Kraemer Blvd., EB x x x AP BM
I
x Lemon Street, EB x x x M x x Placentia Avenue. WB I X I x X A I - x i
LEGEND: A—AM Peak P—PM Peak M—Mid-Day X—All Day W—Weekend Period BM—Benchmark
Number of mainline traffic lanes Width of mainline traffic lanes Width of right shoulder Width of left shoulder Proximity of obstruction to the right lane Proximity of obstruction to the left lane Proportion of trucks in the traffic flow Proportion of commuters in the traffic flow Horizontal alignment Vertical alignment Nighttime illumination Volume of entering traffic
The relationship between speed and volume can be expressed algebraically as:
Speed (S) =ftvolume, other variables)
In addition to the plots, data were developed for three measures of effectiveness (MOE):
Average of three highest flow rates in each of the LOS speed ranges. This MOE was chosen to address the question, "Is the maximum flow rate reduced as a result of reductions in lane width or shoulder width?"
Average speed within specified volume ranges. This MOE was chosen to address the question, "Does the use of shoulders or a reduction in lane width reduce speeds for a given volume of traffic?"
Highest 15-min flow rate. The purpose of this MOE was to determine if the use of shoulders or a reduction in lane width

48
Not To Scale
R11ore"Ce Moll., 0 0
1W
Refereric. Mark., 0
Camera Setup
Overhead Structure
Figure 31. Typical videotaping setup.
decrease the ability to sustain high flow rates over a period of time.
FINDINGS AND OBSERVATIONS
Speed-Flow Relationship
The analysis of data indicates that the lack of shoulders or narrow lanes has little if any impact on speed at lower volume ranges. At higher volume ranges, there is a slight reduction in average speed in some cases. At maximum volume ranges (LOS E and F), no difference in speed is detectable. There is a notice-able increase in the speed variability at higher volume ranges.
Figure 32 is a chart showing a plot for all benchmarks. It is notable for the fact that data from 10 corridors and 6 different cities with varying physical and operational characteristics fit a relatively "tight" band, matching the curves adopted in the re-vised version of Chapter 3 in the Highway Capacity Manual.
Figures 33 through 44 illustrate speed-volume data by corri-dor. Data have been distinguished by site. For reference, the speed volume curves have been shown for free-flow speeds of 55 and 70 mph used in Chapter 3 of the 1993 revision of the Highway Capacity Manual are shown on each chart, as well as the curve developed from data from all of the 10 benchmark sites as in Figure 32.
In summary, at volume ranges below 1600 pcphpl, speeds recorded at altered sites are essentially identical to speeds at the benchmark sites. At flow rates between 1600 pcphpl and 2000 pcphpl (LOS C and D), speeds at the altered sites are slightly lower in most cases. Speed differences are small, typically less than 5 mph. At higher volume ranges, above 2000 pcphpl (LOS E and F), no significant difference in speed can be determined between altered and benchmark sites. Table 30, which compares
data from specific sites to benchmark sites for the same time period and direction of flow within a corridor, highlights the fact that any differences are small.
The most notable difference is in the speed variability or range of speeds observed at many sites. The range of speeds observed at the altered sites is almost double that of the benchmark sites, with speeds for the benchmark sites ranging between 50 mph and 70 mph up to flow rates approaching 2000 pcphpl while speeds ranged from 30 mph to 70 mph at altered sites. However, it must be noted that, based on regression analysis, even this finding was not statistically significant. Table 31 presents the fesults uf iegfession analysis on a corridor basls. Figures 45 and 46 illustrate regression analysis completed in which lines of best fit were developed on a "segmental" basis using volume ranges.
Individual sites were reviewed using time sequenced plots as illustrated in Figures 47 and 48. In addition, "double" Y-axis plots were developed on a site-by-site basis to review speed and volume relationships. Examples of these are shown in Fi gures 49 and 50. No specific conclusions regarding differences between unaltered (benchmark) and altered sites can be drawn.
Tables 32, 33, 34, and 35 present the MOEs defined in the previous section. Paired comparisons were tested using Student's t-test. For statistical testing only, data from sites that experienced a breakdown in traffic flow during the time period filmed were used to test MOEs I and 3. A summary of the statistical tests is presented in Tables 36 and 37.
For certain time periods, the MOE values reflect only a rela-tively low traffic volume and provide no insight on capacity. The MOE is only applicable to sites that experience a breakdown in traffic flow.
The results of the analysis presented in Tables 36 and 37 support the findings based on the speed-flow curves and regres-sion analysis that any variance in operational characteristics be-tween altered and unaltered sites is speed related.
Lateral Placement, Line Crossings, and Brake Applications
Lateral placement, line crossings (inadvertent lane line cross-ings not lane changes), and brake applications were obtained from the videotapes for altered sites and benchmark sites.
The percent of traffic within a foot of the leftmost lane line was considerably lower at most altered sites as compared to benchmark sites. Figure 51 illustrates lateral placement at an altered site. Figure 52 illustrates lateral placement at the corres-ponding benchmark site. This indicates that lateral clearance does have an impact on lateral placement within a lane because drivers clearly shy away from the barrier. The degree to which this occurs varies by the type of median; however, drivers still tend toward the left of the median lane and the right shoulder lane as opposed to centering themselves as in other travel lanes.
Inadvertent line crossings per hour increased significantly with narrow lane sites when compared with benchmark sites. Table 38 summarizes line crossings and lane changes at several sites. Both of these measures indicate a degree of driver discom-fort. Line crossings in particular are intuitively consistent with poorer safety performance; however, a direct correlation was not possible and would be extremely difficult to accomplish.
Brake applications at all sites were virtually nonexistent with the exception of when the queue from downstream congestion backed up toward a study site.

49
Speed, mph
OU
70
60
50
40
30
20
10
r%
................... ................ Free Flow Speed = 70 mph I
v v 0
........................... ..........
Frie ......................................... ..
0%, ................................................... I ..................
'a I
............................... I .................. ...................
Cli C'i I ................................................... I ........... ......
................... ............................... ..................
1-405 - 1-10 0 SIR 91 A 1-5U 0 1-5S V 1-90 11 1-94 1-~5 0 1-395 A RT 128
0 500 1,000 1,500 2,000 2,500
31000
Volume, pcphpl
Figure 32. Speed-flow data for benchmark sites (5-min sampling periods).
. . . . . . . . . . . . . . . . . . . . . . . . . . . . . . . Free Flow Speed = 70 mph IP
0 ............. WO ...............
JMI S X- Frie T!Ow-8~eiid-=756 riipTi - - - - - - - - - -
.................................. 0 '04 -0- v ............... 0
0 ............................ X'O - X0 ......... 0 ................ x 0 0 OX 00 0 ~0'0
.............................. x ..... Oxx . 0. .~ ...... ........ .........
x x ................... .................................. ~( ............... Q. 01 0 (:~ L l
Xx C'i I ............... ........ x .... x ............ ................... x x
Benchmark E Site 1 Site 2 X Site 4 1 1 1 1 1
0 500 1,000 1,500 2,000 2,500 3,000
Volume, pcphpl
Figure 33. Speed-flow data for 1-405 (5-min sampling periods).
Speed, mph
80
70
60
50
40
30
20
10
e%

...................... *'**** ........ . Free Flow Speed = 70 mph
.........................................
...................
Frie FI&Weid—=755- ri~pfi — — — — — — — — — — ---
.................................... (D.. I - - ------ ' (D,'
...................................... 0 ...... ........ 0 ................
0
0 01 ................. ............. 0.9 ......... 0 ...................
00 0 CLI
0 0 01 0 C\11
................................. ............... C\I.I ...................
.................................................... ............ ...
Benchmark I Site 1 0 Site 2 A Site 3 0 Site 4
Speed, mph
OU
70
60
50
40
30
20
10
n
Speed, mph
Ov
70
60
50
40
30
20
10
n
..................................... Free Flow Speed = 70 mph
................................................. . .. 0. 0
Fr6e Pl6;4—SFeid—=-59' riipfi — — — — — — — — — — — — — — — 4, .............................................. ...............
or
.................................................. —I ...................
0.1 U .................................................. CLI ...................
0 0 1 CM I C4
.................................................... .................
.................................................... ..... ... .......
Benchmark 8 Site 1 0 Site 2 A Site 3
0 500 1,000 1,500 2,000 2,500
Volume, pcphpl
Figure 34. Speed-flow data for SR 91 (5-min sampling periods).
50
0 500 1,000 1,500 2,000 2,500
3,000
Volume, pcphpl
Figure35. Speed-flow data for I-10 (5-min sampling periods).

Speed, mph
80
70
60
50
40
30
20
10
0
.................................... Free Flow Speed = 70 mph
............................
1PH, Friie'Fl&w-8;~eid-=756 dipTi - - - - - - - .............................................. ...................
.................................................... ...................
-1
.................................................. ........ * .......... 0 C) I CI!j CM
.................................................... ...................
.................................................. . ... ... ......
Site 1 0 Site 2 A Site 3 0 Site 4
0 500 1,000 1,500 2,000
2,500 3,000
Volume, pcphpl
Figure36 Speed-flow data for SR 57 (5-min sampling periods).
Free Flow Speed = 70 mph or
jr IF I A*6111111111.1 ~--- ........... I ....... .......... . 1. ..................
Fri-e-Pi6W'S-pCed---:-5-5 m-p`h - - - - - - - - - - - - - - - - - ................................ ................
............................. 0- 0 ................
% 0 ...................
0 0 ...................................... -0
CL
...... ...........
0
0<0 ............................ ....... I ........
CY 0i
........... ......
.................................................... ...................
Benchmark I Site 1 0 Site 2 A Site 3
0 500 1,000 1,500 2,000 2,500
Volume, pcphpl
Figure3Z Speed-flow data for 1-5 urban (5-min sampling periods).
51
Speed, mph
Ou
70
60
50
40
30
20
10
0

80
70
60
50
40
30
20
10
f%
Speed, mph
80
70 Free Flow Speed = 70 mph 0
.....................................
........................ .......... 60
0 FrieRdWls~eicF=756 riipTi — — — — — — — —
....................... 0 ........... . ,AAA ..... a .......... 50 A IA A I
..................................... A ..........
I
40 "i~ 'I ...................
A A
............... I .................................. 30
C'i .................................................... ...... ............ 20
....................................................................... 10
Benchmark 0 Site 1 0 Site 2 A Site 3 0 Site 4 n
0 500 1,000 1,500 2,000 2,500
3,000
Volume, pcphpl
Figure 38. Speed-flow data for 1-5 suburban (5-min sampling periods).
Speed, mph
...................................... Free Flow Speed = 70 mph
0. .....................
Ite -"~N ....... Fr6e Fl6-w--SFeidF-=--59 riipfi — — — — — — — — — —
0 WR
0 M
q~ M~ 00 0
................................................. .. ......
A (D
........... Q. ................. ...................... al* ..... * .... * ....... 01 0 C~11 CIJ I ................................... .........................
.......... ........... ............................. ...................
............................................ ...................
Benchmark 0 Site 2 A Site 3 0 Site 4 1 1 1 1 1
0 500 1,000 1,500 2,000 2,500
Volume, pcphpl
Figure 39. Speed-flow data for Rt 128 (5-min sampling periods).
52

53
Speed, mph
80
70
60
50
40
30
20
10
0
............ ......................... Free Flow Speed = 70 mph
-,&&A-A A
...................
i. v—'LM .. ............. - — — — — — — — — -
— 40 ,Free flow Speed ~- 55 mph ........................
0 ............................................... . ..................
0 0
C190 0 ................................................ Av (& ................
C) (\I A& 01.
A C%i .................................................... .............
.................................................... .............
Benchmark I Site 1 0 Site 2 A Site 3 0 Site 4
0 500 1,000 1,500 2,000
2,500 3,000
Volume, pcphpl
Figure 40. Speed-flow data for 1-395 (5-min sampling periods).
......................................
Free Flow Speed = 70 mph
............... ......... I ................ ..
............ - — — — — — — — — — — — —
I .......................................... .......
.................................................... I ................... I
CL
0 ................................................... X ~ ................... 0 01 CV I C4
.......................... I ......................... I ...................
................................... ................ . .................
Site 1 0 Site 2
0 500 1,000 1,500 2,000 2,500 3,000
Volume, pcphpl
Figure 41. Speed-flow data for 1-95 (5-min sampling periods).
Speed, mph
ou
70
60
50
40
30
20
10
n

54
Speed, mph
80
70 Free Flow Speed = 70 mph . . . . . . . . . . . . . . . . . . . . . . . . . . . . . . . . . . .
60
50
..............
.................... .............. .... .......... .... * ........
Fr(Te"Pl6w Speed = 55 mph' ------------- - jo - -----
..... 0
...............
0
................................ 0 — 1 ................... 40 -a~
................... .................................................. KXI 30
0
Cli .................................................... I ...................
20
................ ......... — ......
...... ... 10
Benchmark " Site 1 0 Site 2 A Site 3
n
0 500 1,000 1,500 2,000 2,500
3,000
Volume, pcphpl
Figure 42. Speed-flow data for 1-90 (5-min sampling periods).
Speed, mph
80
70
60
50
Fr6e-Fl5W-S7peFed--~5'5 Fn
Free Flow Speed =~- 70 mph
.............................. 0 ...........
...................
.................
. .
. . . . . . . . . . . . . . . . . . . . . . . . . . . .
(D % .......
ONO
.................................................... .......... 40
.................................................. .......... 30
CY
.................................................... ................... 20
.................. I ................................. ............. 10
N Benchmark I Site 1 0 Site 2 A Site 3 0 Site 4
n
0 500 1,000 1,500 2,000 2,500
3,000
Volume, pcphpl
Figure 43. Speed-flow data for 1-85 (5-min sampling periods).

55
Speed, mph
80
............................ Free Flow Speed = 70 mph
A
....................... 4 ......
— A— Fri'e'F0viS7p6-ed--:-5-5 m—ph — — —
............................... 0 ...........
so
1~ 0 .1 ............................................... 0 -- 1 ............... ...
'al 0
............................................ 0 Q I ................... Cr. 0 01 cli C'i
.................................................... ...................
.......................................................................
Benchmark 0 Site 1 0 Site 2 A Site 3
500 1,000 1,500 2,000 2,500 3,000
Volume, pcphpl
Figure 44. Speed-flow data for 1-94 (5-min sampling periods).
TABLE 30. Comparison of mean speeds between individual sites
Corridor Compare # of Data Points
PCPHPL BM
PCPHPL Site
Mean Speed BM
Mean Speed Site Note
1-405 BM NB/Sl 9 2145 2163 54.2 66.5
I-10 BM EB/Sl 7 2172 2154 48.3 48.5 PM ONLY
I-5S BM NB/S4 6 1901 1897 61.1 57.6 >1600
I-5S BM NB/S4 9 1471 1460 61.6 62.1 <1600
1-94 BM WB/S3 3 1721 1708 58.9 60.0 >1600
1-94 BM WB/S3 6 1251 1238 63.7 62.1 <1600
1-85 BM SB/S4 3 2161 2172 56.8 60.1 >1600
1 1-85 BM SB/S4 8 1285 1286 61.5 61.5 <1600
11-90 1 BM EB/S2 1 7 1 1076 1 1080 1 64.9 156.9
Further analysis of these measures was not pursued as the shoulder pavement surface is different from the travel lane
data were not sufficient to establish a practical correlation. surface.
Distribution of Traffic Part-Time Use of Shoulders
70
60
50
40
30
20
10
0 L
0
The distribution of traffic among available traffic lanes was
examined at altered sites. With the exception of Route 128 in Massachusetts, no significant difference in distribution was
found during heavier traffic flows above 1600 pcphpl. In the
case of Route 128, the shoulder has had limited improvements
made to accominodate traffic. During periods of lighter traffic,
there is a tendency to use the other lanes particularly if the
On Route 128, the use of the shoulder is permitted only during
the peak period. Field observations and traffic count data indicate
that if traffic remains slow, many drivers will ignore the restric-
tions and use the shoulder anyway. This has been the experience
on facilities in California and Virginia. To date, the ability to
recapture the shoulder as a refuge area has been limited. Virginia

56
TABLE 31. Summary of regression analysis
Corridor #Points Minimum Maximum Average Median Std. Dev Co R 2
Data points >50 mph 1-95 34 51.97 62.8 57.1 57.1 2.34 0.294 0.086
All Data Points 1-95 69 41.4 62.8 51.5 50.3 5.98 0.318 0.101
Data points >50 mph 1-395 86 54.1 66.9 60.8 61.7 3.08 0.439 0.193
All Data Points 1-395 94 21.9 66.9 1 58.1 61.55 9.63 1 0.588 0.346
All Data Points 1-5s 159 34.4 67.6 58.0 60.9 6.46 0.339 0.115
All Data Points I-5N ill 14.8 65.9 41.8 45.2 13.80 0.578 0.334
Data points >50 mph 1-90 130 51.0 66.6 59.74 59.65 3.26 0.421 0.177
All Data Points 1-90 142 33.5 66.6 57.9 59.3 6.78 0.352 0.124
All Data Points 1-85 180 46.7 67.9 60.3 60. 3.61 1 0.243 0.059
Data points >50 mph 1-94 61 50.1 65.8 59.4 61.2 4.30 0.517 0.267
All Data Points 1-94 89 28.4 65.8 54.9 55.5 8.09 0.493 0.243
Data points >50 mph 1-10 84 50.0 64.06 55.6 55.71 3.13 3 3 0.023 1 0.00053
All Data Points 1-10 156 16.6 64.1 47.7 50.9 10.8 8 0.488 0.238
Data points >50 mph 1-405 70 50.5 70.4 65.1 65.2
10
3.64 0.234 0.055
All Data Points 1-405 116 6.2 70.4 51.3 62.8
3 - 64
19.3 0.260 0.07
Data points >50 mph SR 57 136 50.70 65.7 61.5 62.2 2.64
fl
0.302 0.191
All Data Points SR 57 138 34.4 65.7 61.2 62.2 3.75 0.314 0.098_
Data points >50 mph SR 91 85 51.1 66.8 60.6 61 3.50 0.018 0.000038
All Data Points SR 91 122 1 25.6 1 66.8 54.0 59.4 11.1 0.346 0.119
All Data Points Benchmark 424 1 43.1 1 67.9 59.0 59.9 5.59 1 0.688 0.473
Speed, mph
80 f
70
60
50
40
30
20
10
0
0 Soo 1,000 1,500 2.000 2,500 3,000
Volume, pcphpl
Figure 45. Zoned regression for 1-5 suburban.

57
Speed, mph
80 [
................ ..... * * ...... ....... .. * .............. ** ....... 0 SM Zone 1 SM Zone 2 X BM Zone 3 BM Zone 4 Regr-BM
X Zone 1 Zone 2 Zone 3 Zone 4 Regr-Sites
0 Soo 1,000 1,500 2,000 2,500 3,000
Volume, pcphpI
Figure 46. Zoned regression for 1-94.
Speed, mph 70
60
50
40
30
20
10
A
0 Soo 1000 1500 2000 2500 Volume. pcphpl
Figure 4Z Time sequenceflow, 1-395 NB at Shirlington Circle.
has recently implemented part-time use of shoulders on 1-66 becomes more difficult and expensive, little documentation ex- with the use of lane controls signals and extensive signing. ists in the published literature or is available from the agencies.
The following are usually cited as the major factors contributing
Maintenance Activities to the increased costs:
Although it is generally accepted that maintenance activities Many highway appurtenances such as signs, guardrails or on freeways with one or both shoulders used as travel lanes barriers, drains, landscaped runoff areas, and luminaries are
70
60
so
40
30
20
10
0

58
70
60
so
40
30
20
10
n
Speed, mph
0 Soo 1000. 1500 2000 2500 Volume, pcphpi
Figure 48. Time sequence flow, SR 57 SB at Imperial Highway.
Volume, vphpl Speed, mph
3,000 F- 60
.............. K'- so 2,500, ... ......... .....................
... .... ..... 4 2,000 . ........................................ ..... ......
..........
30
0
1,500 ............................... .
1,000 ~ ................................. ............................. —J 20
Soo .......... . .......... 10
-&Volume-Average -K- Speed-Average
0 1 f I 1 1 . - I : 1 1 0
4:15 4:30 4:45 5:00 5:11S S:30 S:45
Time
Figure 49. Speed-flow vs. time for 1-5 SB at 216th Street.
closer to moving traffic and can be damaged mor~ often and * Additional personnel and equipment are required to close
more severely. lanes and provide work area protection.
e Maintenance activities must be scheduled for the time peri- 9 Most incidents, from minor to major accidents, require
ods when traffic volumes are reduced. Lane closures are required some action by mainte
'
nance personnel. Spilled items are often
more often. This results in less daily production. moved out of travel lanes and stored on shoulders until traffic

Percentage
100%
80%
60%
40%
20%
0%
Percentage
100%
80%
60%
40%
20%
59
Volume, vphpi
Speed, mph
3,000,
2,500 j'60
.. ..... ....... . ............ so
2,000
........ .. .............. ........ ** ........ — 40
1,500
...... . ....................................................... — 3C
1,000 ..... .......................................................... — 2C
Soo ..... . ....................................................... — Ic
,trVolume-Average -K- Speed-Average
0
I . . I I - ; I I . ~ I - ----7—; 0 7:46 8:00 8:15 8:30 8:45 9:00 9:15
Time
Figure 50. Speed-flow vs. time for 1-405 NB at Newland Street.
Distance from left lane edge.
111110-1 - 01-2- (11112-3- 03-4- 0>4'
Figure5l. Median lane lateral placement for I-10 EB at
Crenshaw Boulevard.
Distance from left lane edge.
00-1- [11-2- 02-3- 03-4- [1>4'
Figure52. Median lane lateral placement for I-10 EB at
West Boulevard.
Emergency Response and Enforcement
clears and equipment and personnel arrive to remove items. If
there are no shoulders, the lanes involved must stay closed until Emergency response is a major factor that must be considered.
all items are removed. Estimates by involved personnel indicate Most incidents, no matter how minor, result in lengthy queues
that clearance time for many incidents, particularly minor ones, on congested urban freeways. Often emergency vehicles must
doubles. use shoulders to reach the scene of the incident. Elimination of
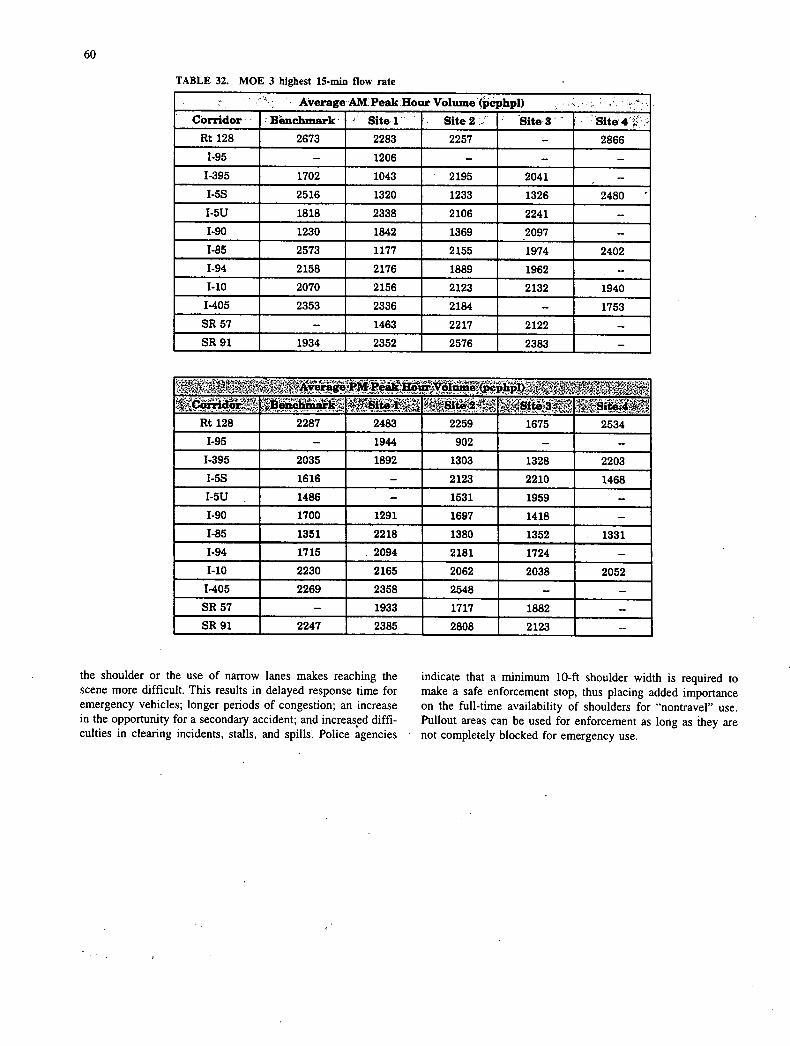
60
TABLE 32. MOE 3 highest 15-min flow rate
Average, AM. Peak Rour Vblume'(~~Phpu
Cbrridor Mnchma Site I' Site!%.; 'Site S' 'SiW4;~'.'
Rt 128 2673 2283 2257 2866
1-95 — 1206 — — —
1-395 1702 1043 2195 2041 —
1-5S 2516 1320 1233 1326 2480
I-5U 1818 2338 2106 2241
1-90 1230 1842 1369 2097 —
1-85 2573 1177 2155 1974 2402
1-94 2158 2176 1889 1962 — I 1-10 2070 2156 2123 2132 1940 1-405 2353 2336 2184 —
SR 57 — 1463 2217 2122 SR 91 1934 2352 2576 2383
Rt 128 2287 2483 2259 1675 2534
1-95 — 1944 902 — —
1-395 2035 1892 1303 1328 2203 1 I-5S 1616 — 2123 2210 1468
1_5U 1486 — 1531 1959 —
1-90 1700 1291 1697 1418 —
1-85 1351 2218 1380* 1352 1331 1-94 1715 2094 2181 1724 —
1-10 2230 2165 2062 2038 2052 1-405 2269 2358 2548 — —
SR 57 — 1933 1717 1882 SR 91 2247 2385 2808 1 2123
the shoulder or the use of narrow lanes makes reaching the indicate that a minimum 10-ft shoulder width is required to scene more difficult. This results in delayed response time for make a safe enforcement stop, thus placing added importance emergency vehicles; longer periods of congestion; an increase on the full-time availability of shoulders for "nontravel" use. in the opportunity for a secondary accident; and increased diffi- Pullout areas can be used for enforcement as long as they are culties in clearing incidents, stalls, and spills'. Police ~gencies - not completely blocked for emergency use.

TABLE 33. MOE 1 and 2 level of service C
Average AM Peak Hour Volume (pcphpl)
Benchmark site I Site 2 site 3 Site 4
C..id.r MOE 1]: MOE 2 MOE I MOE 2 MOE I MOE 2 MOE I MOE 2 MOE I MOE 2
Rt 128
1-95 - 1179
1-395 62 1045 - - - - 63 - -
I-5s 2454 62 1311 54 - 62 - 62 2303 58
I-5U 65 2023 61 - - - 50
1-90 - 66 - 67 1325 58 2063 59 - -
1-85 - - - - - -- -- 2297 64
1-94 - - 1661 - - - - 61 - -
1-10 1927 - 2230 - 27 2220 - 1655 53
1405 2219 - - - 39 - 1656 28
~R5 7 - - S. ~l - 65 , 2340 3 - 20i~ - -
Average PM Peak Hour Volume (pcpbpl)
Benchmark site I site 2 site 3 Site 4
Corridor MOE 1TMOE 2 MOE 1 MOE 2 MOE 1 MOE 2 MOE I MOE 2 MOE I MOE 2
Rt 128 - - 62 61
1-95 1768 69 - - --
1-395 2037 60 -- - - 62 63 -
1-5s 61 - 2055 - 1958 42 64
I-51J - 64 -- - 23 1366 46 --
-1-90 - 63 62 1528 1 47 - 64
1-85 - - 62 - -
1-94 1725 58 - 2001 - - 62
I-10 -- -- - 2074 - - - 2060
1405 2229
R ~57 -- 1906 58 - 60 64
R
91 - 2482 64 60
MOE I is the average of the three highest flow rates (average lane volume per hour across all lanes) in each LOS speed range. MOE 2 is the average speed within the LOS volume =ge.
TABLE 34. MOE I and 2 level of service D
Average AM Peak Hour Volume (pcphpl)
Corridor
Heacbmark site I Sit. 2 Site 3 Site 4
MOE 1 MOE 2 MOE I MOE 2 MOE I MOE 2 MOE I MOIE2 MOEI MOE2
Rt 128 2715 53 - - - - 29
1-95 - - 1052 - - - -
1-395 - -- - 52 --
1-5s 2546 59 1361 - - 61
1-5U - 66 - 61 2196 49
1-90 - - 59 - 59 -
1-85 2317 60 - 2074 64
1-94 - 59 2176 61
1-10 2081 55 2087 35 - 38 2110 - 1970 50
,~I-405 ~2318 - 2342 68 1970 42 - - 1633 28
- - - - 1971 56 - 61
SR 91 - 64 2509 49 -- 60 - 1 61
Average PM Peak Hour Volume (pcpbpl)
Corridor
Renchutark site I Site 2 site 3 Site 4
MOE I MOE 2 MOE I MOE 2 MOEI MOE2 MOE I MOE 2 MOE I MOE 2
Rt 128 61 0
1-95 - -- 1951 51 902
1-395 2065 59 - - - 2116 34
I-5S - - - - 1964 58 2251 47 -- --
1-51J - 1959 45
1-90 - 63 - - 1676 44 - -
1-85 - 2254 64 -- - --
1-94 1724 56 - - 2166 46 63
1-10 2241 49 2207 49 58 2094 56
1-405 2192 57 -- 68
- - 57 62 rA
SR 91 2097 49 - 35 62 61
MOE I is the average ofthe three highest flow rates (average lane volume per hour across all lanes) in each LOS speed range. MOE 2 is the average
speed within the LOS volume range.
61

TABLE 35. MOE 1 and 2 level of service E
Average AM Peak Hour Volume (pephpl) Ben site I Si 2 site 3 Site 4
Corridor MOE I MOE 2. MOE I MOE 2 MOE I MOE 2 MOE I MOE 2' MOE I MOE 2 Rt 128 — 53 2897 30 1-95 — —
1-395 — — 1974 28 — —
1-5s — 61 — -- — 60 1-5u — — 63 — — --
1-90 — — — 68 — — 1-85 — 56 — — 56 1-94 — 56 2287 — — —
1-10 — 66 2103 40 2125 45 56 1780 47 1-405 103 57 0 66 2277 38 — 1740 — SR 57 -- — -- — 2015 60 62 SR 91 -- CA 2218 47 — 1--7 62
Average PM Peak Hour Volume (pcphpi)
Ben k' site I Site 2 site 3 Site 4
'Corridor MOEI M092 MOE 1 MOE 2 MOE I MOE 2 MOE I MOE 2 MOE I MOE 2 Rt 128 — — 63 1-95 1772 902 —
1-395 56 -- — — 41 1-5s — — 61 2098 46 1-5U 1471 --
1-90 — 1718
1-85 63 —
1-94 -- 2080 47 1-10 2186 46 2185 48 — 59 — — 53 1405 -- 54 — 69 — 64 — — -- SR 57 -- -- -- --
1---~R 91 1 2059 56 2373 29 62
MOE 1 is the average of the three highest flow rates (average lane volume per hour across all lanes) in each LOS speed range. MOE 2 is the average speed within the LOS volume range.
TABLE 36. Summary of paired t-tests' on operational data measures
LOS
MOE V MOE 2 3
Number of Pairs Prob "t" Infers
Number of Pairs Prob "t" Infers
C 7 0.373 DNR5 21 0.007 Reject
D 11 0.226 DNR 21 0.10 Reject
E 4 0.918 DNR 16 0.305
F 0 - 10 0.728
FL: There is no difference between the benchmark and the altered sites measure (2-Tailed Test) MOE 1 is the average of the three highest flow rateS4 in each LOS speed range MOE 2 is the average speed within the LOS volume range Flow rate is calculated as the average lane volume per hour across all lanes Do not reject 1-4
62
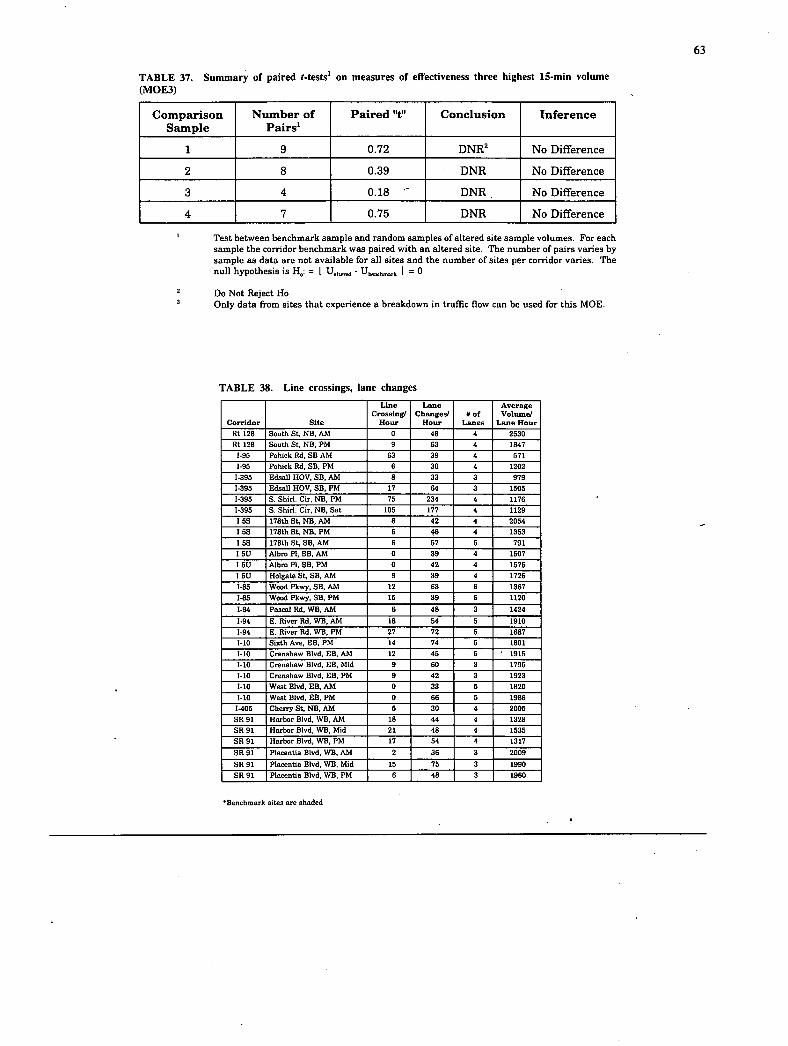
TABLE 37. Summary of paired t-testsi on measures of effectiveness three highest 15-min volume (MOE3)
Comparison Sample
Number of Pairs'
Paired V' Conclusion Inference
1 9 0.72 DNR 2 No Difference
2 8 0.39 DNR No Difference
3 4 0. 18 DNR. No Difference
4 7 0.75 DNR No Difference
Test between benchmark sample and random samples ofaltered site sample volumes. For each sample the corridor benchmark was paired with an altered site. The number of pairs varies by sample as data are not available for all sites and the number of sites per corridor varies. The null hypothesis is H.: = I U.Ird - Ub..h..k I = 0
Do Not Reject Ho Only data from sites that experience a breakdown in traffic flow can be used for this MOE.
TABLE 38. Line crossings, lane changes
Corridor Site
Line crossing/ Hour
1,ane changes/ Hour
# of Lanes
Average Volurnet
Lane Hour Rt 128 South St, NB, AM 0 48 4 2530 Rt 128 South St, NB, PM 9 63 4 1847 1-95 Pohick Rd, SB AM 63 39 4 571 1.95 Pohick Rd, SB, PM 6 30 4 1202
1-395 Edsall HOV, SB, AM 8 33 3 979 1~395 Edsall HOV, SB, PM 17 64 3 1505 1-395 S. Shirl. Cir, NB, PM 75 234 4 1176 1-395 S. Shirl. Cir, NB, Sat 105 177 4 1129 iss 178th St, NB, AM 8 42 4 2054 15S 178th St, NB, PM 5 46 4 1353 15S 178th St, SB, AM 6 57 5 791 15U Alb. P1, SB, AM 0 39 4 1507 16U Albro Pl, SB, PM 0 42 4 1575 1 15U Holgate St, SB, AM 9 39 4 1726
1-85 Wood Pkwy, SB, AM 12 63 6 1367 1-85 Wood Pkwy, SB, PM 15 39 6 1120
1-94 Pascal Rd, WB, AM 6 48 3 1424
1-94 E. River Rd, WB, AM 18 54 5 1910 1-94 E. River Rd, WB, PM 27 72 5 1687 1-10 Sixth Ave, Ell, PM 14 74 5 1801 I-10 Cmnshaw Blvd, EB, AM 12 45 5 1915 1-10 Cmnshaw Blvd, EB, Mid 9 60 3 1795 1-10 Crenshaiv Blvd, EB, PM 9 42 3 1923 1-10 West Blvd, EB, AM 0 33 5 1820 1-10 West Blvd, EB, PM 0 66 5 1986 1-405 Cherry St, NB, AM 5 30 4 2005 SR 91 Harbor Blvd, WB, AM 18 44 4 1328 SR 91 Harbor Blvd, WB, Mid 21 48 1 4 1 1535 SR 91 Harbor Blvd, WB, PM 17 54 4
Sit 91 Placentia Blvd, WB, AM 2 36 3 2009
J.,
Sit 91 Placentia Blvd, WB, Mid 15 75 3
g1317
1990 SR 91 Placentia Blvd, WB, PM 6 48 3 1960
-Benchmark sites am shaded
63

64
CHAPTER 4
INTERPRETATION, APPRAISAL, AND APPLICATION
The findings presented in Chapter 3 illustrate characteristics of the traffic safety and operational performance of freeway corridors that have used shoulders with or without narrow lanes to increase capacity. This chapter relates these findings to ex-isting standards and theories, recommends an evaluation meth-odology, and presents design guidelines for the application and implementation of projects involving the use of shoulders and narrow lanes.
SPEED-FLOW RELATIONSHIP
The relationship between speed and flow on freeways has been the subject of investigation and debate for many years. Traditional interpretations have been based in large part on the work of Greenshields in the 1930s, based on speed-flow relation-ships on two-lane roads, which assumed a parabolic shape. Recent research has come increasingly to question this interpretation.
This research has been focused on potential differences in the speed-flow relationships between freeway segments with full shoulders and standard 12-ft lanes versus freeway sections with-out shoulders and narrower lanes; however, in order to make these comparisons, assumptions regarding the speed-flow rela-tionship were made. The relationship presented by Hall et al. appeared to characterize the data that were collected in the field. This relationship is presented in Figure 53. The curve is broken into three segments. Segment I commences with low-flow and free-flow speed and remains constant until roughly 75 percent of capacity is reached, at which point speeds start to fall off sharply reaching a level of roughly 80 percent of the free-flow speed at a maximum volume. Segment 2 is a vertical band representing a constant volume across a range of speeds. Seg-ment 3 reflects the behavior of vehicles as they move through the queue itself.
The data plots in Chapter 3 show that this research focused on Segment I conditions (LOSs C, D, and E). The plots also show some data in the Segment 2 and Segment 3 realms. An inspection of these plots generally indicates that flow and capac-ity may not be significantly affected by the use of shoulders and narrow lanes; however, it does appear that speeds (for a given volume level) may be slightly lower for altered segments com-pared with benchmark sites.
The traditional approach (embodied in the 1985 Highway Ca-pacity Manual (HCM)] for analysis of the effects of lane width and lateral clearance on freeway LOS used factors that reduced the capacity threshold. More recent research, which led, in 1992, to a new HCM Chapter 7 (Multilane Highways), uses factors
that reduce the speed for a given volume to reflect the impacts of reduced lane and shoulder widths.
The findings of this research tend to support this latter theory; that is, speed is marginally reduced and flow is maintained. The recently revised HCM Chapter 3 (Basic Freeway Sections) uses the curves presented in Figure 54. This research suggests that free-flow speeds of different facilities may be similar at very low flow rates and then diverge as flow rates increase. In practi-cal terms, this is somewhat of an academic question because in practice there is little concern with freeway operations at these flow levels other than the enforcement of speed limits consistent with design standards. More importantly, this research indicates that a more accurate approach to analyzing projected conditions would be to make adjustments, for restricted lane width and reduced lateral clearance, to speed (as in Chapter 7 of the HC* rather than to flow. Although this research project indicates adjustments to the free-flow speed would better reflect condi-tions than adjustments applied to capacity, the database does not yield conclusive numerical factors. Further research to develop adjustment factors will be required and is recommended. How-ever, in the interim, it is recommended that consideration be given to applying speed adjustments (as in HCM Chapter 7), rather than or in addition to flow adjustments (as in HCM Chap-ter 3) to account for reduced lane or shoulder width on freeways.
0 W Ui a. U)
FLOW
Figure 53. Conceptual speed-flow curve (14).

70 MPH FREE F.OW SPEED 13 PCPAPI
65 MPH 10S A 13 C 1450 PCPhPI
60 MPH 16)0 pcphpi
55 MPH 56 MPH
53MPH
F U a.
0-
CC'\Jl NOTE: CAPACITY OCCURS AT DIFFERENT DENSITIES FOR DIFFERENT FREE-FLOW SPEEDS:
FREE-FLOW DENSITY SPEED AT CAPACITY (MPH) (PC/MVLN)
70 36.7 39.3
60 441.5 55 4 .0
65
75
70
65
U) CC 60
55 Cr UJI 0 so Z UJI 55 45 (D
a < 40
LL 0 35
a LU 30 UJI 0- (n 25
UJI (D 20
CC: U, 15
< 10
200 400 600 800 1000 1200 1400 1600 1800 2000 2200 2400
HOURLY FLOW RATE (PCPHPL)
Figure 54. 1994 Highway Capaciiy Manual speed-flow curve.
APPLICATION TYPE
This research has found that when an additional lane is achieved through simply using the shoulder or narrower lanes over an extended distance, the safety performance of the corridor can be negatively impacted. On the other hand, more selective applications of these strategies throughout a corridor—to ad-dress lane balance, lane continuity, and bottlenecks —have been much more successful with no significant change in accident rates. In addition, a difference in lane width (12 to 11 ft) by itself has had no significant impact.
Based on these findings and the experience and observation of the research team, it is hypothesized that the accident rate is related to the quality of the traffic flow. The variability of speeds and the turbulence are indicators of the quality of the traffic flow. Accidents have typically occurred near entry or exit ramps and are more frequent in congested conditions with stop-and-go traffic. Chapter 6 of ' the HCM has presented analysis procedures that involve segmenting by freeway section and then assigning a LOS to that section as illustrated in Figure 55. This can be viewed as a supply-demand curve and expressed as a ratio of volume to capacity (Figure 56). At higher flow rates and LOS C through E, turbulence may be experienced when there is a change in the volume-to-capacity ratio. This change may be due to a high-volume entrance ramp, a high-volume exit, a weaving area, or a lane drop. A typical application in the 1-10 corridor is illustrated in Figure 57 where successive on ramps at Western Avenue had created a bottleneck condition. An additional lane was created by using the left shoulder and narrow lanes. This approach has resulted in better opportunities for entering traffic to merge into the mainline traffic stream.
Findings from this research on altered [11-ft lanes, use of shoulder(s) for moving traffic] versus unaltered freeway sections can be summarized as follows:
* Capacity (maximum flow per lane) values (pcphpl) in ex-cess of 2000, and even 2200 were observed at both altered and unaltered sites.
* There is a greater tendency for altered sites to fall into lower-speed LOS F conditions (20 to 40 mph) at high volumes than for unaltered sites to do so.
@ Both altered and unaltered sites exhibit "flat" speed-flow relationships typically in the 55 to 65 mph range across the entire range of observed volumes (exceptions being at LOS F conditions).
9 For a given per lane'flow rate, the range of observed speeds along an unaltered section will be somewhat greater than along a comparable altered section.
e Accident rates for altered sites tend to be somewhat higher than rates for unaltered sites; however, if strategies are carefully applied in concert with lane balance and lane continuity con-cepts, rates for altered sections may be lower than for unaltered.
* Truck accident rates are almost always higher on altered sections, compared-with unaltered.
e Changes in accident rates, unaltered to altered, for daytime conditions are similar to changes for nighttime conditions.
EVALUATION METHODOLOGY
The findings of this research project have confirmed previous findings that, under specific conditions, shoulders and narrow lanes can be used to improve freeway operating performance. However, the findings also provide evidence that there can be negative impacts, particularly in terms of safety. The findings suggest that the resulting performance is dependent on the ap-proach used in implementing such strategies.
These findings underscore the need for careful evaluation of all such projects before proceeding. The steps contained in the

66
SEGMENTS
LEVEL OF qpRvl(,F:
A
B
C
D
E
—F
0' 1 250 ra 2500'[---1 1 f-5W
X"~ 500'. f-509
Source: 1985 Highway Capacity Manual Figure 55. Graphic representation of overall level of service.
SEGMENTS
VOLUME OVER f'APAf'1TV
—100
95
.90
—.85
.80
—.75
.70
1 2500 2500
r~W 500, f-509
Figure 56 Graphic representation of volume over capacity.

67
LA BREA AVE. CRENSKAW BL ARLINGTON AVE. WESTERN AVE.
2746 law 3295' . 1290'
1 0 1
1 1 1
l000,
STANDARD ALTERED STANDARD
Legend
Shoulder -Travel Lanes (D - Number Lane NOT TO SCALE
14"R, Figure 57. Westbound 1-10 lane balance and continuity.
Evaluate Existing Develop
Conditions H Costs
Potential Devel P Devel?p EENspRecommend DES Identify
Develop PH crR ative Improverneill Alternative Project IVICEOS M Designs e-ign .,s,. n identified FH H PH PH Details Alternative
Identify Assess Ukely
operational
Fut
erformanci c.ndlutl'oens
4 Figure 58. Recommended approach to evaluating proposed project applications.
TABLE 39. Key factors for existing conditions evaluation
Existing Geometrics Existing Operational Characteristics
Pavement, lane, and shoulder widths Average daily traffic Median type Hourly volumes and peaking characteristics Horizontal sight distance Percent trucks/heavy vehicles Vertical alignment Level of service Interchange spacing Speed profile Mergeldiverge conditions Location of recurring congestion Lateral clearances * mainline Edge treatment 9 ramp and crossroad Median width Lane balance / lane continuity Lateral clearance at structures Ramp metering HOV treatment Speed limit Volume to capacity ratio HOV operations
Nighttime illumination
flow chart presented in Figure 58 are recommended. In many respects the approach simply recommends using sound engi-neering principles and practices that should be applied to all highway projects.
Evaluate Existing Conditions
A.thorough inventory of both physical and operational condi.-tions should be undertaken. Table 39 lists key factors to be
considered. The number and width of lanes along with the width of shoulders should be documented for the segment of the corri-dor under consideration. Potential sites for emergency turnouts should be identified. Horizontal and vertical sight distances should be carefully checked. As illustrated in Figure 59, the recommended sight distance may be difficult to maintain de-pending on the type of median or shoulder used. With limited refuge area for disabled vehicles, sight distance is critical.
A review of existing traffic operations in most cases should include extensive data collection. In many cases, however, avail-
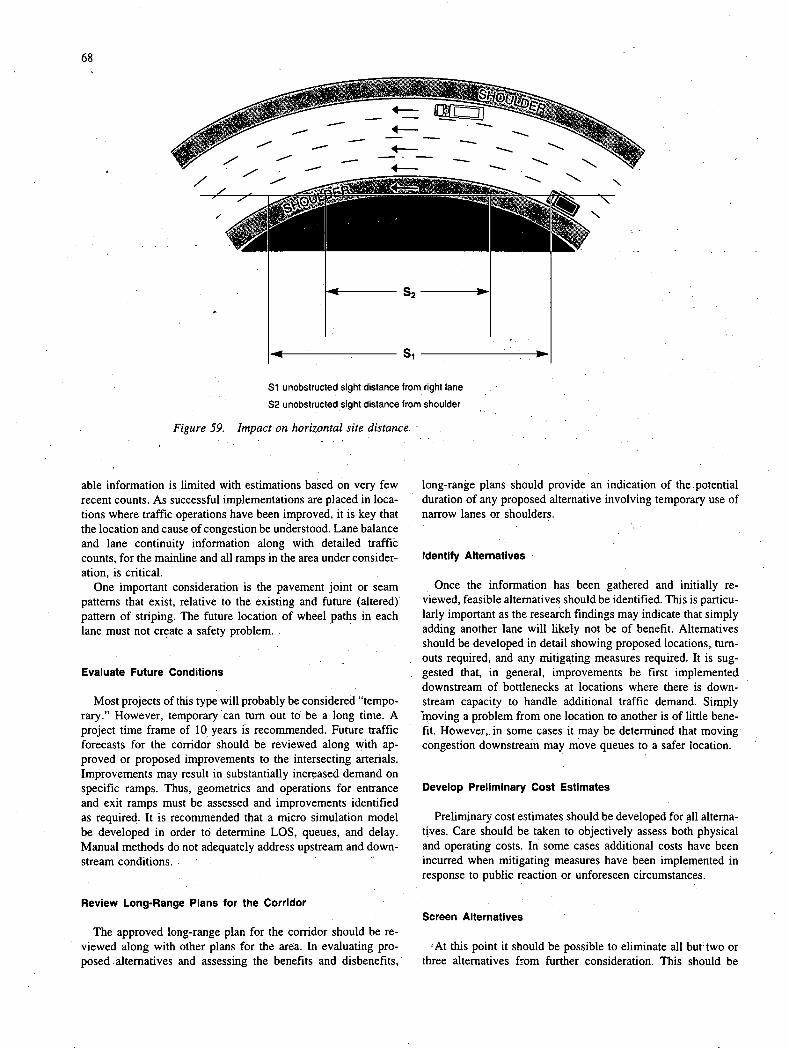
PA
S 1 unobstructed sight distance from right lane
S2 unobstructed sight distance from shoulder
Figure 59. Impact on horizontal site distance.
68
able information is limited with estimations based on very few
recent counts. As successful implementations are placed in loca-
tions where traffic operations have been improved, it is key that
the location and cause of congestion be understood. Lane balance
and lane continuity information along with detailed traffic
counts, for the mainline and all ramps in the area under consider-
ation, is critical.
One important consideration is the pavement joint or seam
patterns that exist, relative to the existing and future (altered)
pattern of striping. The future location of wheel paths in each
lane must not create a safety problem.
Evaluate Future Conditions
Most projects of this type will probably be considered "tempo-
rary." However, temporary'can turn out to be a long time. A
project time frame of 10 years is recommended. Future traffic
forecasts for the corridor should be reviewed along with ap-
proved or proposed improvements to the intersecting arterials.
Improvements may result in substantially increased demand on
specific ramps. Thus, geometrics and operations for entrance
and exit ramps must be assessed and improvements identified
as required. It is recommended that a micro simulation model
be developed in order to determine LOS, queues, and delay.
Manual methods do not adequately address upstream and down-
stream conditions.
Review Long-Range Plans for the Corridor
The approved long-range plan for the corridor should be re-
viewed along with other plans for the area. In evaluating pro-
posed . alternatives and assessing the benefits and disbenefits,
long-range plans should provide an indication of the.potential
duration of any proposed alternative involving temporary use of
narrow lanes or shoulders.
Identify Alternatives
Once the information has been gathered and initially re-
viewed, feasible alternatives should be identified. This is particu-
larly important as the research findings may indicate that simply
adding another lane will likely not be of benefit. Alternatives
should be developed in detail showing proposed locations,, turn-
outs required, and any mitigating measures required. It is sug-
gested that, in general, improvements be first implemented
downstream of bottlenecks at locations where there is down-
stream capacity to handle additional traffic demand. Simply
moving a problem from one location to another is of little bene-
fit. However,, in some cases it may be determined that moving
congestion downstream may move queues to a safer location.
Develop Preliminary Cost Estimates
Preliminary cost estimates should be developed for all alterna-
tives. Care should be taken to objectively assess both physical
and operating costs. In some cases additional costs have been
incurred when mitigating measures have been implemented in
response to public reaction or unforeseen circumstances.
Screen Alternatives
~At this point it should be possible to eliminate all but'two or
three alternatives f7om further consideration. This should be

69
TABLE 40. Potential measures of effectiveness
Capacity Construction Cost Level of Service Delay V/C Ratio Air Quality Accident Rate Queuing User Cost
done based on the measures of effectiveness identified in Table 40. It is suggested that a matrix covering all alternatives be developed using these criteria and others that may be developed by the implementing agency.
Develop Design Details
At this point all design details should be developed for the remaining altemative(s). Details include lane markings, lane bal-ance and continuity, signing, enforcement strategies, emergency response, improvements to ramps, and other information. Rec-ommended design guidelines are discussed further in the follow-ing section.
Identify Advantages and Disadvantages
Using an approach similar to that of the initial screening, all advantages and disadvantages should be assessed for each alternative. In most cases, the assessments will be done through engineering judgment. A more formal cost-benefit analysis may be attempted. However, this may be difficult because of the number of qualitative assessments that must be made. One aspect to consider is the benefit that relates to the "deferral of major capital investment" by achieving an additional freeway lane through relatively low cost techniques.
DESIGN GUIDELINES
This section presents design guidelines for the implementation of projects involving the use of shoulders and narrow lanes. These guidelines are based on the results of this research and the experience of agencies that participated in this study and responded to the survey.
This research did not find any unique design standards that should be applied to these projects. Existing geometric and traf-fic policies such as those of AASHTO and the Manual on Uni-form Traffic Control Devices and the individual state standards are appropriate. The guidelines developed in this research repre-sent more of a guide for applying these standards. They are intended to supplement rather than supersede existing standards.
Geometric
Field observations indicate that operational impacts of re-duced shoulder or lane widths are most notable in the transition area. Slowdowns are noticeable at the beginning of many re-stricted areas. It is recommended that the transition area be located on a tangent, preferably in an area where there are no crossing structures, retaining walls, or other roadside appurte-
nances. Because of the typically observed slowdown and turbu-lence at the beginning of a transition, it is recommended that at least 2000 ft be maintained between transition and the next upstream ramp.
In cases where the right shoulder is encroached upon, on and off ramps should be analyzed and improved if necessary. The addition of a lane can reduce the length of acceleration and deceleration lanes. Sight distances for entering traffic may be reduced. These features become critical with the lack of a right shoulder (or left shoulder for left exits and entrances).
If possible, edge treatments should be improved to allow room for emergency stops. Guardrail locations should be reviewed. It may be possible to relocate guardrail further from the travel lane. The need for crash attenuators should be considered.
Horizontal sight distances should be reviewed. In cases where there are retaining walls, high concrete medians or glare screens, reduction or elimination of shoulders may drop sight distances below the minimum standards. These situations should be care-fully reviewed to ensure the best design. This was illustrated previously in Figure 59.
Vertical alignment and sight distance also needs to be re-viewed, particularly for freeways that are "at grade" with humps or dips at each interchange.
Operational
On facilities with high truck percentages, it is recommended that trucks be restricted from using a right shoulder lane, which typically does not have adequate pavement structure to support heavy trucks. The shoulder should be reinforced to allow trucks to use the right lane to enter and exit the freeway. A minimum distance of 1500 ft prior to or following the beginning/ending of the taper for/from exit or entrance ramp locations is recom-mended. While improving the pavement structure would allow a right shoulder lane to accommodate trucks, the restriction might still be desired to reduce conflicts with merging traffic.
This study did not find a significant difference in nighttime performance of altered freeway segments. However, nighttime accident rates are considerably higher (altered versus unaltered) in general, therefore, improved lighting and/or delineation is recommended. Emergency turnouts should be lit along with in-terchange areas and lane width transition areas.
As discussed previously, implementation of these strategies should address other preexisting problems such as lane balance and continuity, if such strategies are to be successful.
Emergency turnouts and crossovers should be provided along altered sections. It is recommended that enforcement and emer-gency response personnel be involved in selecting locations. These turnouts should be large enough to accommodate a tractor trailer unit and at least one piece of emergency equipment. A typical turnout is illustrated in Figure 60. Emergency turnouts are recommended every 1500 ft. The location of crossovers should be considered in conjunction with incident manage-ment plans.
While lowered speed limits are used on altered sections of the Garden State Parkway, most jurisdictions have not lowered the speed limit except in construction zones. This study did not find any differences between altered and unaltered free-flow speeds that would support a reduction in the speed limit.

70
--------------------------------- - - - - - - - - - - - - - - - - - - - - - - - - - - - - - - - - - - - - - - - - - - - - - - - - - - - - - - - - - - - - - - - - - -
16 16
-300'_~_ I
Figure 60. Recommended emergency turnout.
Signing
Signing for segments of freeways with narrowed lanes and/or
reduced width shoulders varies considerably from state to state.
In many cases there is no (or at least very limited) signing to
advise the motorist of changes in the cross section. The project
team recommends the following as a minimum. Advance wam-
ing of shoulder use should be provided at least 1/2 mile in advance
of the beginning of a section or series of freeways sections where
shoulders are reduced below minimum standards. Such notices
should be repeated (along with altered section) at approximately
I-mile intervals. Motorists should be advised of turnouts at the
beginning of a project and 1000 ft in advance of each individual
turnout. Turnouts should be striped to clearly indicate that they
are for emergency use only.
Maintenance
Maintenance is more difficult on segments of freeways where
shoulders have been removed and lanes narrowed. The following
suggestions from agencies and maintenance personnel should be
considered:
o Establish staging areas for maintenance crews. In some
cases, emergency turnouts will be acceptable. However, it is not
desirable to have emergency turnouts occupied for any length
of time.
e Eliminate or relocate items that require maintenance if pos-
sible. Replace items with low maintenance designs.
* Select low maintenance landscaping, making use of shrubs
or trees.
* Improve coordination of various maintenance activities. It
should be possible to have several crews work during the same
evening thus reducing the number of lane closures required. In
some cases, it may be necessary to close a segment of a freeway
completely.
9 Provide access to landscape areas or equipment such as
freeway surveillance cameras from surface streets and other
areas outside of the freeway.
9 Replace cable or metal median barriers with concrete barri-
ers if it is anticipated that the application will be in place for
an extended time period. Glare screens should be replaced with
low maintenance designs.
Enforcement
Enforcement becomes increasingly difficult as the cross sec-
tion is narrowed; however, the following actions can be'taken:
* Involve the enforcement agencies in the design process.
They have extensive firsthand knowledge of the corridor and
will enable the designer to address key areas.
9 Increase highway patrul staffing in order to maintain a
visible presence.
* Use public information and signing to educate and alert
the public to acknowledge the officer and then proceed to the
next turnout or exit for enforcement stops.
* Consider the use of ticketing by mail. This has been used
in Virginia for HOV occupancy violations. Safe areas can be
provided for motorcycle patrols to observe traffic.
Incident Response
Incident response is more difficult when lanes and shoulders
are narrower; however, the following actions can be taken.
* Provide more frequent crossovers. This should be done in
conjunction with the agencies. Strategically located crossovers
will allow emergency response teams to approach from the op-
posing direction to bypass queues. Emergency access from sur-
face streets should also be considered.
* Develop pre-established response routes when implement-
ing a project. In most urban areas, some form of freeway man-
agement team has been established. The freeway management
team should be consulted to ensure response time is minimized.
In some situations with major incidents, it may be appropriate
to block all traffic so emergency equipment can approach from
downstream. Locations where this is appropriate should be iden-
tified in advance as this emergency decision must be made
rapidly.
* Consider implementing freeway surveillance if not already
in place. The surveillance system should include full camera
coverage using closed circuit television (CCTV). In addition to
decreasing incident detection time, camera coverage allows the
precise location of the incident to be identified.
* Increase motorist aid and safety patrols on such facilities
to ensure the quick removal of minor incidents. Provide call
boxes in emergency turnouts.
* Provide frequent milepost markings that are visible to the
motorist. To reduce response time, quick and accurate identifica-
tion of the location is key.
e Follow standard procedures when approaching incidents
through a queue. In cases where there is a shoulder, response is
usually along the shoulder. If no shoulders are present, equip-
ment must work its way through a queue. This is usually done
in the left lane by most agencies. Public information efforts may
help to educate the driving public so that they may respond
safely in such situations.

CHAPTER 5
CONCLUSIONS AND RECOMMENDATIONS
71
This research project has confirmed that shoulders and narrow lanes can be used effectively to increase capacity in congested urban corridors. However, unlike previous research that concen-trated on specific sites, this study attempted to look at the broader implications of frequent or extended use of such strategies. Find-ings indicate that, in many instances, there may be measurable negative impacts to the overall safety performance of the corri-dor. Operational impacts seem to be less apparent but the finding of greater variability in operating speeds for altered sections is intuitively consistent with findings that indicated higher accident rates in a majority of cases.
While the safety analysis clearly indicates higher acciden rates in three of the corridors, two show a decrease. Even though higher accidents rates in one altered segment versus an unaltered (baseline) segment can be established, it is extremely difficult to tie the differences to specific causes. As discussed earlier, accidents are related to many factors involving the driver, the roadway, and environmental conditions. However, the findings combined with the experience and judgment of the research team suggest that where smooth traffic flow is maintained, accident rates are lower. In the case of the I-10 corridor, the use of shoulders has been selective, addressing lane balance, continuity, and the volume-to-capacity ratio. This suggests that if the use of shoulders can improve traffic flow, negative impacts related to narrower lanes and lack of shoulder can be offset.
Based on these findings, it is recommended that these strate-gies be reserved for use as techniques to improve traffic flow in congested corridors. Widening of a corridor for an extended length through the use of these strategies is not recommended. Applications of these strategies should be viewed as a technique
for congestion relief, not as a means to widen facilities for extended lengths.
Reduction in the travel-lane width to I I ft should be the first modification considered. Reduction of the left shoulder should be considered before reducing the right shoulder. Research and observations by enforcement personnel indicate that the right shoulder is the preferred refuge area. Also, emergency response is easier to provide if the right shoulder is maintained. If the right shoulder is used and the left shoulder maintained, emergency equipment entering a congested area must work its way across the queue to the leftshoulder as opposed to proceeding on the right shoulder. In some cases, the right shoulder or both shoul-ders have been used. Table 41 summarizes the primary advan-tages and disadvantages of each approach.
This report has presented an approach for evaluating and screening proposed projects. A complete evaluation of each proj-ect on a case-by-case basis is essential. The evaluation must comprise a full assessment of existing conditions, including a full operational analysis. A realistic assessment of the time pe-riod that a project may stay in place should be made. The use of narrow lanes and shoulders involves a series of tradeoffs and the impact of such use can only be quantified to a limited extent. Each jurisdiction must consider qualitative factors, which in-clude funding levels, other projects, and public perception, in addition to capacity and safety impacts.
Design guidelines have been presented in this, report. These guidelines include geometric considerations, operational factors, signing, maintenance and enforcement, and incident manage-ment considerations.
TABLE 41. Primary advantages and disadvantages of design alternatives
Design Alternative Advantages Disadvantages
Use of Left Shoulder Left shoulder not used as much for emergency Usually requires restriping stop(or emergency enforcement
Least expensive if width is available Slight distance problem with some median treatments
Trucks often restricted from left lane
Use of Right Shoulder Often the easiest to implement Right shoulder is preferred area for emergency stops and enforcement
Sight distance changes at merge and diverge areas of ramps
Use of Both Shoulders Not recommended Requires restriping
Safety concerns (no refuge)
Use ONLY in extreme cases Enforcement is difficult
Incident response longer
Maintenance more difficult and expensive J

72
The findings of this research have lead to the following recommendations:
9 Use of shoulders and narrow lanes to achieve an additional travel lane should not normally be considered as an option to a traditional widening project for adding capacity to a freeway corridor.
* For areas of limited length and having turbulent flow con-ditions, use of shoulder(s) and narrow lanes should be considered as one alternative for achieving smoother flow. Such use should typically be limited to sections of I mi or less.
* Where large truck traffic is a significant proportion of peak period (i.e., 5 to 10 percent), use of shoulders and narrow lanes is not recommended.
* For projects involving possible application of shoulders and narrow lanes, a step-by-step approach (site specific) must be used to ensure an adequate evaluation.
* Additional research efforts on traffic flow and safety im-pacts of the use of shoulders and narrow lanes should be made part of other freeway-oriented research projects. It is also recom-mended that additional accident data (1992-1993) be assembled for the corridors used for this research to determine if the find-ings remain as reported here.

REFERENCES
73
LOMAX, T., and HANKS, JW., "Roadway Congestion in Ma-jor Urban Areas 1982-1988," Research Report 1131-3, Texas Transportation Department (1991). LOMAX, T., SCHRNAK D., and TURNER, S., "Estimates of Urban Roadway Congestion — 1990," Research Report 1131-5, Texas Transportation Department (1993). LINDLEY, J.A., "Urban Freeway Congestion Problems and Solutions An Update," ITE Journal (Dec. 1989). STONEX, K.A., and NOBLE, C.M., "Curve Design and Tests on the Pennsylvania Turnpike,'
' 'Proceedings, Highway Re-
search Board, Vol. 20, Washington, D.C. (1940). TARAGIN, A., "The Effect of Roadway Width on Traffic Operations—Two-Lane Concrete Roads," Proceedings, Highway Research Board, Vol 24, pp 292-317, Washington D.C. (1944). MATSON, T., SMITH, W., and HURD, F., Traffic Engineering, McGraw Hill, New York, NY (1955). BALDWIN, D.M., 'The Relation of Highway Design to Traf-fic Accident Experience," National Safety Council, Wash-ington, D.C. (Dec. 1946). NATIONAL ACADEMY OF SCIENCES, Highway Capacity Man-ual, Washington, D.C. (1950).
AMERICAN ASSOCIATION OF STATE HIGHWAY OFFICIALS, Traffic Engineering Handbook, AASHO, Washington, D.C. (1950). AMERICAN ASSOCIATION OF STATE 14IGHWAY OFFICIALS, A Policy on Design Standards, AASHO, Washington, D.C. (1950). AMERICAN ASSOCIATION OF STATE HIGHWAY OFFICIALS, A Policy on Arterial Highways in Urban Areas, AASHO, Washington, D.C. (1957). THE URBAN ADVISORS TO THE FEDERAL HIGHWAY ADMIN-ISTRATOR, The Freeway in the City, U.S. Department of Transportation, Washington, D.C. (1968). KENNEDY, N., KELL, J.H., and HomBURGER, W.S., Funda-mentals of Traffic Engineering, Institute of Transportation and Traffic Engineering, 7th Ed. (1968). HALL, F., HURDLE, V., AND BANKS, J., "Synthesis of Recent Work on the Nature of Speed-Flow and Flow-Occupancy (or Density) Relationships on Freeways," Transportation Research Record 1365, Transportation Research Board, Washington, D.C. (1992).

APPENDIX A
BIBLIOGRAPHY
Abrahamsohn, G.A., "Conversion of Freewav Shoulders to Traffic Lanes for Local Congestion Relief', Ontario Ministry of Transportation & Communication, Canada, October, 1982.
Agent, K.R. and Deen, R.C., "Relationship Between Roadwav Geometrics and Accidents" Transportation Research Record 541, TRB, 1975.
Albright, L.E., "Before and After Freeway Operations Report. Route 1-280 in San Francisco County" California Department of Transportation, District 4, San Francisco, July, 1970.
Allen, D.M., "The prediction sum of squares as a criterion for selecting predictor variables" Department of Statistics Technical Report 23, University of Kentucky, 1971.
American Association of State Highway Officials, "Traffic Engineering Handbook", 1950.
American Association of.State Highway Officials, "A Policv on Arterial Highways in Urban Areas" 1957.
Armour, -M., "Effect of Road Cross Section on Vehicle Lateral Displacement", Australian Road Research, 1985.
Armour, M. and McLean, J.R., "The Effect of Shoulder Width and Tvj)e on Rural Traffic Safetv and Operations", Australian Road Research, 1983.
Ayanian, H., "Accident Study of West-bound Pomona Freewav - A Supplement to Evaluation of Interim Restriping Project on WB Pomona Freeway". Freeway Operation Department, Report No. 70-4, California, Department ofTransportation, 1970.
Ayanian, H., "Evaluation of Santa Monica Freewav Viaduct Widening", Freeway Operation Branch, Report No. 73-21, California, Department of Transportation, Los Angeles, October 1973.
Ayanian, M., "Eastbound Santa Monica Freewav Restriping Evaluation" Freeway Operation Branch, Report No. 70-2, California, Department of Transportation, Los Angeles, September, 1970.
Baldwin, D.M., "The Relation of Highwav Design to Traffic Accident Experience", National Safety Council, December, 1946.
Bergsman, S.E. and Shufflebarger, C.L., "Shoulder Use on an Urban Freeway", Highway Research Record No. 31, Highway Research Board, 1963.
Billion, C., "A Detailed Study of Accidents as Related to Highwav Shoulders in New York State" Highway Research Board Proceedings, 1957.
Blensly, R.C. and Head, J.A., "Statistical Determination of the Effect of Paved Shoulder Width on Traffic Accident Frequencv", Highway Research Board Bulletin, No. 240, 1960.
Borcherdt, D.W., et al., "An Analvsis of Urban Freeway Operations and Modifications" Texas Transportation Institute, College Station, Texas, December, 1984.
Capelle, Donald G., "An Overview of Roadway Delineation Research" U.S. Department of Transportation, Washing-ton, D.C., 1978.
Cottrell, B.H., "The Effects of Wide Edgelines on Lateral Placement and Speed on Two-lane Rural Roads" Paper Presented at the 65th Annual TRB Meeting, January, 1986.
Downs, H.G. and Wallace, D.W., -Shoulder Geometrics and Use Guidelines" Transportation Research Board, 'NCHRP Report 254, Washington. D.C., December, 1982.
Dudek, C.L. and Richards, S.H., "Traffic Manazement for Middle Lane Maintenance on Urban Freeways" Texas Transportation Institute, College Station, Texas, March, 1980.
Dunnet, A.M. and Chow, P., "Safetv Evaluation of Widenim4 and Ramp Control on the Ventura Freeway" Freeway Operation Branch, Report No. 74-3, California Department of Transportation, Los Angeles, July, 1974.
Dunnet, A.M. and Prepena, R.R., "Preliminary Evaluation of Ventura Freeway Widening and Ramp Control", Freeway Operation Department, Report No. 72-8, California Department of Transportation, Los Angeles, August, 1972.
Dunnet, A., "Effect on Traffic Operation of Use of Shoulder as Traveled Way on Portion of Santa Monica Freeway". Freeway Operation Branch Report 68- 1, California Department of Transportation, Los Angeles, January, 1968.
Dunnet, A.M., "Preliminary Evaluation of Median Lane on the San Diego Freeway" Freeway Operations Branch, Report No. -1 7-13, California Department of Transportation, Los Angeles, 1977.
Endo, G. and Anderson, E.R., "Safety Evaluation of Restriping and Ramp Control on the Pomona Freeway", Freeway Operations Branch, Report No. 76-1, California Department of Transportation, Los Angeles, July, 1976.
Endo, G., Axceneaux, J.L., and Spinello, J.J.. "Drivinz in an Eleven-Foot Lane". Freeway Operation Branch, Report No. 73-19, California Department of Transportation, Los Angeles, October. 1973.

Endo, G. and Padilla, R., "Safetv Evaluation ofPart-Time Shoulder Lane and Ramp Control on the Santa Ana Freeway", Freeway Operation Branch, Report No. 76-5, California Department of Transportation, Los Angeles, September 1976.
Endo, G. and Anderson, E.R., "Safetv Evaluation of Part-Time Shoulder Use and Ramp Control on the S.B. Santa Ana Freeway" Freeway Operation Branch, Report No. 77-9, California Department of Transportation, Los Angeles, May, 1977.
Estep, A.C. and Moskowitz, K., "Getting the Most out of a Freewav Svstem" Transportation Research Board, SR 153, TRB, 1975.
Fambro, D.B., "Operational and Safetv Effects of Driving on Paved Shoulders in Texas" Texas Transportation Institute, College Station, Texas, 1982.
Fancher, P. et al., "Test Procedures for Studving Vehicle Lane-Change Maneuvers" SAE Paper No. 760351, February, 1976. -
Federal Hi.ahwav Administration, "Commercial Vehicles in Collisions Involving Vehicles Parked or Stopped on Highwav Shoulders - Special Study", Report HS-021-103, Washington, D.C., 1977.
Federal Highway Administration, "Svnthesis of Safetv Research Related to Traffic Control and Roadwav Elements - Vol 1" FHWA-TS-82-232, December, 1982.
Florida Department of Transportation, "A Feasibility Study: Restriping 1-95 to Create Emergencv Shoulders" Office of Traffic Operations, Tallahassee. April, 1978.
Galuppo, R., "A Report on Sign Effectiveness as a Means of Permitting Periodic Vehicular Movement on a Shoulder Area" Freeway Operation Department, Report No. 71-18, California Department of Transportation, Los Angeles, 1971.
Geisser, M.J., "The Predictive Sample Reuse Method With Applications" Journal of American Statistical Association, 70:320-328, 1975.
Jacobson, L.N., "Freewav and ArteriaiManagement Effort in Washing-ton Stat_e ITE Journal, November, 1989.
Montgomery, D.C., "Design and Analvsis of Experiments", John Wiley and Sons, Inc., D.C., 1984.
Kelleway, R.C., et al, "Provision of Accidents and Breakdowns - A Basis for Decision making where Space is at a Premium", FTRC Education and Research Services Limited, NP214, July, 1981.
Kennedy, N., Kell, J.H. and Homburger, W.S:, "Fundamentals of Traffic Engineering" Institute of Transportation and Traffic Engineering, 71th Edition, 1968.
Keragh, B., "Stopped Vehicles on Freewav Shoulders" Public Roads, Vol. 49, No.3, December, 1983.
Klusza, R., "Route 91 East-bound Commuter Lane" California Department of Transportation, Los Angeles, July, 1988.
Knoflacher, H., "The Capacitv and Arrangement of Traffic Lanes Having a Width of Less than 3.00 Meters (in Germany)", Str Verkehrstechnik, Godesberg, Vol. 13.
Levine, D.W., et. al., "Accident Miaration Associated with Lane-Addition Projects on Urban Freeways", Printerhall Limited, Traffic Engineering and Control Vol. 29 No. 12, December, 1988.
Lindley, JA., "Urban Freewav Congestion Problems and Solutions An Update" ITE Journal, December, 1989.
Loutzenheiser, D.W., "Desirable Criteria for the Geometric Design and Operation o Highwav Shoulders", Highway Research Circular, No. 142, Highway Research Board April, 1973.
Mak, K.K., "Effect of Bridge Width on Highwav Safetv-, Transportation Research Hamersla.-, R., et al., "Analvsis of Accidents in Traffic Situations Bv Means of Multi Board, Washington, D.C., 1987. Proportional Weighted Poisson Model", Transportation Research Record #847, TRB, Washington, D.C., 1982. Massachusetts Department of Public Works, "Massachusetts 1-93 & 1-95 Conversion
of Shoulder to Travel Buses", 1985. Hauer, E. and Lovell, J., "Safety Measures Aimed at Reducing Accidents Occasioned by Vehicles Stopped on Freewav Shoulder". Department of' Civil Engineering, Matson, Smith and Hurd, "Traffic Enaineerina" McGraw Hill, New York, 1955.' University of Toronto, Ontario, Canada, 1984.
McBean, P.A., "The Influence of Road Geometry at a Sample of Accident Sites" Hoban, C.J., "Evaluating Traffic Capacitv and Improvements to Road Geometry", Transportation and Road Research Laboratory, Crowthorne, England, 1982. Washington, D.C., World Bank, 1987.
Hunsucker, D.Q., "Desi--n and Performance of Highwav Shoulders", Kentucky Transportation Research Program, University of Kentucky, 1989.
International Road Federation, "Road Desizn and Safetv-, Papers World Meetin.a, Stockholm, Sweden, June, 1981.
McCasland, W.R., Bi.-s, R.G., "Freewav Modifications To Increase Traffic Flow" USDOT, FH`WA, FHWA-TS-80-203, Washington. D.C., January, 1980.
McCarthy, J., "Estimating the Safety Benefits for Alternative Highwav and/or Operational Improvements. Research Summary" U.S. Department of'Transportation, Federal Highway Administration, Washington, b.C.. 1981.

McCasland, W.R., "The Use of Freeway Shoulders to Increase Capacitv: A Review". Texas Transportation Institute, Colleg Station Texas, 1984. ge
McCasland, W.R., "Use of Freeway Shoulders to Increase Capacity" Transportation Research Record 666, Washington, D.C., 1978.
McCasland, W.R., "Modifving Freewav Geometrics to Increase Capacitv" ASCE Journal of Transportation Engineering, Vol. 106:6, November, 1980.
McHenry, S.R., "Evaluation of Wide Curb Lanes as Shared Lane Bicycle Facilities" Maryland State Highway Administration, 1985.
McLean, J.R., "Driver Behavior on Curves - a Review" Australian Road Research,
1974.
McLean, J.R. and Hoffmann, E.R., "Steering Reversals as a Measure of Driver Performance and Steering Task Difficulty-, Human Factors, 1975.
McLean, J.R. and Hoffman, E.R., "The Effects of Lane Width on Driver Steering
.Control and Performance" Australian Research Board Proceedings, Vol. 6, 1972.
McLean, A.C., "M6 Reconstruction 1976: Two-Way Traffic Using Narrow Lanes", Transport and Road Research Laboratory, Crowthorne, England, 1979.
Menchen, W.G., "Evaluation of Interim Restriping Project on Westbound Pomona Freeway" Freeway Operation Department, Report No. 68-10, California Department of Transportation, Los Angeles, October, 1968.
Messer, C. J., "Highway Geometric Design Consistencv Related to Driver Expectancv", U.S. Department of Transportation, Federal Highway Administration, Washington, D.C., 1981.
Munjal, P.K., et al., "Analvsis and Validation of Lane Drop Effects on Multilane Freeways" December, 1971.
Nedas, N.D., et. al., "Road Markings as an Alcohol Countermeasure for Highwav Safety: Field Studv of Standard and Wide Edgelines" Transportation Research Record 847, TRB, Washing-ton, D.C., 1982.
Newman, L. and Madsen, L., "Effects of Adding Auxiliary Lanes and a Two-Lane Exit on Route 10 (San Francisco,)" Freeway Operation Department, Report No. 69-5, California Department of Transportation, Los Angeles, January, 1970.
Newman L., et al., "Evaluation of Use of Shoulders as Traveled Way on the Westbound Santa Monica FreenM]L~ Freeway Operation Department, Report No. 68-6, California Department of Transportation, Los Angeles, September, 1968.
Niesser, C.W., "Raised Pavement Markers at Hazardous LocatiqaL U.S. Department of Transportation, Federal Highway Administration, FHWA-TS-84-315, McLean, Virginia, 1984.
Oellers, F.W., "Investigation of the Influence ofl-ane Width on the Flow of Traffic on Roads with Separate Carriageways-, Federal Institute of Road Research, West Germany.
Oellers, F.W., "The Influence of Lane Width on Traffic Flow on Motorways" Forschung Strassenbau und Strassenverkehrstechnick, 1976.
Oregon State Highway Division, "Report on Substandard Lane Widths Pacific Highwav 1-5", Oregon Department of Transportation, January, 1975.
Otani, C., "An Operational and Safety Evaluation of Ramp Control and Geometric Improvement on the Northbound Golden State Freewav in Los Angeles", Freeway Operation Branch, Report No. 73-29, California Department of Transportation, Los Angeles, January, 1974.
Perovich, M., "Supplemental Report on the Use of Shoulders as Traveled Wav on the Westbound Santa Monica Freewav" Freeway Operation Department, Report No. 70-3, California Department of Transportation, Los Angeles, June. 1970.
--I C7%
National Academy of Sciences, "Shoulder and Rest Area Use - Studv Procedure Peterson, D.E., Gull, R., "Triple Trailer Evaluation in LJ~ Utah Department of Guide" Highway Research Board, Bulletin 359, Washington, D.C., 1962. Transportation, 1975.
National Academy of Sciences, "Cost and Safety Effectiveness of Highwav Design Rindle, E.A., "Accident Rates vs. Shoulder Width", California DOT, Report No. Elements" Transportation Research Board, NCHRP 197, Washington, D.C., 1978. CA-DOT-TR-3147-1-77-01, Los Angeles, September. 1977.
National Academy of Sciences, "Current Practices in Shoulder Design, Construction, Roads and Transportation Association of Canada, "Geometric Desi_-n Standards for Maintenance and Operation" Highway Research Circular, 142, HRB, April, 1973. Canadian Roads and Streets" Ottawa, Canada. 1976.
National Academy of Sciences, "Geometrics and Safety Considerations", Roper, D.H., "The Commuter Lane: A New \Vav to Make the Freewav Operate Transportation Research Record 960, TRB, Washington, D.C., 1984. Better" Transportation Research Record 1081, TRB, Washington, D.C., 1986.
National Swedish Road Administration, "Calculations of' Capacitv, Queue Length, Schavefer, W.E., West, J., "A New Look in Freewav Operations", Traffic Engineering, Delav in Road Traffic" ITE, August, 1969.

Shah, K., "Methodolo" to Relate Traffic Accidents to Highwav Design Characteristics', Department of Industrial and Systems Engineering, Ohio University, August, 1968.
Vey, A.H. and Ferrerri, M.G., "The Effect of Lane Width on Traffic Operation", Traffic Engineering, ITE, Washington, D.C. August, 1969.
Silyanov, V.V., "Comparison of the Pattern of Accident Rates on Roads of Different Countries" Traffic Engineering and Control, Vol. 14:9, 1973.
Snee, R.D., "Validation of Regression Models: Methods and Examples", Technometrics, Vol. 19:415-428, 1977.
Vostrez, J. and Lundy, R.A., "Comparative Freeway Study", Highway Research Record 99, HRB, Washington, D.C., 1965.
Wagner, F.A., "Ener--y Impact of Urban Transportation Improvements", ITE Publication, August, 1980.
Woods, D.L., "Guidelines for Using Wide-Paved Shoulders on Low-Volume Two-Lane Stonex, K.A., and Noble, C.M_ "Curve Design and Tests on the Pennsvlvania Rural Highways Based on Benefit/Cost Analvsis", Texas Transportation Institute, Turnpike" Proceedings, Highway Research Board, Vol. 20, Washington, D.C., 1940. College Station Texas, 1989.
Taragin, A., "Role of Highway Shoulders in Traffic Operation', Highway Research Board Bulletin 151, HRB, 1957.
Taragin, A., "The Effect of Roadway Width on Vehicle Operation", U.S. Bureau of Public Roads.
Tharp, K.J., "A Quantitative Evaluation of the Geometric Aspects of Highways", Highway Research Record 83, HRB, Washington, D.C., 1965.
Triggs, T.J. and Wisdom, P.H., "Observations of Vehicle Lateral Position-Keeping and the Effects of Pavement Delineation Marking", Australian Road Research Board Proceedings, Vol. 9, 1978.
TranSafety Inc., "S8.2 Million Verdict Against California for Shoulder Negligence" TranSafety Reporter, Washing-ton, D.C., May, 1985.
TranSafety Inc., "S1.3 million Verdict For Shoulder Defect", TranSafety Reporter, Washing-ton, D.C., July, 1985.
U.S. Bureau of Public Roads, "Highwav Capacitv Manual" U.S Government Printing Office, Washington, D.C., 1950.
The Urban Advisors to the Federal Highway Administrator, "The Freeway in the Citf- U.S. Department of Transportation, 1968.
Urbanik, T. and Bonilla, C.R., "Safetv and Operational Evaluation of Shoulders on Urban Freeways" Texas Transportation Institute, College Station Texas, April, 1986.
Urbanik, T. and Bonilla, C.R., "California Experience With Inside Shoulder Removals" Transportation Research Record 1122, TRB, Washington, D.C., 1987.
Urbanik, T. and Bonilla, C.R., "The California Experience with Inside Shoulder Removals". Texas Transportation Institute, College Station Texas, January, 1987.
Ur banik, T., "Safety and Operational Evaluation of Shoulders - An Update" Texas Transportation Institute, Colleg Station, Texas August, 1989. ge
Wynne, T.J. and Crawford, R.E., "Safetv Evaluation of Ramp Control and Geometric Improvements on the San Diego Freeway" Freeway Operation Department Report No. 76-8, California Department of Transportation, Los Angeles, October, 1976.
Zeeaer, C.V., et al., "Safety Cost-Effectiveness of Incremental Changes in Cro;s-Section Design: Informational Guide" U.S. Department of Transportation, Federal Highway Administration, FHWA/RD-87/094, Washington. D.C., 1987.
Zegeer, C.V. and Deacon, J.A., "Effect of Lane Width. Shoulder Width. and Shoulder Type on Highwav Safety" Transportation Research Board, Washington, D.C., 1987.
Zegeer, C.V. and Perkins, D.D., "The Effects of Shoulder Width and Condition on Safetv: A Critique of Current State of the Art", Paper presented at the 59th Annual TRB Meeting, Washington, D.C., January, 1980.

THE TRANSPORTATION RESEARCH BOARD is a unit of the National Research Coun-cil, which serves the National Academy of Sciences and the National Academy of Engineering. It evolved in 1974'from the Highway Research Board which was established in 1920. The TRB incorpor * ates all former HRB activities and also performs additional functions under a broader scope involving all modes of transportation and the interactions of transportation with society. The Board's purpose is to stimulate research concerning the nature and performance of transportation systems, to disseminate information that the research produces, and to encourage the application of appropriate research findings. The Board's program is carried out by more than 270 conimittees, task forces, and panels composed of more than 3,300 administrators, engineers, social scientists, attorneys, educators, and others concerned with transportation; they serve without compensation. The program is supported by state transportation and highway departments, the modal administrations of the U.S. Department of Transportation, the Association of American Railroads, the National Highway Traffic Safety Adn-finistration, and other organizations and individuals interested in the development. of transportation.
The National Academy of Sciences is a private, nonprofit, self-perpetuating society of distin-guished scholars engaged in scientific and engineering research, dedicated to the furtherance of science and technology and to their use for the general welfare. Upon the authority of the charter granted to it by the Congress in 1863, the Academy has a mandate that requires it to advise the federal government on scientific and technical matters. Dr. Bruce M. Alberts is president of the National Academy of Sciences.
The National Academy of Engineering was established in 1964, under t he charter of the National Academy of Sciences, as a parallel organization of outstanding engineers. It is autonomous in its administration and in the selection of its members, sharing with the National Academy of Sciences the responsibility for advising the federal government. The National Academy of Engineering also sponsors engineering programs aimed at meeting national needs, encourages education and research and recognizes the superior achievements of engineers. Dr. Harold Liebowitz is president of the National Academy of Engineering.
The Institute of Medicine was established in 1970 by the National Academy of Sciences to secure the services of eminent members of appropriate professions in the examination of policy matters pertaining to the health of the public. The Institute acts under the responsibility given to the National Academy of Sciences by its congressional charter to be an adviser to the federal government and, upon its own initiative, to identify issues of medical care, research, and education. Dr. Kenneth I. Shine is president of the Institute of Medicine.
The National Research Council was organized by the National Academy of Sciences in 1916 to associate the broad community of science and technology with the Academy's purpose of furthering knowledge . and advising the federal government. Functioning in accordance with general policies determined by the Academy, the Council.has become the principal operating agency of both the National Academy of Sciences and the National Academy of Engineering in providing services to the government, the public, and the scientific and engineering communities. The Council is administered jointly by both Academies and the Institute of Medicine. Dr. Bruce M. Alberts and Dr. Harold Liebowitz are chairman and vice chairman, respectively, of the National Research Council.

Transportation Research.Board National Research Council 2101 Constitution Avenue, N.W. Washington, D.C. 20418
ADDRESS CORRECTION REQUESTED
NON-PROFIT ORG. U.S. POSTAGE
PAID WASHINGTON, D.C.
PEM'01T NO. 8970
a