
USE OF POPULATION VIABILITY ANALYSIS AND RESERVE SELECTION ALGORITHMS IN REGIONAL CONSERVATION PLANS
17
1773 Ecological Applications, 13(6), 2003, pp. 1773–1789 q 2003 by the Ecological Society of America USE OF POPULATION VIABILITY ANALYSIS AND RESERVE SELECTION ALGORITHMS IN REGIONAL CONSERVATION PLANS CARLOS CARROLL, 1,5 REED F. NOSS, 2 PAUL C. PAQUET, 3 AND NATHAN H. SCHUMAKER 4 1 Klamath Center for Conservation Research, Orleans, California 95556 USA 2 Department of Biology, University of Central Florida, Orlando, Florida 32816 USA 3 Faculty of Environmental Design, University of Calgary, Calgary, Alberta, T2N 1N4 Canada 4 U.S. Environmental Protection Agency, Western Ecology Division, Corvallis, Oregon 97333 USA Abstract. Current reserve selection algorithms have difficulty evaluating connectivity and other factors necessary to conserve wide-ranging species in developing landscapes. Conversely, population viability analyses may incorporate detailed demographic data, but often lack sufficient spatial detail or are limited to too few taxa to be relevant to regional conservation plans. We developed a regional conservation plan for mammalian carnivores in the Rocky Mountain region using both a reserve selection algorithm (SITES) and a spatially explicit population model (PATCH). The spatially explicit population model in- formed reserve selection and network design by producing data on the locations of pop- ulation sources, the degree of threat to those areas from landscape change, the existence of thresholds to population viability as the size of the reserve network increased, and the effect of linkage areas on population persistence. A 15% regional decline in carrying capacity for large carnivores was predicted within 25 years if no addition to protected areas occurred. Increasing the percentage of the region in reserves from the current 17.2% to 36.4% would result in a 1–4% increase over current carrying capacity, despite the effects of landscape change. The population model identified linkage areas that were not chosen by the reserve selection algorithm, but whose protection strongly affected population vi- ability. A reserve network based on carnivore conservation goals incidentally protected 76% of ecosystem types, but was poor at capturing localized rare species. Although it is unlikely that planning for focal species requirements alone will capture all facets of bio- diversity, when used in combination with other planning foci, it may help to forestall the effects of loss of connectivity on a larger group of threatened species and ecosystems. A better integration of current reserve selection tools and spatial simulation models should produce reserve designs that are simultaneously biologically realistic and taxonomically inclusive. Key words: carnivores; conservation planning; focal species; population viability analysis; re- gional conservation plans; reserve selection; Rocky Mountains. INTRODUCTION As the extent of human alteration of natural habitats grows, efforts to conserve biodiversity increasingly fo- cus on land use planning on a regional scale. Because gathering detailed information on regional species dis- tributions is difficult, reserve selection algorithms pri- marily use generalized species range maps or surro- gates derived from more easily collected data such as vegetation, climate, and topography (Scott et al. 1993, Pressey et al. 2000). Information on the relative de- mographic roles of differing portions of a species’s range (i.e., source and sink habitat; Pulliam [1988]), and their relative levels of demographic linkage in a metapopulation, is seldom available. Simple reserve design rules (‘‘bigger is better,’’ ‘‘connected is better than fragmented’’) may be used to adjust the output of reserve selection algorithms to create a more coherent Manuscript received 10 June 2002; revised 13 January 2003; accepted 24 February 2003. Corresponding Editor: M. G. Turner. 5 E-mail: [email protected] reserve design (Diamond 1975). Conversely, when planning is focused on a single high-profile species, most population viability analyses (PVAs) provide only a composite evaluation of viability across a region be- cause of the difficulty of linking spatial data to de- mographic processes (Boyce 1992, Beissinger and McCullough 2002). Such simplification is defensible in the face of pressing needs to address the conser- vation of multiple species. Nevertheless, integrating tools used in single-species population viability anal- ysis, such as spatially explicit population models (SEPMs), with reserve selection tools can add biolog- ical realism to regional reserve designs and make them more effective at conserving wide-ranging species in developing landscapes (Kareiva and Wennergren 1995, Noss et al. 2002). We developed predictive models of distribution for eight mammalian carnivore species across a study re- gion in the Rocky Mountains of Canada and the United States extending from the Yukon/British Columbia bor- der to the Greater Yellowstone Ecosystem (GYE) (Fig.
Transcript of USE OF POPULATION VIABILITY ANALYSIS AND RESERVE SELECTION ALGORITHMS IN REGIONAL CONSERVATION PLANS

1773
Ecological Applications, 13(6), 2003, pp. 1773–1789q 2003 by the Ecological Society of America
USE OF POPULATION VIABILITY ANALYSIS AND RESERVE SELECTIONALGORITHMS IN REGIONAL CONSERVATION PLANS
CARLOS CARROLL,1,5 REED F. NOSS,2 PAUL C. PAQUET,3 AND NATHAN H. SCHUMAKER4
1Klamath Center for Conservation Research, Orleans, California 95556 USA2Department of Biology, University of Central Florida, Orlando, Florida 32816 USA
3Faculty of Environmental Design, University of Calgary, Calgary, Alberta, T2N 1N4 Canada4U.S. Environmental Protection Agency, Western Ecology Division, Corvallis, Oregon 97333 USA
Abstract. Current reserve selection algorithms have difficulty evaluating connectivityand other factors necessary to conserve wide-ranging species in developing landscapes.Conversely, population viability analyses may incorporate detailed demographic data, butoften lack sufficient spatial detail or are limited to too few taxa to be relevant to regionalconservation plans. We developed a regional conservation plan for mammalian carnivoresin the Rocky Mountain region using both a reserve selection algorithm (SITES) and aspatially explicit population model (PATCH). The spatially explicit population model in-formed reserve selection and network design by producing data on the locations of pop-ulation sources, the degree of threat to those areas from landscape change, the existenceof thresholds to population viability as the size of the reserve network increased, and theeffect of linkage areas on population persistence. A 15% regional decline in carryingcapacity for large carnivores was predicted within 25 years if no addition to protected areasoccurred. Increasing the percentage of the region in reserves from the current 17.2% to36.4% would result in a 1–4% increase over current carrying capacity, despite the effectsof landscape change. The population model identified linkage areas that were not chosenby the reserve selection algorithm, but whose protection strongly affected population vi-ability. A reserve network based on carnivore conservation goals incidentally protected76% of ecosystem types, but was poor at capturing localized rare species. Although it isunlikely that planning for focal species requirements alone will capture all facets of bio-diversity, when used in combination with other planning foci, it may help to forestall theeffects of loss of connectivity on a larger group of threatened species and ecosystems. Abetter integration of current reserve selection tools and spatial simulation models shouldproduce reserve designs that are simultaneously biologically realistic and taxonomicallyinclusive.
Key words: carnivores; conservation planning; focal species; population viability analysis; re-gional conservation plans; reserve selection; Rocky Mountains.
INTRODUCTION
As the extent of human alteration of natural habitatsgrows, efforts to conserve biodiversity increasingly fo-cus on land use planning on a regional scale. Becausegathering detailed information on regional species dis-tributions is difficult, reserve selection algorithms pri-marily use generalized species range maps or surro-gates derived from more easily collected data such asvegetation, climate, and topography (Scott et al. 1993,Pressey et al. 2000). Information on the relative de-mographic roles of differing portions of a species’srange (i.e., source and sink habitat; Pulliam [1988]),and their relative levels of demographic linkage in ametapopulation, is seldom available. Simple reservedesign rules (‘‘bigger is better,’’ ‘‘connected is betterthan fragmented’’) may be used to adjust the output ofreserve selection algorithms to create a more coherent
Manuscript received 10 June 2002; revised 13 January 2003;accepted 24 February 2003. Corresponding Editor: M. G. Turner.
5 E-mail: [email protected]
reserve design (Diamond 1975). Conversely, whenplanning is focused on a single high-profile species,most population viability analyses (PVAs) provide onlya composite evaluation of viability across a region be-cause of the difficulty of linking spatial data to de-mographic processes (Boyce 1992, Beissinger andMcCullough 2002). Such simplification is defensiblein the face of pressing needs to address the conser-vation of multiple species. Nevertheless, integratingtools used in single-species population viability anal-ysis, such as spatially explicit population models(SEPMs), with reserve selection tools can add biolog-ical realism to regional reserve designs and make themmore effective at conserving wide-ranging species indeveloping landscapes (Kareiva and Wennergren 1995,Noss et al. 2002).
We developed predictive models of distribution foreight mammalian carnivore species across a study re-gion in the Rocky Mountains of Canada and the UnitedStates extending from the Yukon/British Columbia bor-der to the Greater Yellowstone Ecosystem (GYE) (Fig.

1774 CARLOS CARROLL ET AL. Ecological ApplicationsVol. 13, No. 6
FIG. 1. Map of the study area in the Rocky Mountains of Canada and the United States. Protected area complexes referredto in the text, as well as the proposed Southern Rocky Mountains Conservation Area (SRMCA), are identified. The subregionused for comparison of carnivore and noncarnivore reserve designs is shown with light gray shading.
1). This region links boreal populations of several car-nivore species with smaller and more isolated popu-lations at their southern range margin (Carroll et al.2001a). Therefore, conservation groups have focusedattention on retaining landscape connectivity in thisregion (Paquet and Hackman 1995, Chadwick 2000).The species considered here (grizzly bear, Ursus arc-tos); black bear, Ursus americanus; gray wolf, Canislupus; lynx, Lynx canadensis; mountain lion, Pumaconcolor; wolverine, Gulo gulo; fisher, Martes pen-nanti; and marten, Martes americana) include most ofthe large and medium-sized mammalian carnivores na-tive to the region. Such carnivores are often proposedas focal species because of their low population density
and sensitivity to human-induced landscape change(Weaver et al. 1996, Lambeck 1997; see Plate 1).
The predictive habitat models for these eight species,which we call the static models, combine data on var-ious habitat components to provide a snapshot of hab-itat quality and potential population distribution (Car-roll et al. 2001a). In contrast, SEPMs combine infor-mation on habitat characteristics with demographicdata to evaluate area and connectivity factors that in-fluence the probability that a patch of suitable habitatwill remain occupied by a species over time (Dunninget al. 1995, Kareiva and Wennergren 1995). Dynamicmodels such as SEPMs can add information in threeareas: the response of a population to future landscape

December 2003 1775RESERVE SELECTION AND PVA
PLATE 1. Much of the Rocky Mountain region of the United States and Canada is still characterized by ecologicalprocesses and species assemblages typical of wildland ecosystems, but these are increasingly impacted by development andresource extraction. (A) A gray wolf (Canis lupus) and grizzly bear (Ursus arctos) feed on a winter-killed bison (Bison bison)carcass in Yellowstone National Park, USA. Photograph by Doug Smith. (B) A development in the Bow Valley, Banff NationalPark, Canada. Photograph by Paul Paquet.
TABLE 1. Summary of static habitat suitability models by species, showing type of model and input variables. Coefficientsof variables are shown as positive (1), negative (2), or quadratic convex up (cx).
Variable
Conceptual model
Grizzly bear WolfMountain
lion Marten
Empirical model (RSF)†
Wolverine Lynx Fisher Black bear
BrightnessGreennessWetnessPrecipitationSnowfallRoad densityHuman populationTopographyTree closureProtected area statusElevation/latitude
1
22
1
222
1
221
1
1
122
21
2
1
212cx
2
2
211
2
12
† RSF 5 resource selection functions.
change, including areas of highest vulnerability to pop-ulation decline or extirpation; the locations of popu-lation source areas, which may differ from the areas ofhighest predicted habitat suitability or density (VanHorne 1983); and the response of a population to al-ternative conservation strategies. These models can beapplied to only the best studied species because of theirstringent data requirements. Even in these cases, resultsmay be sensitive to variation in poorly known param-eters (Kareiva et al. 1996). Given the level of datatypically available for mammalian carnivores, wesought to determine whether information from SEPMsis robust to data gaps and relevant to a wider suite ofspecies to an extent that can justify their use in re-gional-scale planning. A better integration of currentreserve selection tools and spatial simulation modelsshould produce reserve designs that are simultaneouslybiologically realistic and taxonomically inclusive.
METHODS
Static models
The type of static model selected for this study variedamong the eight species, based on the availability ofregional occurrence data sets, e.g., tracks or sightings(Table 1) (Carroll et al. 2001a). We created empiricalmodels, or resource selection functions, RSF (Manlyet al. 1993), for the four species for which we haddetailed survey data: black bear, lynx, wolverine, andfisher (Table 1). The empirical models for fisher, lynx,and wolverine, although similar to those described inCarroll et al. (2001a), differed in that the source of thesatellite imagery was the Moderate Resolution ImagingSpectroradiometer (MODIS) sensor rather than the old-er Landsat Thematic Mapper sensor (Huete et al. 1997).We used regional-scale survey data for black bear (Mo-wat and Strobeck 2000) to create an empirical modelfor that species (Carroll et al. 2002).

1776 CARLOS CARROLL ET AL. Ecological ApplicationsVol. 13, No. 6
FIG. 2. Flowchart of stages in reserve selection and design process.
We created conceptual models for the grizzly bear,wolf, marten, and mountain lion based on publishedinformation on species–habitat associations. Thesemodels, described in Carroll et al. (2000, 2001a, b,2002, 2003), are summarized here. The conceptualmodels for the grizzly bear (Carroll et al. 2001a) andwolf (Carroll et al. 2001b, 2003) combined surrogatesof prey biomass, as measured by vegetation indices,and human-associated mortality risk, as measured byroad density and human population (Merrill et al.1999), into a composite habitat suitability metric. To-pography was an additional component of the wolfmodel (Carroll et al. 2001b, 2003). The marten con-ceptual model predicted habitat suitability by multi-plying scaled values for snowfall by those for tree can-opy closure (Carroll et al. 2000). The mountain lionmodel combined positive effects of rugged topography,tree cover, and vegetation productivity with negativeeffects from human development and roads (Carroll etal. 2000).
Dynamic models
After developing the static models, we performedpopulation viability analyses using the programPATCH (Schumaker 1998); see Fig. 2. PATCH is aspatially explicit population model that links the sur-vival and fecundity of individual animals to GIS dataon mortality risk and habitat productivity measured at
the location of the individual or pack territory. Themodel tracks the demographics of the populationthrough time as individuals are born, disperse, repro-duce, and die, predicting population size, time to ex-tinction, and migration and recolonization rates.PATCH allows modeling of environmental stochastic-ity, but does not consider genetics. We used PATCHsimulations to evaluate long-term persistence proba-bility, i.e., the capacity for an area to support a car-nivore species over 200 years, rather than transient dy-namics such as time to extinction. Separate static mod-els for fecundity and mortality risk were derived fromthe conceptual models for grizzly bear and wolf (Nosset al. 2002, Carroll et al. 2003); see Table 1. A mortalityrisk model for wolverine was derived from the empir-ical model for that species (Table 1). The relative fe-cundity and survival rates expected in the various hab-itat classes were estimated based on values reported insimilar habitats (Fuller 1989, Banci 1994, Pease andMattson 1999). Survival and reproductive rates in theform of a population projection matrix were scaled tothe rankings of the habitat classes, with poorer habitattranslating into lower scores and, thus, higher mortalityrates or lower reproductive output. Demographic rates,territory size, and dispersal distance are reported inTable 2.
Adult organisms are classified as either territorial orfloaters. The movement of territorial individuals is gov-

December 2003 1777RESERVE SELECTION AND PVA
TABLE 2. Parameters used in the PATCH model. Mean values are averaged over the entireregion under current landscape conditions, including territories that did not support the speciesin the subsequent simulations.
Parameter Grizzly bear Wolf Wolverine
Territory size (km2) 270 504 270Maximum dispersal distance (km) 56 254 92
Survival rates (maximum/mean)Young, year 0Subadult, year 1Adult, year 21At senescence (year in brackets)
0.82/0.700.92/0.780.94/0.80
NA
0.46/0.400.86/0.760.96/0.840.69/0.61[8]
0.75/0.660.95/0.840.95/0.840.85/0.75[8]
Fecundity rates† (maximum/mean)Subadult, year 1Adult, year 2Adult, year 31
0/00/0
0.55/0.44
0/02.29/1.263.21/1.77
0.22/0.170.34/0.270.34/0.27
† Fecundity is given as the number of female offspring per adult female or pack.
erned by a site fidelity parameter, but floaters mustalways search for available breeding sites. Source–sinkbehavior is tracked during a PATCH simulation as thedifference between a hexagon’s emigration and im-migration rates. Movement decisions use a directedrandom walk that combines varying proportions of ran-domness, correlation (tendency to continue in the di-rection of the last step), and attraction to higher qualityhabitat. However, there is no knowledge of habitatquality beyond the immediately adjacent territories(Schumaker 1998).
Because the model allows the landscape to changethrough time, we could quantify the consequences oflandscape change for population viability and examinechanges in vital rates and occupancy patterns that mightresult from habitat loss or restoration, both at the scaleof the individual territory and for larger regions. Thelandscape change scenarios estimated potential changein human-associated impact factors (e.g., roads and hu-man population) by proportionately increasing roaddensity (except within protected areas) and increasinghuman population based on recent trends derived froma time series of human census data. Census data wereavailable for the period 1990–2000 (U.S. Census Bu-reau 1991) or 1990–1996 (Statistics Canada 1997). Wepredicted human population growth from 2000 to 2025based on growth rates from 1990 to 1996/2000, butadjusted the predicted 2025 population to match state-and subprovince-level predictions based on more com-plex socioeconomic models (U.S. Census Bureau, un-published data; British Columbia Ministry of Finance,unpublished data). Although landscape change waspredicted at a resolution of ;1 km2, responses of car-nivore populations were predicted at the resolution ofan individual territory and above (270–504 km2; Table2). Because the rate of human-caused habitat changeis generally faster than the rate of response of an af-fected carnivore population, a contrast exists betweenthe time scale over which landscape change could beaccurately predicted (25 years) and the time necessary
for carnivore populations to equilibrate to that change(up to 200 years).
Reserve selection
A principal tool of modern conservation planning isthe reserve selection algorithm (Margules and Pressey2000). The objective is to conserve biodiversity effi-ciently within a network of reserves. An efficient re-serve design meets conservation objectives with a min-imal investment of area by building a network fromcomplementary sites. Early conservation assessmentsand reserve designs used manual mapping to delineatesites and simple scoring procedures to compare andrank sites (Noss 1993). Larger numbers of conservationtargets require the use of a more systematic and effi-cient site selection procedure. Increases in the numberof targets or potential conservation sites result in anexponential increase in the computational time neededto find an exact solution (Pressey et al. 1996). There-fore, many current tools, such as the SITES model usedhere (Andelman et al. 1999, Possingham et al. 2000),employ heuristic algorithms to identify one or more‘‘near-optimal’’ solutions that fulfill the selected goalsefficiently. SITES uses a simulated annealing algorithmto reduce ‘‘cost’’ while maximizing attainment of con-servation goals in a compact set of sites. The functionthat SITES seeks to minimize is Cost 1 Species Penalty1 Boundary Length, where Cost is the total monetaryor area cost of all planning units selected for the net-work, Species Penalty is a cost imposed for failing tomeet target goals, and Boundary Length is a cost de-termined by the total boundary length of the network(Andelman et al. 1999). Hence, SITES attempts to se-lect the smallest overall area needed to meet statedgoals and to select clustered rather than dispersed plan-ning units.
SITES performed 1 000 000 iterative attempts to findthe minimum cost solution per run and performed 100such runs for each alternative conservation scenariothat we explored. The best (lowest cost) solution from

1778 CARLOS CARROLL ET AL. Ecological ApplicationsVol. 13, No. 6
each run of 1 000 000 iterations is reported, as well aswhich out of those 100 top candidates has the lowestcost. Besides identifying this latter solution, the ‘‘bestrun,’’ SITES also rates areas by how often they wereselected in the best solutions of the 100 alternate runs.An area that scored highly in this ‘‘summed runs’’ out-put might not be included in the best solution, but couldbe considered a suitable alternative site.
Goals for the carnivore focal species were expressedas a percentage of the total habitat ‘‘value’’ in the re-gion. This is more realistic than the common approachof classifying areas into two classes of unsuitable andsuitable habitat (Scott et al. 1993). Habitat value wasmeasured by the output of either the RSF model (Car-roll et al. 2001a) or conceptual model, depending onthe species (Table 1). Habitat values from the concep-tual models cannot be directly linked to population size.Because RSF value is proportional to the number ofanimals that could be supported in an area (Boyce andMcDonald 1999), conserving a set percentage of theRSF value might be expected to conserve that propor-tion of the potential regional population, if we ignorefactors such as connectivity that may cause isolatedhabitat to remain unoccupied. Some additional portionof a population also will be present on nonreservelands.
Ecoregions are commonly considered an appropriatescale at which to plan biodiversity conservation(Groves et al. 2000). However, a large ecoregion mayencompass a wide range of ecosystems and levels ofhuman impact, and our study area spans several ecore-gions. Not surprisingly, the northern portion of thestudy region shows higher carnivore habitat quality formost species than areas in the more developed trans-boundary (U.S./Canada border) region. SITES maymost efficiently achieve such goals as carnivore habitatprotection by locating reserves entirely in the northernportion of the study region. However, this solutionpoorly meets the goal of maintaining well-distributedand connected populations. Therefore, we stratifiedgoals by subdividing the study area into 88 sectionsderived from subregional ecosection classifications(e.g., Demarchi and Lea 1992), which we modified toproduce a system of sections of similar size across thestudy region. To balance the need for a well-distributedreserve network with the need for efficiency, we setthe overall regional goal higher than the local section-level goal. For example, with a 40% regional/30% localgoal, SITES sought to capture 30% of the habitat valuein each section, and added another 10% of habitat valuewherever in the region this could be achieved at leastcost. SITES requires an estimate of the cost of includ-ing each new site in the conservation network. Thiscan be the monetary cost of the land, if known. Thisinformation is rarely available on an ecoregional scale,however, especially where most of the land base is inpublic ownership. We used the area of a site as a mea-sure of cost in all SITES runs.
Initial SITES runs used the static habitat suitabilitymodels for the eight species. Our design built upon theexisting protected area network (Fig. 1) by locking ex-isting protected areas into the SITES solution, so thatthe program only added planning units with targets thatwere missing from the current park system. Lockingin protected areas recognizes that, from a practicalstandpoint, achieving conservation goals within pro-tected areas is easier than adding currently unprotectedareas.
Using dynamic model results to refinethe reserve selection process
In the second stage of SITES modeling, we addedgoals derived from the PATCH models for grizzly bear,wolf, and wolverine. These goals can be conceptualizedas representing information on two characteristics ofpotential reserve locations: their irreplaceability andvulnerability (Margules and Pressey 2000). Irreplace-ability provides a quantitative measure of the relativecontribution that different areas make to reaching con-servation goals, thus helping planners to choose amongalternative sites. Irreplaceability can be defined in twoways: (1) the likelihood that a particular area is neededto achieve an explicit conservation goal; or (2) theextent to which the options for achieving an explicitgoal are narrowed if an area is not conserved (Presseyet al. 1994, Margules and Pressey 2000). Irreplace-ability in this context is the relative value of an areaas source habitat (lambda, or population growth rate,from the PATCH model). Although measured at thescale of an individual territory, it can also be sum-marized at the scale of a region or of the planning unitsused in the SITES model. Source habitat is an appro-priate metric because it is the key to population per-sistence (Pulliam 1988). Vulnerability is measured hereas the predicted decline in demographic value (lambda)over the next 25 years.
An approach that sets priority areas for conservationaction based on both their irreplaceability and vulner-ability is practical because it acknowledges that a com-pleted reserve network will not be achieved immedi-ately. Therefore, we must minimize the loss to con-servation during an interim period when new reservesare being established in some areas while habitat losscontinues elsewhere (Pressey and Taffs 2001). Ideally,we would directly interface optimization models andSEPMs to choose the reserve design that most effi-ciently maximizes viability for all target species. Dueto computational limits, however, it is not possible toevaluate the transient population dynamics resultingfrom landscape change for each of the million iterativesolutions produced in a single SITES run. Therefore,we attempted to build sensitivity to population dynam-ics and landscape change into SITES by assessing ir-replaceability on a site-by-site basis, using our dynamicpopulation model output. Because in this step we eval-uate irreplaceability separately for each species, our

December 2003 1779RESERVE SELECTION AND PVA
use of the term is not entirely equivalent to previousdefinitions that simultaneously considered multipleconservation goals (e.g., Margules and Pressey 2000).Values were plotted on a graph of irreplaceability (y-axis) vs. vulnerability (x-axis) and the graph was di-vided into four quadrants, following the procedure ofMargules and Pressey (2000). The upper right quadrant,which includes areas with high irreplaceability andhigh vulnerability, comprises the highest priority sitesfor conservation. This top tier is followed by the upperleft and lower right quadrants, not necessarily in thatorder. The upper left quadrant contains areas of rela-tively secure source habitat. Areas in the lower rightquadrant include sink habitats whose protection wouldenhance population viability by reducing mortalityrates of animals dispersing from adjacent high-qualitysources. Finally, the lower left quadrant comprises ar-eas that are putatively replaceable (low source value)and face less severe threats. We used two PATCH-basedgoals per species. One goal targeted areas with a highsource value and high threat (the upper right quadrantof the graph). A second goal targeted highest valuesource habitats (the upper portions of both upper quad-rants). By capturing both types of habitat, short-termrange contraction could be halted by protecting themost vulnerable sources while protecting enough se-cure sources to maintain viability over the long term.No goals were set for representing the lower right quad-rant (threatened sinks) within reserves, as these areas,which often include human settlements, may benefitmore from alternate management strategies that reduceconflicts between humans and carnivore species.
Setting conservation goals in a reserve selection al-gorithm is often difficult because information is un-available on the threshold amount of habitat necessaryto insure population viability. To address this questionand factors such as connectivity that are ignored bySITES, we used PATCH to evaluate the incrementalgain from adding areas selected in the SITES modeling.These results differed from adding PATCH-deriveddata to the SITES model itself, because we evaluatedhow the potential new reserves function as a networkto conserve viable populations as the landscape chang-es over time. We performed this evaluation for the griz-zly bear and wolf, the species for which we had themost developed and accurate PATCH models, as val-idated by independent data (Carroll et al. 2002). Ad-ditionally, the general results from the PATCH mod-eling suggest how reserve design rules may differ be-tween species regarding connectivity and patterns ofthreat. We built an overall conservation design by start-ing from the best run solution from SITES and addingadditional areas to serve as linkages, based on infor-mation on regional population structure derived fromthe PATCH models. Once information on the generallocation of linkages was derived from PATCH, the ex-act location was determined using the SITES summedruns results, which identify areas that are nearly as
important as those included in the best run. We describehere one such corridor addition in the area between theCanadian Mountain Parks and the Northern ContinentalDivide Ecosystem (NCDE; see Fig. 1). This area in-cludes the proposed Southern Rocky Mountains Con-servation Area (SRMCA; Fig. 1), which is currently(2002) being reviewed for inclusion in the protectedareas system. We evaluated whether this area was se-lected in the SITES solutions, and if not, whether itsinclusion affected carnivore distribution as predictedby the PATCH model.
Comparing networks for carnivoresand other conservation goals
The use of particular focal species in developingregional conservation plans (Carroll et al. 2001a), com-plements two other major tracks of conservation plan-ning: special elements and ecosystem representation(Noss and Cooperrider 1994, Noss et al. 2002). Thespecial elements approach concentrates on occurrencesof imperiled species, plant communities, and other rarenatural features, as are found in conservation data cen-ter databases (Groves et al. 2000). The representationapproach seeks to capture examples of all geoclimaticor vegetation types in a network of protected areas. Wecould assess the ability of carnivore-based reserve de-signs to serve other conservation goals in the centralportion of our study region (Fig. 1), with the help ofdata on noncarnivore goals developed in The NatureConservancy/Nature Conservancy of Canada (TNC)’splanning process for the Canadian Rockies ecoregion.Five of the carnivore species from the larger analysis(grizzly bear, wolf, lynx, wolverine, and fisher) wereidentified as conservation targets for the CanadianRockies region by TNC’s planning team. We used thevalues from the static models for these five species astargets in the SITES analysis. TNC identified specialelement targets by considering species with Heritageranks of G1 (critically imperiled globally) to G3 (vul-nerable globally), and then added other species of con-cern due to factors including declining populations orstatus as an endemic, disjunct, or vulnerable population(Rumsey et al. 2003). Element occurrence data wereassembled for several types of conservation targets,including rare vascular and nonvascular plant species,rare plant communities, terrestrial animals that are ei-ther rare (six gastropods) or declining (four amphibi-ans, one butterfly, and two mammals), and breedingsites for eight bird species that are declining or of spe-cial concern. The special element goals for the SITESruns sought to capture a set proportion of the knownoccurrences of each species or community type. Alloccurrences of the rarest elements were targeted. Formore common species, the goal was the proportion ofthe known occurrences thought to be sufficient to insureviability of the population (Groves et al. 2000).
Ecosystem-based conservation strategies include thegoal of representing all major environmental gradients.

1780 CARLOS CARROLL ET AL. Ecological ApplicationsVol. 13, No. 6
This ‘‘coarse filter’’ is hypothesized to capture occur-rences of species about which little is known and there-fore would not be captured by the special elements orfocal species approaches (Groves et al. 2000). In theabsence of good maps of how plant communities aredistributed in response to environmental gradients,TNC developed representation goals based on Ecolog-ical Land Units (ELUs) derived from abiotic variablessuch as elevation, landform, slope, aspect, hydrologicregime, and surficial geology (Rumsey et al. 2003). Thecoarse-scale map of potential vegetation type or bio-geoclimatic zone (Demarchi and Lea 1992) was thenoverlaid on the ELUs across the entire ecoregion. Rep-resentation targets were set at 10% of each ELU/veg-etation type combination, and at least 30% of eachvegetation type.
SITES scenarios that build reserve networks by firstincluding existing protected areas are generally themost informative for practical planning. For this com-parison, however, we did not lock in protected areas,in order to assess the distribution of biodiversity acrossthe landscape without regard to political boundaries.We compared two contrasting networks based on car-nivore goals or noncarnivore goals.
RESULTS
Static models
Comparison of management categories with predic-tions of habitat suitability from the static models sug-gests that current protected areas hold a higher thanexpected amount of habitat for the wolverine, lowerthan expected for the lynx and fisher, and a percentagesimilar to its proportion of the region (17.2%) for theother species. Nonreserved public lands, which makeup 58.2% of the region, tend to be more valuable thanexpected based on area, but especially so for lynx andmarten, and also for wolf, wolverine, and mountainlion. Private lands are less valuable than expected bytheir percentage of the region (24.6%), but have dis-proportionately high value for wolf, fisher, and blackbear. Areas of high biological productivity and rela-tively low human influence between Jasper and Musk-wa Parks and in northcentral Idaho (Fig. 1) were mostfrequently selected in the SITES runs.
Dynamic models
The results of the dynamic models support manyconclusions from the static models, but add informationon the likely reduction in occupancy due to landscapechange and on the distribution of sources and sinks.Predicted changes in occupancy for grizzly bear showsemi-disjunct refugia in the northern United Statesthreatened on their margins by habitat loss (Fig. 3).More extensive range contraction and fragmentationare evident in southern Canada, where higher elevationcore areas are fragmented by localized strong sinks,and fringed on the southern edge by a retreating range
margin of extensive sink habitat. The pattern of sourceand sink distribution indicates that even where the spe-cies persists, we will see the early stages of extirpation,in which previously continuous habitat is fragmentedby development along road corridors and river valleys.Although the results for the wolf suggest that the po-tential currently exists for recolonizing animals to ex-pand into much of the Rocky Mountains of the northernUnited States, these areas are threatened over the long-term with the prospect of becoming sinks (Fig. 3). Sinkhabitat for the wolf is more concentrated in productivelowlands than in rugged southeastern British Columbia.The wolverine has greater dispersal ability than thegrizzly bear (Weaver et al. 1996). This allows smallersouthern wolverine populations to remain demograph-ically connected to the more continuous northern pop-ulations (Kyle and Strobeck 2001). Nevertheless, areasof demographic vulnerability exist even in the core ofwolverine range in the larger study area (Fig. 3).
Using dynamic model results to refinethe reserve selection process
In the second stage of the SITES modeling, we addedtwo PATCH-based goals per species (Fig. 2). A mapof habitat that meets the two goals for grizzly bear (Fig.4) shows the contrast between areas scoring highly forthe two goals. SITES solutions that considered onlythe three carnivore species (grizzly bear, wolf, and wol-verine) for which we had PATCH-based goals alloweda detailed comparison of static and dynamic model-based priorities. The static model-based sites are moreconcentrated at the edges of existing parks and in coreareas in northern British Columbia, whereas thePATCH-based sites are found in vulnerable areas in thesouthern portion of the study region and in buffer zonesin northern British Columbia. SITES solutions for thethree species using the PATCH-based goals are slightlymore efficient than those based on static models. Anetwork based on PATCH goals requires 26.7% of theregion to achieve the same level of potential grizzlybear population size shown by a static model-basednetwork covering 30.8% of the region (n 5 198, t 52495, P , 0.0001 for two-sample t test for significantdifference between the two means). This is equivalentto a reduction in size of the necessary reserve networkby ;30 000 km2.
Because networks based on both the eight static mod-els and the PATCH results appear more efficient thanthose using the static models alone (Table 3), we usedthe former approach for all of our final SITES runs.The best run for the lowest set of goals (30% regional/20% local) encompasses 27% of the region, that is,existing protected areas (17%) plus an additional 10%of the region. For the 40%/30% and 50%/30% goals,network size increases to 36% and 45% of the region,respectively, with ;10% on private land. Therefore,the percentage of the networks that is on currently non-

December 2003 1781RESERVE SELECTION AND PVA
FIG. 3. Reduction in equilibrium probability of occupancy, or potential carrying capacity, due to landscape change from2000 to 2025 for (A) grizzly bear, (B) gray wolf, and (C) wolverine, as predicted by the PATCH model.

1782 CARLOS CARROLL ET AL. Ecological ApplicationsVol. 13, No. 6
FIG. 4. Example of SEPM-based goals used in reserve selection (SITES) runs. Areas shown in black lie in Quadrant 1(top right) of the irreplaceability/vulnerability graph for grizzly bear, that is, areas with both high value as source habitatsand high threat. Areas shown in gray are the highest value source habitats, that is, the upper portions of quadrants 1 and 2(top left) of the irreplaceability/vulnerability graph for grizzly bear. Areas that meet both goals are shown in black.
TABLE 3. Summary of SITES networks and results of evaluation of networks using the PATCH model.
Network goals (%)
Regional LocalTotal of
region (%)
Percentage by category†
1 2 3 4
RSF habitat value (%)
Grizzly bear Wolf Wolverine
304050
203030
27.336.444.6
342622
221815
354452
91211
30.140.150.1
31.041.152.1
34.844.657.0
Current areas 17.2 59 41 NA NA 19.2 19.8 23.6
† Management categories are defined according to the GAP Analysis program system: 1, strictly protected; 2, moderatelyprotected; 3, general public lands; 4, general private lands.

December 2003 1783RESERVE SELECTION AND PVA
TABLE 3. Extended.
Percentage of current carryingcapacity (PATCH model)
Grizzly bear Wolf Wolverine
Total regional carrying capacity in 2025(percentage of 2000 carrying capacity)
Grizzly bear Wolf
33.243.254.822.9
29.939.950.919.1
35.445.258.025.2
95.4101.3104.3
85.6
97.4103.7105.9
86.2
reserved public lands grows in size from 34% to 52%as goals increase (Table 3).
We found that a landscape with no additional pro-tected areas would lose 13.8% (wolf), 14.4% (grizzlybear), and 15.8% (wolverine) of its long-term carryingcapacity within 25 years (Table 3). Losses in scenariosin which only private lands were developed were 7.3%for the wolf and 6.1% for the grizzly bear. However,range loss is unevenly distributed. Protecting sitesidentified using a 30% regional/20% local goal wouldreduce the expected loss due to landscape change to4.6% (grizzly bear) and 2.6% (wolf) from current car-rying capacity. Protecting sites identified using a 40%regional/30% local goal would result in a 1.3% (grizzlybear) to 3.7% (wolf) gain over current carrying capacity(Table 3).
Networks of increasing size capture a linearly in-creasing percentage of static habitat value. This rela-tionship is similar for the three species (Table 3). Theseresults offer no surprises. However, when we projectedcurrent development trends to 2025 and used thePATCH model to assess how the alternative networksfunction in an increasingly developed matrix, we ob-tained results that would not have been anticipated fromthe static model. The results suggest the existence ofthresholds in the effect of increased habitat protectionon population viability (Fig. 5, Table 3). Increasingnetwork size has the greatest effects on population vi-ability up to ;37% of the study region (Fig. 5A).
When we contrasted the future distribution of grizzlybear and wolf under current levels of protected areasto that under the 40% regional/30% local SITES net-work (Fig. 6), we found that adding sites in the trans-boundary region prevented the loss of connectivity be-tween the NCDE and the Canadian Rocky MountainParks and sustained smaller grizzly bear subpopula-tions in southeastern British Columbia and the northernUnited States. Larger networks also may restore con-nectivity between the Greater Yellowstone Ecosystem(GYE) and central Idaho for grizzly bear. The wolfshowed similar, but more broadly distributed, increasesin distribution (Fig. 6). Although sites in the northernportion of the study area would help to increase pop-ulations there, much of the increase in wolf distribution(as opposed to abundance) would be in the U.S. north-
ern Rockies, especially between the GYE and centralIdaho (Fig. 6).
The vulnerability of the NCDE to isolation supportedthe addition of a corridor linking it to northern carni-vore populations. Our potential corridor, the SouthernRocky Mountains Conservation Area (SRMCA; seeFig. 1), was not selected in the SITES solutions due tomoderate levels of human-associated development.However, the addition of the SRMCA to the networkappears to be effective in preserving a continuous dis-tribution of grizzly bear and wolf between the CanadianMountain Parks and the NCDE (Fig. 6A, B).
Integrating the sites and patch results intoconservation planning
A landscape prioritization that locks in existing pro-tected areas and uses both static models for the eightspecies and PATCH-based goals for three species (Fig.7) suggests priorities for one or more new protectedareas in northcentral British Columbia between JasperNational Park and the Muskwa-Kechika area, a possibleeastern addition to the Muskwa-Kechika protectedarea, and new protected areas in north-central Idaho.Carnivore target levels were set here at 40% regional/30% local, based on the PATCH evaluation (Fig. 5).Networks based on more modest goals generally iden-tified priority areas in the same regions (i.e., nestedwithin the priority areas shown here). Potential bufferand linkage areas can be identified from the summed-runs solution for the 40%/30% goals (Fig. 7).
Comparing networks for carnivores and otherconservation goals
Setting carnivore goals to 35% in the CanadianRockies ecoregion produced a reserve network of thesame size as one constructed from special elements andrepresentation goals; 55% of the area was shared be-tween the carnivore and noncarnivore reserve net-works. Areas of overlap tended to have both high bi-ological productivity and low human impacts. TheSITES solution based on representation and special el-ement goals alone offered more balanced protection tothe carnivore focal species than did current protectedareas, which are predominantly at higher elevations.The network captured 30–34% of the total habitat value

1784 CARLOS CARROLL ET AL. Ecological ApplicationsVol. 13, No. 6
FIG. 5. Responses of grizzly bear and wolf populations,as predicted by the PATCH model, to reserve networks ofvarying size, in (A) the study region as a whole and (B) theCanadian Rockies ecoregion.
for the different carnivore species. Value captured wasslightly lower for lynx (30.4%) and fisher (30.7%), andhigher for grizzly bear (33.3%), wolverine (33.7%),and wolf (34.0%). Current protected areas, which con-sist of ;22.6% of the region, provide disproportion-ately large habitat value for wolverine (31.6%), grizzlybear (25.5%), and wolf (23.5%), but perform poorlyfor lynx (17.7%) and especially fisher (9.9%); see Car-roll et al. (2001a).
A SITES solution developed from carnivore goalsonly (the 35% level) suggests that a diverse set of car-nivore species produces a better ‘‘umbrella’’ effect thanany single species. Nevertheless, coverage of noncar-nivore goals varied widely depending on the specificgoal (Table 4). Overall, coverage of special elementswas poorer than coverage of representation targets.This may be partially an artifact of the lack of surveysfor rare species in the northern portions of the region.This area also contains the best carnivore habitat, lead-ing to artificially poor congruence between carnivoreand special elements goals. Whereas the percentage oftargets covered by carnivores ranged from 19% (non-vascular plants) to 50% (birds) for special elements,carnivores covered 76% of the representation targets(Table 4).
DISCUSSION
The approach to reserve design used here integratespopulation viability analysis tools such as spatially ex-plicit population models (SEPMs) with reserve selec-tion algorithms to build flexible and biologically re-alistic conservation strategies. By linking demographyto mapped habitat characteristics, the SEPMs revealhow these areas may influence the overall viability ofthe region’s carnivore species under current and futureconditions. Our approach may be most applicable inregions where much of the landscape has not yet beendeveloped and thus is ‘‘available’’ for conservation;because of this lack of development, intensive biodi-versity surveys (e.g., of rare species locations) havenot been conducted. In this type of region, the focalspecies approach is relevant because options for re-taining regional landscape connectivity remain andthere is a need to incorporate surrogates that can com-pensate for the lack of data on many taxa.
The models help to elucidate the contrasting patternsof distribution among the eight carnivore species (Car-roll et al. 2001a). The species can be grouped alongtwo axes of habitat association (Carroll et al. 2001a):an axis ranging from habitat generalists sensitive tohuman impact to human-tolerant forest specialists(Mattson et al. 1996) and an axis of topographic tol-erance (use or avoidance of rugged terrain). These pat-terns imply that the current distribution of protectedareas, concentrated in the most rugged portions of thestudy area (the central Canadian Rockies), should beaugmented by new conservation areas in regions oflower topographic relief and higher biological produc-
tivity that still have mild enough human impacts tosupport the large carnivores. Our results identify atleast two such areas: north-central Idaho (Carroll et al.2001a) and the area between the Canadian MountainParks and Muskwa-Kechika protected areas in BritishColumbia (Fig. 1). Comparison of model predictionswith new survey data sets suggests that both static anddynamic models were relatively robust for the largecarnivores, whereas distribution of the lesser knownmesocarnivores was more difficult to predict, espe-cially on a local scale (Carroll et al. 2002). Althoughthe PATCH model may predict current distribution witha level of accuracy similar to that of the simpler staticmodel, the insights that it produces concerning popu-lation processes and response to future scenarios justifyits use. Nevertheless, the level of uncertainty that prop-agates through the SITES and PATCH modeling sug-gests that the final reserve design (Fig. 7) should beused to identify generalized areas of conservation em-phasis rather than exact management boundaries. Thelevel of uncertainty is partially quantified by the SITESsummed-runs results (Fig. 7).
The dynamic model results concern those carnivoresmost sensitive to direct human impacts: grizzly bear,wolf, and wolverine. Some overlap in core areas andcritical linkages is evident among these three species.

December 2003 1785RESERVE SELECTION AND PVA
FIG. 6. Contrast in long-term persistence probability, as predicted by the PATCH model, for (A) grizzly bear and (B)wolf, under current trends extrapolated to 2025 (gray) and with new conservation areas based on the 40% regional/30% localgoals network (gray plus black). Only areas with long-term persistence probability .50% are shown.
The interplay of habitat productivity and mortality risk,however, is mediated by the species’ differing ecolog-ical resilience, as expressed in their demographic andsocial structure (Weaver et al. 1996). These differencesresult in greater contrasts in the distribution patternsand conservation priorities among the species thanwould be expected based on habitat associations alone(Fig. 3).
Focal-species planning based on dynamic modelsdiffers from that based purely on habitat suitability, inthat the most threatened areas in the irreplaceability/vulnerability graphs do not necessarily face the highestlevel of development pressure, but qualify because oftheir locations adjacent to large source populations(Fig. 4). This makes habitat degradation in these areasa major demographic threat to regional carnivore pop-ulations. Improving conditions in strong sinks can beas important to regional viability as protecting strongsources because of their effect on neighboring sourcehabitat. Decisions concerning whether to protect themost vulnerable areas or more secure habitat can bemade based, in part, on the strategic time line and pol-icy focus of a particular conservation organization orland management agency.
Coordinated management strategies addressing hab-itat and connectivity across national, state, and pro-vincial boundaries are critical to the survival of car-nivores in the Rocky Mountain region (Paquet and
Hackman 1995, Noss et al. 1996). Trade-offs must beaddressed between allocating scarce conservation re-sources toward protecting relatively secure core areas,stemming the degradation of threatened buffer zones,or restoring linkages that are already degraded butmight contribute to long-term persistence of metapop-ulations. The combination of data on irreplaceabilityand vulnerability allows us to develop a defensible in-cremental strategy linking immediate conservationneeds with longer term goals for a comprehensive con-servation network. Although we refer to areas identi-fied in the selection algorithms as potential reserves,they may be categorized more broadly as focal areasfor carnivore conservation that may require variouspolicy changes, ranging from designation of new re-serves to restrictions on specific activities such as trap-ping or development.
When we use the PATCH model to compare SITESnetworks of different size across the study region as awhole, thresholds are evident that help us answer thequestion ‘‘How much is enough?’’ to ensure carnivorepopulation viability. Our approach allows conservationplanners to move beyond such simple design rules as‘‘bigger is better’’ and ‘‘connected is better than dis-connected,’’ to rigorous and defensible design pre-scriptions. The completed reserve designs include areasidentified in the SITES runs that use both static-modeland PATCH-based goals, and add additional linkage
1786 CARLOS CARROLL ET AL. Ecological ApplicationsVol. 13, No. 6
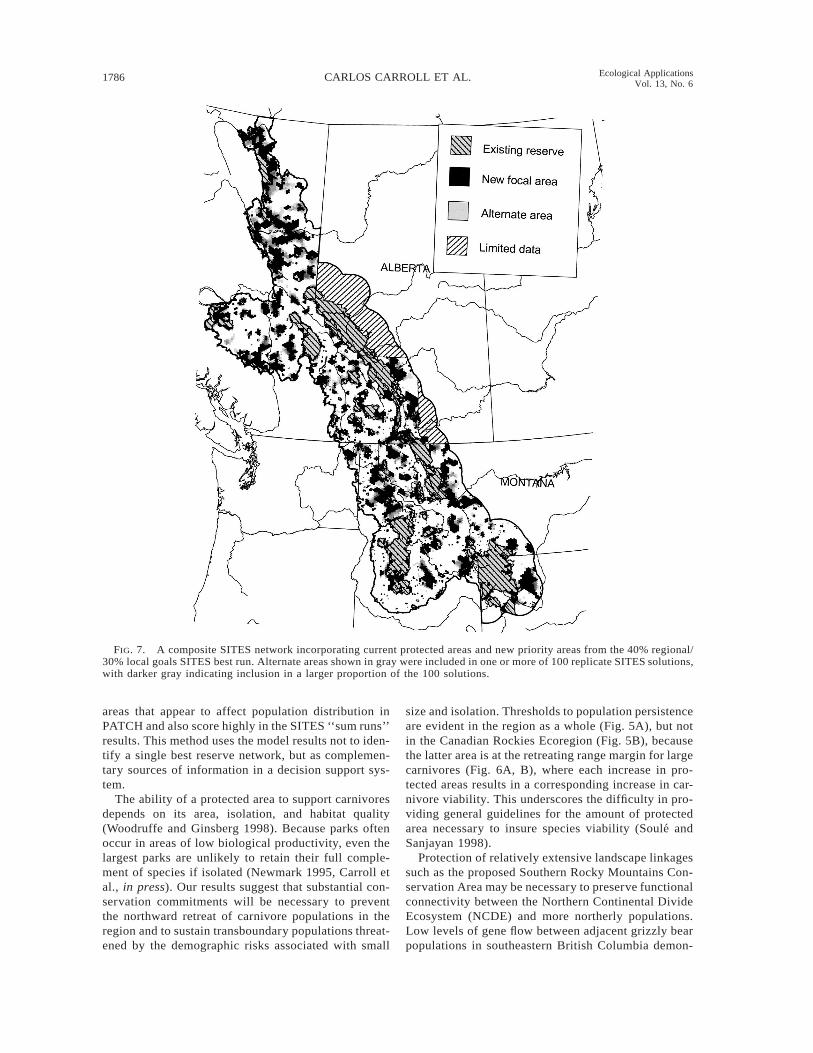
FIG. 7. A composite SITES network incorporating current protected areas and new priority areas from the 40% regional/30% local goals SITES best run. Alternate areas shown in gray were included in one or more of 100 replicate SITES solutions,with darker gray indicating inclusion in a larger proportion of the 100 solutions.
areas that appear to affect population distribution inPATCH and also score highly in the SITES ‘‘sum runs’’results. This method uses the model results not to iden-tify a single best reserve network, but as complemen-tary sources of information in a decision support sys-tem.
The ability of a protected area to support carnivoresdepends on its area, isolation, and habitat quality(Woodruffe and Ginsberg 1998). Because parks oftenoccur in areas of low biological productivity, even thelargest parks are unlikely to retain their full comple-ment of species if isolated (Newmark 1995, Carroll etal., in press). Our results suggest that substantial con-servation commitments will be necessary to preventthe northward retreat of carnivore populations in theregion and to sustain transboundary populations threat-ened by the demographic risks associated with small
size and isolation. Thresholds to population persistenceare evident in the region as a whole (Fig. 5A), but notin the Canadian Rockies Ecoregion (Fig. 5B), becausethe latter area is at the retreating range margin for largecarnivores (Fig. 6A, B), where each increase in pro-tected areas results in a corresponding increase in car-nivore viability. This underscores the difficulty in pro-viding general guidelines for the amount of protectedarea necessary to insure species viability (Soule andSanjayan 1998).
Protection of relatively extensive landscape linkagessuch as the proposed Southern Rocky Mountains Con-servation Area may be necessary to preserve functionalconnectivity between the Northern Continental DivideEcosystem (NCDE) and more northerly populations.Low levels of gene flow between adjacent grizzly bearpopulations in southeastern British Columbia demon-

December 2003 1787RESERVE SELECTION AND PVA
TABLE 4. Capture of noncarnivore targets by a carnivore-based network for the CanadianRockies ecoregion. Because targets are stratified geographically, several targets may beassociated with each species.
Class of targetNumber of
targets Number metPercentage
metAverage
shortfall (%)
Vascular plantsNonvascular plantsBirdsGastropodsAmphibiansRare mammalsCarnivores
215573612141155
561118
163
55
261950
84327
100
899489949490NA
ButterfliesRare plant communitiesELU/Vegetation typesMatrix plant communitiesRiparian communitiesPatch plant communitiesWetlandsTotal (excluding carnivores)
5105
30527534
17011
3796
240
2327261786
72600
4038763550516468
9095746446745878
strate that functional connectivity already may havebeen lost for this species in some parts of the trans-boundary region (Proctor 2001). Potential linkages areunlikely to be chosen by reserve selection algorithmsbecause they traverse an area of ongoing range frag-mentation and high development threat, and thereforehave only moderate habitat suitability. Current methodsof adding design criteria to selection algorithms, suchas the Boundary Length Modifier used in SITES (An-delman et al. 1999), cannot address these issues (Briers2002). Connectivity is not an abstract feature of land-scapes, but rather concerns population processes suchas dispersal (Beier and Noss 1998). Therefore, this fac-et of reserve design may be where mechanistic modelssuch as SEPMs are most useful.
Presence or absence of individuals is often a poorindicator of the importance of an area for maintainingpopulation viability (Tyre et al. 2001). Our PATCHresults suggest that reserve design based only on statichabitat suitability models may be poor at conservingspecies that are more vulnerable than expected due tounique aspects of their demography or social structure.For example, the large territory size of the wolf, whichis a social animal, may make it particularly sensitiveto mortality risk near the boundaries of reserves, aswell as to the effects of environmental stochasticity(Woodruffe and Ginsberg 1998, Carroll et al. 2003).
Viability of wide-ranging species such as carnivoresis a high priority in regions such as the Rocky Moun-tains, but this goal must increasingly be integrated withthe larger mandate of biodiversity conservation (Nossand Cooperrider 1994). Our comparison of reserve net-works designed for carnivores with those designed forother biodiversity surrogates suggests that even an in-telligently selected group of potential umbrella specieswill not coincidentally conserve rare species or otherspecial elements. In relatively undeveloped regionssuch as this one, the overlap between the goals of con-serving wide-ranging species and representing ecosys-
tems may simplify reserve design. However, neitherapproach will compensate for a lack of data on locallydistributed rare species. Lack of such information willbe a greater problem in lower latitude regions withhigher rates of endemism than present in the RockyMountains (Noss et al. 1996).
Development of complex and data-hungry modelssuch as SEPMs may seem a low priority for regionalconservation planning. Nevertheless, our results sug-gest that these models can add information on habitatthresholds and the effect of corridors that is unavailablefrom reserve selection algorithms or simple reservedesign rules. The increased efficacy of a conservationnetwork that incorporates data from SEPMs may implydifferences in the tens of thousands of square kilo-meters over a large region, which probably justifies theincreased data requirements of such models. These con-clusions appear to be robust enough to data gaps to aidconservation of the species for which the SEPMs aredeveloped. Moreover, they bring a unique componentinto the conservation planning process by requiring usto consider population viability as it relates to habitatconfiguration, in judging the effectiveness of alterna-tive reserve networks. Reserve designs based on theneeds of a well-selected group of focal species servefairly well as a coarse filter for ecosystem types, al-though they do not adequately protect localized rarespecies. Although we evaluated the overlap betweencarnivore and noncarnivore reserve designs, we did notdetermine whether the reserve configuration and con-nectivity lessons are directly applicable to a larger suiteof species. In balance, our results suggest that SEPMshave reached the stage of development at which theycan serve as a practical tool for regional conservationplanning. Although addressing viability requirementsfor carnivores appears to require a larger commitmentof the land base than do other conservation goals suchas ecosystem representation (assuming that represen-tation goals are typically modest), this may be only

1788 CARLOS CARROLL ET AL. Ecological ApplicationsVol. 13, No. 6
because we know more about the biology of individualcarnivore species. Meeting the needs of wide-rangingspecies may help to forestall the still poorly knowneffects of loss of connectivity on other species andecosystems by creating a reserve system that is a wholegreater than the sum of its parts.
ACKNOWLEDGMENTS
This study was funded by World Wildlife Fund Canada andThe Nature Conservancy and their contributors, with addi-tional support provided by The Wilburforce Foundation, theKendall Foundation, The Yellowstone to Yukon Initiative,Parks Canada, and the Calgary Foundation. ESRI (Redlands,California, USA) provided software. The information in thisdocument has been funded, in part, by the U.S. EnvironmentalProtection Agency. It has been subjected to the Agency’s peerand administrative review, and has been approved for pub-lication as an EPA document. Mention of trade names orcommercial products does not constitute endorsement or rec-ommendation for use. We are grateful to G. Mowat, M. Gi-beau, and D. Smith for sharing unpublished field data and toB. Butterfield for furnishing ecoregional planning data. Wewould like to thank the following individuals for assistance:A. Hackman, S. Price, S. Alexander, M. Andrews, M. Austin,M. Badry, V. Banci, B. Butterfield, D. Carr, J. Copeland, L.Craighead, C. Daly, S. Donelon, D. Gilbride, B. Hall, S.Herrero, D. Hillary, M. Jalkotzy, K. Kunkel, P. Lee, M. Mahr,D. Mattson, T. Merrill, M. Quinn, R. Redmond, B. Robinson,I. Ross, C. Rumsey, B. Runnels, D. Sachs, A. Shilsky, C.Stewart, J. Weaver, C. White, J. Wierzchowski, J. Williams,and M. Wood. J. Dunning, M. Turner, and one anonymousreviewer provided helpful reviews of the manuscript.
LITERATURE CITED
Andelman, S., I. Ball, F. Davis, and D. Stoms. 1999. SITESVersion 1.0: an analytical toolbox for designing ecoregionalconservation portfolios. The Nature Conservancy, Boise,Idaho. [Online: ^http://www.biogeog.ucsb.edu/projects/tnc/download.htm& (accessed 31 December 2002).]
Banci, V. 1994. Wolverine. Pages 99–127 in L. F. Ruggiero,K. B. Aubry, S. W. Buskirk, L. J. Lyon, and W. J. Zielinski,technical editors. The scientific basis for conserving forestcarnivores: American marten, fisher, lynx, and wolverine.USDA Forest Service Rocky Mtn. Forest and Range Ex-periment Station, Ft. Collins, Colorado. General TechnicalReport RM-254.
Beier, P., and R. F. Noss. 1998. Do habitat corridors provideconnectivity? Conservation Biology 12:1241–1252.
Beissinger, S. R., and D. R. McCullough, editors. 2002. Pop-ulation viability analysis. University of Chicago Press, Chi-cago, Illinois, USA.
Boyce, M. S. 1992. Population viability analysis. AnnualReview of Ecology and Systematics 23:481–506.
Boyce, M. S., and L. L. McDonald. 1999. Relating popu-lations to habitats using resource selection functions.Trends in Ecology and Evolution 14:268–272.
Briers, R. A. 2002. Incorporating connectivity into reserveselection procedures. Biological Conservation 103:77–83.
Carroll, C., R. F. Noss, and P. C. Paquet. 2000. Carnivoresas focal species for conservation planning in the RockyMountain region. World Wildlife Fund Canada, Toronto,Ontario, Canada. [Online, URL: ^http://www.wwf.ca/en/res links/rl resources.asp& (accessed December 2002).]
Carroll, C., R. F. Noss, and P. C. Paquet. 2001a. Carnivoresas focal species for conservation planning in the RockyMountain region. Ecological Applications 11:961–980.
Carroll, C., R. F. Noss, and P. C. Paquet. 2002. Rocky Moun-tain Carnivore Project—Final Report. World Wildlife FundCanada. Toronto, Ontario, Canada. [Online, URL: ^http://
www.wwf.ca/en/res links/rl resources.asp& (accessed De-cember 2002).]
Carroll, C., R. F. Noss, P. C. Paquet, and N. H. Schumaker.In press. Extinction debt of protected areas in developinglandscapes. Conservation Biology.
Carroll, C., R. F. Noss, N. H. Schumaker, and P. C. Paquet.2001b. Is the return of the wolf, wolverine, and grizzlybear to Oregon and California biologically feasible? Pages25–46 in D. Maehr, R. Noss, and J. Larkin, editors. Largemammal restoration: ecological and social challenges inthe 21st century. Island Press, Washington, D.C., USA.
Carroll, C., M. K. Phillips, N. H. Schumaker, and D. W. Smith.2003. Impacts of landscape change on wolf restorationsuccess: planning a reintroduction program using dynamicspatial models. Conservation Biology 17:536–548.
Chadwick, D. 2000. Yellowstone to Yukon. National Geo-graphic Society, Washington, D.C., USA.
Demarchi, D. A., and E. C. Lea. 1992. Regional and zonalecosystems in the Shining Mountains. Province of BritishColumbia, Ministry of Environment, Lands and Parks.Wildlife Branch, Habitat Inventory Section. Victoria, Brit-ish Columbia, Canada.
Diamond, J. M. 1975. The island dilemma: lessons of modernbiogeographic studies for the design of natural preserves.Biological Conservation 7:129–146.
Dunning, J. B., Jr., D. J. Stewart, B. J. Danielson, B. R. Noon,T. L. Root, R. H. Lamberson, and E. E. Stevens. 1995.Spatially explicit population models: current forms and fu-ture uses. Ecological Applications 5:3–11.
Fuller, T. K. 1989. Population dynamics of wolves in north-central Minnesota. Wildlife Monographs 105:1–41.
Groves, C., L. Valutis, D. Vosick, B. Neely, K. Wheaton, J.Touval, and B. Runnels. 2000. Designing a geography ofhope: a practitioner’s handbook for ecoregional conser-vation planning. The Nature Conservancy, Arlington, Vir-ginia, USA.
Huete, A. R., H. Q. Liu, K. Batchily, and W. van Leeuwen.1997. A comparison of vegetation indices over a globalset of TM images for EOS-MODIS. Remote Sensing of theEnvironment 59:440–451.
Kareiva, P., D. Skelly, and M. Ruckelshaus. 1996. Reeval-uating the use of models to predict the consequences ofhabitat loss and fragmentation. Pages 156–166 in S. T. A.Pickett, R. S. Ostfeld, M. Schachak, and G. E. Likens,editors. The ecological basis of conservation: heteroge-neity, ecosystems, and biodiversity. Chapman and Hall,New York, New York, USA.
Kareiva, P., and U. Wennergren. 1995. Connecting landscapepatterns to ecosystem and population processes. Nature373:299–302.
Kyle, C. J., and C. Strobeck. 2001. Genetic structure of NorthAmerican wolverine (Gulo gulo) populations. MolecularEcology 10:337–347.
Lambeck, R. J. 1997. Focal species: a multi-species umbrellafor nature conservation. Conservation Biology 11:849–856.
Manly, B. F. J., L. L. McDonald, and D. L. Thomas. 1993.Resource selection by animals. Chapman and Hall, NewYork, New York, USA.
Margules, C. R., and R. L. Pressey. 2000. Systematic con-servation planning. Nature 405:243–253.
Mattson, D. J., S. Herrero, R. G. Wright, and C. M. Pease.1996. Designing and managing protected areas for bears:how much is enough? Pages 133–164 in R. G. Wright,editor. National parks and protected areas: their role inenvironmental protection. Blackwell Science, Cambridge,Massachusetts, USA.
Merrill, T., D. J. Mattson, R. G. Wright, and H. B. Quigley.1999. Defining landscapes suitable for restoration of griz-

December 2003 1789RESERVE SELECTION AND PVA
zly bears (Ursus arctos) in Idaho. Biological Conservation87:231–248.
Mowat, G., and C. Strobeck. 2000. Estimating populationsize of grizzly bears using hair capture, DNA profiling, andmark–recapture analysis. Journal of Wildlife Management64:183–193.
Newmark, W. D. 1995. Extinction of mammal populationsin western North American national parks. ConservationBiology 9:512–526.
Noss, R. F. 1993. A bioregional conservation plan for theOregon Coast Range. Natural Areas Journal 13:276–290.
Noss, R. F., C. Carroll, K. Vance-Borland, and G. Wuerthner.2002. A multicriteria assessment of the irreplaceability andvulnerability of sites in the Greater Yellowstone Ecosys-tem. Conservation Biology 16:895–908.
Noss, R. F., and A. Cooperrider. 1994. Saving nature’s legacy:protecting and restoring biodiversity. Island Press, Wash-ington, D.C., USA.
Noss, R. F., H. B. Quigley, M. G. Hornocker, T. Merrill, andP. C. Paquet. 1996. Conservation biology and carnivoreconservation in the Rocky Mountains. Conservation Bi-ology 10:949–963.
Paquet, P. C., and A. Hackman. 1995. Large carnivore con-servation in the Rocky Mountains. World Wildlife FundCanada, Toronto, Ontario, Canada, and World WildlifeFund U.S., Washington, D.C., USA.
Pease, C. M., and D. J. Mattson. 1999. Demography of theYellowstone grizzly bears. Ecology 80:957–975.
Possingham, H. P., I. R. Ball, and S. Andelman. 2000. Math-ematical methods for identifying representative reserve net-works. Pages 291–306 in S. Ferson and M. Burgman, ed-itors. Quantitative methods for conservation biology.Springer-Verlag, New York, New York, USA.
Pressey, R. L., T. C. Hager, K. M. Ryan, J. Schwarz, S. Wall,S. Ferrier, and P. M. Creaser. 2000. Using abiotic data forconservation assessments over extensive regions: quanti-tative methods applied across New South Wales, Australia.Biological Conservation 96:55–82.
Pressey, R. L., I. R. Johnson, and P. D. Wilson. 1994. Shadesof irreplaceability: towards a measure of the contributionof sites to a reservation goal. Biodiversity and Conservation3:242–262.
Pressey, R. L., H. P. Possingham, and C. R. Margules. 1996.Optimality in reserve selection algorithms: When does itmatter and how much? Biological Conservation 76:259–267.
Pressey, R. L., and K. H. Taffs. 2001. Scheduling conser-vation action in production landscapes: priority areas inwestern New South Wales defined by irreplaceability andvulnerability to vegetation loss. Biological Conservation100:355–376.
Proctor, M. 2001. Grizzly bear habitat and population frag-mentation in the Central Selkirk Mountains and surround-ing region of southeast British Columbia. Unpublished re-port to Forest Renewal British Columbia, Nelson, BritishColumbia, USA.
Pulliam, R. 1988. Sources, sinks, and population regulation.American Naturalist 132:652–661.
Rumsey, C., et al. 2003. Canadian Rocky Mountains ecore-gional assessment. Volume One. Report. Nature Conser-vancy of Canada, Victoria, British Columbia, Canada.
Schumaker, N. H. 1998. A user’s guide to the PATCH model.EPA/600/R-98/135. U.S. Environmental Protection Agency,Environmental Research Laboratory, Corvallis, Oregon. [On-line, URL:^http://www.epa.gov/naaujydh/pages/models/patch/patchmain.htm& (accessed 31 December 2002).]
Scott, J. M., F. Davis, B. Csuti, R. Noss, B. Butterfield, C.Groves, J. Anderson, S. Caicco, F. D’Erchia, T. C. Edwards,J. Ulliman, and R. G. Wright. 1993. Gap analysis: a geo-graphical approach to protection of biological diversity.Wildlife Monographs 123.
Soule, M. E., and M. A. Sanjayan. 1998. Conservation tar-gets: do they help? Science 279:2060–2061.
Statistics Canada. 1997. A national overview: 1996 Censusof Canada. Publication 93-357-XPB. Industry Canada, Ot-tawa, Ontario, Canada.
Tyre, A. J., H. P. Possingham, and D. B. Lindenmayer. 2001.Inferring process from pattern: can territory occupancy pro-vide information about life history parameters? EcologicalApplications 11:1722–1737.
U.S. Census Bureau. 1991. Census of the United States:1990. U.S. Government Printing Office, Washington, D.C.,USA.
Van Horne, B. 1983. Density as a misleading indicator ofhabitat quality. Journal of Wildlife Management 47:893–901.
Weaver, J. L., P. C. Paquet, and L. F. Ruggiero. 1996. Re-silience and conservation of large carnivores in the RockyMountains. Conservation Biology 10:964–976.
Woodruffe, R., and J. R. Ginsberg. 1998. Edge effects andthe extinction of populations inside protected areas. Sci-ence 280:2126–2128.


