use of ordered mixtures to obtain high dose homogeneity in mini-tablets
69
Master Thesis for the degree Master of Pharmacy USE OF ORDERED MIXTURES TO OBTAIN HIGH DOSE HOMOGENEITY IN MINI-TABLETS STUDIES OF ORALLY DISINTEGRATING SYSTEMS FOR CHILDREN Fredrik Sandberg Løding Tromsø 2011 Supervisors Professor Ingunn Tho Dr. Sofia Mattsson Drug Transport and Delivery Research Group Department of Pharmacy University of Tromsø
Transcript of use of ordered mixtures to obtain high dose homogeneity in mini-tablets

Master Thesis for the degree Master of Pharmacy
USE OF ORDERED MIXTURES TO OBTAIN
HIGH DOSE HOMOGENEITY IN MINI-TABLETS STUDIES OF ORALLY DISINTEGRATING SYSTEMS FOR
CHILDREN
Fredrik Sandberg Løding
Tromsø 2011
Supervisors
Professor Ingunn Tho
Dr. Sofia Mattsson
Drug Transport and Delivery Research Group
Department of Pharmacy
University of Tromsø

2

3
TABLE OF CONTENTS
TABLE OF CONTENTS 3
ACKNOWLEDGEMENT 6
ABSTRACT 7
1. Introduction 9
1.1 Powder mixtures 9
1.1.1 Definitions 9
1.1.2 Sampling 10
1.1.3 Homogeneity 11
1.2 Powder mixing 12
1.2.1 Mixing mechanisms 12
1.2.2 Mixing equipments 12
1.3 Powder segregation 13
1.4 Particle characteristics 14
1.4.1 Particle size 14
1.4.2 Particle shape 16
1.4.3 Particle density 17
1.4.4 Particle external surface area 18
1.5 Ordered mixtures 18
1.5.1 General 18
1.5.2 Estimation of surface coverage 19
1.5.3 Examples of use of ordered mixtures 19
1.6 Mini-tablets 20
1.7 Orally disintegrating tablets 21
1.8 Suitable formulations for paediatric patients 22
2. Aim of the study 23

4
3. Materials and methods 24
3.1 Materials 24
3.2 Particle characterisation of raw materials 25
3.2.1 Sieving analysis 25
3.2.2 Fractionation of powder samples 25
3.2.2 Particle size analysis by laser diffraction 25
3.2.3 Microscopy 26
3.2.4 Scanning electron microscopy 26
3.2.5 Apparent particle density 26
3.2.6 External surface area 26
3.2.7 Estimation of diameter on micronized particles from external surface area 31
3.2.8 Bulk and tapped density 31
3.2.9 Powder flow rate and Angle of repose 32
3.3 Preparation of powder mixtures 33
3.3.1 Conventional mixture 33
3.3.2 Ordered mixture 33
3.4 Powder mixture characterization 34
3.4.1 Homogeneity 34
3.4.2 Surface coverage of micronized particles on the carrier 34
3.4.3 Scanning electron microscopy 35
3.5 The compaction of mini-tablets 35
3.5.1 Addition of lubricant 35
3.5.2 Manual filling of dies 35
3.5.3 Compaction of mini-tablets 36
3.6 Characterisation of mini-tablets 37
3.6.1 Mass variation 37
3.6.2 Friability testing 37
3.6.3 Crushing strength 37
3.6.4 Simulated wetting test 37
3.6.5 Quantification of active and dose variation in mini-tablets 38

5
4. Results and discussion 39
4.1 Particle characterisation of raw materials 39
4.1.1 Particle size of carrier materials 39
4.1.1 Particle size analysis of drug substances 41
4.1.1 Particle shape and morphology 41
4.1.2 Apparent particle density and external surface area 45
4.1.3 Powder flow properties 47
4.2 Powder mixture characterisation 49
4.2.1 Calculated degree of surface coverage for ordered mixtures 49
4.2.2 Powder flow properties 50
4.2.3 Homogeneity 51
4.2.4 Scanning electron microscopy 54
4.3 Mini-tablet characterisation 57
4.3.1 Mini-tablet mass and hardness 57
4.3.2 Homogeneity 59
4.3.3 Simulated wetting test 60
5. Conclusion 62 6. Future perspectives 62 7. References 63 8. Appendix 66
8.1 Steady state permeametry 66
8.2 Blaine permeametry 67
8.3 Temperature and humidity’s during compressions 68
8.4 Example relative standard deviation powder mixture 69

6
ACKNOWLEDGEMENT
I would first of all like to thank my supervisors Ingunn Tho and Sofia Mattson for giving me
the opportunity to work with their project. Thanks to them my interest and engagement in this
study have had high priority the last year.
I also want to thank external supervisor Sofia Mattson for a nice idea of project and for good
inputs and nice discussions forming my master thesis. Your idea of project has been a true
pleasure attending to. Your knowledge has been essential for this study we have been through
together.
I would like to give an especially thank to internal supervisor Ingunn Tho for having such
high interest in the project, coming with many good ideas and a great feedback. Thanks for a
great guidance throughout this master thesis for the degree of Master in Pharmacy and for the
knowledge you have given me. You are a great person and an outstanding leader. It has been a
pleasure working with you.
I am also grateful to Phd. Ann-Sofie Persson for assisting me with equipment and knowledge
concerning the measurements carried out in Uppsala. You made my short visit great.
Thanks also to those in the research group of Particle characterization and engineering at
Dep. Of Pharmacy in Uppsala University, that helped me during experiments and gave me
input of ideas to my master thesis. Thanks to Göran Alderborn for giving me the opportunity
to do the measurements.
Special thanks go to Hilde-Gunn Meland for many great times together during 5 years. It has
been great having you around. You have meant a lot to me. Thanks also for nice discussions,
being helpful and pushing me to work during 5 years and master thesis for the degree of
Master in Pharmacy.
Thanks also to my classmates, especially those back in Tromsø during the last year. We have
had five great years together.
Finally, the last and greatest appreciation goes to my family. Thanks for always supporting
me, showing interest in me and believing in me. You are the best!

7
ABSTRACT
Studies have shown that homogeneity is higher in ordered mixtures compared to random
mixtures. Based on this ordered mixtures should be particularly suitable for the preparation of
mini-tablets. The overall aim of the study was to compare the homogeneity of ordered
mixtures prepared using different particle size of carrier particles, and test their suitability for
preparation of mini-tablets. The mini-tablets are intended for use as orally disintegrating
systems (ODT) for children.
Granulated, spray dried and co-processed mannitol samples were used as carrier particles and
sodium salicylate and ibuprofen were studied as fine particulate drug for preparation of
ordered mixtures. For compression of mini-tablets, ordered mixtures were prepared using
mannitol samples, Pearlitol 200SD,300DC,400DC and 500DC (Pearlitol, France) in
combination with sodium salicylate (Sigma Aldrich, Germany). The drug substances were
grinded manually in mortar with pestle and screened through a sieve of 45 µm in mesh size.
Also the carrier materials were sieved in order to collect the following fractions; 180-250 µm
(Parteck ODT, Pearlitol (Flash, 200SD and 300DC)), 250-355 µm (Pearlitol 400DC) and 355-
500 µm Pearlitol 500DC. The raw materials were characterised using microscopic methods,
Helium pycnometry, steady state and Blaine permeametry, particle size analysis (laser
diffraction and sieving analysis), bulk and tapped density. Micronized sodium salicylate was
mixed with selected carrier (1% w/w) in a Turbula mixer for 24 and 48 hours (n=2).The
homogeneity of the ordered mixtures were examined by withdrawing 30 random sample units
from the powder mixtures using a micro-thief (20± 2mg). The sample units were quantified
by direct UV-assay. The amount of drug in each sample was normalised by dividing the
experimentally determined content by the theoretically calculated content. The homogeneity
of the mixtures was expressed as the relative standard deviation of the normalised values. A
conventional mixture (drug particles screened through 500 µm mesh size, mixed with
mannitol sample in Turbula mixer for 10 min), was made for a comparison of the relative
standard deviation with the relative standard deviations of the ordered mixtures.
All the ordered mixtures resulted in high dose homogeneity after 48 hours of mixing. The
lowest particle size fraction resulted in ordered mixture after 24 hours and the larger particle
size fractions needed 48 hours. The high dose homogeneity was proven also in the mini-
tablets. The conventional mixture showed poor homogeneity, but resulted in better
homogeneity when sample size increased. This proved ordered mixtures ideal solutions for
mini-tablets, as the production is dependant on homogenous powder mixtures. All mini-
tablets complied with the requirements for uniformity of mass and content for single dose

8
preparations. The mini-tablets demonstrated low friability’s, high crushing strengths and
suitable simulated wetting times with respect to European Pharmacopoeia requirements,
which made them possible to use as ODTs.

9
1. INTRODUCTION
1.1 Powder mixtures
Powder mixing is a fundamental process in pharmaceutical industry. The first step in
preparation of solid dosage forms usually consists of preparation of a powder mixture. The
powder mixtures should be made with high quality, this means high content uniformity, to
ensure a high content uniformity of the end product. This again is crucial in order for the
patients to receive accurate amounts of active ingredient.
The mixing process can be challenging, especially difficult for high potent drugs that are
given in low doses. This is because variation of drug content increases with decreasing
amount of drug. In these cases, particle size reduction is a keyword in order to achieve
homogeneity throughout an entire powder mixture. Particle size reduction can be
accomplished by grinding, for examples using mortar and pestle in small scale or by milling
on larger scales. The grinding process often results in electrostatic charging of the small
particles. The electrostatic forces can be taken advantage of by mixing with coarse particles
for preparation of ordered mixtures. Some advantages associated with ordered mixtures are
high dose homogeneity, improved dissolution rate and bioavailability, as well as prevention of
segregation.
1.1.1 Definitions
Random mixture:
Particles are mixed by movements which split and recombine the clusters of particles until
there is a possibility of an equal chance of the particles to appear at any place in any time
(figure 1a). The random mixing process results in groups of equal particles next to each other.
The requirements for making a random mixture are particles of equal size and weight, with no
surface area effects. Random mixtures have a standard deviation which decreases with
increasing sample size, when sampling.
Perfect random mixtures:
The concept is the same as for random mixture, however, the mixture is obtained when each
particle has a particle of another component in a close range. This is the point where there is
equal chance of finding a particle of a component throughout entire powder blend (figure 1b).

10
Ordered (interactive) mixtures:
An ordered mixture is considered to be completely different from a random mixture. The
mixing process relies on surface effects. An ordered mixture consists of micronized drug
particles adhering to coarser particles of another component. Ordered mixtures have been
made with almost zero variation, and they feature a higher degree of homogeneity than
random mixtures, when sampling (Yip and Hersey, 1977a, Egermann, 1980).
Perfect ordered mixture
A perfect ordered situation for a powder mixture is obtained when each particle of a
component is next to a particle of another component (Poux et al., 1991). The situation could
easily be thought of as a chessboard like pattern (figure 1c). The concept is the same as for
ordered mixture, but the standard deviation of the finer drug particles in a sample of any size
greater than one single ordered unit is zero. This is the perfect ordered mixture, and the
ultimate goal for preparation of ordered mixtures.
a) b) c)
Figure 1. Illustrations of different powder mixtures: a) random mixture, b) perfect random mixture,
c) perfect ordered mixture. Figure b and c comes from (Lelan, 1989) but found in (Poux et al., 1991).
1.1.2 Sampling
To ensure homogeneity of a powder mixture, determination is required. Since it is not
possible to test the whole powder mixture, one has to rely on taking a sufficient number of
random samples to ensure that it is representative for the whole powder mixture. This can be
realized using a powder thief (Muzzio et al., 2003). A powder thief is an equipment especially
designed for taking out defined amounts of sample units from a powder batch. A powder thief
has one or more cavities stamped in a hollow cylinder. These cavities can be opened and
closed in a controlled manner by an outer rotation or pulled down sleeve (Muzzio et al.,
1997). The powder thief is inserted into the powder with closed cavities. When insertion is
complete, the cavities are opened and powder flows into the cavities, which can be closed and

11
the powder thief is withdrawn from powder bed. By randomly sampling using a powder thief
the idea is that every particle in the powder mixtures should have an equal chance of being
chosen for homogeneity testing.
a) b) c)
Figure 2. Example of experimental use of a powder micro-thief. A sample is withdrawn for homogeneity
determination. a) Insertion-with following opening and closing of cavity, b) sample unit withdrawn,
c) sample unit is released from the cavity and weighed to check the mass
1.1.3 Homogeneity
A homogenous powder mixture is described by Blumberg and Maritz as a complete mixture,
where the chance of picking a red particle is equal throughout the whole mixture made of
different colours (Blumberg and Maritz, 1953). In this respect an ordered mixture will have
zero standard deviation of the sample concentration at all sample sizes provided that the
sample size is greater than the size of a single ordered unit described by Yip and Hersey (Yip
and Hersey, 1977a). The European Pharmacopoeia 7.2. describes the test of “uniformity of
dosage unit” (chapter 2.9.40) to ensure the consistency in dosage units. The same test may be
applied on sample units taken by random sampling from a powder mixture. The European
Pharmacopoeia recommends testing of 30 items, for a bulk powder this implies 30 sample
units. The relative standard deviation of the content of active ingredient, in the randomly
picked samples from a mixture, seems to be a common parameter used to reflect the
homogeneity in a powder mixture in literature (Mihranyan et al., 2008).

12
1.2 Powder mixing
1.2.1 Mixing mechanisms
Powder particles have to move relative to each other in order to make a powder mixture. The
mixing process of particles can be done by three different types of mechanisms known as
mixing by convection, diffusion and shear.
Mixing by convection consist of movement of groups of particles from one part to another
within a powder mixture. The particles within a group in movement do not become mixed
together.
Mixing by diffusion is characterized by motion of individual units in a powder mixture. The
mixing process can ensure mixing on a fine scale. Powder beds that are forced to move will
become less tightly packed, which increases the chance of individual particles to fall into the
voids that will be created during the powder movement.
Shear mixing is considered to be a combination of the two other mixing mechanisms. The
mixing process could be described as the movement of a layer of material over another layer.
The mixing occurs by removal of mass by convective mixing, which again causes an unstable
shear plane that result in a collapse of the powder mixture.
All mixers (mixing equipments) use one of these mechanisms as a predominant mode of
action, but all the mechanisms occur together to a greater or lesser extent (Aulton, 2007, Poux
et al., 1991). Despite of that, Venables and Wells claims that the ideal particle movements
should be obtained by moving particles three dimensional and randomly. Particles are
supposed to move both individually and in groups, with no particles being in a region with no
movements (Venables and Wells, 2001).
1.2.2 Mixing equipments
Tumbling and convective mixers are most commonly used for mixing of pharmaceutical
powders. The mixers rely on different operating principles. The tumbling mixers are used by
means of filling powder into a vessel that is attached to a rotational shaft, which gives overall
rotational motion to the entire vessel. In contrast, convective mixers use a stationary vessel
and a rotating paddle. The main mechanism of the mixers in this group relies on the

13
convective mixing done by the paddle. Many names have been used for the commercially
available tumbling and convective mixer. However, there is one that has been extensively
used in research articles to achieve best possible homogenous powder mixing. That is a
Turbula mixer. A Turbula mixer is a tumbling mixer and uses three dimensional movements,
which makes the powder particles always change rhythmically pulsing motion. The results
will in a minimum of time to fulfil the highest homogeneity standards required for powders in
research or pharmaceutical industry (Willy A. Bachofen AG Maschinenfabrik) .
Figure 3. Example of a Turbula mixer (Willy A. Bachofen AG Maschinenfabrik)
1.3 Powder segregation
Segregation is the opposite of mixing, also described as reverse mixing or de-mixing.
Segregation refers to the situation where large particles and small particles separate, and takes
place because particles in a powder mixture have different sizes, shapes and/or densities. The
differences in particle properties play an important role in deciding the behaviour of the
particles when forced to move, and consequently also in their tendency to separate. There are
three main mechanisms of segregation taking place in a segregating mixture: percolation
segregation, trajectory segregation and dusting out (Aulton, 2007).
In powder mixtures where segregation has taken place, particles exhibiting similar properties
will appear as clusters in different regions of the powder bed (Aulton, 2007, Venables and
Wells, 2001). For powder mixtures that are prone to segregation, there is often an optimum
mixing time. This is because the segregating factors need time to occur. At first the mixing
effect will be larger than the segregating effect, but after a certain time, the opposite will be
the case. In contrast to segregating mixtures, non-segregating mixtures will be improved by
continued increase in mixing time. To achieve that kind of mixture, many factors, such as an
appropriate choice of particles, particle size, shape and density have to be controlled.

14
1.4 Particle characteristics
1.4.1 Particle size
The particle size is one of the basic characteristics of powder particles. The particle size is
often referred to as an average of all particles in a distribution. The characteristics of the
particle size distribution are therefore nearly as important as the size of the single particle. A
wide distribution contains particles of various sizes (figure 4, a), whereas a narrow
distribution contains particles of nearly the same particle size (figure 4, b).
Figure 4. Illustration of wide and narrow particle size distribution. a) wide particle size distribution,
b) narrow particle size distribution (Nanomi monosphere for drug delivery)
When particle size is determined it is often easily approximated to a sphere with a diameter
that is equivalent diameter of the particle. However, all particles are not perfect spherical in
shape. In fact, the particle size could be quite different for a particle considering the
orientation and shape of particle. Two diameters that are widely used to describe particles are
the Feret’s and Martin’s diameter (figure 5). Martin’s diameter is considered to be the
boundary separating a particle in equal particle sizes. The distance between two tangents on
opposite sides is referred to as Feret’s diameter.

15
Figure 5. Illustration of different estimation of particle size dependent on orientation and shape of the
particle (Aulton, 2007).
Two of the most frequently used methods for classifying particles are analytical sieving and
the use of particle size analysers. Sieving is the easiest, oldest and cheapest method for
classifying particles and is also described in the European Pharmacopoeia. The classification
can also be done using laser diffraction equipments known as particle size analysers. A laser
beam passes through particles in a suspension. The angle of diffracted light is related to the
particle size. The angle increases as the particle size is reduced.
Particle sizes should always be considered in order to make a powder mixture that is less
prone to segregation. In general, segregation is increased when particle size distribution is
increased (Sommier et al., 2001). A wide particle size distribution makes percolation
segregation of finer particles falling into the gaps between the coarser particles and moving to
the bottom of the mixer very likely to happen. This is expected to happen to a certain extent
whenever a powder mixture of different particle sizes is in movement. Also trajectory
segregation may occur in powders of wide particle size distribution. Larger particles have a
larger kinetic energy caused by the larger mass, and for that reason they move greater
distances than small particles. When the difference in particle size reaches three times or more
in mean diameter of two or more components, significant segregation may take place
(Johanson, 1996). It is then reasonable to assume that by keeping particle size in a narrow
range, it will be possible to reduce segregation, but segregation could also be caused by other
factors, such as differences in density and shape.
In spite of the fact that a broad particle size distribution favours segregation, the most
homogenous powder mixtures, the interactive mixtures, consist of very small particles mixed
16
with larger particles. Harnby explains this by electrostatic forces: when the particle size is
reduced below a certain level electrostatic forces will appear (Harnby, 2000). These forces
will be dominating over the gravitational forces, and more or less be hindering the
segregation. It is known that at some point when particle sizes reach below 40 µm an ordered
mixture can be formed (Venables and Wells, 2001). This is due to the increased surface area
of the small particles, which leads to weak inter-particulate forces known as van der Waals
forces. It results in micronized particles forming aggregates. Therefore, hindering of
segregation can be obtained by mixing particles of a narrow size distribution with micronized
particles (usually drug) that will attach to the surface of the coarser particles.
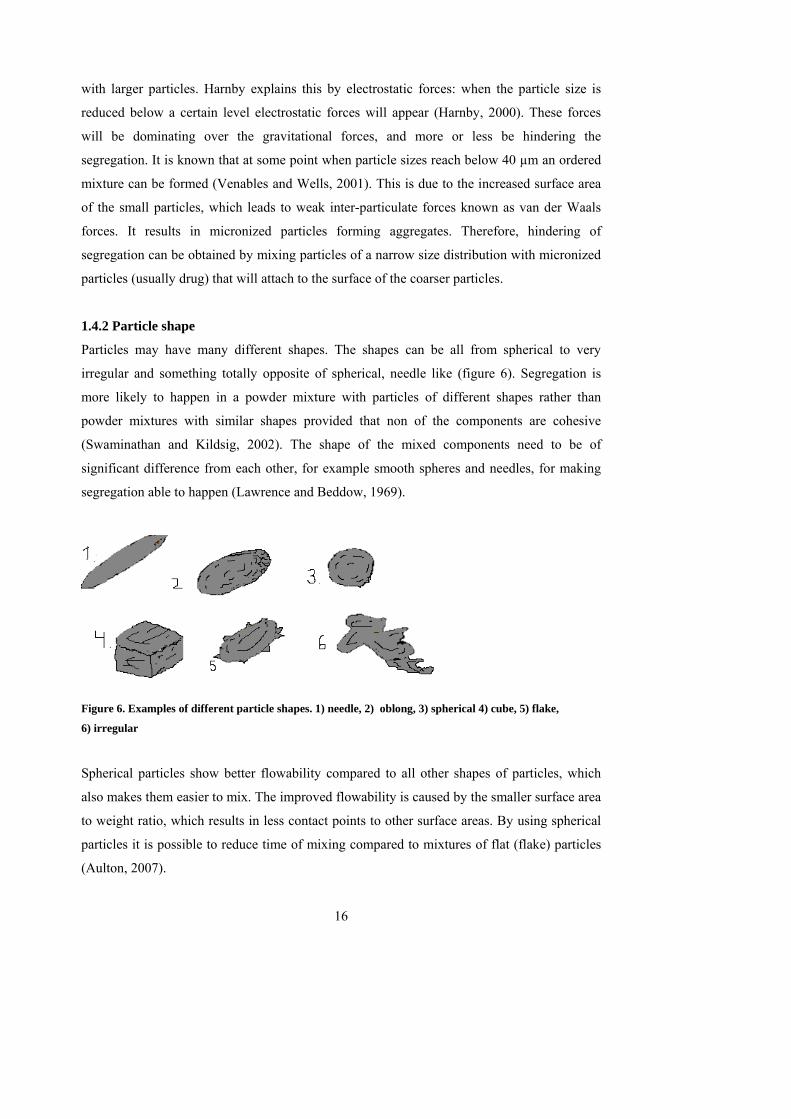
1.4.2 Particle shape
Particles may have many different shapes. The shapes can be all from spherical to very
irregular and something totally opposite of spherical, needle like (figure 6). Segregation is
more likely to happen in a powder mixture with particles of different shapes rather than
powder mixtures with similar shapes provided that non of the components are cohesive
(Swaminathan and Kildsig, 2002). The shape of the mixed components need to be of
significant difference from each other, for example smooth spheres and needles, for making
segregation able to happen (Lawrence and Beddow, 1969).
Figure 6. Examples of different particle shapes. 1) needle, 2) oblong, 3) spherical 4) cube, 5) flake,
6) irregular
Spherical particles show better flowability compared to all other shapes of particles, which
also makes them easier to mix. The improved flowability is caused by the smaller surface area
to weight ratio, which results in less contact points to other surface areas. By using spherical
particles it is possible to reduce time of mixing compared to mixtures of flat (flake) particles
(Aulton, 2007).

17
1.4.3 Particle density
Components of different densities might affect the mixing. An individual particle has three
different types of densities. The reason for having three different types is caused by the
consideration of pores. The pores are divided in closed pores, which are not connected to
surface, and open pores which are connected to the surface of the particle (figure 7). True
density is the mass divided by the volume of particle, excluding both open and closed pores of
the measured particle. Apparent density is the mass divided by the volume, including closed
pores but excluding the open pores. Effective density is mass divided by the volume,
including all pores (Venables and Wells, 2001).
Figure 7. A cross section through a particle is made for an illustration of both open pores and closed
pores. The closed pores inside particle does not reach surface as illustrated by light grey color. Open pores
are seen reaching surface.
Segregation could happen with large difference in particle density (Lloyd et al., 1970). The
more dense particles are more prone to segregate to the bottom of the mixer than less dense
particles, even though the particles have the same size. Denser particles can also move a
greater distance than particles of less density but the same size, causing segregation. It is
widely agreed that density plays a minor role in segregation compared to for example size
differences. This is because of the smaller range of densities in particle systems compared to
the size range of particle systems. A 5:1 range in density differences is large for particles, but
still minor compared to the difference in size range of 1000:1, which is quite common (Hogg,
2009). Powder particles used in pharmaceutical industry often have very similar densities, and
therefore this factor may not be that important (Aulton, 2007). The contribution of density
will be neglect able when mixing micronized and coarse particles to obtain ordered mixtures.

18
1.4.4 Particle external surface area
Powders can be characterised, with respect to their external surface area, by the widely used
method permeametry (Alderborn et al., 1985). A fluid that moves through a powder plug will
be met by a resistance that is regulated by the pore structure of the plug. Permeameters can
very accurately measure the flow rates of a fluid (air) and the following pressure head across
the powder bed as the measurements proceed. By utilizing permeameters it will be possible to
estimate external surface area of powders with derived empirical equations such as those
proposed by Alderborn et al and Eriksson et al (Alderborn et al., 1985)(Eriksson et al., 1993).
1.5 Ordered mixtures
1.5.1 General
Ordered mixtures consist of small particles ≤ 10 µm in diameter, adhering to larger carrier
particles of about 200 µm in diameter (Sundell-Bredenberg and Nystrom, 2001, Yip and
Hersey, 1977b). When mixing two components with so different particle sizes, the micronized
particles can adhere to the larger particles creating an ordered mixture due to electrostatic
forces. Ordered mixtures are also called interactive mixtures. Hersey was the first to present
the concept of ordered mixtures; the fact that mixtures of high degree of homogeneity could
be made by adhesion of micronized particles onto larger carrier particles (Hersey, 1975, Yip
and Hersey, 1977a). However, the essence of creating an ordered mixture was first discovered
by Travers and White in 1971, when they mixed micronized sodium bicarbonate with sucrose
crystals and the powder mixture exhibited minimal segregation (Travers and White, 1971).
The particles were no longer independent of each other. The removal of a carrier particle
would automatically lead to removal of the adsorbed micronized particles. Later, other studies
have confirmed that it is possible to get a high degree of homogeneity in an ordered mixture
(Hersey, 1975, Bredenberg et al., 2003). Sundell- Bredenberg and Nyström found almost zero
variations between powder samples, in a study of homogeneity of ordered mixtures, with fine
model drug fraction <10 µm (Sundell-Bredenberg and Nystrom, 2001). The authors found
that high dose homogeneity can be created by dry mixing of micronized drugs in proportions
as low as 0.015 % (w/w). According to Yip and Hersey an absolute homogenous system
(perfect ordered mixture) have zero standard deviation of sample concentration at all sample
sizes provided that the sample size is greater than the size of a single ordered unit (Yip and
Hersey, 1977a).
19
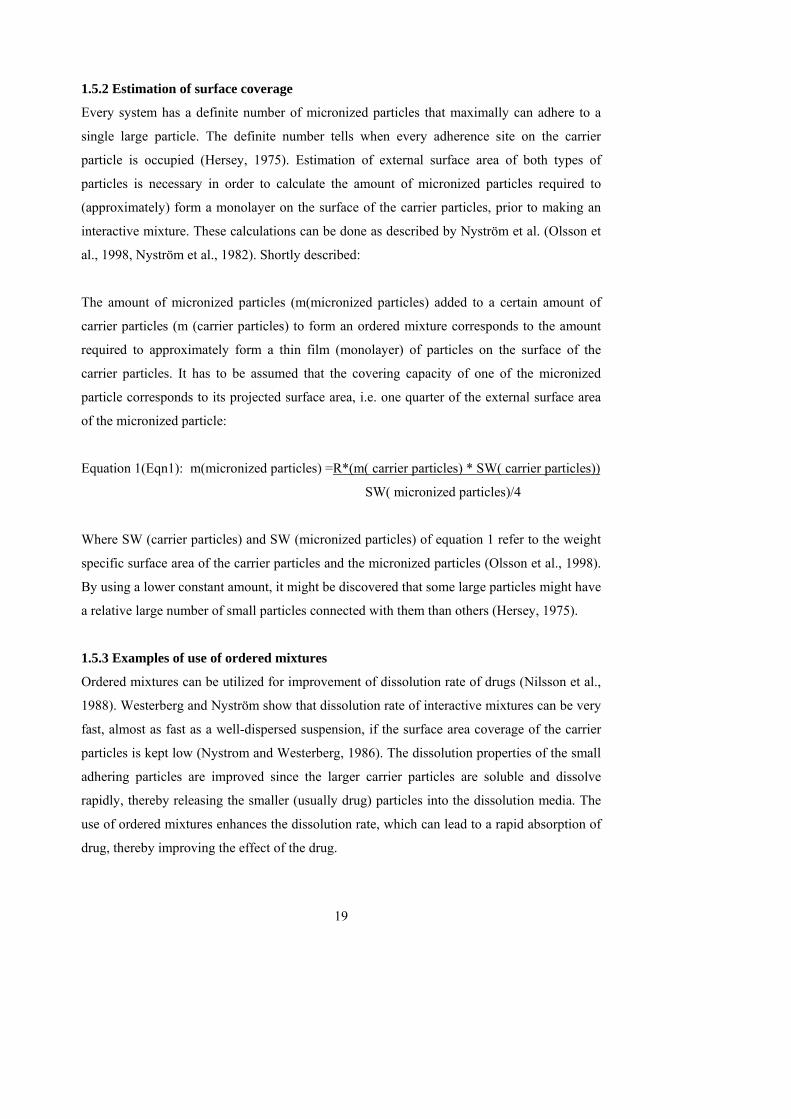
1.5.2 Estimation of surface coverage
Every system has a definite number of micronized particles that maximally can adhere to a
single large particle. The definite number tells when every adherence site on the carrier
particle is occupied (Hersey, 1975). Estimation of external surface area of both types of
particles is necessary in order to calculate the amount of micronized particles required to
(approximately) form a monolayer on the surface of the carrier particles, prior to making an
interactive mixture. These calculations can be done as described by Nyström et al. (Olsson et
al., 1998, Nyström et al., 1982). Shortly described:
The amount of micronized particles (m(micronized particles) added to a certain amount of
carrier particles (m (carrier particles) to form an ordered mixture corresponds to the amount
required to approximately form a thin film (monolayer) of particles on the surface of the
carrier particles. It has to be assumed that the covering capacity of one of the micronized
particle corresponds to its projected surface area, i.e. one quarter of the external surface area
of the micronized particle:
Equation 1(Eqn1): m(micronized particles) =R*(m( carrier particles) * SW( carrier particles))
SW( micronized particles)/4
Where SW (carrier particles) and SW (micronized particles) of equation 1 refer to the weight
specific surface area of the carrier particles and the micronized particles (Olsson et al., 1998).
By using a lower constant amount, it might be discovered that some large particles might have
a relative large number of small particles connected with them than others (Hersey, 1975).
1.5.3 Examples of use of ordered mixtures
Ordered mixtures can be utilized for improvement of dissolution rate of drugs (Nilsson et al.,
1988). Westerberg and Nyström show that dissolution rate of interactive mixtures can be very
fast, almost as fast as a well-dispersed suspension, if the surface area coverage of the carrier
particles is kept low (Nystrom and Westerberg, 1986). The dissolution properties of the small
adhering particles are improved since the larger carrier particles are soluble and dissolve
rapidly, thereby releasing the smaller (usually drug) particles into the dissolution media. The
use of ordered mixtures enhances the dissolution rate, which can lead to a rapid absorption of
drug, thereby improving the effect of the drug.
20
Mattson and Nyström have shown that tablet strength of ordered mixtures in some cases is
significantly higher than the strength of tablets compacted of individual materials. They
explain the adhering material as a direct reason for an increased number of bonds that need to
be broken during tablet strength measurements (Mattsson and Nyström, 2001).
1.6 Mini-tablets
Mini-tablets are tablets with a low diameter. Lennartz and Mielck use 2-3mm in diameter or
smaller when they define mini-tablets (Lennartz and Mielck, 1998). Flemming and Mielck
use equal to or less than 2 mm in diameter (Flemming and Mielck, 1995). Mini-tablets can be
used as single tablets or they can be used to create multiple unit dose systems (MUDS) (De et
al., 2000). MUDS can be obtained when mini-tablets are compacted using a tablet machine or
filled into hard gelatine capsules. In the latest years, there has been an increasing interest of
developing MUDS by incorporating pellets or mini-tablets into tablets instead of hard gelatine
capsules because of the higher production costs of capsule-filling (Lopes et al., 2006).
Mini-tablets are an attractive alternative to pellets for creating MUDS. Compared to pellets
mini-tablets are more robust, in addition to have a smoother surface and a more uniform size,
this makes them more suitable for coating processes compared to pellets. They also need less
coating material, which makes the coating process less expensive (Lennartz and Mielck, 1998,
Munday, 1994). Lennartz and Mielck have shown higher mechanical strength of mini-tablets
compared to conventional tablets by producing mini-tablets and tablets at similar high
pressure. They demonstrate better mechanical strength and reduced capping for the mini-
tablets. They explain the difference observed by the ratio between outer surface and volume
of the tablet. The smaller the tablets are in diameter the more this ratio increases. The result
makes mini-tablets more attractive especially for drug that are known to be problematic in
manufacturing. They also claim that there is an advantage that higher contents of active
ingredient possibly could be manufactured in mini-tablets compared to tablets (Lennartz and
Mielck, 1998).
The small size of the mini-tablets makes them very easy to swallow compared to conventional
tablets. Mini-tablets could for that reason offer an alternative to conventional tablets. They
can also enable easy administration and flexible dosing, which is especially appropriate for
growing children by means of weight based dosing (Stoltenberg and Breitkreutz, 2011).

21
1.7 Orally disintegrating tablets
Orally disintegrating tablets (ODTs) are defined as solid dosage forms containing an active
ingredient that will rapidly be dissolved, within seconds, when placed inside the oral cavity
according to The US Food and Drug Administration Centre for Drug Evaluation and Research
(Hirani et al., 2009). The European Pharmacopoeia describes orally disintegrating tablets as
uncoated tablets meant to be placed in mouth where they disperse rapidly before being
swallowed. The tablets should be disintegrated in less than 3 minutes. Krause and Breitkreutz
go further in categorising the orally disintegrating tablets as fast dissolving with a
disintegration time of less than 60 seconds (Krause and Breitkreutz, 2008). ODTs are also
known as orodispersable tablets (Ph.Eur), quick disintegrating tablets, porous tablets,
rapimelts, etc (Bharawaj et al., 2010). They are meant to disintegrate rapidly in saliva, without
the need of drinking extra water (Hirani et al., 2009).
In general ODTs make it easier for people that have problems swallowing, by means of
having need for dividing or chewing the tablets and drink a lot of water. Having the
possibility to take an ODT without the need of water can be advantages when travelling to or
living in a country where water quality is low. The ODTs offers an ability of ease of
administration to patients who cannot or refuse to swallow a tablet or capsule. This includes
stroke victims, paediatric, geriatric, psychiatric patients, etc (Bharawaj et al., 2010). ODTs are
made for rapid dissolution and absorption of drug from the mouth, which may cause faster
onset of pharmacological effect in the patient (Bharawaj et al., 2010). The rapid onset of
action makes ODTs useful for people who suffer from acute disorders like for example
migraine. The onset of action for conventional tablets is influenced by several parameters
such as for example gastric emptying, which means that from the time of administration to
time of pharmacological effect might take hours. This is generally not acceptable in acute
disorders (Bredenberg et al., 2003). ODT products have shown to improve patient compliance
compared to conventional tablets or capsules and this is the reason why ODTs have attracted a
lot of attention over the last few decades (Hirani et al., 2009). ODTs can be valuable to
patients with mental illness, where patient compliance is important for treating chronic
indications such as for example depression.
22
1.8 Suitable formulations for paediatric patients
Children represent a very heterogeneous patient group. From newborn to adolescent they go
through large physical developmental differences with respect to dose, absorption,
pharmacokinetics, sensitivities and compliance. Metabolic changes, body water to fat ratio
and protein binding may also go through enormously changes with age (Krause and
Breitkreutz, 2008). There is a lack of suitable and safe drug formulations for children, perhaps
especially for the very young children. Studies show that from the age of 6 most children
receive solid dosage forms for peroral drug administration, whereas children below that age
receive liquid formulations (Schirm et al., 2003). Recently, the new European regulations on
paediatric medicines induced an increased need for child appropriate dosage form. The WHO
guidelines recommends the use of solid dosage forms over liquid forms due to compactness
and stability (Stoltenberg et al., 2010). This is especially important when it comes to
paediatric patients in the developing countries. Orally disintegrating mini-tablets could be an
appropriate dosage form for children.
A study of acceptability of placebo mini-tablets in 100 pre-school children has been published
by Thomson and co-workers (Thomson et al., 2009). The study showed that 46 % of the
children of 2 years of age swallowed the mini-tablet, compared to 85 % of children of 5 years
of age. However, mini-tablets were chewed or swallowed by children of 2 to 4 years of age,
and widely accepted for children ≥4 years of age. Throughout the study no one choked or
aspirated the mini-tablet (Thomson et al., 2009). This suggests that mini-tablets could offer a
safe an alternative as a child-appropriate dosage form.
Also ODTs, which melt in mouth, are mentioned as a child-appropriate dosage form.
One of the advantages that they could offer is to overcome the swallowing difficulties with
tablets that are experienced in children. In the paper Formulation of Choice for the Paediatric
Population they describe ODTs as easy to administer and difficult to spit out provided rapid
dispersion (Medicinal, 2005). They could also provide flexible dosing which is appropriate
for children when there is need for weight based dosing (Stoltenberg and Breitkreutz, 2011).
Nevertheless, designing paediatric dosage forms would require through selection of potential
excipients in order to avoid adverse effects that can occur in children. A limited use of
excipients is recommended, since children are a very heterogeneous group (Cram et al.,
2009).

23
2. Aim of the study
The overall aim of the study was to prepare ordered mixtures using carriers of different
particle size and manufacturing method, and test their suitability for preparation of mini-
tablets with high dose uniformity. The mini-tablets were intended for use as orally
disintegrating systems (ODT) for children.
The specific objectives were:
• To study the influence of particle size of the carrier on the mixing time required to obtain
homogenous powder mixtures
• To study the effect of particle size and external surface area of carrier particles on the
homogeneity of powder mixtures
• To study the homogeneity of mini-tablets prepared from ordered mixtures in terms of
mass and dose-variation
• To study the suitability of the mini-tablets as orally disintegrating systems with respect to
tablet hardness and disintegration features assessed by crushing strength, friability and
simulated wetting time, respectively.

24
3. Materials and methods
3.1 Materials
Sodium salicylate (Sigma Aldrich, Germany) and Ibuprofen 50 (BASF, Germany) were used
as micronized particles, and mannitol of different grades were used as carrier particles in
preparation of ordered mixtures. Mannitol samples were from the Pearlitol series (Roquette
Pharma, France) and Parteck ODT (Merck, Germany). Information on particles size of the
tested qualities is given in the table below.
Table 1. Information on mean particle size and particle size distribution for the mannitol samples used.
Data is provided by the producer.
Information provided by producer Web page % residue on sieve (Certificate of analysis)
Sample
Mean particle
size [μm]
% >75 μm
% >100 μm
% >150 μm
%
>200 μm
%
> 315 μm
%
> 500 μm
%
>800 μm
Parteck ODT * 70-120
Pearlitol flash 200 87 6
Pearlitol 200SD 180 93 56 1.5
Pearlitol 300DC 250 96 49 0.1
Pearlitol 400DC 360 100 15
Pearlitol 500DC 520 96 0 *No Certificate of analysis received from producer
Pearlitol 300DC, 400DC and 500DC are all granule qualities of mannitol specially prepared
for direct compression. The numbers indicate the mean particle size of the product. The letters
DC indicate that the product is intended for direct compression The SD product is prepared by
spray drying and show different particle characteristics. The SD product is also suitable for
direct compaction. Parteck ODT and Pearlitol Flash are specialized materials for preparation
of orally disintegrating tablets and contain mannitol co-processed with a disintegrant. Parteck
ODT contains crosscarmellose sodium, whereas Pearlitol Flash contains low proportion of
starch.

25
3.2 Particle characterisation of raw materials
3.2.1 Sieving analysis
The mannitol samples were subjected to sieving analysis as described in European
Pharmacopoeia using Retsch (AS-200 Basic, Germany) particle size distribution equipment.
The recommended weight of powder (100g) was weighed and put onto the sieves before
agitation started. The sieves were weighed every 5 minute and the analysis was stopped when
less than 0.2 % of the tested material passed through the sieve. Parteck ODT, Pearlitol flash,
Pearlitol 200SD and Pearlitol 300DC were analysed using sieves of mesh sizes ranging from
45 -500 µm in diameter. As larger particles were expected in the bulks of Pearlitol 400DC and
Pearlitol 500DC, the mesh size of the sieves were selected accordingly; sieves ranging from
63-710 µm in diameter.
3.2.2 Fractionation of powder samples
Since the particle size distribution was broad for all mannitol samples, selected fractions were
collected. The following fractions were collected:
− 180-250 µm: Parteck ODT, Pearlitol flash, Pearlitol 200SD and Pearlitol 300DC
− 250-355 µm: Pearlitol 400DC
− 355-500 µm: Pearlitol 500DC
The actives, sodium salicylate and ibuprofen, were grinded manually using mortar and pestle
and sieved in order to obtain particles as small as possible. The fraction below 45 μm in
diameter was collected and used in further analysis.
3.2.2 Particle size analysis by laser diffraction
The particle sizes of sodium salicylate and ibuprofen were estimated using Beckman Coulter
laser diffraction particle size analyzer (LS230, USA). Both micronized actives were checked
for solubility in literature. Different suspensions were made, based on their solubilities.
Sodium salicylate was suspended in ethanol, whereas ibuprofen was suspended in water. The
suspensions were fed into the cavity of the laser diffraction particle size analyser. A particle
size distribution (volume % program) was recorded and particle size determined.

26
3.2.3 Microscopy
The powder samples were examined using a Motic stereo zoom microscope (SMZ-168, UK)
to look at the shape of the particles and get a rough estimate of particle size and size
distribution.
3.2.4 Scanning electron microscopy
Scanning electron microscopy micrographs were taken of micronized actives and carrier
particles. This was done to confirm the shape, the size of the particles and the size of
distribution. All powder sample were spread onto sticky carbon tabs mounted on aluminium
stubs, the excess powder particles were carefully removed (tapped and blown away by hand
balloon) before sputter-coating with gold/palladium using a Polaron Sputter-Coater (SC7640,
USA). The materials were examined using a Jeol Scanning Electron Microscope (JSM-6300,
Japan).
3.2.5 Apparent particle density
The apparent particle densities of all powders were measured using a helium pycnometer from
Micromeritics (AccuPyc 1330, USA). Two different samples were tested, and each was
measured 10 times. The average was found by taking the average of the two averages from
both of the separate series of samples.
3.2.6 External surface area
The external surface areas of the carrier particles (different mannitol samples) and micronized
particles of sodium salicylate and ibuprofen were determined by different permeametric
methods (Eriksson et al., 1993, Alderborn et al., 1985).
Steady state permeametry
Steady state air permeametry was used to determine the external surface area of the carrier
materials (mannitol samples). The external surface area was found by measurement of the
resistance met by the air when moving through a powder plug. The resistance was regulated
based on the porosity of the powder plug.
Dry powder was filled to 2/3 of the test cylinder volume (figure 8). The mass of the powder
and the height in the cylinder were recorded (figure 8 b and 8c, respectively). The sample was
mounted in the setup as shown in figure 9.
27
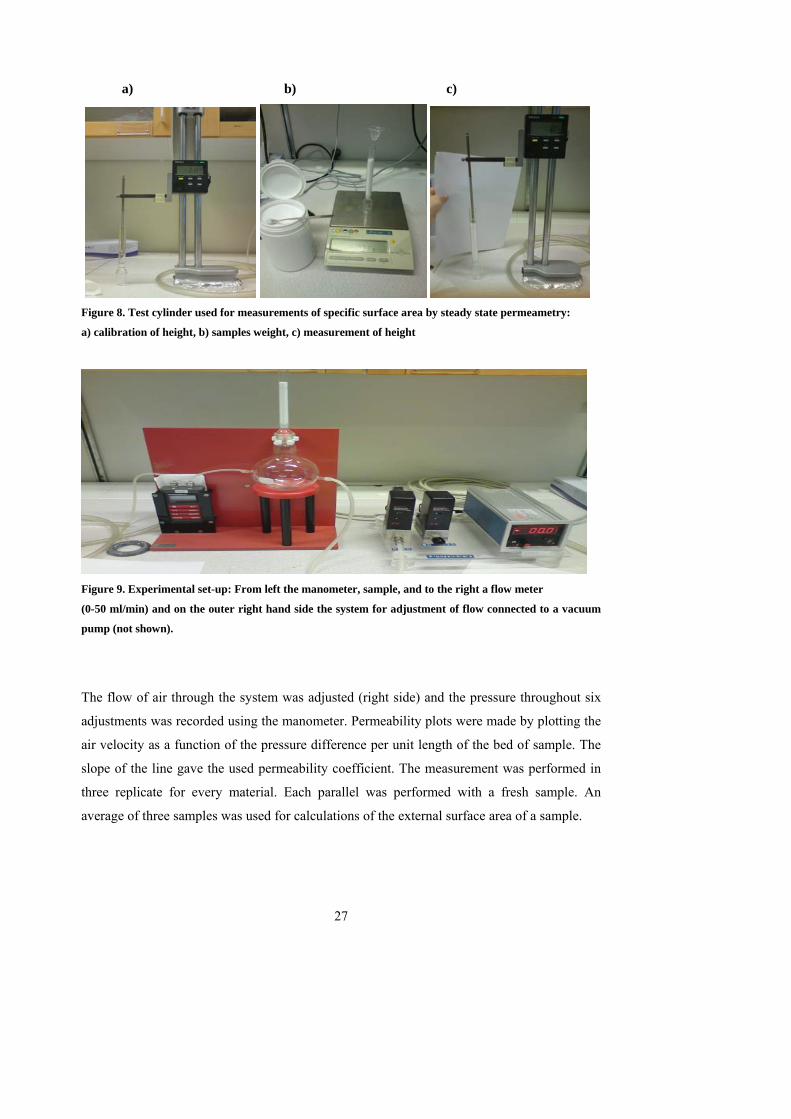
a) b) c)
Figure 8. Test cylinder used for measurements of specific surface area by steady state permeametry:
a) calibration of height, b) samples weight, c) measurement of height
Figure 9. Experimental set-up: From left the manometer, sample, and to the right a flow meter
(0-50 ml/min) and on the outer right hand side the system for adjustment of flow connected to a vacuum
pump (not shown).
The flow of air through the system was adjusted (right side) and the pressure throughout six
adjustments was recorded using the manometer. Permeability plots were made by plotting the
air velocity as a function of the pressure difference per unit length of the bed of sample. The
slope of the line gave the used permeability coefficient. The measurement was performed in
three replicate for every material. Each parallel was performed with a fresh sample. An
average of three samples was used for calculations of the external surface area of a sample.

28
The estimation was done using following main equations:
Eqn. 2: Pc= u / (ΔP/L)
where u= air velocity (m/s), Pc= permeability coefficient (m4N-1s-1), ΔP= difference in
pressure across the bed of particles (Nm -2) and L= length of bed of particles (m)
Eqn 3: Sv2= (e3/(1-e)2)*1/ (k*η*Pc)
where Sv= specific surface area (m2/m3), e= porosity of bed of particles(-), k=aspect factor (a
constant), η=viscosity of air (1.81*10 -5Nsm-2) and Pc= permeability coefficient (m4N-1s-1)
The apparent density of the material was required for the calculations of the external surface
area and was determined by helium pycnometry. The porosity of the powder bed was given
by the expressed sample weight, density and height together with the given constant for
diameter of cylinder. For further details on the method of steady state permeametry, please
refer to Eriksson et al. (Eriksson et al., 1993).
Blaine air permeametry
Blaine air permeametry was used to determine the external surface area of micronized
materials (e.g. sodium salicylate and ibuprofen). Blaine air permeameter is used for
measurement of the time for a constant volume of air to flow through a sample. The flow rate
and the pressure head across the powder sample changes as Blaine permeametery
measurement proceeds. The method is valid for particles up to approximately 50≥ µm in
diameter. First, the apparent density was determined by helium pycnometry. A given sample
was used to get an appropriate time. The times should be above 4 seconds. Then the porosity
of the powder plug was estimated by the weight of sample, density, together with given
constants as the diameter and height of cylinder. The appropriate mass of powder was filled
into the steel cylinder of the sample holder (figure 10).

29
Figure 10. Left: Steel cylinder of the sample holder and plug, right: positioning of the sample holder in the
test set-up.
The powder bed inside the steel cylinder of the sample holder was compressed using the plug.
The plug was removed, and the sample holder was placed into position for measurements
(figure 10).
The level of liquid in the tube of the Blaine permeameter was checked before start (figure 11).
The liquid was sucked to the right side of the manometer using a pelleus balloon. The valve
was closed (vertical position) and the time it takes for the liquid to flow from one given point
to another was measured (figure 11). The required time should, as mentioned, be more than 4
seconds. The available height differences to choose between were 11 to 1.5 cm and 7 to 1.5
cm. The time needed reflects the particle size and the porosity of the powder plug as well as
the weight of sample had to be adjusted for each material. The measurement was performed in
three replicate for every material. Each parallel was performed with a fresh sample.

30
Figure 11. The Blaine apparatus Following empirical equations have been used to estimate the external weight specific surface
area from measured resistance.
Eqn 4: Sk2= (2*gξt/ (5Lηln(h2/h1))* (dt/dm)2* E3/(1-E)2
where g=gravitational constant (9.81 ms-1), ξ= density of manometer liquid(water 1g/cm3),
t= time for measurements( s), L= height of powder plug (constant 1.47cm), η= viscosity of air
(1.81*10-5Nsm-2), h2=height of start point manometer (cm), h1= height of stop point
manometer (cm), dt= diameter powder plug (constant 1.27cm),dm=diameter manometer arm
(constant 0.697cm), E= porosity of powder bed
Correction for slip flow has to be performed since fine powders, of sodium salicylate and
ibuprofen, is investigated and not compacts, which Blaine permeametry is most commonly
applied for:
Eqn 5: Sm=2*gξt/ (PLln(h2/h1))* (dt/dm)2* (E2/1-E) *0.96√(R*T/M)
where P=atmospheric pressure (1.013*10-5), R=universal gas constant (8.315J K-1 mol-1),
T= absolute temperature (293 K), M= molecular mass of air (29g mol-1)

31
The total surface (volume specific surface) area can be calculated by combining eqns. 4 and 5.
Eqn 6: Sv=Sm/2+ √((Sm2/4)+Sk2)
The weight specific surface area can be found by dividing Eqn. 6 with the apparent density of
tested powder sample. For further details on the method for measuring the external surface
area using Blaine air permeameter please refer to literature (Alderborn et al., 1985).
3.2.7 Estimation of diameter on micronized particles from external surface area
The particle diameter of the micronized drug substances were estimated from their volume
specific surface areas using the Heywoods shape factor. A shape factor of 10 was chosen for
both sodium salicylate and ibuprofen. The shape factor 6 is a perfect sphere (Eriksson et al.,
1993, Mihranyan et al., 2008). The diameter was calculated from equation 7:
Eqn. 7 Diameter (µm) = Heywood shape factor/external surface area*10000
where Heywood shape factor =10 and external surface area determined by Blaine
permeametry (section 3.2.6)
3.2.8 Bulk and tapped density
The bulk and the tapped density of the carrier particles were examined. The results were
expressed using Hausner ratio and Carr Index, related to 50.00 gram of sample. Different
graduated cylinders were used due to different porosities; the cylinders used were 100ml and
250ml. The 250 millilitre cylinders were used for the carrier particles of Parteck ODT,
Pearlitol Flash, and Pearlitol 200SD. The carrier particles of Pearlitol 300DC, 400DC and
500DC were tested in a 100 ml graduated cylinder. The different powder samples of mannitol
were carefully poured into the cylinders without compacting. The untapped volumes were
read to the nearest graduate unit. The cylinders were secured in the support and tapped using
Erweka (SVM, Germany) according to the European Pharmacopoeia: 10, 500 and 1250 taps
were carried out on the same powder sample, and the corresponding volumes were read to the
nearest graduate unit. The examination was stopped when the difference in height was less
than 2 ml, this happened at 1250 taps for all the mannitol samples.

32
From the bulk and tapped density the Hausner ratio and Carr Index were calculated to give an
approximation of the powder flowability.
Eqn 8: Hausner ratio: V0/ Vf
Eqn 9: Carr Index: 100* (V0-Vf)/ V0
where Vo is the unsettled apparent volume. Vf is the final tapped volume, when no further
changes in volume of the material occurs.
3.2.9 Powder Flow rate and Angle of repose
The powder flow rate of the mannitol samples were tested using the method described by the
European Pharmacopeia. A dry funnel was held steady by pegs, in a suitable device. The
height from the funnel to the plate was adjusted, in order for the free flowing powder particles
to form a pyramid on the plate. The height from the tip of the funnel to the plate was
approximately 3 cm. The powder samples were weighed and poured into the closed funnel.
The times for the powder particles to flow through the funnel, when unblocked, forming a
pyramid was measured. The average flow rate was expressed in seconds and tenths of
seconds, associated to the movement of 50.00 gram powder sample. The heights and the
diameters of the pyramids were measured and the angle of repose was calculated. Three
parallels of the same powder were carried out.
Eqn 10: Angle of repose: tan α = height/ radius

33
3.3 Preparation of powder mixtures
3.3.1 Conventional mixture
Mannitol and sodium salicylate were mixed in a Turbula mixer (W.A. Bachofen AG;
Switzerland) at 96 rpm for 10 minutes. The mixture containing 1 % active ingredient was
produced by mixing 1.0 gram of sodium salicylate and 99.0 gram Pearlitol 300DC. The active
was screened through a sieve of 500 µm in mesh size to make sure that there were no larger
particles. Mannitol was sieved to obtain the desired fraction for that particular sample (e.g.
180-250 µm). The conventional mixture was made in order to have a comparison of the
relative standard deviation of a conventional mixture with the relative standard deviations of
the ordered mixtures.
3.3.2 Ordered mixture
Mixtures containing 1 % active were obtained by adding 1.0 g gram micronized sodium
salicylate and 99.0 gram selected carrier. The appropriate fraction of the selected carrier and
micronized active were mixed in Turbula mixer (W.A. Bachofen AG; Switzerland) at 96 rpm
for 24 h and 48 h. The filling load of the glass jar in the container was optimised. Ordered
mixtures were prepared with the carriers Pearlitol 200SD (180-150 μm), 300DC (180-250
μm), 400DC (250-355 μm) and 500DC (355-500 μm). All ordered mixtures were prepared in
duplicates, the exception was 200SD due to lack of material.

34
3.4 Powder mixture characterization
The four ordered mixtures (section 3.3.2) were characterised according to the methods
described above for bulk and tapped density (section 3.2.8), powder flow rate and angle of
repose (section 3.2.9).
3.4.1 Homogeneity
The homogeneity of the mixed powders was determined according to the method described by
European Pharmacopoeia. Thirty sample units were withdrawn from each of the powder
mixtures by random sampling using a powder micro-thief (Sampling Systems, UK). The
sample unit mass was 20±2 mg. Each sample unit was dissolved in phosphate saline buffer
pH 6.8 in 10.0 ml volumetric flasks. pH of the phosphate saline buffer was chosen to simulate
the pH of saliva (European Pharmacopoeia 6.7). A calibration curve was made by dilution of
a stock solution of 0.1mg/ml sodium salicylate into the following concentrations: 0.01mg/ml,
0.015mg/ml, 0.020 mg/ml, 0.025mg/ml and 0.030 mg/ml. The quantification was done by
direct UV-assay at 295 nm.
The theoretical amount of sodium salicylate in the sample units was calculated (1% of mass
sampled by the powder-thief) and compared with the experimentally determined amount. The
drug content of the sample was normalised by dividing the experimentally determined value
by the theoretically calculated value. Homogeneity of the mixtures was expressed as the
relative standard deviation of the normalised average of 30 samples.
3.4.2 Surface coverage of micronized particles on the carrier
The coverage of micronized particles on the surface of the carrier particles was calculated for
the four ordered mixtures using the external specific surface areas of the carrier and
micronized particles as determined by steady-state air permeametry and Blaine air
permeametry (section 3.2.6) (Eriksson et al., 1993, Alderborn et al., 1985).
Eqn 11 : m (micronized particles) = R* (m( carrier particles) * SW( carrier particles)
SW( micronized particles)/4
(same as eqn 1)
35
3.4.3 Scanning electron microscopy
Scanning electron microscopy micrographs were made of the four ordered mixtures (section
3.3.2). This was done according to the method described in section 3.2.4. The micrographs
were compared to those of the raw materials in order to look for physical evidence of ordered
mixtures. It was tried to discover the attachment of micronized sodium salicylate particles on
the surface of the carrier particles.
3.5 The compaction of mini-tablets
3.5.1 Addition of lubricant
Magnesium stearate (1 % w/w) was added to the mixture of sodium salicylate and mannitol
by volumetrically blending using a card in the mortar. The four ordered powder mixtures were
compressed into four batches of mini-tablets (200SD, 300DC, 400DC, and 500DC mini-
tablets).
During compression punches and dies were lubricated with a 5 % suspension of magnesium
stearate in acetone, in order to avoid sticking of the material to the die.
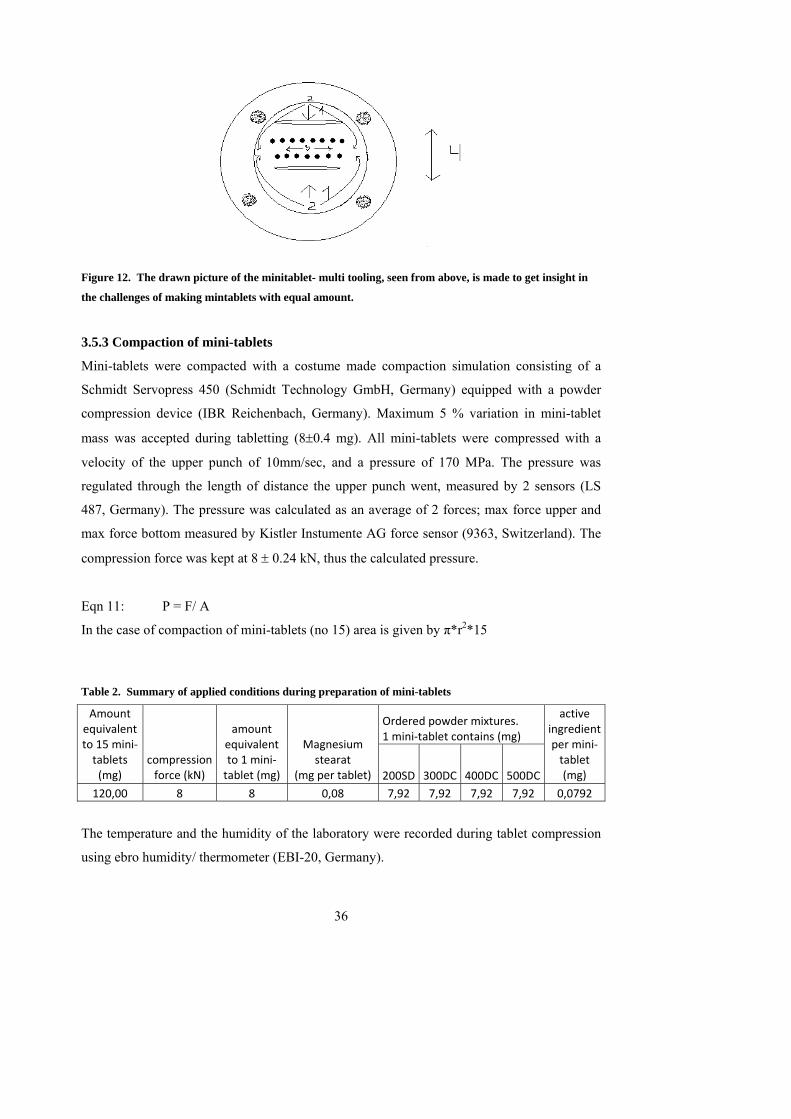
3.5.2 Manual filling of dies
An appropriate amount of powder to make mini-tablets (120 mg) was weighed in from the
powder mixtures and manually filled into the dies of the mini-tablet multi tooling. The mini-
tablet multi tool produces 15 mini-tablets per stroke. The punches are concave and 2 mm in
diameter, and located in 2 lines; 7 in front and 8 in the back. The production of homogenous
mini-tablets is depending on reproducible filling of the dies. Thus a standardized method was
required. This was done by forming two lines of the powder; one in the front of the seven
holes and one behind the eight as illustrated in figure 12. The powder lines were then pushed
towards each other. The remainder of powder particles were then pushed towards the left and
the right side, filling more of the possible gaps of the corners. Step three made it possible to
optimise corner filling. It was done by pushing the powder particles first to the sides, then a
few times from side to side. A few times forward and back were also done to make every
particle disappear into the dies. The filling method was validated by checking the mass of the
mini-tablet produced from each of the positions in 12 of the 24 strokes, (including all
batches).
36
Figure 12. The drawn picture of the minitablet- multi tooling, seen from above, is made to get insight in
the challenges of making mintablets with equal amount.
3.5.3 Compaction of mini-tablets
Mini-tablets were compacted with a costume made compaction simulation consisting of a
Schmidt Servopress 450 (Schmidt Technology GmbH, Germany) equipped with a powder
compression device (IBR Reichenbach, Germany). Maximum 5 % variation in mini-tablet
mass was accepted during tabletting (8±0.4 mg). All mini-tablets were compressed with a
velocity of the upper punch of 10mm/sec, and a pressure of 170 MPa. The pressure was
regulated through the length of distance the upper punch went, measured by 2 sensors (LS
487, Germany). The pressure was calculated as an average of 2 forces; max force upper and
max force bottom measured by Kistler Instumente AG force sensor (9363, Switzerland). The
compression force was kept at 8 ± 0.24 kN, thus the calculated pressure.
Eqn 11: P = F/ A
In the case of compaction of mini-tablets (no 15) area is given by π*r2*15
Table 2. Summary of applied conditions during preparation of mini-tablets
Ordered powder mixtures. 1 mini‐tablet contains (mg)
Amount equivalent to 15 mini‐tablets (mg)
compression force (kN)
amount equivalent to 1 mini‐tablet (mg)
Magnesium stearat
(mg per tablet) 200SD 300DC 400DC 500DC
active ingredient per mini‐tablet (mg)
120,00 8 8 0,08 7,92 7,92 7,92 7,92 0,0792
The temperature and the humidity of the laboratory were recorded during tablet compression
using ebro humidity/ thermometer (EBI-20, Germany).

37
3.6 Characterisation of mini-tablets
3.6.1 Mass variation
20 randomly sampled mini-tablets from each of the batches were individually weighed
(European Pharmacopeia 7.0, chapter 2.9.5). The average mass was made by calculation. The
individual mass deviations from the average mass of the mini-tablets were examined and
compared to the acceptance criteria of the European Pharmacopeia.
3.6.2 Friability testing
The friability of the mini-tablets was tested by using standard friability apparatus from
Erweka (Tar-20, Germany). The measurements were performed according to the European
Pharmacopoeia. This means a drum rotating speed of 25 rpm for 4 min. 20 randomly selected
mini-tablets from each batch were weighed before and after friability testing. The percentage
weight loss was calculated.
3.6.3 Crushing strength
The crushing strength of the mini-tablets was determined using a Stable Micro System texture
analyser (TA.XT.plus, UK). Mini-tablets were examined using a probe 4 mm in diameter.
Twenty mini-tablets from each batch were placed separately on the plate and crushed. The
radial tensile strength was measured. The probe had a pre-test rate of 2 mm/sec until contact
with the mini-tablets (trigger force 5 g), and then the test rate was changed to 0.03 mm/sec. A
force-distance diagram was recorded and the maximal force was determined for each of the
mini-tablets. The crushing strength was detected in Newton. The tablet hardness was
expressed as the relative standard deviation force needed to crush the 20 mini-tablets.
3.6.4 Simulated wetting test
The simulated wetting test was performed as described by Park and co-workers (Park et al.,
2008). The test was developed for orally disintegrating tablets. Shortly described: One filter
paper disc (5 mm in diameter) was placed in each well of a 96 well-plate. 20 µl of a 0.1 %
(w/w) Brilliant blue 85E dye solution (Sigma, Germany) was added. One mini-tablet was
carefully placed, with the compacted sides in the horizontal direction, on the surface of the
filter paper using forceps. The time required for the mini-tablet to be completely coloured
blue by the brilliant Blue 85E dye solution was measured as the wetting time.

38
3.6.5 Quantification of active and dose variation in mini-tablets
Ten mini-tablets, randomly sampled from each batch, were dissolved separately in phosphate
saline buffer pH 6.8 in 5.0 ml volumetric flasks. The concentration of the active ingredient in
each of the mini-tablets was determined using the direct UV-assay described above (section
3.4.1). Due to the magnesium stearate in the mini-tablets, samples were filtered using a 0.22
μm syringe filter Pall Life Science (Acrodisc, USA) prior to quantification. Also the standard
solutions were filtered to ensure that they were treated equally. The theoretical amount of
sodium salicylate in the mini-tablet was found by first subtracting 1 % of the weight of the
mini-tablet (e.g. contribution of magnesium stearate) and then another 1 % of this new
amount represented the amount of sodium salicylate. The amount of drug was normalised by
dividing the experimentally determined amount by the theoretically calculated one. The
homogeneity was expressed as the relative standard deviation of the normalised values. The
homogeneity of the mini-tablets was compared to the homogeneity of the corresponding
ordered mixture.
The drug content determined in separate mini-tablets was also used for testing of uniformity
of content of single dose preparations according to the European Pharmacopoeia. The dose
variation in each batch was compared to the acceptance criteria of the Pharmacopoeia.
39
4. Results and discussion
4.1 Particle characterisation of raw materials
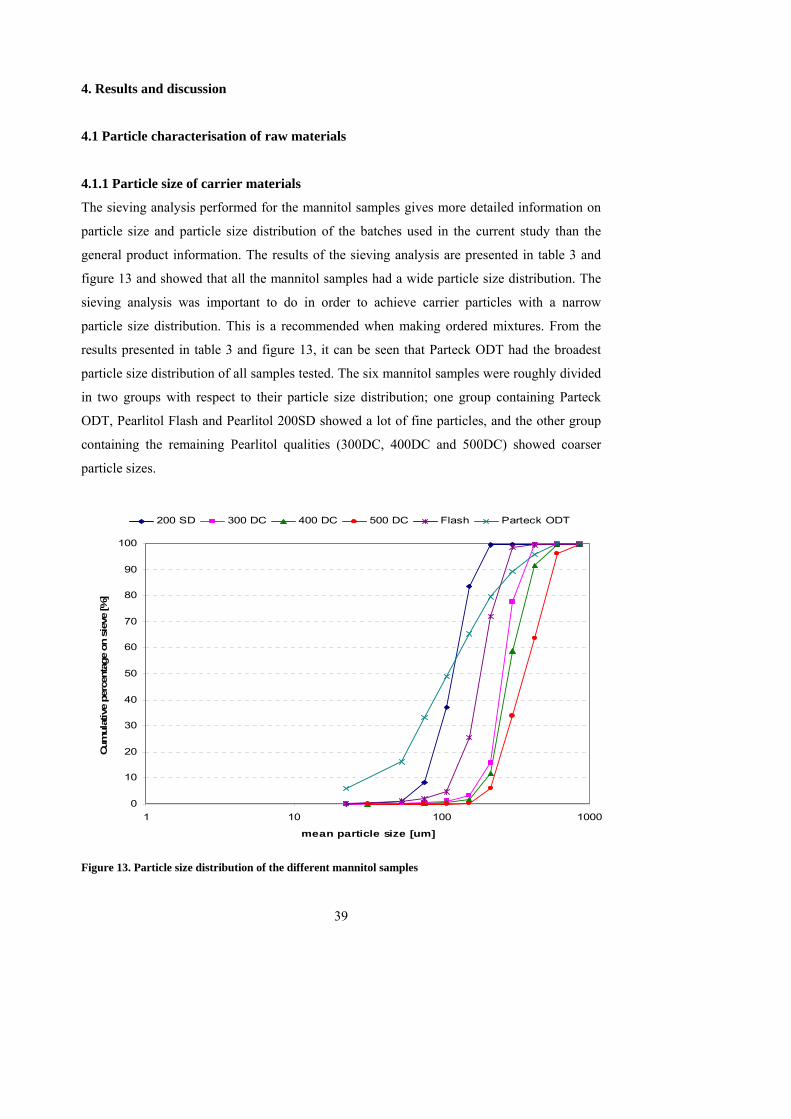
4.1.1 Particle size of carrier materials
The sieving analysis performed for the mannitol samples gives more detailed information on
particle size and particle size distribution of the batches used in the current study than the
general product information. The results of the sieving analysis are presented in table 3 and
figure 13 and showed that all the mannitol samples had a wide particle size distribution. The
sieving analysis was important to do in order to achieve carrier particles with a narrow
particle size distribution. This is a recommended when making ordered mixtures. From the
results presented in table 3 and figure 13, it can be seen that Parteck ODT had the broadest
particle size distribution of all samples tested. The six mannitol samples were roughly divided
in two groups with respect to their particle size distribution; one group containing Parteck
ODT, Pearlitol Flash and Pearlitol 200SD showed a lot of fine particles, and the other group
containing the remaining Pearlitol qualities (300DC, 400DC and 500DC) showed coarser
particle sizes.
0
10
20
30
40
50
60
70
80
90
100
1 10 100 1000
mean particle size [um]
Cum
ulat
ive
perc
enta
ge o
n si
eve
[%]
200 SD 300 DC 400 DC 500 DC Flash Parteck ODT
Figure 13. Particle size distribution of the different mannitol samples

40
Table 3. Results from the sieving analysis of the different mannitol samples. Particle size fractions that
were selected for further studies in the master project are shown in bold.
Classification observed through particle size analyses % residue on sieve
<63
Sample
Fractions selected
[μm] <45 μm
45-63 μm
63-90 μm
90-125 μm
125-180 μm
180-250 μm
250-355 μm
355-500 μm
500-710 μm
>710 μm
Parteck ODT
180-250 5.89 10.25
16.8 15.99 16.38 14.07 9.88 6.55 4.07
Pearlitol Flash
180-250 0.36 0.6 0.83 2.87 20.65 46.46 26.93 0.89 0.04
Pearlitol 200SD
180-250 0.02 0.88 7.34 28.85 46.54 15.87 0.25 0.04 0.00
Pearlitol 300DC
180-250 0.01 0.13 0.32 0.6 2.11 12.72 61.59 22.37 0.02
Pearlitol 400DC
250-355 0.09 0.17 0.34 1.05 10.23 46.85 32.67 8.41 0.03
Pearlitol 500DC
355-500 0.01 0.01 0.02 0.17 5.73 27.99 29.86 32.37 3.7
For further studies one series of different mannitol samples were selected among those
containing most fine particles. This series contain two samples of co-processed mannitol
specially developed for ODTs (Parteck ODT and Pearlitol Flash) and one pure mannitol
sample (Pearlitol 200SD). From these samples the fraction 180-250 μm was collected, since
the carrier particles of ordered mixtures are recommended to be around 200 μm (Sundell-
Bredenberg and Nystrom, 2001, Yip and Hersey, 1977b). The different mannitol samples
contained different amounts of this fraction. Most fitting to the selected fraction was Pearlitol
Flash with 46.5% of particles in this size range. Both Parteck ODT and Pearlitol 200SD
contained less than 16% particles in the selected size range.
A series of samples was selected for further studies from the mannitol grades that were
manufactured by the same method, named the DC quality. This series was select for studies of
the effect of particle size of the carrier; the selected particle size fractions were 180-250 μm
(Pearlitol 300DC), 250-355 μm (Pearlitol 400DC) and 355-500 μm (Pearlitol 500DC).
Consequently, also a third comparison is possible; the influence of manufacturing method for
the carrier particles 180 - 250 μm (SD quality versus DC quality).

41
4.1.1 Particle size analysis of drug substances
The particle size analysis of grinded sodium salicylate, measured by laser diffraction, showed
a mean particle size of 5.019 micrometer in diameter and a standard deviation about 3.179
(Table 4). The particle size median was calculated to 4.867 micrometer in diameter. The laser
diffraction analysis showed that the particle size distribution is extremely broad for the
micronized powder, ranging from 0.4 micrometer to about 130 micrometer in diameter. Only
10 % of the particles were found to be above 24.11 micrometer.
Particle size analysis of ibuprofen showed larger particles with a mean size of 78.18
micrometer in diameter, and the median was close to 100 micrometer. The volume percentage
gave also an indication of larger particles. Both of the drugs had been sieved screened through
45 micrometer sieves, thus the diameter were expected to be less than this. The big particles
identified for ibuprofen are expected to be aggregates. This substance was found to be
extremely electrostatic.
Table 4: Particle size analysis of drug substances by laser diffraction
Sample Particle size
[μm]
Particle size
Mean Stdev D10 D25 D50 D75 D90
Sodium salicylate 5.019 3.179 24.11μm 11.05μm 4.867μm 2.182μm 1.076μm
Ibuprofen 50 78.18 2.547 139.9μm 120.4μm 98.51μm 74.86μm 48.12μm
4.1.1 Particle shape and morphology Scanning electron microscopy (SEM) micrographs of the two drug substances can be seen in
Figure 14 and 15. The drugs were found to be quite different in shape and morphology. Figure
14 shows sodium salicylate particles as micronized flakes of many different shapes. The
micrograph indicates particles with sharp edges and broad size distribution. In contrast, the
SEM micrograph of ibuprofen in Figure 15 shows particles with a smooth surface and a very
rounded but elongated shape. Ibuprofen has no sharp edges, which could give an indication of
the breaking of particles due to the micronized process. The different particle shapes and
morphology of the drugs are expected to be the main reason for the difference in electrostatic
behaviour.

42
Figure 14. SEM micrograph of sodium salicylate particles; fraction <45 micrometer in diameter
Figure 15. SEM micrograph of Ibuprofen; fraction < 45 micrometer in diameter
Figure 16-21 show microscopy images of the different mannitol samples in the selected sixe
fraction. The images indicate two different types of particles: Parteck ODT (figure 16) and
Pearlitol 200SD (figure 17) showed particles with irregular and pore like structure, which is
typical for spray dried products; whereas Pearlitol Flash (figure 18) seemed to have a more
crystalline surface. Figure 19-21 which are depicting the DC grades of increasing particle
sizes showed more compact and rounded particles, which reflects the manufacturing
procedure of the material.

43
Figure 16. Microscopy image of Parteck ODT; fraction 180-250 micrometer in diameter
Figure 17. Microscopy image Pearlitol 200SD; fraction 180-250 micrometer in diameter
Figure 18. Microscopy image Pearlitol Flash; fraction 180-250 micrometer in diameter.

44
Figure 19. Microscopy image Pearlitol 300DC; fraction 180-250 micrometer in diameter
Figure 20. Microscopy image Pearlitol 400DC; fraction 250-355 micrometer in diameter
Figure 21. Microscopy image Pearlitol 500DC; fraction 355-500 micrometer in diameter
45
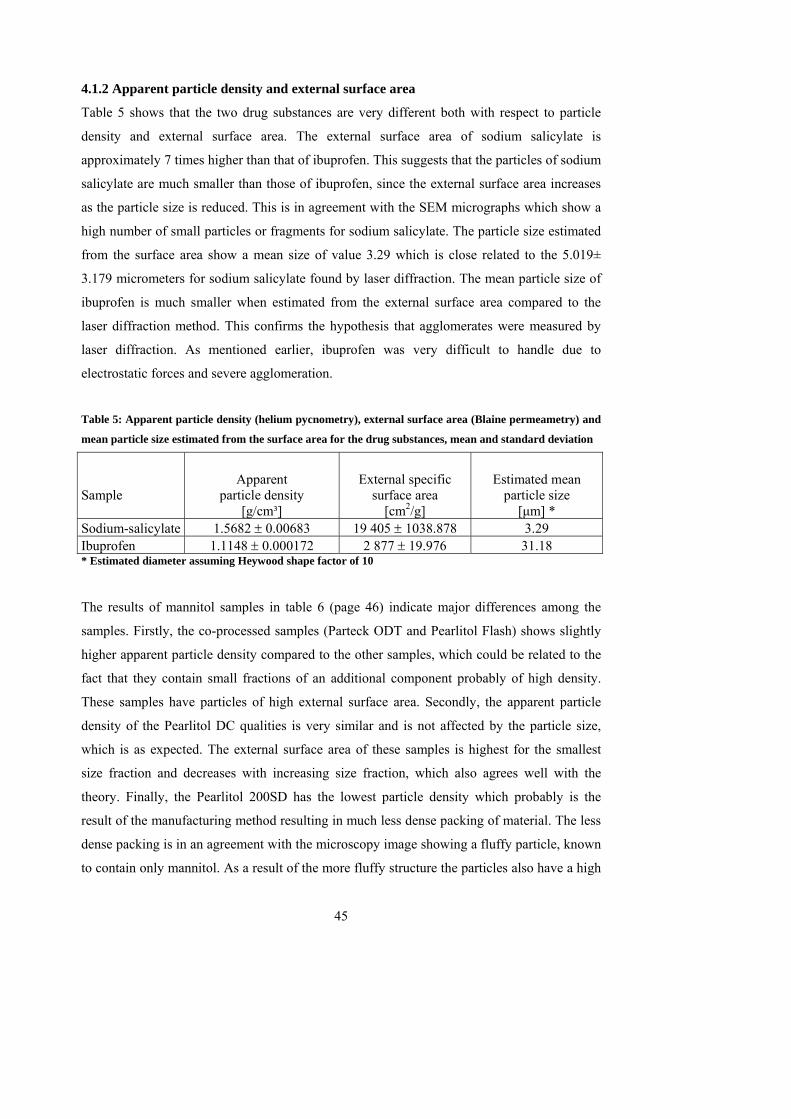
4.1.2 Apparent particle density and external surface area
Table 5 shows that the two drug substances are very different both with respect to particle
density and external surface area. The external surface area of sodium salicylate is
approximately 7 times higher than that of ibuprofen. This suggests that the particles of sodium
salicylate are much smaller than those of ibuprofen, since the external surface area increases
as the particle size is reduced. This is in agreement with the SEM micrographs which show a
high number of small particles or fragments for sodium salicylate. The particle size estimated
from the surface area show a mean size of value 3.29 which is close related to the 5.019±
3.179 micrometers for sodium salicylate found by laser diffraction. The mean particle size of
ibuprofen is much smaller when estimated from the external surface area compared to the
laser diffraction method. This confirms the hypothesis that agglomerates were measured by
laser diffraction. As mentioned earlier, ibuprofen was very difficult to handle due to
electrostatic forces and severe agglomeration.
Table 5: Apparent particle density (helium pycnometry), external surface area (Blaine permeametry) and
mean particle size estimated from the surface area for the drug substances, mean and standard deviation
Sample
Apparent particle density
[g/cm³]
External specific surface area
[cm2/g]
Estimated mean particle size
[μm] * Sodium-salicylate 1.5682 ± 0.00683 19 405 ± 1038.878 3.29 Ibuprofen 1.1148 ± 0.000172 2 877 ± 19.976 31.18 * Estimated diameter assuming Heywood shape factor of 10 The results of mannitol samples in table 6 (page 46) indicate major differences among the
samples. Firstly, the co-processed samples (Parteck ODT and Pearlitol Flash) shows slightly
higher apparent particle density compared to the other samples, which could be related to the
fact that they contain small fractions of an additional component probably of high density.
These samples have particles of high external surface area. Secondly, the apparent particle
density of the Pearlitol DC qualities is very similar and is not affected by the particle size,
which is as expected. The external surface area of these samples is highest for the smallest
size fraction and decreases with increasing size fraction, which also agrees well with the
theory. Finally, the Pearlitol 200SD has the lowest particle density which probably is the
result of the manufacturing method resulting in much less dense packing of material. The less
dense packing is in an agreement with the microscopy image showing a fluffy particle, known
to contain only mannitol. As a result of the more fluffy structure the particles also have a high

46
external surface area. The values are in the same size range as for the co-processed types.
These results confirm that it will be interesting to compare Pearlitol 200SD and 300DC for
preparation of ordered mixtures; the particles are of very different character even though the
particle size fraction is the same.
Table 6. Apparent particle density (helium pycometry) and external specific surface area (steady state
permeametry) of the mannitol samples, mean and standard deviation
Sample
Investigated particle size fraction
[μm]
Apparent particle density
[g/cm³]
External specific surface area
[cm2/g] Parteck ODT 180-250 1.4998± 0.00123 997± 29.577 Pearlitol Flash 180-250 1.4978± 0.000352 874± 10.546 Pearlitol 200SD 180-250 1.4679± 0.000454 870± 5.261 Pearlitol 300DC 180-250 1.4815± 0.000304 432± 2.229 Pearlitol 400DC 250-355 1.4816± 0.000364 332± 2.159 Pearlitol 500DC 355-500 1.4804± 0.000514 246± 2.801 Table 7. Amount of drug (g) required to form a monoparticulate layer on one hundred gram of carrier
particles calculated from external surface area of drug and mannitol samples
Amount of drug required to form a monoparticulate layer on carrier particles Sample
Investigated particle size fraction
[μm] Sodium-salicylate
[g] Ibuprofen
[g] Parteck ODT 180-250 21 139 Pearlitol Flash 180-250 18 121 Pearlitol 200SD 180-250 18 121 Pearlitol 300DC 180-250 9 60 Pearlitol 400DC 250-355 7 46 Pearlitol 500DC 355-500 5 34
The measurements of external surface area can be used to calculate the appropriate amount of
drug that should be mixed with each of the carriers to form an ordered mixture. Table 7 shows
the amount of drug necessary to form a monoparticulate layer around 100 g of the different
carrier particles. The amounts are calculated based on the external surface area of the drug
particles (Table 5) (page 45) and the different types of mannitol samples (table 6). The
mannitol samples of high external surface area (Parteck ODT, Pearlitol Flash and 200SD)
required significantly higher amount of drug than the DC samples of low external surface
area. For the DC samples there are also an effect of particle size, since the particles size is
affecting the external area. Sodium salicylate is much better suited for preparation of ordered

47
mixtures than ibuprofen, since the particle size is much smaller and the surface area is
correspondingly higher. The amount of drug required to form a monoparticulate layer is more
reasonable for sodium salicylate. The results of ibuprofen should be used with big caution
since the material is associated with high degree of agglomeration due to electrostatic forces.
4.1.3 Powder flow properties
Bulk and tapped density
It is necessary for carriers that are supposed to be used for direct compaction to possess good
flow and compression properties. The packing characteristics of the mannitol samples are
calculated as the Hausner ratio and Carr Index. These parameters also give an indication of
the flowability of the particles, in this case the carrier particles. From the results presented in
table 8 (page 48), five of the six mannitol samples achieved flow character good based on the
Hausner ratio, which is characterised by a HR-value between 1.12 and 1.18. The last sample
Pearlitol 500DC showed excellent flow character (1.00-1.11). The results from calculation of
Carr Index confirmed these findings. Both Hausner ratio and Carr Index characterises all the
carrier particles as well suitable for direct compaction.
Powder flow rate and angle of repose
The characteristic related to angle of repose is given by the friction between particles, known
as the resistance to movement between particles. Very well flowing materials have a low
possible angle of repose. From the results shown in table 8 (page 48) all angle of repose
degrees for the mannitol samples showed flow character excellent, i.e. an angle in the range
25-30. The results given by the angle of repose showed a rank order from the poorest to the
best as followed; Pearlitol 200SD, 500DC, 400DC, Flash, 300DC and Parteck ODT. Looking
at the group of the Pearlitol DC samples of different size fractions a small increase in
flowability with decreasing particle size could be identified from 500DC 400DC 300DC.
This suggests that there is less friction between the particles and can be a result of more
spherical particle shape. Among the samples of particle size fraction 180-250 micrometer in
diameter (Parteck ODT, Pearlitol 200SD, Pearlitol Flash and Pearlitol 300DC) only small
differences in angle of repose was found. Pearlitol 300 DC had a very similar angle of repose
value as Flash, better than 200SD but poorer than Parteck ODT. Surprisingly, the flow rate of
the carriers showed quite different results: 500DC showed the highest flow rate with 20.22
gram per second, which is long compared to the 200SD with only 6.32 gram per second. They

48
were ranked from low to high flow rate as followed; 200SD, 400DC, 300DC, Flash, Parteck
ODT and 500DC. This might be explained by the particle size; at constant mass a powder of
small particles sizes contains a higher number than a powder of high particle size. The flow
rate measure the amount of powder per seconds and will therefore favours the powder of
small particle size. Most of the samples showed some degree of electrostatic tendency,
observed as sticking to the glass tract, only Parteck ODT and Pearlitol 500 DC did not show
this behaviour. It can be concluded that all powder materials suggested as carriers for
preparation of ordered mixtures were found to have satisfying flow, which is important in the
current study both for the ordered mixtures and for the filling of the dies in mini-tablett
production.
Table 8. Results from both bulk and tapped density, and powder flow rate and angle of repose for the
mannitol carriers
Material [g] 50 Graduated cylinder [ml] 250 100
Carriers Flash Parteck ODT 200SD* 300DC× 400DC 500DC Particle size fraction [μm] 180-250 180-250 180-250 180-250 205-355 355-500
untapped volume 106 106 104 79 78 79 10 taps 100 100 98 76 76 76 500 taps 94 92 92 70 69 71 1250 taps 92 92 92 69 68 71
Hausner ratio 1.15 1.15 1.13 1.14 1.15 1.11 Flow character based
on Hausner ratio Good Good Good Good Good Excellent Carr Index 13.21 13.21 11.54 12.66 12.82 10.13
Flow character based on Carr Index Good Good Good Good Good Excellent/Good
Flow rate [g/sec]¯ 10.21 19.31 6.32 9.81 9.06 20.22 Angle of repose 27.35 26.92 29.54 27.32 28.34 29.05
Flow character based on angle of repose Excellent Excellent Excellent Excellent Excellent Excellent *200SD comes from a different batch compared to the reset of the project
× Particle size fraction 180-250 µm in diameter is collected from 400DC instead of 300DC

49
4.2 Powder mixture characterisation
For preparation of ordered mixtures, the co-processed mannitol types were excluded. This
was because of limited time. The two series that will be followed in further evaluations are the
different particles sizes of the DC materials and the two manufacturing processes (DC and SD
for the size fraction 180-250 µm).
4.2.1 Calculated degree of surface coverage for ordered mixtures
Based on the calculation of required amounts of drug to cover the surface of carrier particles
with a monolayer of micronized drug (see table 7, section 4.1.2) very different amounts of
drug should be used for the selected mannitol carriers. Therefore, it was decided to add a
constant amount of 1 % w/w of drug for preparation of ordered mixture. The calculated
surface coverage from addition of 1 % sodium salicylate to the different carrier types is shown
in table 9. The surface area unit ratio for the ordered mixtures was found to increase from the
lowest particle size fraction to the largest. For the DC products the calculated surface area unit
ratio increased roughly by almost 50 % for every 100 µm in diameter. The increased surface
coverage is in good agreement with the increased external surface area determined for the
samples. When it comes to the two samples of different manufacturing process (DC and SD,
180-250 µm in diameter), the Pearlitol 200SD with the highest external surface area shows
the lowest surface coverage, as expected. The surface area unit ratio of Pearlitol 300DC was
found to be twice that of 200SD, which agrees well with the size of the estimated external
surface area, which also differed by a factor 2.
Table 9; Calculations of the degree of surface coverage by 1 % (w/w) micronized sodium-salicylate
particles (mean particle size 3.29 µm) on the surface of mannitol carrier particles of different size
fractions based on external surface area of drug and mannitol samples
Sample Investigated size fraction [µm]
Calculated surface area unit ratio
Pearlitol 200SD 180-250 0.056318231 Pearlitol 300DC 180-250 0.113495204 Pearlitol 400DC 250-355 0.147721920 Pearlitol 500DC 355-500 0.199281622

50
4.2.2 Powder flow properties
Bulk and tapped density
Table 10 summarises (page 51) all powder flow results obtained for the ordered mixtures. The
packing characteristic of the powder mixtures given by Hausner ratio and Carr Index
expressed flow character good for all (HR 1.12-1.18 and CI 11-15). Hausner ratio was
actually found to be identical for all the ordered mixtures. Carr Index showed very small
differences in values. Most ordered mixtures had the same packing characteristic (good) as
the used carriers (see section 4.1.3.), only 500DC was moved within the interval of good flow
instead of being borderline excellent – good, as for the carrier.
Powder flow rate and angle of repose
The flow character of the ordered mixtures expressed by angle of repose indicated excellent
flow for all the ordered mixtures. All ordered mixtures showed the same flow characteristic as
the raw material, based on angle of repose, even though values were slightly lower.
In contrast to the flow rates of the carriers, where only 1 showed a flow rate above 20 g/sec,
all ordered mixtures showed flow rates above 20 g per seconds, which represents excellent
flow. None of the ordered mixtures were sticking to the glass tract. The decreased degree of
electrostatic tendency and the improved flow rate for most of the ordered mixtures could be
explained by the use of magnesium stearate prior to the compaction of mini-tablets. Jones
suggested that glidants were able to improve flowability by minimizing electrostatic charge
(Jones, 1970).

51
Table 10. Results from both bulk and tapped density, and powder flow rate and angle of repose for the
ordered mixtures.
Material [g] 50 Graduated cylinder [ml] 250 100
Ordered Mixtures 200SD 300DC 400DC 500DC Particle size fraction [μm] 180-250 180-250 205-355 355-500
untapped volume 106 79 79 77 10 taps 100 76 76 72 500 taps 94 71 71 68 1250 taps 94 70 70 68
Hausner ratio 1.13 1.13 1.13 1.13 Flow character based
On Hausner ratio Good Good Good Good Carr Index 11.32 11.39 11.39 11.69
Flow character based on Carr Index Good Good Good Good
Flow rate [g/sec] 21.68 29.88 27.83 25.82 Angle of repose 26.57 25.84 25.84 26.32
Flow character based on angle of repose Excellent Excellent Excellent Excellent
4.2.3 Homogeneity
Conventional powder mixture
A powder mixture of high quality should possess high degree of homogeneity. Table 11 (page
52) shows the results obtained for homogeneity of a conventional powder mixture (10 min in
Turbula mixer) characterized by sampling randomly 30 samples of 20 mg ± 2mg. The powder
mixture consisted of Pearlitol 300 DC (180-250 µm) and 1 % (w/w) of sodium salicylate
screened through a 500 µm sieve. The homogeneity was expressed as the relative standard
deviation of the normalised values, and was found to be 48.15 %. This indicates a powder
mixture with very poor homogeneity. However, the relative standard deviation of the
normalised value decreased approximately 3 times to 16.68 % when the sample size was
increased from 20±2 mg to 200±10 mg. It is worth noticing that only 10 random sample units
were withdrawn from the powder mixture at the highest mass per unit. The powder mixture
showed improved quality due to the increased sample size. It is worth keeping in mind that
the variation detected in sampling strongly will depend on the sample size. This is in an
agreement of the findings in literature (Sundell-Bredenberg and Nyström., 2001). Despite the
lower variation obtained in this particular powder mixture by increasing the sample size, the
powder mixture can not be regarded as a homogenous when the relative standard deviation of
more than 16%. Possible explanation of the in-homogeneity can due a wide distribution of

52
particle size of the drug (some very large particles were present) and the fact that the filling
load was not optimised in the glass jar used as container within the original container of the
Turbula mixer.
The wide particle size distribution is unfavourable for making a homogenous powder mixture
taking into consideration that segregation could happen (Hersey, 1975, Poux et al., 1991,
Egermann, 1980). Contamination of some very large particles will have a large influence on
the variation especially in case of small sample sizes .The effect of sample size is in
agreement with results from earlier findings and highly attributed to variables like
agglomeration tendencies and wide particle size distribution (Nystrom and Malmqvist, 1980)
The results give reason to believe that by increasing the sample size the homogeneity will
appear to be improved since the sample investigates a higher number of particles. This further
implies that for tablets of high mass 400-500mg it is not as critical that the powder mixture is
homogenous down to particle level, but for small units, such as mini-tablets with a mass of 6-
8 mg homogeneity is extremely critical. To ensure the homogeneity of powders that will be
used for preparation of mini-tablets the sample size is a critical factor. In this Thesis a micro-
thief is used and the sample size for 20 mg was chosen. Even smaller sample sizes could be
beneficial since the sample size should ideally approximate the size of the final dosage form.
Table 11. The degree of homogeneity of a 1 % w/w conventional powder mixture consisting of sodium
salicylate (500 µm) with Pearlitol 300DC (180-250 µm expressed as relative standard deviation of
normalised values (n=30)
* n=10 Degree of homogeneity
Sample size
Characteristics
20 [mg] 200 [mg] *
Relative standard deviation [%] 48.15 16.68

53
Ordered powder mixture
The filling load of the container (glass jar) and the mixing time were two parameters to
optimize in order to prepare mixtures of high homogeneity. Results on filling load are not
shown. From the results presented in table 12 (page 54), the ordered mixtures showed a higher
relative standard deviation and hence a decreasing tendency of homogeneity moving from the
small particle size fraction to the large particle size fraction. The lowest particle size fraction
(180-250 µm in diameter) showed very low relative standards deviation (random sampling,
n=30, sample size 20 mg ± 2mg) indicating that a high homogeneity was obtained after 24
hours of mixing. This complies for both the SD and the DC quality. The two carriers of larger
particle size fraction (250-355 µm and 355-500 µm in diameter) were not found to have
sufficiently low relative standard deviation until after 48 hours of mixing. All ordered
mixtures were prepared in duplicate except the 200DC, due to lack of material. The first
ordered mixture of 400DC showed a relative standard deviation below 5 % already after 24 h,
but upon replication the mixing time was determined to 48 h. The same was seen for the
500DC sample. One mixture was found with a low relative standard deviation after 24 hours,
the replication seemed to require even longer mixing times than 24 hours.
From the results it can be seen that utilizing carriers with particle size around 200 µm (180-
250 µm) required shorter mixing time compared to the larger particle sizes Sundell-
Bredenberg and Nyström were mixing for 72 hours in order to obtain ordered mixtures of
0.15 % (w/w) drug particle size fraction<10 µm and carriers around 200 µm (Sundell-
Bredenberg and Nystrom, 2001). They showed low variation in drug content (close to 2 %)
after 72 hours. The homogeneity was reported to increase with an increase in drug proportion
from 0.015 % (w/w) to 0.15 % (w/w)) (Sundell-Bredenberg and Nystrom, 2001).The results
in table 12 showed that less variation in drug content was found using only 48 hours for the
best duplicates of particle size fractions 180-250 µm and 250-335 µm. The higher proportion
used in this study (1 % w/w) seems to be in agreement with the suggested theory of an
increasing tendency of increased homogeneity at higher drug proportions, provided that the
drug proportions is less than the definite number of micronized particles that maximally can
adhere to the carrier particles. To further reduce the variation in the ordered mixtures of the
current study, longer mixing times could be tried out, maybe 72 hours would eliminate the
variation seen in the duplicates. Also selection of a more narrow size distribution of the
carrier particles could possibly contribute to reduce the variation.

54
Table 12. The degree of homogeneity of ordered mixtures of 1% w/w sodium salicylate (approximately 3.3
µm in diameter based on external surface area) mixed with different mannitol carriers of defined particle
size fractions expressed as relative standard deviation of normalised values (n= 30). (The bold samples
were selected for preparation of mini-tablets).
Degree of homogeneity expressed as relative standard deviation [%] 200SD 300DC 400DC 500DC
Mixing time
[hours] 180-250 µm 180-250 µm 250-355 µm 355-500 µm 24 2.26 5.95 3.54* 4.2 9.82 20.73 3.25 48 1.39 1.20 2.37 1.60 2.24 7.84 2.96
* Additional 30 additional sample units measured; relative standard deviation of 3.12 %
4.2.4 Scanning electron microscopy
SEM micrographs were made of the raw material of the carriers and random samples of what
was assumed to be ordered mixtures to look for proof of adhering drug particles on the
surface of the carrier particles of the ordered mixtures. Based on earlier findings the sodium
salicylate particles are small, with a mean diameter around 3.29 µm and a wide size
distribution. The SEM micrographs of the drug (Figure 14, section 4.1.1) indicate that the
particles should be flakes or fragments of such. The SEM micrographs of mannitol carriers
and ordered mixtures can be seen in figure 22-25, (page 55 and 56). It is hard to differentiate
between raw material micrographs and the micrographs of ordered mixtures due to the fact
that the surface of mannitol also contain small particles, which may be dust (very fine
particles) adhering to the material. The surface of the carrier particles in the ordered mixtures
seems to be smoother than for the raw materials, which could be a result of abruption during
mixing (analogues to friability test). This makes the micrographs hard to interpret as means of
showing physical evidence of adhering particles at the surface of a carrier in the ordered
mixtures. With regard to the calculated surface area unit ratio in the powder mixtures, the
higher coverage of adhering particles to the carriers were difficult to prove by looking at the
micrographs in figure 22-25. At the moment the SEM micrographs are inconclusive. It might
have been easier to interpret the micrographs if the raw materials had also been subjected to
mixing similar to the ordered mixtures (without addition of drug), thus experiences similar
abruption and smoothening of their surfaces.

55
Figure 22. SEM micrographs of Pearlitol 200SD (left) and the surface of the corresponding ordered mixture of Pearlitol 200SD with 1 % (w/w) sodium salicyalte (right)
Figure 23. SEM micrographs of Pearlitol 300DC (left) and the surface of the corresponding ordered mixture of Pearlitol 300DC with 1 % (w/w) sodium salicyalte (right)

56
Figure 24. SEM micrographs of Pearlitol 400DC (left) and the surface of the corresponding ordered mixture of Pearlitol 400DC with 1 % (w/w) sodium salicyalte (right)
Figure 25. SEM micrographs of Pearlitol 500DC (left) and the surface of the corresponding ordered mixture of Pearlitol 500DC with 1 % (w/w) sodium salicyalte (right)

57
4.3 Mini-tablet characterisation
4.3.1 Mini-tablet mass and hardness.
Mini-tablets should have a very low mass variation since this is connected to dose variation.
This is especially important for low dose mini-tablets. The results from the test of uniformity
of mass (European Pharmacopeia, Ch.2.9.5. Uniformity of mass of single unit dose
preparation) is shown in table 13 and showed that all the 4 batches of mini-tablets complied
with the uniformity of mass test, with a good margin. The uniformity of mass test allow not
more than one mini-tablet to be outside the deviation of 10 percentage of the average mass,
and none should deviate more than 20 % from the average mass. The highest percentage
deviation found for the mini-tablets (4.00 %) was found in the batch of mini-tablets made
from ordered mixture of Pearlitol 300DC.
Table 13. Uniformity of mass in mini-tablets of ordered mixtures of 1 % (w/w) sodium salicylate and
different mannitol carriers (Eur.Pharm. 7.0, chapter 2.9.5 Uniformity of mass of single dose preparations;
tablets less than 80 mg), n=20
Carrier 200 SD 300 DC 400 DC 500 DC
Particle size fraction [μm] 180-250 180-250 250-355 355-500
Mean mass in mg (n=20) 7.98 8.03 7.99 8.04
Max % deviation 1.71 4.00 3.41 3.93
Number of mini-tablets deviating
10 % from average mass
0 0 0 0
Number of mini-tablets deviating
20 % from average mass
0 0 0 0
Comply with the requirements yes yes Yes yes
The mini-tablets should possess a sufficient mechanical stability in order to assure stability
during handling. Table 14 (page 58) shows a summary of the compression conditions and the
resulting mini-tablets. The compression force was tried kept at 8.00 kN. Nevertheless, the
compression force varied a little. The mean compression force from the lowest to the highest
was 7.93 and 8.04 kN. Aiming at developing ODT one requirement of the mini-tablets is that
it should dissolve rapidly in the mouth; the mini-tablets should still have a satisfying
hardness. All mini-tablets showed a mean crushing force above 11 Newton (see table 14)
(page 58). The highest crushing force was measured for the mini-tablets made of an ordered
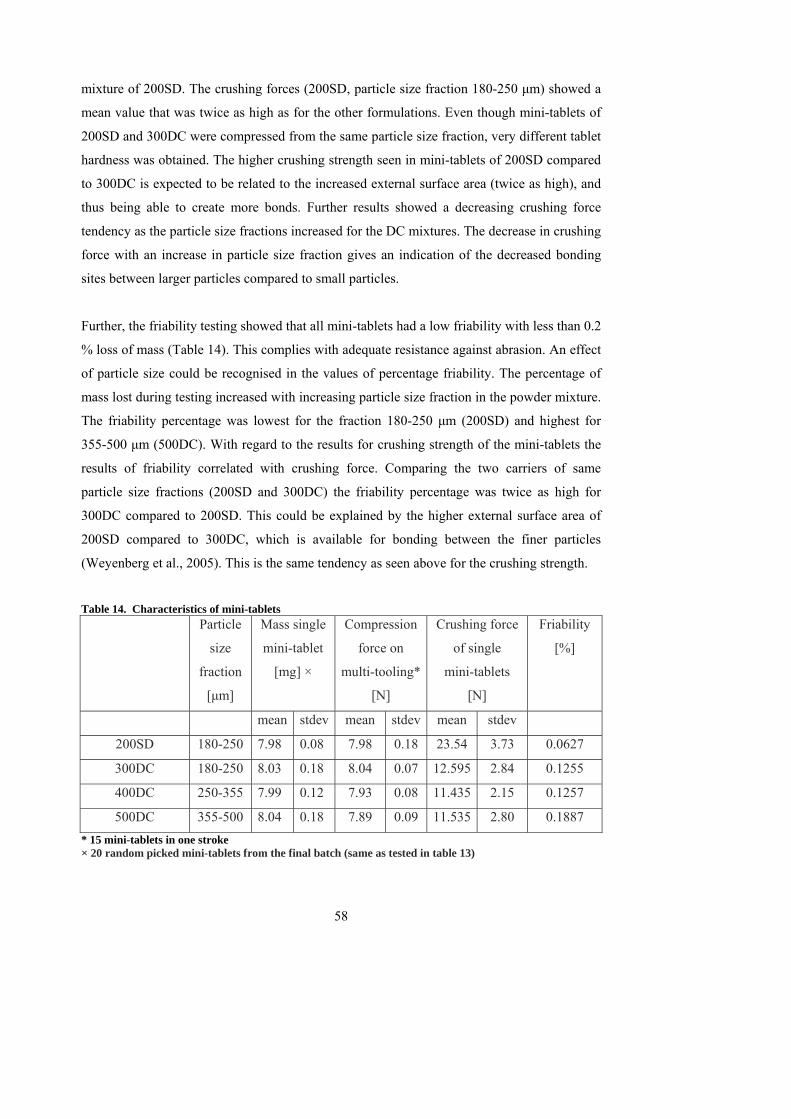
58
mixture of 200SD. The crushing forces (200SD, particle size fraction 180-250 μm) showed a
mean value that was twice as high as for the other formulations. Even though mini-tablets of
200SD and 300DC were compressed from the same particle size fraction, very different tablet
hardness was obtained. The higher crushing strength seen in mini-tablets of 200SD compared
to 300DC is expected to be related to the increased external surface area (twice as high), and
thus being able to create more bonds. Further results showed a decreasing crushing force
tendency as the particle size fractions increased for the DC mixtures. The decrease in crushing
force with an increase in particle size fraction gives an indication of the decreased bonding
sites between larger particles compared to small particles.
Further, the friability testing showed that all mini-tablets had a low friability with less than 0.2
% loss of mass (Table 14). This complies with adequate resistance against abrasion. An effect
of particle size could be recognised in the values of percentage friability. The percentage of
mass lost during testing increased with increasing particle size fraction in the powder mixture.
The friability percentage was lowest for the fraction 180-250 μm (200SD) and highest for
355-500 μm (500DC). With regard to the results for crushing strength of the mini-tablets the
results of friability correlated with crushing force. Comparing the two carriers of same
particle size fractions (200SD and 300DC) the friability percentage was twice as high for
300DC compared to 200SD. This could be explained by the higher external surface area of
200SD compared to 300DC, which is available for bonding between the finer particles
(Weyenberg et al., 2005). This is the same tendency as seen above for the crushing strength.
Table 14. Characteristics of mini-tablets Particle
size
fraction
[μm]
Mass single
mini-tablet
[mg] ×
Compression
force on
multi-tooling*
[N]
Crushing force
of single
mini-tablets
[N]
Friability
[%]
mean stdev mean stdev mean stdev
200SD 180-250 7.98 0.08 7.98 0.18 23.54 3.73 0.0627
300DC 180-250 8.03 0.18 8.04 0.07 12.595 2.84 0.1255
400DC 250-355 7.99 0.12 7.93 0.08 11.435 2.15 0.1257
500DC 355-500 8.04 0.18 7.89 0.09 11.535 2.80 0.1887 * 15 mini-tablets in one stroke × 20 random picked mini-tablets from the final batch (same as tested in table 13)

59
Compared to the orally disintegrating mini-tablets (ODMTs) in the study of Stoltenberg and
Breitkreutz all the presented ODMTs in this study passed what they call sufficient crushing
strength >7 N and low friability <1% (Stoltenberg and Breitkreutz, 2011).
4.3.2 Homogeneity
The mini-tablet batches did all comply with the uniformity of content of single dose
preparations test (European Pharmacopeia, Ch. 2.9.6.). For one of the mini-tablet batches, the
one prepared from 400DC, one mini-tablets was outside the content drug limit of 115 % of the
average content (drug content 1.027 %), but the content drug of the mini-tablet was still inside
the limit of 125 % (drug content 1.117 %) of the average content (table 15). Since it was only
1 mini-tablet that was outside 115 %, and it was not outside the 125% limit, the batch
complies with the test. The other batches had no problem to comply with the uniformity of
content of single dose preparations test.
Table 15: Uniformity of content of mini-tablets (European Pharmacopeia 7.0, chapter 2.9.6 Uniformity of
content of single dose preparations; tablets), n=10
Carrier 200SD 300DC 400DC 500DC
Particle size fraction [μm] 180-250 180-250 250-355 355-500
Average content (n=10) 0.9007 0.9009 0.8933 0.9833
Min value; % deviation
from average (limit 85%)
98.68 97.79 97.77 92.74
Max value; % deviation
from average (limit 115%)
101.46 103.11 102.87 103.52
Number of mini-tablets deviating
15 % from average dose
0 0 1 0
Number of mini-tablets deviating
25 % from average dose
0 0 0 0
Comply with the requirements yes yes yes yes

60
The results presented in table 16, show the degree of homogeneity in the ordered mixtures and
the corresponding mini-tablets. According to table 16, the high dose homogeneity from the
ordered mixtures was also proven in mini-tablets. The same increasing tendency of the
relative standard deviation with the particle size of the powder mixture could be recognised in
the mini-tablets as previously seen for the ordered mixtures.
Table 16: The homogeneity of the 1 % (w/w) ordered mixtures of sodium salicylate with different
mannitol carriers characterised by the relative standard deviation of normalised values
Degree of homogeneity expressed as relative standard deviation [%]
Type of sample 200SD
180-250 µm
300DC
180-250 µm
400DC
250-355 µm
500DC
355-500 µm
Ordered mixture
[48 hours] *
1.39 1.20 1.60 2.96
Mini-tablet** 0.94 1.77 1.79 3.39 *n=30, ** n=10
4.3.3 Simulated wetting test
Orally disintegrating tablets should be fast dissolving drug formulation with a disintegration
time of less than 3 minutes according to the European pharmacopoeia. All mini-tablets
complied with this time. The simulated wetting test was developed by Park et al. as a
supplementary test to disintegration time especially for ODTs (Park et al., 2008). The mean
values of the simulated wetting times (SWT) are presented in figure 26 (page 61) and was
52.5, 58.1, 65.6 and 71.8 seconds. The mini-tablets were ranked in following previous order
300DC, 200SD, 400DC and 500DC. Only mini-tablets made of ordered mixtures 300DC and
200SD with respect to mean values passed the test for possessing fast dissolving ODT
properties with less than 60 seconds as categorized by Krause and Breitkreutz (Krause and
Breitkreutz, 2008). The standard deviation values for the two were 8.64 and 12.03 proving
differences within the 10 randomly examined tablets of each batch. It is worth noticing that
the mini-tablets in the current study does not contain any disintegrant, which is often used in
ODTs. The specialized ODT materials (Pearlitol Flash and Parteck ODT) did not make it to
the mini-tablet stage due to lack of time. It would have been interesting to see whether they
would have obtained lower SWTs in our studies. An increased SWT with increasing particle

61
size fraction of the carrier was shown. However, the standard deviations did overlap (figure
26).
0
10
20
30
40
50
60
70
80
90
100
180-250 250-355 355-500
Particle sie fraction [um]
Sim
ulat
ed w
ettin
g tim
e [s
]
DC SD
Figur 26. Mean simulated wetting time for mini-tablets of ordered mixtures of different size fraction of
mannitol carriers. The simulated wetting times time is taken as the time when the blue dye solution cover
the entire surface of the mini-tablets
The passing of the test for being a fast dissolving ODT based on mean times, indicated that
200SD and 300DC would be the most suitable choices for making appropriate paediatric
formulations. However, when referring to the European Pharmacopoeia it was given a
disintegration time, but no further specifications related to hardness or friability. So in
principle all mini-tablets could have been made with a lower pressure and thus a faster
disintegrating time. Despite of that it is though in general agreement that a fast disintegrating
time together with high crushing strength and low friability is the most desirable. In fact,
brittle tablets require peel able blister packing which is related to higher production costs
(Abdelbary et al., 2004). The results from testing of friability and crushing force indicated that
200SD ODTs could have been made with a lower compression force and still having a
suitable compactibility, but a faster dissolution time being even more appropriate dosage form
for children. Stoltenberg and Breitkreutz made a preliminary experiment showing sodium
stearyl fumarate to be a beneficial lubricant over magnesium stearate related to simulated
wetting times and crushing strength (Stoltenberg and Breitkreutz, 2011). Stoltenberg and
Breitkreutz showed simulated wetting times of less than 25.2 seconds (n=10) using
superdisintegrants at compression force of 8 kN (Stoltenberg and Breitkreutz, 2011).
62
5. Conclusion
Ordered mixtures were obtained from different qualities of mannitol as carrier particles and
micronized sodium salicylate as drug particles. All the ordered mixtures showed high dose
homogeneity after 48 hours of mixing. The lowest particle size fraction (180-250 μm) resulted
in ordered mixture after 24 hours and the larger particle size fractions (250-355 μm and 355-
500 μm) required 48 hours mixing to obtain satisfying low variation. The homogeneity of the
ordered mixtures showed a slight decrease with increasing particle size of the carrier particle
size, which is probably related to the lower external surface area of the larger particles. No
difference was found in the homogeneity between batches of similar particle size, but
different external surface area (200SD vs. 300DC).
The same high dose homogeneity as found for the ordered mixtures was seen in the mini-
tablets. All the produced batches of mini-tablets complied with the European Pharmacopeia
requirements for uniformity of mass and content for single dose preparations.
Further, the mini-tablets demonstrated low friability’s, high crushing strengths and a suitable
simulated wetting time compared to literature. The simulating wetting test (all batches were
fully wetted within 80 seconds, implies that the formulations also comply with the European
Pharmacopoeia requirements for ODTs of disintegration within 3 minutes. All batches of
mini-tablets proved suitability as orally disintegrating mini-tablets. The most suitable among
the formulations might be the mini-tablets prepared of ordered mixture 200SD; it showed the
lowest friability, the highest crushing strength and had a simulated wetting time of less than
one minute.
6. Future perspectives
For further studies it would have been included the co-processed mannitol qualities for
preparation of ordered mixtures and mini-tablets. Then it would have been interesting to
prepare ordered mixtures using both higher and lower coverage of micronized adhering to
carriers. All mini-tablets could have been made using two more compression forces for
comparisons and to look for tendencies. Further, tablets could have been compacted using the
ordered mixtures and characterised. The mini-tablets could have been compacted into larger
tablets and those tablets could have been characterised.

63
7. References ABDELBARY, G., PRINDERRE, P., EOUANI, C., JOACHIM, J., REYNIER, J. P. &
PICCERELLE, P. 2004. The preparation of orally disintegrating tablets using a hydrophilic waxy binder. International Journal of Pharmaceutics, 278, 423-433.
ALDERBORN, G., DUBERG, M. & NYSTROM, C. 1985. Studies on direct compression of tablets. X. Measurement of tablet surface area by permeametry. Powder Technol., 41, 49-56.
AULTON, M. E. 2007. Aulton's pharmaceutics: the design and manufacture of medicines, Edinburgh, Churchill Livingstone.
BHARAWAJ, S., JAIN, V., SHARMA, S., JAT, R. C. & JAIN, S. 2010. Orally disintegrating tablets: a review. Drug Invent. Today, 2, 81-88.
BLUMBERG, R. & MARITZ, J. S. 1953. Mixing of solid particles. Chemical Engineering Science, 2, 240-246.
BREDENBERG, S., DUBERG, M., LENNERNAS, B., LENNERNAS, H., PETTERSSON, A., WESTERBERG, M. & NYSTROM, C. 2003. In vitro and in vivo evaluation of a new sublingual tablet system for rapid oromucosal absorption using fentanyl citrate as the active substance. Eur. J. Pharm. Sci., 20, 327-334.
CRAM, A., BREITKREUTZ, J., DESSET-BRETHES, S., NUNN, T. & TULEU, C. 2009. Challenges of developing palatable oral paediatric formulations. Int J Pharm, 365, 1-3.
DE, B. C., VERVAET, C., FIERMANS, L. & REMON, J. P. 2000. Matrix minitablets based on starch/microcrystalline wax mixtures. Int. J. Pharm., 199, 195-203.
EGERMANN, H. 1980. Suggestions on the Nomenclature of Powder Mixtures. Powder Technology, 26, 235-237.
ERIKSSON, M., NYSTRÖM, C. & ALDERBORN, G. 1993. The use of air permeametry for the assessment of external surface area and sphericity of pelletized granules. International Journal of Pharmaceutics, 99, 197-207.
FLEMMING, J. & MIELCK, J. B. 1995. Requirements for the production of microtablets: suitability of direct-compression excipients estimated from powder characteristics and flow rates. Drug Dev. Ind. Pharm., 21, 2239-51.
HARNBY, N. 2000. An engineering view of pharmaceutical powder mixing. Pharmaceutical Science & Technology Today, 3, 303-309.
HERSEY, J. A. 1975. Ordered mixing: A new concept in powder mixing practice. Powder Technology, 11, 41-44.
HIRANI, J. J., RATHOD, D. A. & VADALIA, K. R. 2009. Orally disintegrating tablets: a review. Trop. J. Pharm. Res., 8, 161-172.
HOGG, R. 2009. Mixing and Segregation in Powders: Evaluation, Mechanisms and Processes. Kona Powder and Particle Journal, 3-17.
JOHANSON, J. R. 1996. Predicting segregation of bimodal particle mixtures using the flow properties of bulk solids. Pharm. Technol., 8, 38-44.
JONES, T. M. 1970. Effect of Glidant Addition on Flowability of Bulk Particulate Solids. Journal of the Society of Cosmetic Chemists, 21, 483-&.
KRAUSE, J. & BREITKREUTZ, J. 2008. Improving Drug Delivery in Paediatric Medicine. Pharmaceutical Medicine, 22, 41-50.
LAWRENCE, L. R. & BEDDOW, J. K. 1969. Powder segregation during die filling. Powder Technology, 2, 253-259.
LENNARTZ, P. & MIELCK, J. B. 1998. Minitabletting: improving the compactibility of paracetamol powder mixtures. Int. J. Pharm., 173, 75-85.
LLOYD, P. J., YEUNG, P. C. M. & FRESHWATER, D. C. 1970. Mixing and blending of powders. J. Soc. Cosmet. Chem., 21, 205-20.

64
LOPES, C. M., LOBO, J. M. S., PINTO, J. F. & COSTA, P. 2006. Compressed mini-tablets as a biphasic delivery system. International Journal of Pharmaceutics, 323, 93-100.
MATTSSON, S. & NYSTRÖM, C. 2001. Evaluation of Critical Binder Properties Affecting the Compactibility of Binary Mixtures. Drug Development and Industrial Pharmacy, 27, 181-194.
MEDICINAL, C. F. M. P. F. H. 2005. CHMP reflection paper: formulation of choice for the paediatric population, EMEA/CHMP/PEG/194810/2005. London: European
Medicines Agency. MIHRANYAN, A., FRENNING, G., FRANSEN, N., WELCH, K. & STROMME, M. 2008.
Order and disorder in powder mixtures: spatial distribution functions as tools to assess powder homogeneity. Part. Part. Syst. Charact., 25, 397-405.
MUNDAY, D. L. 1994. A comparison of the dissolution characteristics of theophylline from film coated granules and mini-tablets. Drug Dev. Ind. Pharm., 20, 2369-79.
MUZZIO, F. J., GOODRIDGE, C. L., ALEXANDER, A., ARRATIA, P., YANG, H., SUDAH, O. & MERGEN, G. 2003. Sampling and characterization of pharmaceutical powders and granular blends. International Journal of Pharmaceutics, 250, 51-64.
MUZZIO, F. J., ROBINSON, P., WIGHTMAN, C. & BRONE, D. 1997. Sampling practices in powder blending. International Journal of Pharmaceutics, 155, 153-178.
NANOMI MONOSPHERE FOR DRUG DELIVERY, A. A. H. W. N. C. M.-M.-F.-D.-D. H., LAST VISITED 16.05.2011.
NILSSON, P., WESTERBERG, M. & NYSTRÖM, C. 1988. Physicochemical aspects of drug release. V. The importance of surface coverage and compaction on drug dissolution from ordered mixtures. International Journal of Pharmaceutics, 45, 111-121.
NYSTROM, C. & MALMQVIST, K. 1980. Studies on Direct Compression of Tablets .1. The Effect of Particle-Size in Mixing Finely Divided Powders with Granules. Acta Pharmaceutica Suecica, 17, 282-287.
NYSTROM, C. & WESTERBERG, M. 1986. The Use of Ordered Mixtures for Improving the Dissolution Rate of Low Solubility Compounds. Journal of Pharmacy and Pharmacology, 38, 161-165.
NYSTRÖM, C., MAZUR, J. & SJÖGREN, J. 1982. Studies on direct compression of tablets II. The influence of the particle size of a dry binder on the mechanical strength of tablets. International Journal of Pharmaceutics, 10, 209-218.
OLSSON, H., MATTSSON, S. & NYSTROM, C. 1998. Evaluation of the effect of addition of polyethylene glycols of differing molecular weights on the mechanical strength of sodium chloride and sodium bicarbonate tablets. Int. J. Pharm., 171, 31-44.
PARK, J. H., HOLMAN, K. M., BISH, G. A., KRIEGER, D. G., RAMLOSE, D. S., HERMAN, C. J. & WU, S. H. 2008. An alternative to the USP disintegration test for orally disintegrating tablets. Pharm. Technol., 32, 54-58.
POUX, M., FAYOLLE, P., BERTRAND, J., BRIDOUX, D. & BOUSQUET, J. 1991. Powder mixing: some practical rules applied to agitated systems. Powder Technol., 68, 213-34.
SCHIRM, E., TOBI, H., DE VRIES, T. W., CHOONARA, I. & DE JONG-VAN DEN BERG, L. T. W. 2003. Lack of appropriate formulations of medicines for children in the community. Acta Pædiatrica, 92, 1486-1489.
SOMMIER, N., PORION, P., EVESQUE, P., LECLERC, B., TCHORELOFF, P. & COUARRAZE, G. 2001. Magnetic resonance imaging investigation of the mixing-segregation process in a pharmaceutical blender. International Journal of Pharmaceutics, 222, 243-258.

65
STOLTENBERG, I. & BREITKREUTZ, J. 2011. Orally disintegrating mini-tablets (ODMTs) - A novel solid oral dosage form for paediatric use. European Journal of Pharmaceutics and Biopharmaceutics, In Press, Corrected Proof.
STOLTENBERG, I., WINZENBURG, G. & BREITKREUTZ, J. 2010. Solid oral dosage forms for children - formulations, excipients and acceptance issues. J. Appl. Ther. Res., 7, 141-146.
SUNDELL-BREDENBERG, S. & NYSTROM, C. 2001. The possibility of achieving an interactive mixture with high dose homogeneity containing an extremely low proportion of a micronised drug. Eur J Pharm Sci, 12, 285-95.
SWAMINATHAN, V. & KILDSIG, D. O. 2002. Polydisperse powder mixtures: effect of particle size and shape on mixture stability. Drug Dev. Ind. Pharm., 28, 41-48.
THOMSON, S. A., TULEU, C., WONG, I. C. K., KEADY, S., PITT, K. G. & SUTCLIFFE, A. G. 2009. Minitablets: new modality to deliver medicines to preschool-aged children. Pediatrics, 123, e235-8.
TRAVERS, D. N. & WHITE, R. C. 1971. The mixing of micronized sodium bicarbonate with sucrose crystals. J Pharm Pharmacol, 23, 260S-261S.
VENABLES, H. J. & WELLS, J. I. 2001. Powder mixing. Drug Dev. Ind. Pharm., 27, 599-612.
WEYENBERG, W., VERMEIRE, A., VANDERVOORT, J., REMON, J. P. & LUDWIG, A. 2005. Effects of roller compaction settings on the preparation of bioadhesive granules and ocular minitablets. European Journal of Pharmaceutics and Biopharmaceutics, 59, 527-536.
WILLY A. BACHOFEN AG MASCHINENFABRIK, A. A. H. W. W. C. E. M. T. H., LAST VISITED 16.05.2011 Turbula
YIP, C. W. & HERSEY, J. A. 1977a. Perfect powder mixtures. Powder Technol., 16, 189-92. YIP, C. W. & HERSEY, J. A. 1977b. Segregation in ordered powder mixtures. Powder
Technol., 16, 149-150.

66
8. Appendix 8.1 Steady state permeametry Example shows one of three external surface area measurements for 200SD sample.
KONSTANT FLÖDESPERMEAMETRI Sample : Pearlitol 200 SD DATE: 02.11.10 Example 1 Flowmeter 0-50
Cylinder diameter (mm): 11,47 Weight (g): 5,47 Voidage: 0,6751282 height (mm): 111,01 Density (g/ml): 1,4679
hällt
Flödesmätare: % flöde: Flow (ml/min): Flow (m/s): P (Pa): P/L (Pa/m): >50ml/min 9,9 4,95 0,0007984 24,9 224,30412 >50ml/min 19,9 9,95 0,0016049 50,9 458,51725 >50ml/min 39,9 19,95 0,003218 101,6 915,23286 >50ml/min 60 30 0,004839 152,9 1377,3534 >50ml/min 80,0 40 0,006452 205 1846,6805 >50ml/min 100,0 50 0,008065 257,0 2315,1067
SLOPE: Intercept: Korr.koeff: External surface area: 1-20ml/min: 3,5E-06 1,42408E-05 0,9999761 874,598745

67
8.2 Blaine permeametry Example shows the three measurements for sodium salicylate Determination of specific surface area by
air permeametry (Blaine) Date Material Primary data: U-tube- manometer: Density of liquid (g/cm3) 1 Diameter of arm (cm) 0,697 Start point (cm) 7 Stop point (cm) 1,5 Permeability- cell: Diameter (cm) 1,27 I II III III III Sample: Material density (g/cm3) 1,5682 1,5682 1,5682 Particle density (g/cm3) 1,5682 1,5682 1,5682 Weigth (g) 1,3154 1,2881 1,2429 Height (cm) 1,47 1,47 1,47 1,47 1,47 Time for measurement (s) 237,7 205,7 162,1 Constant for slip flow equation!! 0,96 0,96 0,96 0,96 0,96
Results: StaTotal porosity: Means: dev (-) 0,5495 0,5589 0,5744 #DIV/0! #DIV/0! 0,5609 0,0 (%) 54,95 55,89 57,44 #DIV/0! #DIV/0! 56,0932 1,2 Kozeny-Carman surface area:
Volume (cm-1) 24858,35 24219,90 23214,37 #DIV/0! #DIV/0! 24 097,54 828Weight (cm2/g) 15852,02 15444,89 14803,67 #DIV/0! #DIV/0! 15 366,86 528
Slip flow surface area:
(SM) 12591,50 11509,15 9927,37 #DIV/0! #DIV/0! 11342,6717 13Volume (cm-1) 31938,96 30648,73 28702,79 #DIV/0! #DIV/0! 30430,1590 162Weigth (cm2/g) 20367,28 19544,51 18303,60 #DIV/0! #DIV/0! 19405,1328 103
Mean pore diameter
Kozeny-Carman (µm) 1,96 2,09 2,33 #DIV/0! #DIV/0! 2,1269 0,Slip flow (µm) 1,53 1,65 1,88 #DIV/0! #DIV/0! 1,6873 0,1
Formatted Table

68
8.3 Temperatures and humidity’s during compressions
Table 17. Shows the average values of 6 compressions:
Batch RH Temp
% C
minitablet 200SD 22.6 22.71
minitablet 300DC 18.7 22.8
minitablet 400DC 17.8 22.4
minitablet 500DC 16.8 22.8

69
8.4 Example relative standard deviation powder mixture Table 18. Shows the example of powder mixture 200SD
Sample weight of sample (mg)
Absorbance (au)
constant a
constant b
teoretical weight drug (μg)
drug concentr. in flask (μ/ml)
measured drug in sample (μg)
normalised (μg)
13 18,3 0,37198 0,0224 0,0025 183 16,71786 167,1786 0,9135441 18 18,68 0,38367 0,0224 0,0025 186,8 17,23973 172,3973 0,9228979 27 19,01 0,3873 0,0224 0,0025 190,1 17,40179 174,0179 0,9154017 9 19,16 0,40324 0,0224 0,0025 191,6 18,11339 181,1339 0,9453754 5 19,18 0,40098 0,0224 0,0025 191,8 18,0125 180,125 0,9391293 6 19,2 0,39886 0,0224 0,0025 192 17,91786 179,1786 0,9332217 2 19,22 0,39608 0,0224 0,0025 192,2 17,79375 177,9375 0,9257934 26 19,29 0,39092 0,0224 0,0025 192,9 17,56339 175,6339 0,9104921 20 19,34 0,38808 0,0224 0,0025 193,4 17,43661 174,3661 0,9015826 19 19,43 0,40614 0,0224 0,0025 194,3 18,24286 182,4286 0,9389016 25 19,45 0,40185 0,0224 0,0025 194,5 18,05134 180,5134 0,9280894 23 19,45 0,40558 0,0224 0,0025 194,5 18,21786 182,1786 0,9366508 11 19,47 0,40031 0,0224 0,0025 194,7 17,98259 179,8259 0,923605 1 19,48 0,40362 0,0224 0,0025 194,8 18,13036 181,3036 0,9307165 7 19,6 0,40349 0,0224 0,0025 196 18,12455 181,2455 0,9247221 30 19,61 0,40674 0,0224 0,0025 196,1 18,26964 182,6964 0,9316493 3 19,69 0,41676 0,0224 0,0025 196,9 18,71696 187,1696 0,9505822 12 19,7 0,41153 0,0224 0,0025 197 18,48348 184,8348 0,9382478 29 19,77 0,41676 0,0224 0,0025 197,7 18,71696 187,1696 0,9467357 16 19,91 0,41474 0,0224 0,0025 199,1 18,62679 186,2679 0,9355493 10 19,96 0,42126 0,0224 0,0025 199,6 18,91786 189,1786 0,9477884 14 20 0,40909 0,0224 0,0025 200 18,37455 183,7455 0,9187277 24 20,03 0,42296 0,0224 0,0025 200,3 18,99375 189,9375 0,9482651 28 20,16 0,40849 0,0224 0,0025 201,6 18,34777 183,4777 0,9101075 4 20,26 0,42086 0,0224 0,0025 202,6 18,9 189 0,9328727 15 20,26 0,41445 0,0224 0,0025 202,6 18,61384 186,1384 0,9187482 8 20,35 0,42888 0,0224 0,0025 203,5 19,25804 192,5804 0,9463408 17 20,5 0,42158 0,0224 0,0025 205 18,93214 189,3214 0,9235192 21 20,53 0,42492 0,0224 0,0025 205,3 19,08125 190,8125 0,9294325 22 20,84 0,4256 0,0224 0,0025 208,4 19,11161 191,1161 0,9170637
Average 19,661 196,61 18,27637 182,7637 0,9295251 Max 20,84 208,4 19,25804 192,5804 0,9505822 Min 18,3 183 16,71786 167,1786 0,9015826 Median 19,605 196,05 18,25625 182,5625 0,9300745 Stdev 0,566101916 5,661019 0,612016 6,120157 0,0129315 Relstdev 2,879313952 2,879314 3,348672 3,348672 1,3911985