Use of On-Site GC/MS Analysis to Distinguish between Vapor ...
50
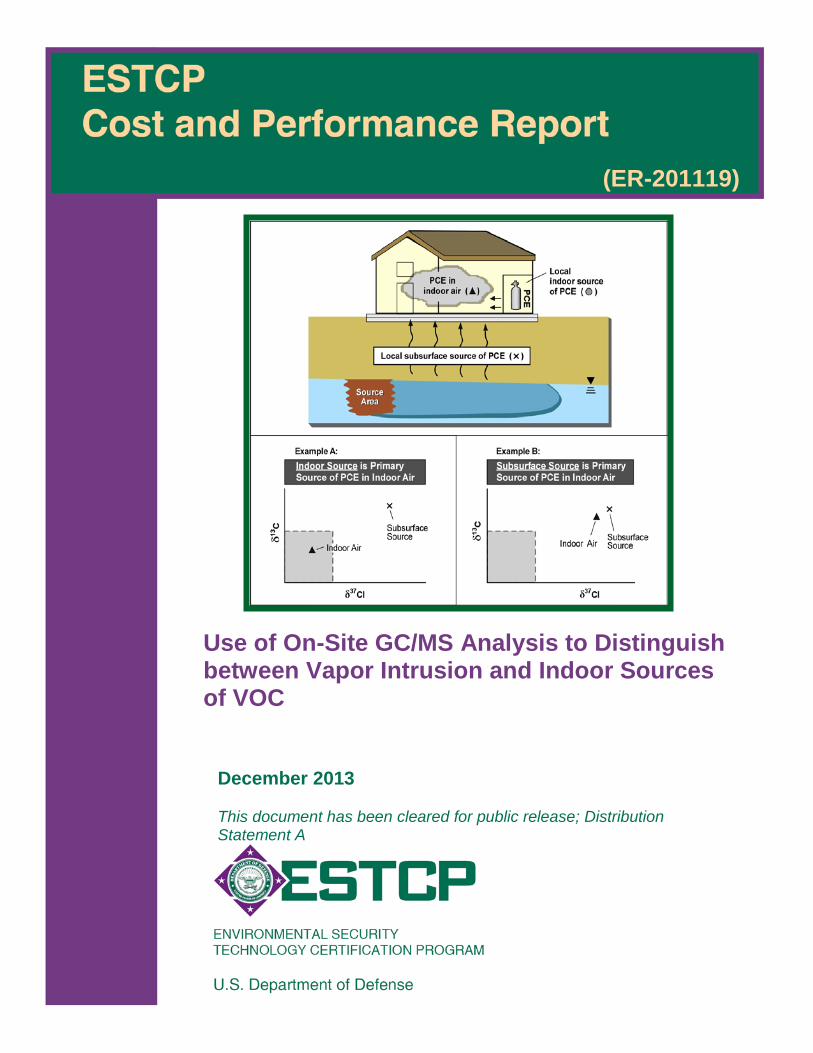
(ER-201119) Use of On-Site GC/MS Analysis to Distinguish between Vapor Intrusion and Indoor Sources of VOC December 2013 This document has been cleared for public release; Distribution Statement A
Transcript of Use of On-Site GC/MS Analysis to Distinguish between Vapor ...
(ER-201119)
Use of On-Site GC/MS Analysis to Distinguish between Vapor Intrusion and Indoor Sources of VOC
December 2013 This document has been cleared for public release; Distribution Statement A

i
COST & PERFORMANCE REPORT Project: ER-201119
TABLE OF CONTENTS
Page
EXECUTIVE SUMMARY ...................................................................................................... ES-1
1.0 INTRODUCTION .............................................................................................................. 1 1.1 BACKGROUND .................................................................................................... 1 1.2 OBJECTIVE OF THE DEMONSTRATION ......................................................... 2 1.3 REGULATORY DRIVERS ................................................................................... 2
2.0 TECHNOLOGY ................................................................................................................. 3 2.1 TECHNOLOGY DESCRIPTION .......................................................................... 3
2.1.1 Analytical Instrument.................................................................................. 3 2.1.2 Precision and Accuracy Requirements ....................................................... 3 2.1.3 Prior Application ......................................................................................... 4
2.2 ADVANTAGES AND LIMITATIONS OF THE TECHNOLOGY...................... 4 2.2.1 Alternate Instruments for On-Site GC/MS Analysis .................................. 4 2.2.2 Advantages and Limitations of the On-Site Analysis Method ................... 5
3.0 PERFORMANCE OBJECTIVES ...................................................................................... 7
4.0 SITE DESCRIPTION ......................................................................................................... 9 4.1 SITE LOCATION ................................................................................................... 9 4.2 SITE GEOLOGY, HYDROGEOLOGY, AND CONTAMINANT
DISTRIBUTION..................................................................................................... 9
5.0 TEST DESIGN ................................................................................................................. 11 5.1 CONCEPTUAL EXPERIMENTAL DESIGN ..................................................... 11 5.2 BASELINE CHARACTERIZATION .................................................................. 11 5.3 LABORATORY STUDY RESULTS .................................................................. 11 5.4 FIELD TESTING.................................................................................................. 12 5.5 SAMPLING AND ANALYSIS METHODS ....................................................... 12 5.6 SAMPLING RESULTS ........................................................................................ 13
5.6.1 Lines of Evidence for Conventional Approach ........................................ 15 5.6.2 Method for VI Classification using the CSIA Protocol ............................ 15 5.6.3 Lines of Evidence for the On-Site Analysis Protocol ............................... 16
5.6.3.1 Baseline Building Characterization ........................................ 16 5.6.3.2 Pressure Control Evaluation ................................................... 17 5.6.3.3 Data Interpretation using both On- and Off-site Results ........ 18
5.6.4 VI Classifications from the Three Investigation Approaches ................... 18
6.0 PERFORMANCE ASSESSMENT .................................................................................. 19 6.1 OBJECTIVE 1: COLLECTION OF DATA REPRESENTATIVE OF
SITE CONDITIONS USING ON-SITE GC/MS ................................................. 19
TABLE OF CONTENTS (continued)
Page
ii
6.2 OBJECTIVE 2: COLLECTION OF DATA REPRESENTATIVE OF SITE CONDITIONS USING OFF-SITE ANALYSIS ........................................ 20
6.3 OBJECTIVE 3: VALIDATION OF DRAFT PROTOCOL FOR USE OF ON-SITE ANALYSIS TO EVALUATE VAPOR INTRUSION ........................ 21 6.3.1 Site-by-Site Analysis of Results: Building VI Classifications ................. 21 6.3.2 Other Findings .......................................................................................... 24 6.3.3 Evaluation of Performance Objective 3 .................................................... 25
6.4 OBJECTIVE 4: IMPLEMENTABILITY AND COST EFFECTIVENESS OF THE PROTOCOL FOR ON-SITE ANALYSIS ............................................ 26 6.4.1 Demonstration Findings ............................................................................ 26 6.4.2 Evaluation of Performance Objective 4 .................................................... 26
7.0 COST ASSESSMENT ...................................................................................................... 27 7.1 COST MODEL FOR THE DEMONSTRATION ................................................ 27 7.2 COST DRIVERS .................................................................................................. 27 7.3 COST ANALYSIS................................................................................................ 28
8.0 IMPLEMENTATION ISSUES ........................................................................................ 31
9.0 REFERENCES ................................................................................................................. 33 APPENDIX A POINTS OF CONTACT......................................................................... A-1

iii
LIST OF FIGURES
Page Figure 1. Building-specific field testing schedule. ............................................................... 11 Figure 2. Interpretation of CSIA results. .............................................................................. 16

iv
LIST OF TABLES
Page Table 1. Performance objectives. .......................................................................................... 7 Table 2. Demonstration buildings. ........................................................................................ 9 Table 3. Demonstration site geology/hydrogeology and key contaminants. ...................... 10 Table 4. Typical on-site analysis program for field demonstration. ................................... 12 Table 5. Summary of demonstration program. ................................................................... 14 Table 6. Key analytical parameters. .................................................................................... 14 Table 7. Vapor intrusion classifications for each demonstration building. ........................ 18 Table 8. Summary of on-site data quality evaluation. ........................................................ 19 Table 9. Summary of laboratory data evaluation results. ................................................... 20 Table 10. Representative unit costs for on-site analysis demonstration. .............................. 27 Table 11. Costs for routine implementation of on-site analysis protocol at four
buildings. ............................................................................................................... 28 Table 12. Estimated cost of conventional vapor intrusion investigation at four
buildings. ............................................................................................................... 29

v
ACRONYMS AND ABBREVIATIONS δ Delta, an isotope ratio measure µg/L micrograms per liter µg/m3 micrograms per cubic meter 1,2-DCA 1,2-dichloroethane AFB Air Force Base AFCEC Air Force Civil Engineer Center bgs below ground surface BL baseline CCV continuing calibration verification cis-1,2-DCE cis-1,2-dichloroethylene COC chemical of concern COTS commercially-available off the shelf CSIA compound-specific stable isotope analysis cVOC chlorinated volatile organic compound DoD Department of Defense DQO data quality objective ESTCP Environmental Security Technology Certification Program ft foot, feet GC gas chromatograph GSI GSI Environmental GW groundwater HCs hydrocarbons ITRC Interstate Technology & Regulatory Council LCL lower calibration limit LCS/LCSD laboratory control sample/laboratory control sample duplicate MS mass spectrometry MS/MSD matrix spike/matrix spike duplicate NELAC National Environmental Laboratory Accreditation Conference NP negative pressure NYDOH New York Department of Health
ACRONYMS AND ABBREVIATIONS (continued)
vi
PHC petroleum hydrocarbons PP positive pressure QA quality assurance QAPP quality assurance project plan QC quality control RPD relative percent difference SIM select ion monitoring sq ft square feet TAGA Trace Atmospheric Gas Analyzer TCE trichloroethylene trans-1,2-DCE trans-1,2-dichloroethylene USEPA U.S. Environmental Protection Agency UST underground storage tank VI vapor intrusion VOA volatile organic analysis VOC volatile organic compound
Technical material contained in this report has been approved for public release. Mention of trade names or commercial products in this report is for informational purposes only;
no endorsement or recommendation is implied.
vii
ACKNOWLEDGEMENTS This project would not have been possible without the support and contribution of numerous individuals and organizations. The authors thank Samuel Brock and Mahalingam Ravichandran of the Air Force Civil Engineer Center (AFCEC) for support and oversight; Bill Myers, Jim Gillie, Tom Lynott, Mike Haley, Amanda Michels, Cheryl Neades, Andy Anders, Miguel Plaza, Brian Mosley, Sandra Piettro, Jim Kelly plus numerous other site personnel for providing access to the demonstration sites and facilitating implementation of the project at these sites; the Environmental Security Technology Certification Program (ESTCP) technical review staff for helpful comments and suggestions; and Andrea Leeson and the ESTCP program staff at HydroGeoLogic, Inc. for invaluable project support.

This page left blank intentionally.

ES-1
EXECUTIVE SUMMARY
OBJECTIVES OF THE DEMONSTRATION
Distinguishing between vapor intrusion (VI) and indoor sources of volatile organic compounds (VOC) is a significant challenge in site assessments, greatly increasing the cost and complexity of investigations. Rapid on-site analysis of indoor air samples using a portable gas chromatograph/mass spectrometer (GC/MS) allows the users to understand the distribution of VOC in real-time, supporting identification of the source while still in the field. The overall objective of the demonstration was to develop and validate a step-wise investigation procedure using commercially available off-the-shelf (COTS) on-site GC/MS analysis with real-time decision making as a tool to distinguish between VI and indoor sources of VOC.
TECHNOLOGY DESCRIPTION
Use of on-site GC/MS analysis to distinguish between VI and indoor sources of VOC requires a field-portable analytical instrument with sufficient sensitivity to measure VOC concentrations in indoor air within the concentration range of regulatory concern (i.e., low micrograms per cubic meter [µg/m3]). A high degree of precision is also required because the protocol relies on measuring concentration gradients within a building to identify sources of VOC. For the demonstration, we utilized a HAPSITE portable GC/MS instrument. Although specific procedures in the investigation protocol were developed using the HAPSITE, any on-site instrument with sufficient sensitivity and precision may be used.
DEMONSTRATION RESULTS
The field investigation program included application of the on-site GC/MS analysis protocol at four Department of Defense (DoD) sites. To evaluate the validity of the protocol, we also conducted conventional VI and compound-specific stable isotope analysis (CSIA) (Environmental Security Technology Certification Program [ESTCP] Project ER-201025) investigations at the study sites. Results from the three investigation methods were compared to evaluate the relative effectiveness of the different approaches. Seven buildings were evaluated during the demonstration program. The on-site analysis protocol performed as well as or better than the conventional investigation approach at all seven buildings. At six of the seven buildings, the results from the on-site analysis protocol were consistent with the overall evaluation of the VI condition based on the results from all three of the investigation methods combined. At one building, the on-site results were consistent with the conventional program results that suggested trichloroethylene (TCE) VI; however, for this building, the CSIA result provided strong evidence of an indoor source. The scenario that best fits the results from all three investigation methods combined is that TCE was recently used in the building, but that the indoor source was removed prior to sampling. In addition to the demonstration program, the on-site protocol has been used by the project team at a number of other sites for indoor source and vapor entry point identification. Overall, the on-site GC/MS analysis protocol has performed well under a wide variety of building conditions. The protocol includes an option to conduct on-site analysis while the building is pressurized or

ES-2
depressurized. This option can be used to get a better understanding of the VOC source as well as temporal variability and the susceptibility of a building to VI.
IMPLEMENTATION ISSUES
This project has resulted in the development and validation of an on-site GC/MS analysis protocol to distinguish VI from indoor sources of VOC. The protocol can be used as a standalone investigation method or can be used within a larger investigation program. Advantages of the protocol include:
• Real-time results: The key advantage of the on-site analysis protocol is the ability to measure indoor air VOC concentrations and determine the primary sources (i.e., indoor versus subsurface) in real time during the course of the field investigation. Because of the short analytical method run times, many samples can be collected while on site, resulting in a large volume of data available for interpretation while still in the field. This allows the investigators to more readily react to building-specific situations and make decisions (e.g., rule out VI, determine potential vapor entry points, find primary VOC sources, etc.).
• Definitive data: Although the method focuses on on-site analysis, a small number of air samples are collected for off-site laboratory analysis to confirm key findings. These confirmation sample results are supported by standard laboratory quality assurance/quality control (QA/QC) and can be used for regulatory decision-making.
• No sub-slab sample points: The protocol eliminates the need to drill through the building foundation.
• Reduced sampling requirements: Because indoor sources of VOC can be identified and removed during the investigation, the on-site analysis protocol will more frequently yield clearer results compared to the conventional investigation approach. When used in conjunction with building pressure manipulation, the need for further sampling to characterize temporal variability may also be reduced or eliminated.
Potential limitations on the use of the on-site GC/MS analysis protocol include:
• Equipment availability and reliability: The HAPSITE Smart Plus or alternate instrument for on-site analysis is less common than the equipment used for the conventional investigation approach. As a result, equipment availability, procurement, and scheduling may be more complex. Reliability, sensitivity, and other QA/QC requirements should be considered when selecting the on-site GC/MS instrument for use in the protocol.
• Staff suitably trained in interpretation of vapor data: The field team should include one more senior staff member with the knowledge, skills, ability, and authority to make field-decisions based on the on-site measurements. The team should also include at least one experienced GC/MS operator.
• Target compounds: Specific target compounds should be sufficiently volatile to be detected at concentrations similar to the applicable indoor air screening concentration.
ES-3
Less volatile compounds such as naphthalene may not be good candidates for on-site analysis because it is difficult to calibrate the on-site instrument for analysis of low concentrations of these compounds. Additionally, accurate identification may be problematic with certain VOC. This issue may be addressed by fine-tuning the analytical method or interpreting chromatograms and ion mass ratio data in the field.
• Building construction: For the building pressure control option to be effective, the building cannot be too large (>20,000 square feet [sq ft]) or too leaky (e.g., presence of built-in ventilation slats).

This page left blank intentionally.
1
1.0 INTRODUCTION
The purpose of this project was to develop and validate an investigation procedure using commercially-available off the shelf (COTS) on-site gas chromatography/mass spectrometry (GC/MS) analysis with real-time decision making as a tool to distinguish between vapor intrusion (VI) and indoor sources of volatile organic compounds (VOC). Project tasks included 1) validation of the use of the HAPSITE portable GC/MS instrument through side-by-side comparison with fixed-base laboratory analysis (GSI Environmental [GSI], 2012a); 2) development of a standardized investigation protocol (GSI, 2012b); and 3) testing the protocol at four U.S. Department of Defense (DoD) sites with potential VI concerns (GSI, 2012c).
1.1 BACKGROUND
Since 2000, regulators and the regulated community have become increasingly concerned about the potential for exposure to VOC through VI at sites with contaminated soil or groundwater. In response to these concerns, the U. S. Environmental Protection Agency (USEPA) and many state regulatory agencies have issued guidance specifying screening and field investigation procedures to identify VI impacts. Although the specific recommended investigation procedures vary significantly between guidance documents, the majority of these documents utilize a step-wise evaluation process that includes preliminary screening followed by field investigation, if needed. This step-wise process generally addresses:
• Presence of Volatile Chemicals: VI is a potential concern at sites with soil or groundwater impacted by volatile chemicals. Corrective action sites without volatile chemicals (typically defined by vapor pressure and/or Henry’s Law constant) require no further evaluation for VI.
• Pathway Screening Criteria: For sites with volatile chemicals in soil or groundwater, most regulatory guidance provides conservative screening criteria for preliminary evaluation of the VI pathway. These criteria are typically used to evaluate the likelihood of VOC migration away from a source area at concentrations that could cause a VI impact. Because of their conservative nature, few corrective action sites are usually screened out of further evaluation using these criteria.
• Building-Specific Evaluation: For sites with volatile chemicals present at concentrations above the screening criteria, most guidance documents require a field investigation to determine the presence or absence of VI impacts to near-by buildings (commonly defined as within 100 feet [ft] of VOC impacts). When conducting a site-specific field investigation, USEPA guidance recommends collection of below-foundation (i.e., sub-slab) soil gas samples followed by simultaneous below-foundation and indoor air samples, if needed. The USEPA guidance raises a number of data quality issues to be addressed as part of the field investigation including: indoor sources of VOC (background), spatial variability, temporal variability, and sample collection and analytical variability.
Although VI guidance documents typically utilize a step-wise investigation approach, most use very low screening criteria for the preliminary evaluations. As a result, indoor air testing is often required. Guidance documents often recommend determining indoor sources of VOC as part of

2
the investigation to help decipher the indoor air sample results. However, as a practical matter, pinpointing indoor sources of VOC is difficult using conventional means such as visual inspections or occupant interviews. The benefit of the on-site analysis procedure is a more robust means to identify indoor sources of VOC up front, early in the building evaluation process.
1.2 OBJECTIVE OF THE DEMONSTRATION
Distinguishing between VI and indoor sources of VOC is a significant challenge in site assessments, greatly increasing the cost and complexity of investigations. Rapid on-site analysis of indoor air samples using a GC/MS allows the users to understand the distribution of VOC in real-time, supporting a real-time identification of the source. For this project, we have developed a protocol for using on-site GC/MS analysis to distinguish between VI and indoor sources of VOC. The overall objective of the demonstration is to validate the accuracy and utility of the protocol for the evaluation of VI.
1.3 REGULATORY DRIVERS
For many corrective action sites, the current regulatory framework requires a building-specific investigation of VI if the concentrations of specific VOC in groundwater are above federal drinking water standards and buildings are present within 100 ft of impacted media (e.g., USEPA, 2002). In addition, most state and federal guidance documents utilize very low screening criteria for the preliminary evaluation. Further, some states (e.g., New York) do not allow screening based on subsurface VOC concentrations. Instead, indoor air testing is required at all field investigation sites (New York Department of Health [NYDOH], 2006). Although testing of indoor air is the most direct method to determine whether indoor screening criteria are exceeded, interpretation of results is often complicated. Indoor sources of VOC are ubiquitous, resulting in detectable concentrations in indoor air that are often above regulatory screening levels. For example, background concentrations of trichloroethylene (TCE) range from 0.3 to 1.6 micrograms per cubic meter (µg/m3) in houses unaffected by VI (50th to 95th percentile values; Dawson and McAlary, 2009). This range spans the residential 10-6 risk limit of 0.43 µg/m3 (USEPA, 2013). Background concentrations of TCE, benzene, and several other VOC also commonly exceed regulatory screening levels (USEPA, 2011a). The difficulty in distinguishing between sources of VOC in indoor air (i.e., subsurface contaminant source versus indoor source) often leads to uncertainty as to whether or not VI is occurring. This uncertainty can trigger additional investigations. The main benefit of on-site analysis is to provide identification of VOC sources while the investigation is in progress. Investigators can then use this information to make decisions such as removal of indoor sources prior to collection of samples for regulatory decision-making.
3
2.0 TECHNOLOGY
The purpose of this project was to demonstrate the on-site GC/MS analysis of air samples as an effective investigation method to distinguish between VI and indoor sources of VOC. Although the use of on-site analysis for VI investigations had been tested previously (e.g., Gorder and Dettenmaier, 2011), there are currently no widely-accepted and validated protocols for such investigations. The purpose of this technology demonstration project was to develop and validate such protocols and make the use of on-site analysis methods more standardized and accessible for potential technical and regulatory users.
2.1 TECHNOLOGY DESCRIPTION
Use of on-site analysis to distinguish between VI and indoor sources of VOC requires a field-portable analytical instrument with sufficient sensitivity to measure VOC concentrations in indoor air within the range of regulatory concern (i.e., low µg/m3).
2.1.1 Analytical Instrument
The HAPSITE GC/MS is a field-portable instrument designed for on-site analysis of air and water samples by personnel without extensive training in analytical chemistry. The HAPSITE weighs approximately 35 pounds (without the battery). When operated in the quantitative GC/MS mode, the HAPSITE can accurately measure VOC present in air samples at concentrations of less than 1 µg/m3. The HAPSITE can also be used in continuous-read survey mode to provide semi-quantitative identification of VOC present in the 100s of µg/m3 concentration range. The user interface is relatively simple; proper use of the instrument requires only a few days of training. However, as discussed in Section 6.4, proper application of the on-site analysis protocol may require additional training. Currently, the primary commercial application of the HAPSITE is in industrial hygiene and public safety. The HAPSITE is widely used by private industry to monitor worker exposure to industrial chemicals and by the military to monitor for chemical warfare agents. However, environmental applications of the HAPSITE, including VI, are increasing. In late 2008, Hill Air Force Base (AFB) purchased a HAPSITE for on-site analysis of indoor air samples in residences with potential VI concerns. The instrument immediately proved to be invaluable for the identification of previously undiscovered indoor sources of VOC that had been confounding VI investigations relying on conventional fixed-laboratory analysis (Gorder and Dettenmaier, 2011).
2.1.2 Precision and Accuracy Requirements
Application of the HAPSITE for building-specific investigations relies on the ability to identify differences in target VOC concentrations between different locations within the building. The ability to identify spatial differences in VOC concentrations is a strong function of instrument precision. With high precision, a small difference in measured VOC concentrations between two sample locations can be reliably interpreted as a true difference, as opposed to variability in sample measurements. This true difference is used to determine the location of the VOC source.

4
Instrument accuracy is less important than precision for on-site GC/MS analysis for building-specific investigations. The investigation procedure is targeted primarily on identification of the source(s) of the VOC being detected in indoor air, a process that requires high precision but not high accuracy. This is because the on-site evaluations rely primarily on comparisons of relative, rather than absolute, magnitudes (i.e., is the concentration in the basement higher than on the main floor?). Note that when the primary source of the target VOC is determined to be VI, accuracy becomes more important because of the need to determine whether the results exceed the indoor air screening level. However, as long as the margin of error is known, then the instrument results can be reliably interpreted even if the accuracy is less than that typically obtained from a fixed laboratory instrument. For example, if the accuracy is known to be +/-100% (i.e., three-fold accuracy), then a measured VOC concentration that is more than three times above or below the indoor air screening concentration can be reliably interpreted as truly above or below the screening level. For concentrations within three-fold of the screening level, a confirmation sample can be collected for off-site analysis.
2.1.3 Prior Application
The use of on-site analysis to distinguish between VI and indoor sources of VOC has significantly streamlined building-specific VI investigations at Hill AFB (Gorder and Dettenmaier, 2011), where indoor air testing has been conducted at over 2000 residences overlying or located in close proximity to affected groundwater associated with the base. Prior to acquisition of the HAPSITE, detections of VOC in indoor air at concentrations above the base’s action level required extensive follow-up investigation and sometimes resulted in unnecessary installation of mitigation systems. Currently, a similar detection is followed by a 2-4 hour follow-up investigation using the HAPSITE. In over 90% of the houses investigated using the HAPSITE, an indoor source or sources emitting the specific VOC of concern has been located and removal has resulted in concentrations of the VOC falling below the action level. In many cases, the indoor sources have been products not previously recognized to be sources of the VOC. Examples include plastic decorations emitting 1,2-dichloroethane (1,2-DCA) (Doucette et al., 2009), taxidermy foam emitting trans-1,2-dichloroethylene (trans-1,2-DCE), and pepper spray canisters emitting TCE.
2.2 ADVANTAGES AND LIMITATIONS OF THE TECHNOLOGY
2.2.1 Alternate Instruments for On-Site GC/MS Analysis
This demonstration project used the HAPSITE portable GC/MS instrument manufactured by Inficon (http://www.inficon.com). The HAPSITE GC/MS is the only field-portable instrument (i.e., instrument specifically intended to be transported from site to site) with sufficient sensitivity to measure VOC concentrations in air as low as 1 µg/m3. However, on-site analysis of air samples by GC/MS could also be conducted using a mobile laboratory consisting of standard laboratory GC/MS instruments installed in a van or recreational vehicle. Mobile laboratory analyses of air samples are offered by a number of commercial laboratories. In addition, the USEPA can provide similar services with the Trace Atmospheric Gas Analyzer (TAGA) unit, although the equipment in this unit is more sophisticated and sensitive than standard commercial laboratory equipment. A mobile laboratory is somewhat less portable than the HAPSITE (i.e., cannot be shipped by air), and requires a more highly trained operator. On the other hand, some

5
mobile laboratories are National Environmental Laboratory Accreditation Conference (NELAC) certified, increasing the regulatory acceptance of the results. NELAC or similar certification of results is typically required when the analytical results are used for health risk assessment or comparison to regulatory standards. For this investigation procedure, the on-site results from the HAPSITE are used to determine the source(s) of VOC in indoor air. A small number of samples are collected for off-site laboratory analysis and are used for definitive decision-making (i.e., to determine whether chemical of concern [COC] concentrations in indoor air exceed applicable screening values). The use of results from off-site laboratories for definitive decision-making reduces the need for NELAC certification of on-site results or similar extensive documentation of on-site data quality. For the demonstration, we used three different HAPSITE models: the SMART (oldest version), SMART PLUS (intermediate version), and ER (current model manufactured by Inficon). We found that the SMART PLUS was more suitable for the on-site analysis protocol than the other models, due to its stability and reliability.
2.2.2 Advantages and Limitations of the On-Site Analysis Method
This on-site analysis method is in contrast to conventional VI investigation methods (e.g., those described in Interstate Technology & Regulatory Council [ITRC], 2007, and USEPA, 2002), which focus on off-site analysis for determining VOC concentrations with a limited number of subsurface and indoor air samples. Using this conventional approach, analytical results are typically not available for several weeks after the investigation has been completed. Because of the high potential for confounding results due to prevalence of indoor VOC sources, the results from the off-site lab, when received, are often difficult to interpret. Advantages of the on-site analysis method include:
• Real-time results: The key advantage of the on-site analysis method is the ability to measure indoor air VOC concentrations and determine the primary sources (i.e., indoor versus subsurface) in real time during the course of the field investigation. Because of the short analytical method run times, many samples can be collected and analyzed on site, resulting in a large volume of data available for interpretation while still in the field. This allows the investigators to more readily react to building-specific situations and make decisions (e.g., rule out VI, determine potential vapor entry points, find primary VOC sources, etc.).
• Definitive data: Although the method focuses on on-site analysis, a small number of air samples are collected for off-site laboratory analysis to confirm key findings.
• No sub-slab sample points: The on-site analysis method does not require the installation of sub-slab sample points. This eliminates the need to drill though the building foundation.
• Reduced sampling requirements: Because indoor sources of VOC can be identified and removed during the investigation program, the on-site analysis method will more frequently yield clearer results compared to the conventional investigation approach, reducing the need for follow-up sampling events. When the optional building
6
depressurization method is used, the need for characterization of temporal variability may also be reduced or eliminated.
Potential limitations of the method include:
• Equipment availability: The HAPSITE GC/MS (SMART PLUS) or alternate instrument for on-site analysis is less common than the equipment used for the conventional investigation approach. As a result, equipment availability, procurement, and scheduling may be more complex.
• Staff suitably trained in interpretation of vapor data: The field team should include one more senior staff member with the knowledge, skills, ability, and authority to make decisions in the field based on the on-site measurements. The team should also include at least one experienced HAPSITE operator.
• Target compounds: Specific target compounds should be sufficiently volatile to be detected at concentrations similar to the applicable indoor air screening concentration. Less volatile compounds such as naphthalene may not be good candidates for on-site analysis because it is difficult to calibrate the on-site instrument for analysis of low concentrations of these compounds. Additionally, accurate identification may be problematic with certain VOC (e.g., vinyl chloride, cis-1,2-dichloroethylene [cis-1,2-DCE]). This issue may be addressed by fine-tuning the analytical method or interpreting chromatograms and ion mass ratio data in the field.
• Temporal variability: Changes in building pressure relative to the subsurface can cause temporal variations in VI. As a result, a one-day investigation program with uncontrolled building pressure conditions may not identify VI that could occur under other building pressure conditions. The on-site analysis method itself does not account for potentially episodic VI. The protocol (GSI, 2013), however, includes an optional building pressure control step that minimizes concerns about temporal variability. Building depressurization, for example, will enhance the potential for VI. Induced negative pressure will tend to draw subsurface vapors, if present, up into the building. As a result, an absence of VI under both baseline and induced negative pressure conditions serves to reduce the concern regarding temporally-variable VI.
• Building construction: For building pressure control to be effective, the building cannot be too large (>20,000 square feet [sq ft]) or too leaky (e.g., constructed with built-in ventilation slats).

7
3.0 PERFORMANCE OBJECTIVES
The overall objective of the demonstration was to validate the draft protocol for the application of on-site GC/MS analysis to distinguish between VI and indoor sources of VOC. The demonstration was done in the field at “full-scale”, that is, in typical buildings subject to VI investigations. Specific quantitative and qualitative performance objectives are summarized in Table 1.
Table 1. Performance objectives.
Performance Objective/ Data Requirements Success Criteria and Results
Quantitative Performance Objectives 1) Collection of data representative of site
conditions using the on-site GC/MS. Data needs: • Results from on-site analysis of vapor-
phase samples. • Associated QA results to demonstrate
acceptable instrument performance.
For >75% of on-site analyses: • Precision: relative percent difference (RPD) < 30% for
duplicate samples • Accuracy: RPD < 75% between continuing calibration
verification (CCV) standard and on-site result; RPD < 75% for paired samples analyzed on-site and off-site
• Sensitivity: < 1 µg/m3 for chlorinated VOC and < 5 µg/m3 for petroleum hydrocarbons
Result: Data met precision, accuracy, and sensitivity goals. 2) For confirmation samples analyzed by off-
site laboratories, collection of data representative of site conditions. Data needs: • Results from off-site analysis of vapor-
phase samples. • Associated QA results to demonstrate
acceptable laboratory performance.
For >90% of off-site analyses: • Precision: RPD < 30% for field duplicate samples; RPD
<25% for laboratory duplicate results • Accuracy: standard laboratory accuracy • Sensitivity: < 1 µg/m3 for all VOC
Result: Data met precision, accuracy, and sensitivity goals.
Qualitative Performance Objectives 3) Validation of the draft protocol for the use of
on-site analysis to evaluate VI. Data needs: • Determination of VI conditions using 1)
results from application of the protocol; 2) conventional sampling approach; and 3) stable isotope analysis (per ER-201025).
Success will be achieved if: 1) All three investigation methods yield definitive,
consistent determinations regarding the presence or absence of VI, or
2) If one or more of the methods yield ambiguous results, attainment of a clearer determination using the on-site analysis method, as compared to the alternate methods.
Result: At all seven of the demonstration buildings, the on-site analysis protocol performed as well as or better than the conventional investigation approach. At six of the seven buildings, the results from the on-site analysis protocol were consistent with the overall evaluation of the VI condition based on the results from all three of the investigation methods combined.
4) Implementability of the draft protocol for the use of on-site analysis to evaluate VI. Data needs: • Field experience implementing the
protocol and interpreting the results
Determination that the protocol is implementable and cost effective.
Result: Overall, the protocol is usable (by adequately trained personnel) and cost effective. Minor revisions to the protocol were made based on findings of the demonstration (see GSI, 2013).

This page left blank intentionally.
9
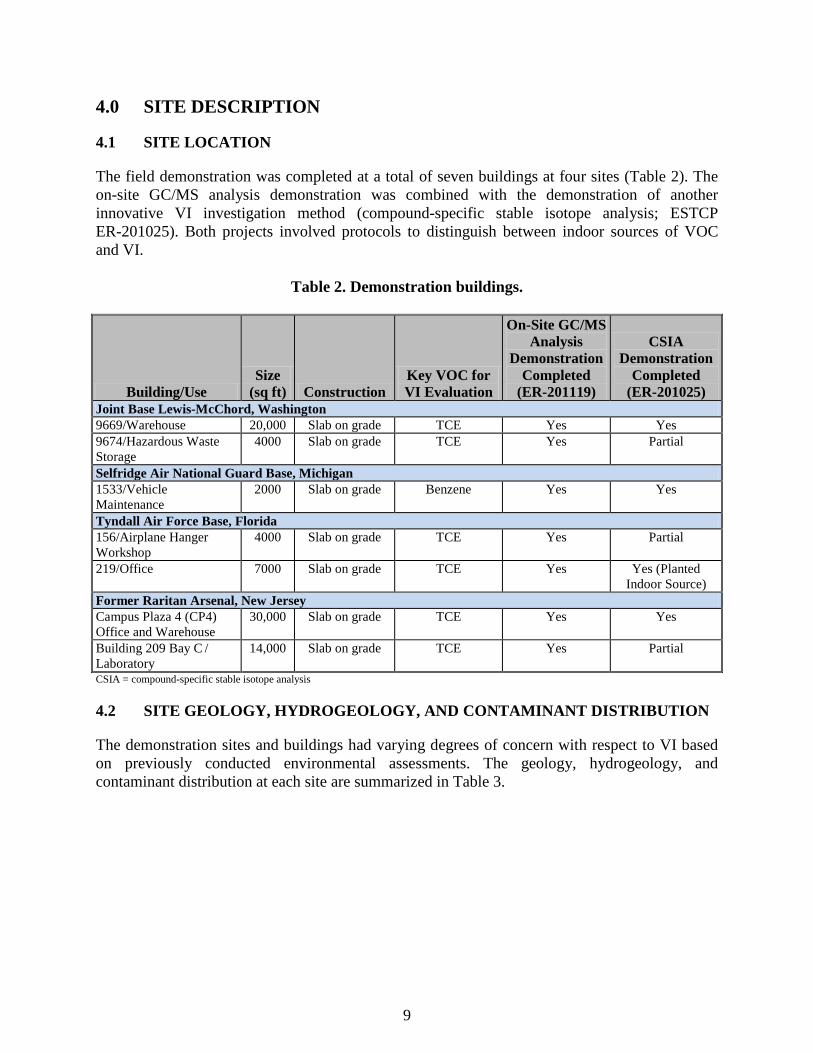
4.0 SITE DESCRIPTION
4.1 SITE LOCATION
The field demonstration was completed at a total of seven buildings at four sites (Table 2). The on-site GC/MS analysis demonstration was combined with the demonstration of another innovative VI investigation method (compound-specific stable isotope analysis; ESTCP ER-201025). Both projects involved protocols to distinguish between indoor sources of VOC and VI.
Table 2. Demonstration buildings.
Building/Use Size
(sq ft) Construction Key VOC for VI Evaluation
On-Site GC/MS Analysis
Demonstration Completed
(ER-201119)
CSIA Demonstration
Completed (ER-201025)
Joint Base Lewis-McChord, Washington 9669/Warehouse 20,000 Slab on grade TCE Yes Yes 9674/Hazardous Waste Storage
4000 Slab on grade TCE Yes Partial
Selfridge Air National Guard Base, Michigan 1533/Vehicle Maintenance
2000 Slab on grade Benzene Yes Yes
Tyndall Air Force Base, Florida 156/Airplane Hanger Workshop
4000 Slab on grade TCE Yes Partial
219/Office 7000 Slab on grade TCE Yes Yes (Planted Indoor Source)
Former Raritan Arsenal, New Jersey Campus Plaza 4 (CP4) Office and Warehouse
30,000 Slab on grade TCE Yes Yes
Building 209 Bay C / Laboratory
14,000 Slab on grade TCE Yes Partial
CSIA = compound-specific stable isotope analysis
4.2 SITE GEOLOGY, HYDROGEOLOGY, AND CONTAMINANT DISTRIBUTION
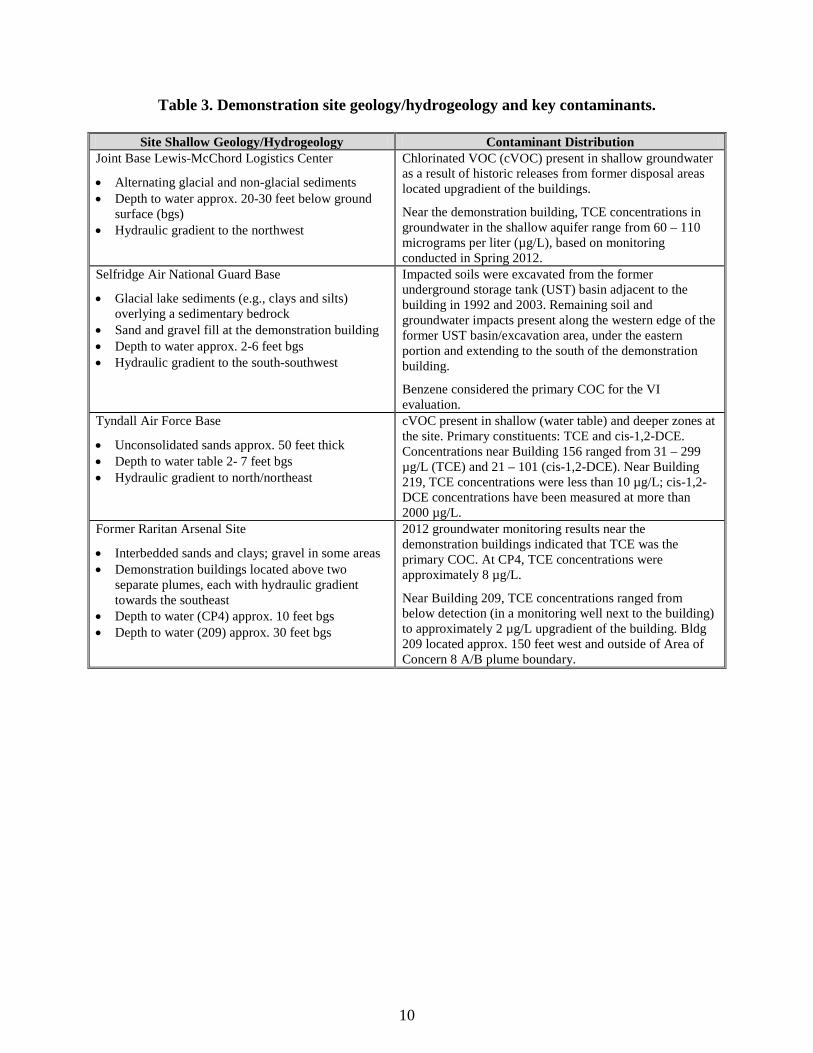
The demonstration sites and buildings had varying degrees of concern with respect to VI based on previously conducted environmental assessments. The geology, hydrogeology, and contaminant distribution at each site are summarized in Table 3.
10
Table 3. Demonstration site geology/hydrogeology and key contaminants.
Site Shallow Geology/Hydrogeology Contaminant Distribution Joint Base Lewis-McChord Logistics Center
• Alternating glacial and non-glacial sediments • Depth to water approx. 20-30 feet below ground
surface (bgs) • Hydraulic gradient to the northwest
Chlorinated VOC (cVOC) present in shallow groundwater as a result of historic releases from former disposal areas located upgradient of the buildings.
Near the demonstration building, TCE concentrations in groundwater in the shallow aquifer range from 60 – 110 micrograms per liter (µg/L), based on monitoring conducted in Spring 2012.
Selfridge Air National Guard Base
• Glacial lake sediments (e.g., clays and silts) overlying a sedimentary bedrock
• Sand and gravel fill at the demonstration building • Depth to water approx. 2-6 feet bgs • Hydraulic gradient to the south-southwest
Impacted soils were excavated from the former underground storage tank (UST) basin adjacent to the building in 1992 and 2003. Remaining soil and groundwater impacts present along the western edge of the former UST basin/excavation area, under the eastern portion and extending to the south of the demonstration building.
Benzene considered the primary COC for the VI evaluation.
Tyndall Air Force Base
• Unconsolidated sands approx. 50 feet thick • Depth to water table 2- 7 feet bgs • Hydraulic gradient to north/northeast
cVOC present in shallow (water table) and deeper zones at the site. Primary constituents: TCE and cis-1,2-DCE. Concentrations near Building 156 ranged from 31 – 299 µg/L (TCE) and 21 – 101 (cis-1,2-DCE). Near Building 219, TCE concentrations were less than 10 µg/L; cis-1,2-DCE concentrations have been measured at more than 2000 µg/L.
Former Raritan Arsenal Site
• Interbedded sands and clays; gravel in some areas • Demonstration buildings located above two
separate plumes, each with hydraulic gradient towards the southeast
• Depth to water (CP4) approx. 10 feet bgs • Depth to water (209) approx. 30 feet bgs
2012 groundwater monitoring results near the demonstration buildings indicated that TCE was the primary COC. At CP4, TCE concentrations were approximately 8 µg/L.
Near Building 209, TCE concentrations ranged from below detection (in a monitoring well next to the building) to approximately 2 µg/L upgradient of the building. Bldg 209 located approx. 150 feet west and outside of Area of Concern 8 A/B plume boundary.
11
5.0 TEST DESIGN
5.1 CONCEPTUAL EXPERIMENTAL DESIGN
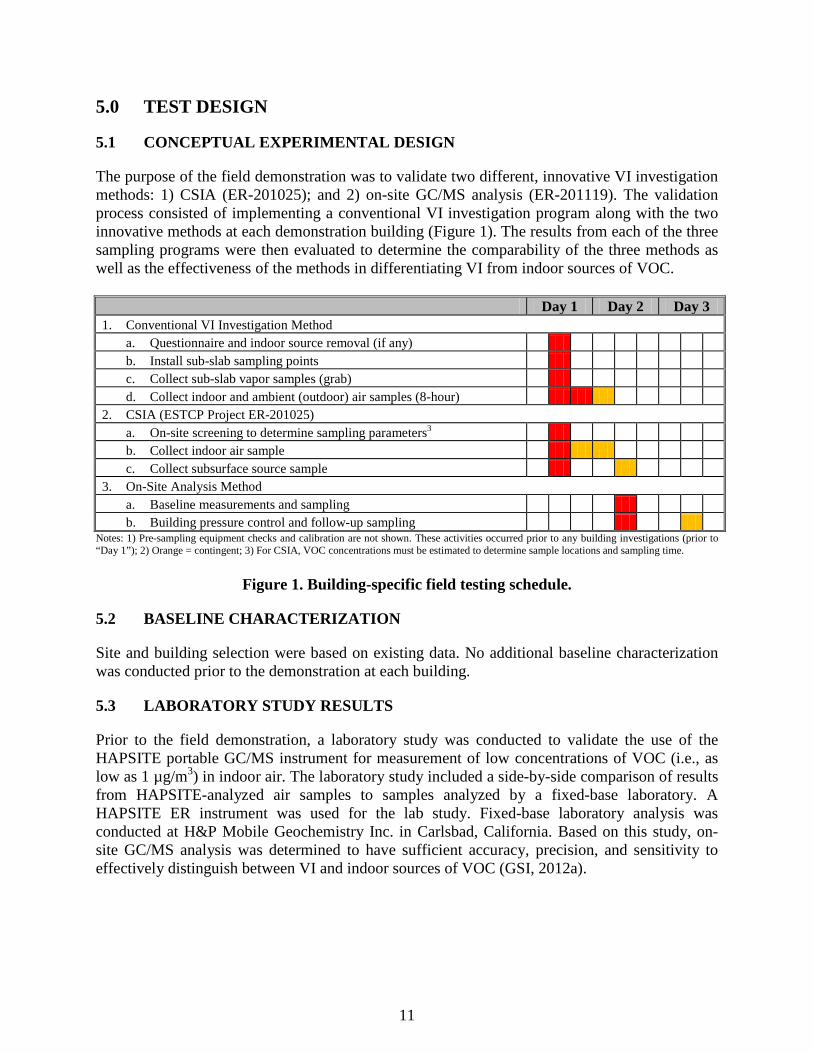
The purpose of the field demonstration was to validate two different, innovative VI investigation methods: 1) CSIA (ER-201025); and 2) on-site GC/MS analysis (ER-201119). The validation process consisted of implementing a conventional VI investigation program along with the two innovative methods at each demonstration building (Figure 1). The results from each of the three sampling programs were then evaluated to determine the comparability of the three methods as well as the effectiveness of the methods in differentiating VI from indoor sources of VOC.
Day 1 Day 2 Day 3 1. Conventional VI Investigation Method
a. Questionnaire and indoor source removal (if any) b. Install sub-slab sampling points c. Collect sub-slab vapor samples (grab) d. Collect indoor and ambient (outdoor) air samples (8-hour)
2. CSIA (ESTCP Project ER-201025) a. On-site screening to determine sampling parameters3 b. Collect indoor air sample c. Collect subsurface source sample
3. On-Site Analysis Method a. Baseline measurements and sampling b. Building pressure control and follow-up sampling
Notes: 1) Pre-sampling equipment checks and calibration are not shown. These activities occurred prior to any building investigations (prior to “Day 1”); 2) Orange = contingent; 3) For CSIA, VOC concentrations must be estimated to determine sample locations and sampling time.
Figure 1. Building-specific field testing schedule.
5.2 BASELINE CHARACTERIZATION
Site and building selection were based on existing data. No additional baseline characterization was conducted prior to the demonstration at each building.
5.3 LABORATORY STUDY RESULTS
Prior to the field demonstration, a laboratory study was conducted to validate the use of the HAPSITE portable GC/MS instrument for measurement of low concentrations of VOC (i.e., as low as 1 µg/m3) in indoor air. The laboratory study included a side-by-side comparison of results from HAPSITE-analyzed air samples to samples analyzed by a fixed-base laboratory. A HAPSITE ER instrument was used for the lab study. Fixed-base laboratory analysis was conducted at H&P Mobile Geochemistry Inc. in Carlsbad, California. Based on this study, on-site GC/MS analysis was determined to have sufficient accuracy, precision, and sensitivity to effectively distinguish between VI and indoor sources of VOC (GSI, 2012a).
12
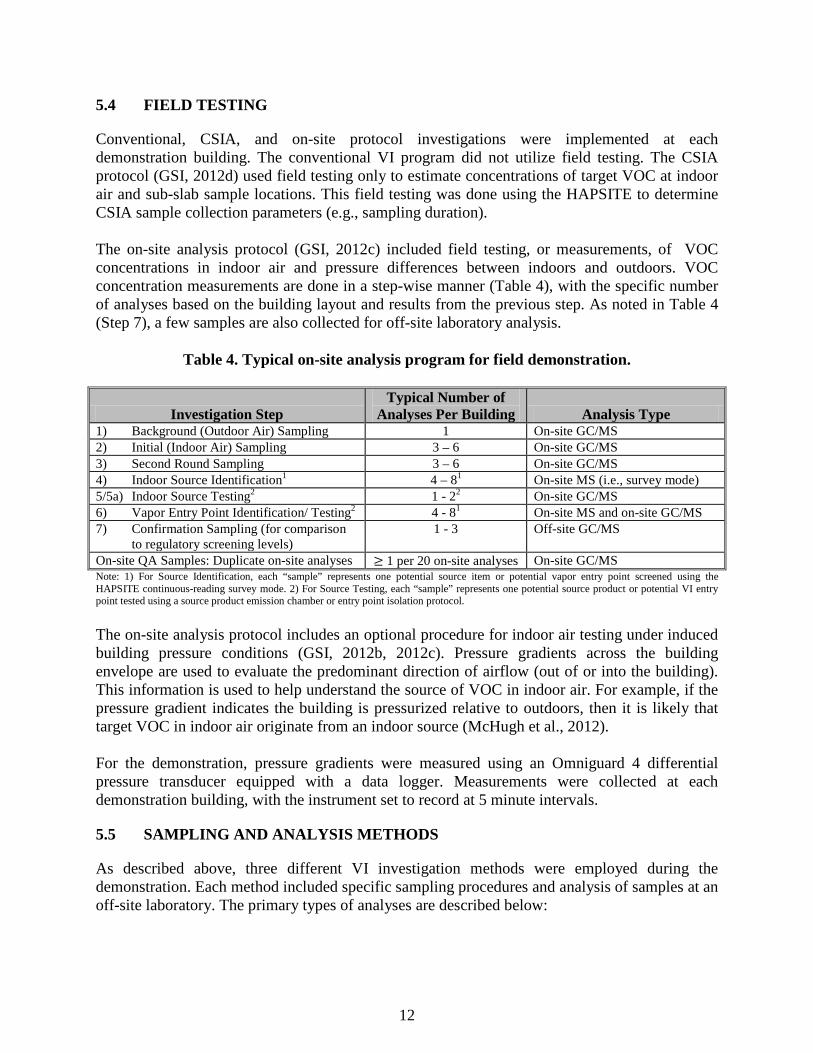
5.4 FIELD TESTING
Conventional, CSIA, and on-site protocol investigations were implemented at each demonstration building. The conventional VI program did not utilize field testing. The CSIA protocol (GSI, 2012d) used field testing only to estimate concentrations of target VOC at indoor air and sub-slab sample locations. This field testing was done using the HAPSITE to determine CSIA sample collection parameters (e.g., sampling duration). The on-site analysis protocol (GSI, 2012c) included field testing, or measurements, of VOC concentrations in indoor air and pressure differences between indoors and outdoors. VOC concentration measurements are done in a step-wise manner (Table 4), with the specific number of analyses based on the building layout and results from the previous step. As noted in Table 4 (Step 7), a few samples are also collected for off-site laboratory analysis.
Table 4. Typical on-site analysis program for field demonstration.
Investigation Step Typical Number of
Analyses Per Building Analysis Type 1) Background (Outdoor Air) Sampling 1 On-site GC/MS 2) Initial (Indoor Air) Sampling 3 – 6 On-site GC/MS 3) Second Round Sampling 3 – 6 On-site GC/MS 4) Indoor Source Identification1 4 – 81 On-site MS (i.e., survey mode) 5/5a) Indoor Source Testing2 1 - 22 On-site GC/MS 6) Vapor Entry Point Identification/ Testing2 4 - 81 On-site MS and on-site GC/MS 7) Confirmation Sampling (for comparison
to regulatory screening levels) 1 - 3 Off-site GC/MS
On-site QA Samples: Duplicate on-site analyses ≥ 1 per 20 on-site analyses On-site GC/MS Note: 1) For Source Identification, each “sample” represents one potential source item or potential vapor entry point screened using the HAPSITE continuous-reading survey mode. 2) For Source Testing, each “sample” represents one potential source product or potential VI entry point tested using a source product emission chamber or entry point isolation protocol. The on-site analysis protocol includes an optional procedure for indoor air testing under induced building pressure conditions (GSI, 2012b, 2012c). Pressure gradients across the building envelope are used to evaluate the predominant direction of airflow (out of or into the building). This information is used to help understand the source of VOC in indoor air. For example, if the pressure gradient indicates the building is pressurized relative to outdoors, then it is likely that target VOC in indoor air originate from an indoor source (McHugh et al., 2012). For the demonstration, pressure gradients were measured using an Omniguard 4 differential pressure transducer equipped with a data logger. Measurements were collected at each demonstration building, with the instrument set to record at 5 minute intervals.
5.5 SAMPLING AND ANALYSIS METHODS
As described above, three different VI investigation methods were employed during the demonstration. Each method included specific sampling procedures and analysis of samples at an off-site laboratory. The primary types of analyses are described below:

13
Conventional VI Samples: The conventional sampling program consisted of indoor air, ambient (outdoor) air, and sub-slab soil gas sample collection for VOC analysis. At each test building, indoor and outdoor air samples were collected using 8-hour flow controllers. Sub-slab soil gas samples were collected after sampling point integrity was checked using helium leak tracer tests and shut-in tests. Sub-slab samples were collected as grab samples (i.e., without flow controllers). All samples were collected in individually certified, 6-L Summa canisters. Samples were analyzed for VOC by USEPA Method TO-15 or TO-15 SIM by ALS Laboratory in Simi Valley, California. CSIA Samples: Three types of locations were selected for sampling: 1) groundwater (to evaluate the subsurface source); 2) sub-slab (to evaluate the soil gas beneath the building); and 3) indoor air (GSI, 2012d). Groundwater samples were collected in 60 milliliter (mL) volatile organic analysis (VOA) vials using standard groundwater sample collection methods. Sub-slab and indoor air samples were collected using active sorbent tube methods. Specific sample locations were chosen based on initial vapor/air screening results from on-site GC/MS analysis. Sub-slab samples were collected from sub-slab probe points installed for the conventional VI program. All analyses were conducted at the University of Oklahoma contract laboratory. Samples to Support the On-Site Analysis Protocol: The majority of samples collected for this protocol are indoor air samples analyzed onsite. However, at the end of each phase of the protocol (i.e., baseline building characterization, characterization of depressurized building conditions, etc.), a sample is collected for off-site laboratory analysis. These samples are used to 1) confirm the accuracy of the on-site analysis results; and 2) provide fully validated documentation of VOC concentrations in indoor air at the conclusion of the on-site testing program. Samples for off-site laboratory analysis were collected in individually certified, 6-L Summa canisters and were analyzed by USEPA Method TO-15 or TO-15 select ion monitoring (SIM). These samples were collected as grab samples and were paired with a final sample analyzed using the HAPSITE. Laboratory analysis was conducted at ALS Laboratory in Simi Valley, California.
5.6 SAMPLING RESULTS
Tables 5 and 6 summarize the demonstration program and key analytes considered for each demonstration building.
14
Table 5. Summary of demonstration program.
Site/Building
Conv. VI Program CSIA On-Site Analysis
Sub-
slab
Sa
mpl
e L
ocat
ions
Indo
or A
ir
Sam
ple
Loc
atio
ns
Out
door
Air
Sa
mpl
e L
ocat
ions
Sour
ce (G
W)
Sam
ple
Loc
atio
ns
Sub-
slab
Sa
mpl
e L
ocat
ions
In
door
Air
Sa
mpl
e L
ocat
ions
O
n-Si
te
GC
/MS
Indo
or A
ir
Sam
ples
O
n-Si
te
Surv
eys
Pres
sure
C
ondi
tions
T
este
d
Joint Base Lewis-McChord, Washington Building 9669 3 2 1 3 1 1 35 3 BL, NP, PP Building 9674 3 1 1 0 0 0 7 0 BL, NP Selfridge Air National Guard Base, Michigan Building 1533 3 1 1 1 2 1 28 6 BL, NP, PP Tyndall Air Force Base, Florida Building 156 3 3 0 1 1 0 14 0 BL, NP Building 219 3 2 1 1 1 1 9 0 BL Former Raritan Arsenal Site, New Jersey Campus Plaza 4 2 2 1 2 1 2 56 0 BL, NP Building 209 2 2 1 2 1 0 10 0 BL Note: GW = groundwater; BL = baseline (normal) operating conditions; NP = induced negative pressure; PP = induced positive pressure
Table 6. Key analytical parameters.
Site/Building
Conv. VI and On-Site Analysis Program CSIA TO-15
(Key Analyte1) On-Site Analysis (Key Analyte1) Compound Isotope 1 Isotope 2
Joint Base Lewis-McChord, Washington Building 9669 cVOC (TCE) cVOC (TCE) TCE δ13C δ37Cl Building 9674 cVOC (TCE) cVOC (TCE) - - - Selfridge Air National Guard Base, Michigan Building 1533 PHC (Benzene) PHC (Benzene) Benzene δ13C - Tyndall Air Force Base, Florida Building 156 cVOC (TCE) cVOC (TCE) TCE δ13C δ37Cl Building 219 cVOC (TCE) cVOC (TCE) TCE δ13C δ37Cl Former Raritan Arsenal Site, New Jersey Campus Plaza 4 cVOC (TCE) cVOC (TCE) TCE δ13C δ37Cl Building 209 cVOC (TCE) cVOC (TCE) TCE δ13C δ37Cl Note: Key Analyte = key analyte for VI evaluation; HCs = hydrocarbons; PHC = petroleum HCs; δ = Delta, an isotope ratio measure The overall objective of the demonstration was to evaluate the effectiveness of the on-site analysis protocol relative to two alternate investigation approaches: conventional sampling and the CSIA protocol. In order to compare the effectiveness of each approach, the results for each of the three investigation approaches were initially evaluated independently. Each of the three investigation methods is intended to determine the source of target VOC detected in indoor air (i.e., VI versus indoor source). Note that for regulatory projects, a response action is required only if the concentration of the target VOC in indoor air exceeds the applicable regulatory standard. For the assessment of regulatory implications, we applied USEPA screening values to all the demonstration sites. These values may not be the legal standards for regulatory

15
responses at the individual demonstration sites; they were used for this demonstration in order to provide consistency between the sites. For the demonstration buildings, the key COC for the VI evaluation was either TCE or benzene. The TCE and benzene screening levels were taken as 3.0 µg/m3 and 1.6 µg/m3, respectively. These values were based on the commercial/industrial USEPA regional screening levels, assuming 10-6 target risk and hazard quotient of 1.0 (USEPA, 2013). Evaluation of both the conventional and on-site analysis protocol results utilized a multiple lines-of-evidence approach. For each of these two methods, the concordance among the lines of evidence was used to determine the overall VI classification and degree of confidence in the classification. The regulatory implication was based on comparison of the results to the screening level. It is important to recognize that, when VOC concentrations are very low, it is more likely that the source identification will not be definitive. However, if VOC concentrations are below the regulatory standard, then no response action is required regardless of the source (although further monitoring may be required in some cases to evaluate temporal variability).
5.6.1 Lines of Evidence for Conventional Approach
The results from the conventional sampling program were evaluated using a lines-of-evidence approach, which included the following questions:
1. Comparison of key VOC concentrations in indoor air to ambient (outdoor) air: Do indoor concentrations of the key VOC exceed outdoor concentrations? To be conservative, a “Yes” response was considered consistent with VI.
2. Sub-slab to indoor air attenuation factors: Are concentrations of the key VOC below the building significantly (e.g., >10x) higher than in indoor air?
3. Sub-slab to indoor air ratios: Are other VOC found beneath the slab, and are sub-slab to indoor air concentration ratios similar?
4. Composition of VOC (e.g., concentration ratios) present in indoor air compared to composition of VOC present in groundwater: Are ratios in indoor air consistent with a subsurface source?
Based on the lines of evidence evaluation (Questions 1 – 4), each building was classified with respect to VI. Demonstration building classifications are provided in Section 5.6.4.
5.6.2 Method for VI Classification using the CSIA Protocol
For CSIA, building classifications and the level of confidence in the VI interpretation are based on pattern matching between the indoor air and groundwater results (Figure 2). Demonstration building classifications using this method are provided in Section 5.6.4.
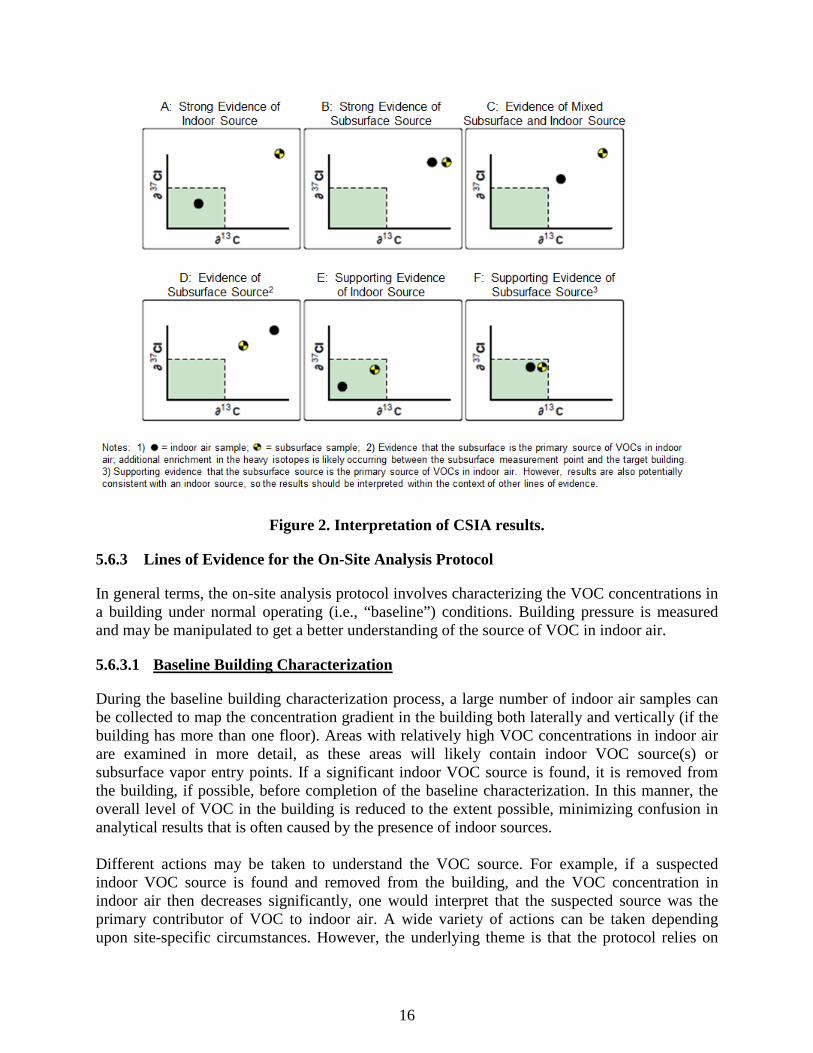
16
Figure 2. Interpretation of CSIA results.
5.6.3 Lines of Evidence for the On-Site Analysis Protocol
In general terms, the on-site analysis protocol involves characterizing the VOC concentrations in a building under normal operating (i.e., “baseline”) conditions. Building pressure is measured and may be manipulated to get a better understanding of the source of VOC in indoor air.
5.6.3.1 Baseline Building Characterization
During the baseline building characterization process, a large number of indoor air samples can be collected to map the concentration gradient in the building both laterally and vertically (if the building has more than one floor). Areas with relatively high VOC concentrations in indoor air are examined in more detail, as these areas will likely contain indoor VOC source(s) or subsurface vapor entry points. If a significant indoor VOC source is found, it is removed from the building, if possible, before completion of the baseline characterization. In this manner, the overall level of VOC in the building is reduced to the extent possible, minimizing confusion in analytical results that is often caused by the presence of indoor sources. Different actions may be taken to understand the VOC source. For example, if a suspected indoor VOC source is found and removed from the building, and the VOC concentration in indoor air then decreases significantly, one would interpret that the suspected source was the primary contributor of VOC to indoor air. A wide variety of actions can be taken depending upon site-specific circumstances. However, the underlying theme is that the protocol relies on
17
iterative testing and data interpretation to find the source of VOC and determine the susceptibility of the building to VI. All data collected up to this point are field measurements and analysis. At the end of the baseline characterization (and after concentrations have stabilized after indoor source removal), the investigators make a preliminary interpretation of the source of VOC using the following guidelines:
1. Comparison of target VOC concentrations in indoor air to ambient (outdoor) air: Do indoor concentrations of the key VOC exceed outdoor concentrations? A “Yes” response is conservatively considered to be consistent with VI. This line of evidence is not definitive with respect to VI, however, because of potential contributions from indoor sources.
2. No indoor sources: Were known indoor sources of target VOC removed prior to the end of the baseline period such that no (known) indoor sources remain in the building? If “Yes,” then the source of target VOC may be consistent with VI. If “No,” known indoor sources remain, and these indoor sources may be the primary source(s) of VOC in indoor air. This question does not apply if the on-site results for the target VOC are below detection limits.
3. Baseline building pressure: Is baseline building pressure negative (i.e., building depressurized relative to outdoors)? A “No” provides evidence of an indoor source because a positive building pressure does not support the flow of soil gas into the building. A “Yes” response is conservatively considered to be consistent with VI. However, this line of evidence alone is not definitive with respect to VI; negative building pressure does not eliminate the possibility of an indoor source.
4. Vapor entry point: Were vapor entry points found? If “Yes,” then VI could contribute to target VOC in indoor air.
5.6.3.2 Pressure Control Evaluation
The protocol includes an optional step in which building pressure is manipulated. Changes in building pressure relative to the subsurface can cause temporal variations in VI. As a result, a 1-day investigation program with uncontrolled building conditions may not identify VI that could occur under other building pressure conditions. To better understand building conditions, the differential pressure between indoors and outdoors is measured during the baseline evaluation. Building pressure can be manipulated to control the advective flow of soil gas into the building. If advection (rather than diffusion) is the primary mode of VI for a building, then building pressure control can provide an improved understanding of the potential for VI (McHugh et al., 2012; USEPA, 2011b). Building pressure control can also be used to support the findings from the baseline evaluation. Lines of evidence for the optional pressure control evaluation focus on change in target VOC concentrations relative to baseline, and relative to the building pressure condition.
18
1. Building pressurization: Are target VOC concentrations suppressed by building pressurization? A “Yes” response is consistent with VI.
2. Building depressurization: Are target VOC concentrations enhanced by depressurization? A “Yes” response is consistent with VI.
5.6.3.3 Data Interpretation using both On- and Off-site Results
Building VI classifications may be determined while still in the field by using the on-site results. However, the protocol includes collection of an indoor air sample for off-site laboratory analysis at the end of each pressure period (i.e., baseline, pressurization, and depressurization). Because these samples are supported by laboratory QA/ QC consistent with analytical method (TO-15) requirements, they are suitable for “definitive” decision-making and comparisons regulatory screening levels. These samples also serve to confirm the on-site results.
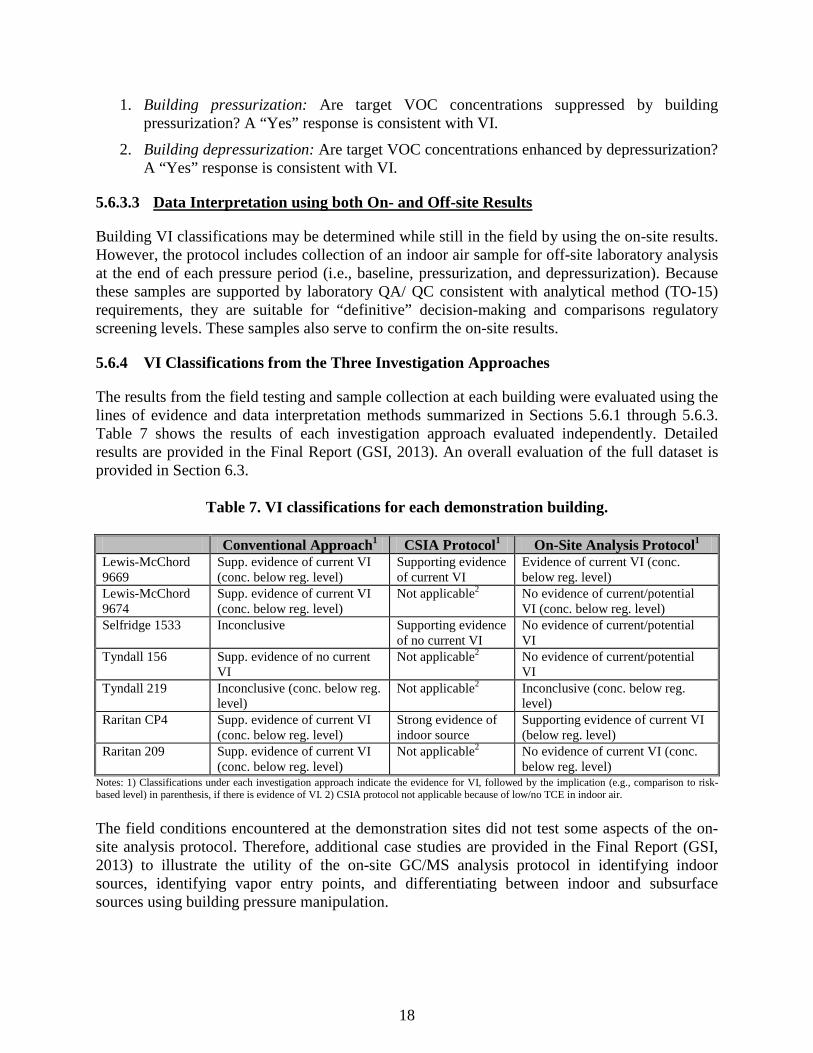
5.6.4 VI Classifications from the Three Investigation Approaches
The results from the field testing and sample collection at each building were evaluated using the lines of evidence and data interpretation methods summarized in Sections 5.6.1 through 5.6.3. Table 7 shows the results of each investigation approach evaluated independently. Detailed results are provided in the Final Report (GSI, 2013). An overall evaluation of the full dataset is provided in Section 6.3.
Table 7. VI classifications for each demonstration building.
Conventional Approach1 CSIA Protocol1 On-Site Analysis Protocol1 Lewis-McChord 9669
Supp. evidence of current VI (conc. below reg. level)
Supporting evidence of current VI
Evidence of current VI (conc. below reg. level)
Lewis-McChord 9674
Supp. evidence of current VI (conc. below reg. level)
Not applicable2 No evidence of current/potential VI (conc. below reg. level)
Selfridge 1533 Inconclusive Supporting evidence of no current VI
No evidence of current/potential VI
Tyndall 156 Supp. evidence of no current VI
Not applicable2 No evidence of current/potential VI
Tyndall 219 Inconclusive (conc. below reg. level)
Not applicable2 Inconclusive (conc. below reg. level)
Raritan CP4 Supp. evidence of current VI (conc. below reg. level)
Strong evidence of indoor source
Supporting evidence of current VI (below reg. level)
Raritan 209 Supp. evidence of current VI (conc. below reg. level)
Not applicable2 No evidence of current VI (conc. below reg. level)
Notes: 1) Classifications under each investigation approach indicate the evidence for VI, followed by the implication (e.g., comparison to risk-based level) in parenthesis, if there is evidence of VI. 2) CSIA protocol not applicable because of low/no TCE in indoor air. The field conditions encountered at the demonstration sites did not test some aspects of the on-site analysis protocol. Therefore, additional case studies are provided in the Final Report (GSI, 2013) to illustrate the utility of the on-site GC/MS analysis protocol in identifying indoor sources, identifying vapor entry points, and differentiating between indoor and subsurface sources using building pressure manipulation.
19
6.0 PERFORMANCE ASSESSMENT
This section provides an overview of data analysis completed to assess the performance objectives described in Section 3. Details are provided in the Final Report (GSI, 2013).
6.1 OBJECTIVE 1: COLLECTION OF DATA REPRESENTATIVE OF SITE CONDITIONS USING ON-SITE GC/MS
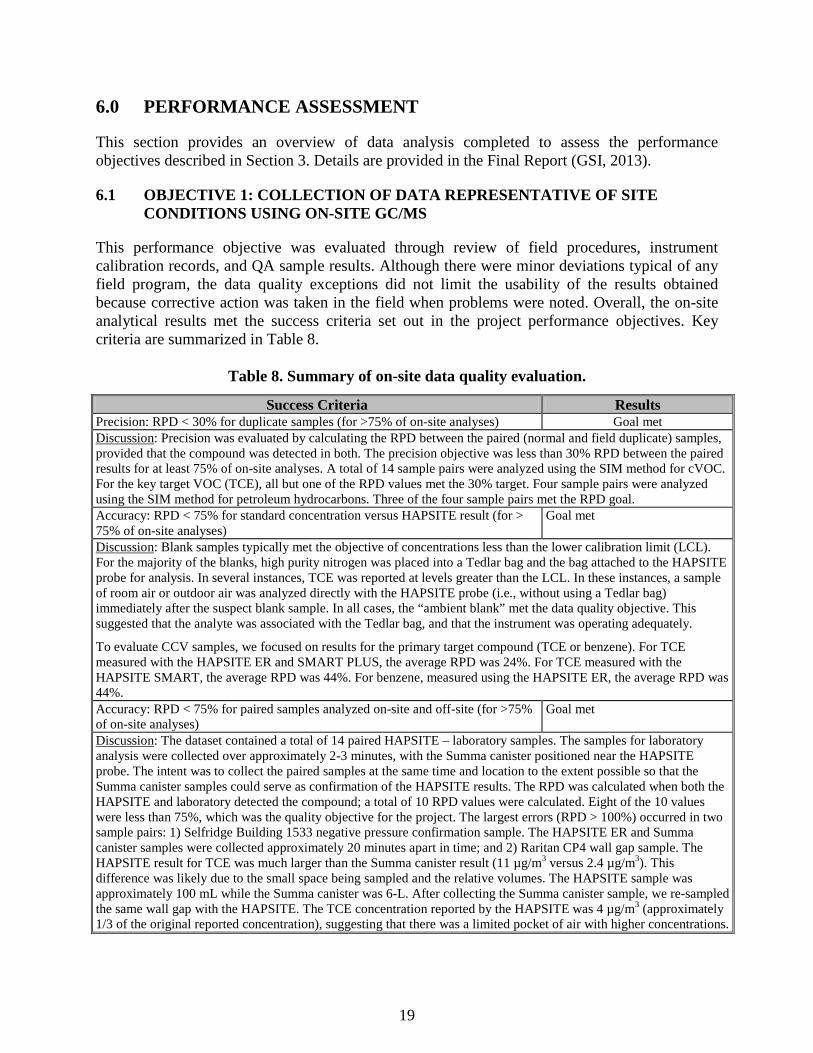
This performance objective was evaluated through review of field procedures, instrument calibration records, and QA sample results. Although there were minor deviations typical of any field program, the data quality exceptions did not limit the usability of the results obtained because corrective action was taken in the field when problems were noted. Overall, the on-site analytical results met the success criteria set out in the project performance objectives. Key criteria are summarized in Table 8.
Table 8. Summary of on-site data quality evaluation.
Success Criteria Results Precision: RPD < 30% for duplicate samples (for >75% of on-site analyses) Goal met Discussion: Precision was evaluated by calculating the RPD between the paired (normal and field duplicate) samples, provided that the compound was detected in both. The precision objective was less than 30% RPD between the paired results for at least 75% of on-site analyses. A total of 14 sample pairs were analyzed using the SIM method for cVOC. For the key target VOC (TCE), all but one of the RPD values met the 30% target. Four sample pairs were analyzed using the SIM method for petroleum hydrocarbons. Three of the four sample pairs met the RPD goal. Accuracy: RPD < 75% for standard concentration versus HAPSITE result (for > 75% of on-site analyses)
Goal met
Discussion: Blank samples typically met the objective of concentrations less than the lower calibration limit (LCL). For the majority of the blanks, high purity nitrogen was placed into a Tedlar bag and the bag attached to the HAPSITE probe for analysis. In several instances, TCE was reported at levels greater than the LCL. In these instances, a sample of room air or outdoor air was analyzed directly with the HAPSITE probe (i.e., without using a Tedlar bag) immediately after the suspect blank sample. In all cases, the “ambient blank” met the data quality objective. This suggested that the analyte was associated with the Tedlar bag, and that the instrument was operating adequately.
To evaluate CCV samples, we focused on results for the primary target compound (TCE or benzene). For TCE measured with the HAPSITE ER and SMART PLUS, the average RPD was 24%. For TCE measured with the HAPSITE SMART, the average RPD was 44%. For benzene, measured using the HAPSITE ER, the average RPD was 44%. Accuracy: RPD < 75% for paired samples analyzed on-site and off-site (for >75% of on-site analyses)
Goal met
Discussion: The dataset contained a total of 14 paired HAPSITE – laboratory samples. The samples for laboratory analysis were collected over approximately 2-3 minutes, with the Summa canister positioned near the HAPSITE probe. The intent was to collect the paired samples at the same time and location to the extent possible so that the Summa canister samples could serve as confirmation of the HAPSITE results. The RPD was calculated when both the HAPSITE and laboratory detected the compound; a total of 10 RPD values were calculated. Eight of the 10 values were less than 75%, which was the quality objective for the project. The largest errors (RPD > 100%) occurred in two sample pairs: 1) Selfridge Building 1533 negative pressure confirmation sample. The HAPSITE ER and Summa canister samples were collected approximately 20 minutes apart in time; and 2) Raritan CP4 wall gap sample. The HAPSITE result for TCE was much larger than the Summa canister result (11 µg/m3 versus 2.4 µg/m3). This difference was likely due to the small space being sampled and the relative volumes. The HAPSITE sample was approximately 100 mL while the Summa canister was 6-L. After collecting the Summa canister sample, we re-sampled the same wall gap with the HAPSITE. The TCE concentration reported by the HAPSITE was 4 µg/m3 (approximately 1/3 of the original reported concentration), suggesting that there was a limited pocket of air with higher concentrations.
20
Table 8. Summary of on-site data quality evaluation (continued).
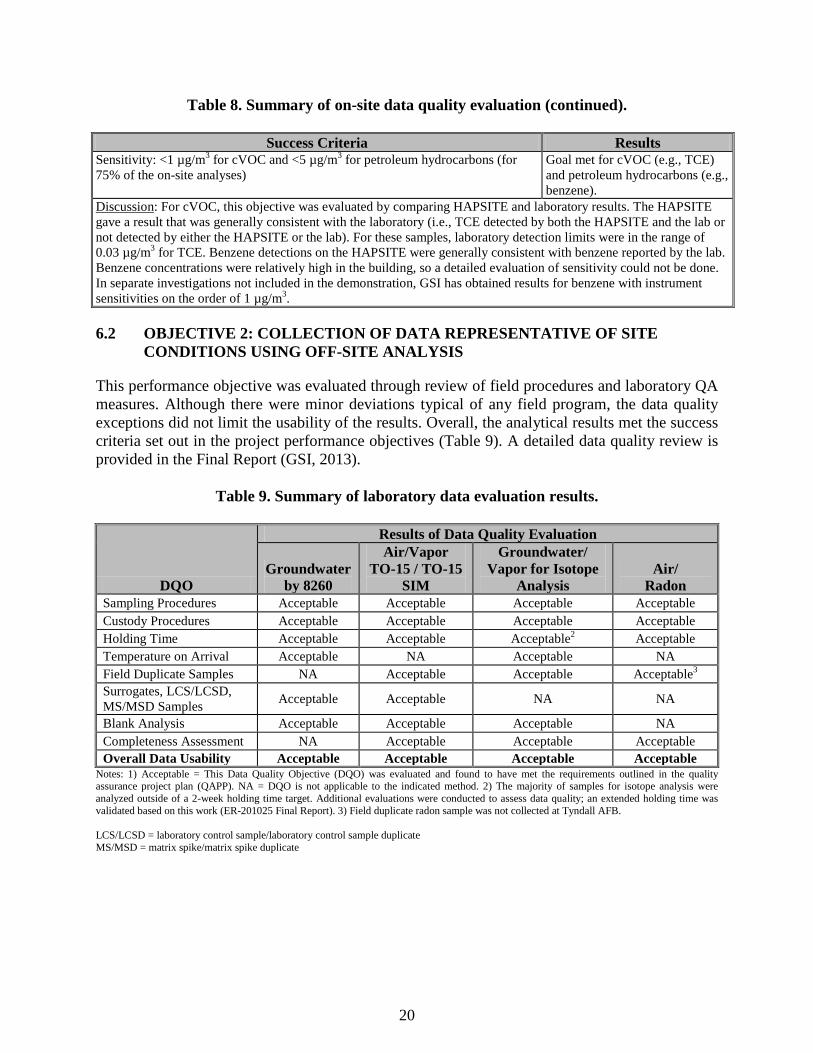
Success Criteria Results Sensitivity: <1 µg/m3 for cVOC and <5 µg/m3 for petroleum hydrocarbons (for 75% of the on-site analyses)
Goal met for cVOC (e.g., TCE) and petroleum hydrocarbons (e.g., benzene).
Discussion: For cVOC, this objective was evaluated by comparing HAPSITE and laboratory results. The HAPSITE gave a result that was generally consistent with the laboratory (i.e., TCE detected by both the HAPSITE and the lab or not detected by either the HAPSITE or the lab). For these samples, laboratory detection limits were in the range of 0.03 µg/m3 for TCE. Benzene detections on the HAPSITE were generally consistent with benzene reported by the lab. Benzene concentrations were relatively high in the building, so a detailed evaluation of sensitivity could not be done. In separate investigations not included in the demonstration, GSI has obtained results for benzene with instrument sensitivities on the order of 1 µg/m3.
6.2 OBJECTIVE 2: COLLECTION OF DATA REPRESENTATIVE OF SITE CONDITIONS USING OFF-SITE ANALYSIS
This performance objective was evaluated through review of field procedures and laboratory QA measures. Although there were minor deviations typical of any field program, the data quality exceptions did not limit the usability of the results. Overall, the analytical results met the success criteria set out in the project performance objectives (Table 9). A detailed data quality review is provided in the Final Report (GSI, 2013).
Table 9. Summary of laboratory data evaluation results.
DQO
Results of Data Quality Evaluation
Groundwater by 8260
Air/Vapor TO-15 / TO-15
SIM
Groundwater/ Vapor for Isotope
Analysis Air/
Radon Sampling Procedures Acceptable Acceptable Acceptable Acceptable Custody Procedures Acceptable Acceptable Acceptable Acceptable Holding Time Acceptable Acceptable Acceptable2 Acceptable Temperature on Arrival Acceptable NA Acceptable NA Field Duplicate Samples NA Acceptable Acceptable Acceptable3 Surrogates, LCS/LCSD, MS/MSD Samples Acceptable Acceptable NA NA
Blank Analysis Acceptable Acceptable Acceptable NA Completeness Assessment NA Acceptable Acceptable Acceptable Overall Data Usability Acceptable Acceptable Acceptable Acceptable
Notes: 1) Acceptable = This Data Quality Objective (DQO) was evaluated and found to have met the requirements outlined in the quality assurance project plan (QAPP). NA = DQO is not applicable to the indicated method. 2) The majority of samples for isotope analysis were analyzed outside of a 2-week holding time target. Additional evaluations were conducted to assess data quality; an extended holding time was validated based on this work (ER-201025 Final Report). 3) Field duplicate radon sample was not collected at Tyndall AFB. LCS/LCSD = laboratory control sample/laboratory control sample duplicate MS/MSD = matrix spike/matrix spike duplicate
21
6.3 OBJECTIVE 3: VALIDATION OF DRAFT PROTOCOL FOR USE OF ON-SITE ANALYSIS TO EVALUATE VAPOR INTRUSION
The effectiveness of the on-site analysis protocol was evaluated by applying the protocol at seven buildings and comparing the results to those obtained using two alternative evaluation methods: 1) conventional sampling; and 2) the CSIA protocol.
6.3.1 Site-by-Site Analysis of Results: Building VI Classifications
The hypothesis for this field demonstration was that the on-site analysis method will more commonly yield definitive results compared to the conventional sampling program. In order to test this hypothesis, the results from the on-site and conventional investigation methods were compared for each building. When the classification was the same, the methods were determined to have performed equally. When one method resulted in a more definitive classification than another (e.g., supporting evidence versus results not definitive), that method was determined to have performed better. If the methods yielded contradictory classifications (e.g., supporting evidence of no VI versus supporting evidence of VI), then the results from the isotope analysis and any other available information was used to determine which method performed better. The investigation method-specific building VI classifications are summarized in Section 5.6.4 (Table 7). Comparisons between investigation methods are provided below: Lewis-McChord 9669: The TCE concentration in indoor air (1.2 to 1.5 µg/m3) was up to 50% of the USEPA screening value (3.0 µg/m3) making the source (i.e., VI versus indoor source) an important consideration. The conventional results were generally indicative of current VI. However, TCE was the only subsurface COC consistently detected in indoor air limiting the ability to evaluate the constituent ratio line of evidence. Building 9669 is a supply distribution warehouse that contains a large variety (over 100) of VOC-containing products. As a result, using the conventional results alone, it would be difficult to conclude with a high degree of confidence that no indoor sources of TCE were present. The on-site analysis protocol (both the baseline sampling and the pressure control) yielded results inconsistent with an indoor source of TCE. These results provided a higher degree of confidence that the TCE detected in indoor air originated in the subsurface. The results of the on-site analysis protocol 1) increased confidence in the result that VI was occurring, but at levels below screening levels; and 2) decreased concern with temporal variability because of the variety of building conditions tested. Overall Finding: Results were generally consistent between the three investigation methods. Results from the on-site protocol were more definitive. The on-site analysis/pressure control approach increased confidence in the result and decreased concern with temporal variability. Lewis-McChord 9674: The TCE concentration in indoor air (0.072 µg/m3) was well below the USEPA screening value (3.0 µg/m3). As a result, definitively identifying the source (i.e., VI versus indoor source) would be relatively unimportant for determining how to proceed. The conventional results yielded supporting evidence of current VI. However, there is not high confidence in this interpretation because concentration ratios were not clearly consistent with the groundwater source. Additionally, Building 9674 is a hazardous waste storage building. Using the conventional results alone, it would be difficult to conclude that the low (0.072 µg/m3, approximately 2x the detection limit) TCE concentration was due to any particular source (e.g.,

22
subsurface, indoor, or residual from indoor source which had been removed prior to sampling). The difference between the “supporting evidence” finding for the conventional program and the “no evidence” finding for the on-site analysis program is primarily attributable to lower detection limits for the off-site analysis. The results from the on-site analysis protocol (both the baseline sampling and pressure control) increase the confidence that there is no VI concern because the building was tested under multiple building pressure conditions, but resulted in the same “no evidence” finding for each pressure condition. Additionally, no vapor entry points were found and no TCE concentration gradients were observed in the building under baseline and depressurized conditions. Overall Finding: There was low confidence in the conventional approach because of low concentrations. Results from the on-site protocol were more definitive and increased confidence that there is no potential VI concern. Selfridge 1533: The conventional results were generally indicative of no VI because the maximum benzene concentration in the sub-slab was less than 10x the concentration in indoor air and there were obvious non-removable sources in the building (i.e., automobiles being repaired). However, the benzene concentration in indoor air (14 µg/m3) was almost 10x greater than the risk-based screening value. Also, the maximum benzene concentration in the sub-slab (58 µg/m3) was greater than the concentration in indoor air. As a result, a regulator may have required additional evaluation of whether VI was contributing to the benzene detected in indoor air. The results from the on-site protocol provided greater confidence that indoor sources were the predominate sources of benzene in indoor air because 1) the on-site analysis documented the temporally variable impact of the indoor sources on benzene concentration in indoor air; and 2) the building pressure control results were consistent with an indoor source of benzene. Because of the overall magnitude dominated by indoor sources, no additional evaluation would be warranted under current building use. Overall Finding: Results were generally consistent between CSIA and the on-site methods. Results from the on-site protocol were most definitive, indicating the primary VOC source was indoors. Tyndall 156: The conventional results provided strong evidence of no current VI because TCE was not detected in indoor air (with a detection limit well below the USEPA screening value of 3.0 µg/m3). The results from the on-site analysis protocol also provided strong evidence of no current VI because TCE was not detected in indoor air. The on-site analysis protocol also indicated that temporally-variable VI is not a concern because no TCE was detected in indoor air under depressurized conditions. Overall Finding: Results were generally consistent between the two applicable methods. Results from the on-site protocol were more definitive. Tyndall 219: The TCE concentration in indoor air (0.086-0.087 µg/m3) was well below the USEPA screening value (3.0 µg/m3). As a result, definitively identifying the source (i.e., VI versus indoor source) would be relatively unimportant for determining how to proceed. The conventional results were inconclusive with regard to VI. Although sub-slab TCE results were
23
higher than indoor air and indoor air TCE was higher than outdoors, concentration ratios were not consistent with VI. The on-site analysis results were also inconclusive in that a specific VOC source (i.e., subsurface versus indoor source) was not found in the accessible portions of the building. Additionally, no hot spots were found, indicating a lack of strong source(s) within the building. Building depressurization was not conducted due to access constraints. However, differential pressure measurements collected during the on-site program show that the building was generally depressurized (i.e., condition conducive to VI). This condition, combined with the lack of strong source and TCE concentrations well below screening levels, suggests that there are no VI concerns in the building. Overall Finding: The on-site protocol results were comparable to the conventional program results. Raritan CP4: The TCE concentration in indoor air (1.3 to 2.1 µg/m3) was up to 67% of the USEPA screening value (3.0 µg/m3), making the source (i.e., VI versus indoor source) an important consideration. The conventional results provided supporting evidence of VI because the maximum TCE concentration in the sub-slab was more than 10x the TCE concentration in indoor air. The on-site analysis protocol results also provided supporting evidence of VI because 1) TCE was detected in indoor air; 2) no indoor sources of TCE were found; 3) two floor cracks were identified as vapor entry points; and 4) the TCE concentrations measured in the wall gap of one room was higher than the highest TCE concentration measured in indoor air. Elevated COC concentrations in wall gaps are consistent with VI because wall gaps can be connected to vapor entry points and have lower air exchange rates than building interior spaces. The on-site analysis protocol results, however, were not considered definitive for two reasons. First, the two floor crack entry points in the warehouse section of the building appeared to be minor because there were no measurable differences in indoor air TCE concentrations above the entry points versus elsewhere in the warehouse. Indoor air TCE concentrations were higher in other parts of the building, but no strong entry points were identified. Second, the wall gap appeared to represent a limited reservoir of TCE. TCE concentrations within the wall gap decreased after collection of a 6-L Summa sample. In addition, several other wall gaps tested did not show elevated concentrations of TCE. Based on the CSIA results, both the conventional results and the on-site analysis protocol results appear to have provided an incorrect indication of VI as the source of the TCE in indoor air. The CSIA results for Raritan CP4 provided strong evidence of an indoor source because the TCE in groundwater was enriched in both 13C and 37Cl consistent with the kinetic isotope effect of biodegradation while the TCE in indoor air had lower levels of 13C and 37Cl consistent untransformed TCE. Although no indoor source of TCE was identified during the site visit, the building manager reported that the building’s cleaning service had used a TCE-based spot remover in the past. Although she had requested that they not use chlorinated solvents in the building, she indicated that it was possible that they were still using them during some cleaning events.
Although the combined results from the investigations of Raritan CP4 do not support a definitive source identification, the most likely explanation is the recent use of a TCE-containing spot remover. Based on the on-site analysis results, the highest TCE concentrations were found within

24
a cluster of conference rooms that were the only carpeted spaces within the building. TCE concentrations within this cluster of rooms decreased from approximately 6 µg/m3 on the first day of the demonstration to approximately 2 µg/m3 on the fourth day. The elevated concentration of TCE in the wall gap would be consistent with recent use of TCE in the building because elevated TCE concentrations would persist longer in the wall gap than in the more ventilated room space. Overall Finding: The CSIA protocol performed best. Indoor sources are the primary sources of VOC in indoor air. The on-site protocol and conventional approach both provided incorrect results. Raritan 209: The conventional results provided supporting evidence of current VI, with one 8-hour indoor air sample having a TCE concentration of 0.064 µg/m3 and the other <0.05 µg/m3. Because the maximum TCE concentration in indoor air (0.064 µg/m3) was much less than the risk-based screening value (3.0 µg/m3), there is no VI concern. The results from the on-site analysis protocol provided no evidence of current VI. No hot spots with elevated TCE levels were found, and no vapor entry points were found. That, combined with indoor air results below instrument detection limits, indicates a lack of VI. Building 209 is strongly depressurized under normal operating conditions due to the continuous operation of numerous laboratory fume hoods. As a result, conditions were favorable for VI during sample collection. The absence of TCE above risk-based levels in indoor air for both the conventional program and the on-site analysis protocol support a finding of no current or future VI concern. Overall Finding: There was low confidence in the conventional approach because of low concentrations. Results from the on-site protocol were more definitive. Concern regarding temporal variability is low because the building is strongly depressurized from operation of fume hoods.
6.3.2 Other Findings
• The Protocol is Applicable to Large Open Buildings: Prior to the field demonstrations, the on-site analysis protocol had been applied primarily to residences and smaller commercial buildings with discrete rooms. In these buildings, the concentration differences between rooms were important for identification of indoor sources and vapor entry points. For this demonstration, the protocol was applied in several buildings with open floor plans (e.g., Building 9669, 9674, 1533, CP4 warehouse). Even within open floor plans, on-site analysis could be used to identify spatial differences in concentrations leading to the identification of indoor sources or vapor entry points.
• Pressure Control is Effective in Large Buildings: Building pressure could be manipulated sufficiently to impact target VOC concentrations in buildings up to 20,000 sq ft.
• Pressure Control Results Can Be Obtained in as Little as 2 Hours: When pressure manipulation is done, concentrations of target VOC tend to respond quickly. Using on-site analysis, the impact of pressure control is usually clear within 1 hour allowing for pressurization and depressurization to be completed in approximately 2 hours. When concentration changes are small or higher than usual variability is observed, longer times may be required to obtain clear results.
25
• The Protocol is Minimally Disruptive to Building Occupants: The protocol does not require installation of sub-slab sampling points. Minor inconveniences were possible, particularly when implementing the pressure control evaluation; however, equipment could generally be staged to avoid disruption of building activities. The pressure control portion of the investigation can be somewhat more disruptive because it requires that opening of doors be minimized while building pressure is being controlled. Also, the use of a window or door fan to control building pressure may cause noticeable changes in indoor air temperature when the outdoor temperature is well above or below the baseline indoor air temperature. For this reason, pressure control of occupied buildings may not be appropriate when the outdoor temperature is above 90°F or below 40°F.
• The Survey Method has Limited Utility for Identification of Vapor Entry Points: For most demonstration buildings, the HAPSITE survey mode was not sufficiently sensitive to locate specific vapor entry points. However, use of the quantitative mode allowed identification of specific vapor entry points or specific areas within the building where vapor entry was occurring. While survey mode has successfully identified vapor entry points in some buildings, quantitative mode combined with building pressure control appears to be a more reliable method to identify VI.
6.3.3 Evaluation of Performance Objective 3
Overall, for six of the seven demonstration buildings, the on-site analysis protocol performed as well as or better than the conventional approach:
• At four of seven of the demonstration buildings, the on-site analysis protocol yielded clearer VI classifications (Lewis-McChord 9669, Selfridge 1533, Tyndall 156, Tyndall 219 [see Section 5.6.4, Table 7]).
• At two of seven of the demonstration buildings, the VI interpretations from the on-site and conventional approaches were different. At these buildings, Lewis-McChord 9674 and Raritan 209, the conventional approach yielded supporting evidence for VI while the on-site approach indicated there was no evidence of VI. When reviewing the indoor air results from the conventional approach, however, we note that the reported concentrations were low (Lewis-McChord 9674 TCE concentration 0.072 µg/m3 [detection limit 0.038 µg/m3]; Raritan 209 TCE concentration <0.05 µg/m3 and 0.064 µg/m3 [detection limit 0.043 µg/m3]), resulting in less confidence in the conventional results. The on-site approach allows for higher sample density and includes the ability to retest under “worse” building pressure conditions. There is greater confidence in the on-site approach because 1) testing was done under normal and depressurized conditions in multiple locations throughout the buildings; 2) TCE was not detected in indoor air; and 3) field QA met project requirements.
For one of the seven buildings (i.e., Raritan CP4), both the conventional and on-site results provided an incorrect indication of VI as the primary source of TCE detected in the indoor air. The CSIA approach provided the clearest result at this building. The project team applied the on-site GC/MS protocol to several other buildings outside of this ESTCP demonstration. These results, provided in the Final Report (GSI, 2013), further illustrate
26
the utility of the on-site analysis protocol for understanding VI conditions by identifying indoor sources of VOC; identifying specific VI entry points; and confirming the presence or absence of VI through the use of building pressure control. Taken as a whole, the demonstration results validate the on-site analysis protocol as a reliable method to determine the presence or absence of VI in a building.
6.4 OBJECTIVE 4: IMPLEMENTABILITY AND COST EFFECTIVENESS OF THE PROTOCOL FOR ON-SITE ANALYSIS
6.4.1 Demonstration Findings
This objective was evaluated by reviewing the experience gained during the demonstration. Factors which influenced the implementability of the protocol included:
• Choice of Instrument: The most reliable instrument was the SMART PLUS. The HAPSITE ER also worked well, but this instrument was more likely to malfunction.
• Key target VOC: The customized HAPSITE methods described in the Demonstration Plan (GSI, 2012b and 2012c) typically met all performance standards for TCE and PCE (cVOC method) and benzene (petroleum VOC method). However, the methods were less suited for compounds such as vinyl chloride (cVOC method) and toluene (petroleum VOC method). For these analytes, not all calibration goals were met at Tyndall and Selfridge, respectively. For investigations where these are the primary target analytes, we recommend development of an alternative customized method better optimized for these compounds.
• Personnel: Successful implementation of the protocol requires personnel with experience in operation of the HAPSITE (or alternative on-site instrument); and implementation of the protocol. Key skills for HAPSITE operation are familiarity with normal instrument performance, ability to recognize non-standard performance, and ability to analyze and understand detailed results to identify false positive detections and missed quantifications reported by the software operated in default mode. Key skills for implementation of the protocol are the ability to evaluate information from different sources (e.g., on-site analysis instrument, pressure transducer, interviews and building inspection) in order to proceed correctly through the protocol logic.
6.4.2 Evaluation of Performance Objective 4
The on-site analysis protocol is implementable (by personnel with adequate experience) and cost effective (see Section 7). Based on the field experience from the demonstration, several modifications were made to the version of the on-site analysis protocol in the Demonstration Plan. The updated protocol may be found in Appendix E of the ER-201119 Final Report (GSI, 2013).
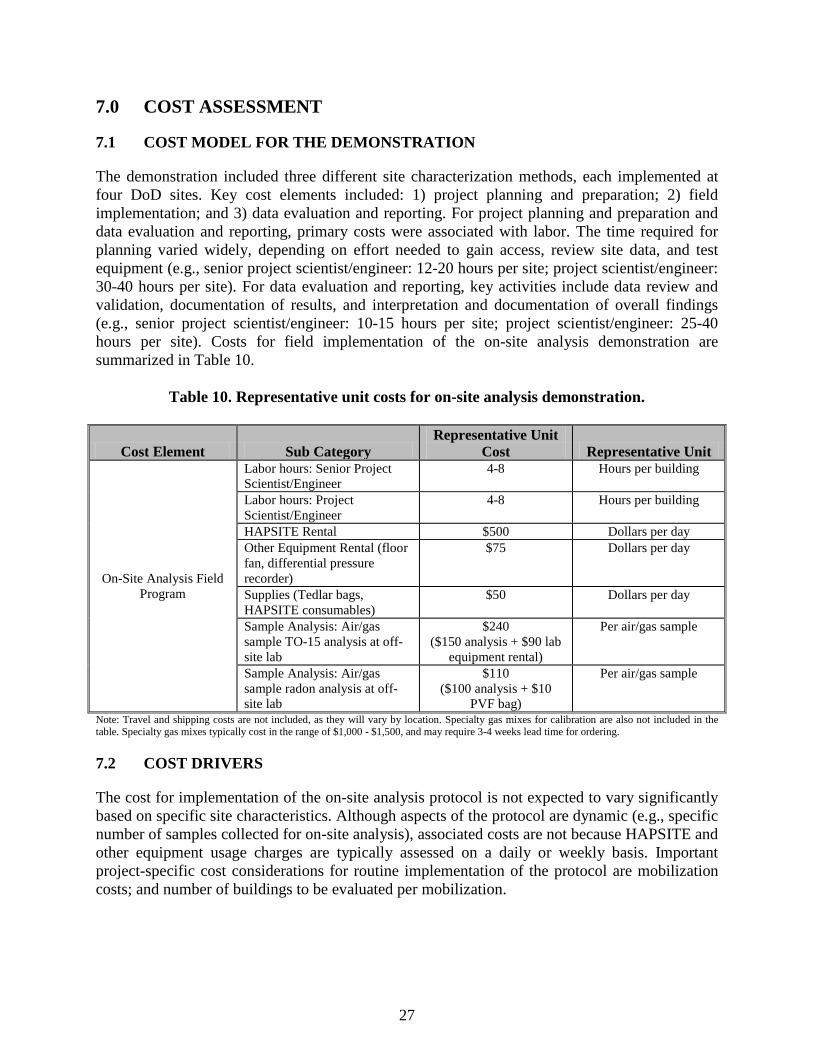
27
7.0 COST ASSESSMENT
7.1 COST MODEL FOR THE DEMONSTRATION
The demonstration included three different site characterization methods, each implemented at four DoD sites. Key cost elements included: 1) project planning and preparation; 2) field implementation; and 3) data evaluation and reporting. For project planning and preparation and data evaluation and reporting, primary costs were associated with labor. The time required for planning varied widely, depending on effort needed to gain access, review site data, and test equipment (e.g., senior project scientist/engineer: 12-20 hours per site; project scientist/engineer: 30-40 hours per site). For data evaluation and reporting, key activities include data review and validation, documentation of results, and interpretation and documentation of overall findings (e.g., senior project scientist/engineer: 10-15 hours per site; project scientist/engineer: 25-40 hours per site). Costs for field implementation of the on-site analysis demonstration are summarized in Table 10.
Table 10. Representative unit costs for on-site analysis demonstration.
Cost Element Sub Category Representative Unit
Cost Representative Unit
On-Site Analysis Field Program
Labor hours: Senior Project Scientist/Engineer
4-8 Hours per building
Labor hours: Project Scientist/Engineer
4-8 Hours per building
HAPSITE Rental $500 Dollars per day Other Equipment Rental (floor fan, differential pressure recorder)
$75 Dollars per day
Supplies (Tedlar bags, HAPSITE consumables)
$50 Dollars per day
Sample Analysis: Air/gas sample TO-15 analysis at off-site lab
$240 ($150 analysis + $90 lab
equipment rental)
Per air/gas sample
Sample Analysis: Air/gas sample radon analysis at off-site lab
$110 ($100 analysis + $10
PVF bag)
Per air/gas sample
Note: Travel and shipping costs are not included, as they will vary by location. Specialty gas mixes for calibration are also not included in the table. Specialty gas mixes typically cost in the range of $1,000 - $1,500, and may require 3-4 weeks lead time for ordering.
7.2 COST DRIVERS
The cost for implementation of the on-site analysis protocol is not expected to vary significantly based on specific site characteristics. Although aspects of the protocol are dynamic (e.g., specific number of samples collected for on-site analysis), associated costs are not because HAPSITE and other equipment usage charges are typically assessed on a daily or weekly basis. Important project-specific cost considerations for routine implementation of the protocol are mobilization costs; and number of buildings to be evaluated per mobilization.

28
7.3 COST ANALYSIS
Routine implementation of the on-site analysis protocol will cost less than implementation during the field demonstration because of the additional tasks needed to validate the protocol. Costs for the on-site analysis protocol (Table 11) are marginally higher than costs of a conventional investigation (Table 12). However, the higher costs are offset by the nature of the results. In other words, the on-site analysis protocol typically yields clearer results than a conventional investigation. Clearer results potentially reduce the need for resampling. Additionally, the protocol will be most cost effective when applied to multiple buildings during a single mobilization.
Table 11. Costs for routine implementation of on-site analysis protocol at four buildings.
Cost Element Category Unit Cost Unit Cost TOTALS
1. Project planning and preparation
Labor Senior Project Scientist/Engineer
16 hours $150 $/hr $2400
$6000 Labor Project Scientist/ Engineer
36 hours $100 $/hr $3600
2. On-site analysis field program
Labor Senior Project Scientist/Engineer
24 hours $150 $/hr $3600
$10,605
Labor Project Scientist/ Engineer
24 hours $100 $/hr $2400
Equipment rental
HAPSITE, floor fan, differential pressure recorder
3 days $575 $/day $1725
Off-site sample analysis
VOC (3 samples × 4 buildings)
12 samples $240 $/spl $2880
Off-site sample analysis
Radon (3 samples × 4 buildings)
0 samples $110 $/spl 0
3. Data evaluation and reporting
Labor Senior Project Scientist/Engineer
15 hours $150 $/hr $2250
$5750 Labor Project Scientist/ Engineer
35 hours $100 $/hr $3500
Project Total: $22,355 Cost Per Building: $5589
Note: 1) Estimates assume application of the procedure at four buildings during a single field program, assuming two buildings per day. Project planning and preparation includes pre-mobilization and on-location tasks (equipment prep/QA). 2) Cost estimates do not include travel to the site or shipping.
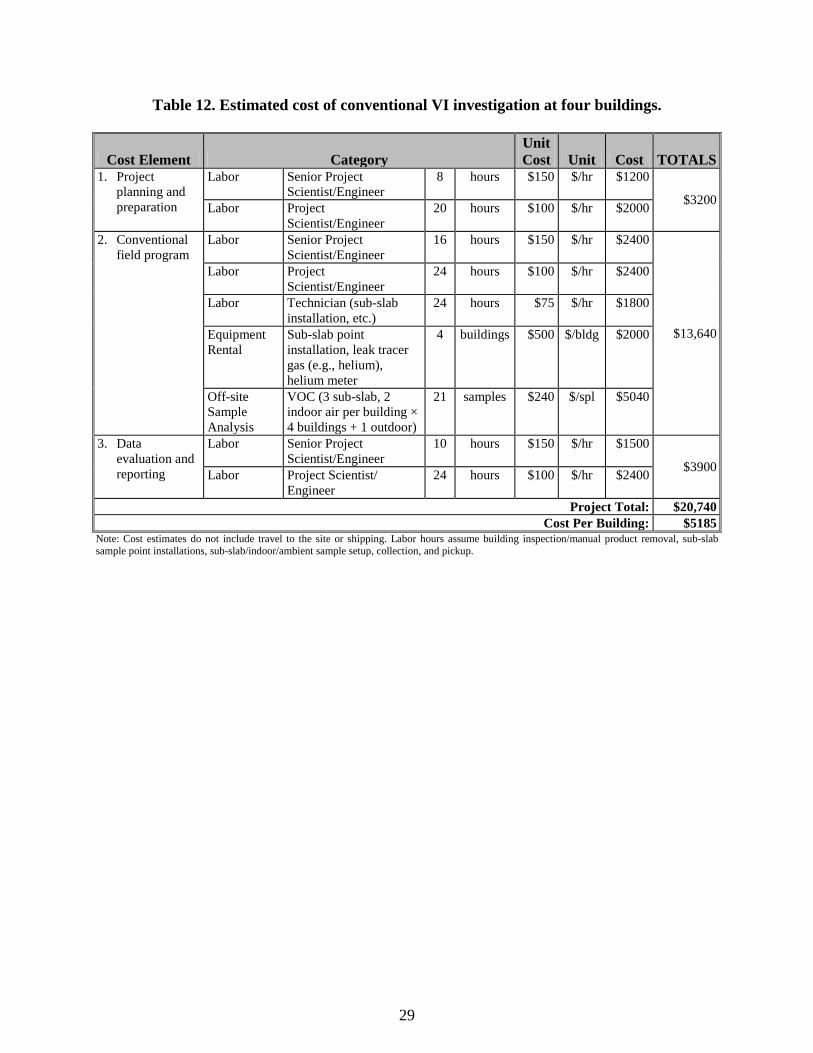
29
Table 12. Estimated cost of conventional VI investigation at four buildings.
Cost Element Category Unit Cost Unit Cost TOTALS
1. Project planning and preparation
Labor Senior Project Scientist/Engineer
8 hours $150 $/hr $1200
$3200 Labor Project Scientist/Engineer
20 hours $100 $/hr $2000
2. Conventional field program
Labor Senior Project Scientist/Engineer
16 hours $150 $/hr $2400
$13,640
Labor Project Scientist/Engineer
24 hours $100 $/hr $2400
Labor Technician (sub-slab installation, etc.)
24 hours $75 $/hr $1800
Equipment Rental
Sub-slab point installation, leak tracer gas (e.g., helium), helium meter
4 buildings $500 $/bldg $2000
Off-site Sample Analysis
VOC (3 sub-slab, 2 indoor air per building × 4 buildings + 1 outdoor)
21 samples $240 $/spl $5040
3. Data evaluation and reporting
Labor Senior Project Scientist/Engineer
10 hours $150 $/hr $1500
$3900 Labor Project Scientist/ Engineer
24 hours $100 $/hr $2400
Project Total: $20,740 Cost Per Building: $5185
Note: Cost estimates do not include travel to the site or shipping. Labor hours assume building inspection/manual product removal, sub-slab sample point installations, sub-slab/indoor/ambient sample setup, collection, and pickup.

This page left blank intentionally.
31
8.0 IMPLEMENTATION ISSUES
This project has resulted in development and validation of an on-site GC/MS analysis protocol to distinguish VI from indoor sources of VOC, one of the major issues with current investigation techniques. The protocol can be used as a standalone investigation method, or as a tool for follow-up sampling in cases where previous data suggest a VI concern but there is uncertainty about the VOC source. Using this approach, a building can be characterized quickly, typically within a 1-day field investigation. The timeframe for final data interpretations will depend on receipt of laboratory (TO-15) results for the confirmation samples. In addition to its utility in determining the source of VOC in indoor air, the on-site GC/MS analysis protocol includes a building pressure control option. This option can be used to better understand the source of VOC (i.e., subsurface or indoors) and to minimize concerns regarding temporal variability. For instance, building depressurization will enhance the potential for VI. Induced negative pressure will tend to draw subsurface vapors, if present, up into the building. As a result, an absence of VI under both baseline and induced negative pressure conditions serves to reduce the concern regarding temporally-variable VI. Advantages of the on-site GC/MS analysis protocol include: 1) real-time results; 2) definitive data via off-site lab analysis for small number of samples; 3) no sub-slab sample points; and 4) reduced sampling/re-sampling requirements by reducing uncertainty with VOC source identification. Potential limitations include: 1) equipment availability and reliability; 2) staff suitably trained in interpretation of vapor data; 3) GC/MS instrument with analytical method suitable to resolve target compounds; and 4) (for pressure control option) building too large (>20,000 sq ft) or too leaky (e.g., constructed with built-in ventilation slats).

This page left blank intentionally.
33
9.0 REFERENCES
Dawson, H., and T. McAlary, 2009. A compilation of statistics for VOC from post-1990 indoor air concentration studies in North American residences unaffected by subsurface vapor intrusion, Ground Water Monitoring and Remediation, Vol. 29, No. 1, pp. 60-69.
Doucette, W., A. Hall, and K. Gorder, 2009. Emissions of 1,2-dichloroethane from holiday decorations as a source of indoor air contamination, Ground Water Monitoring & Remediation, Vol. 30, No. 1, pp. 67-73.
Gorder, K., and E. Dettenmaier, 2011. Portable GC/MS Methods to Evaluate Sources of cVOC Contamination in Indoor Air, Ground Water Monitoring and Remediation, Vol. 31, No. 4, pp. 113-119.
GSI Environmental (GSI), 2012a. ESTCP Project ER-201119, Results of Laboratory Validation Study, Use of On-Site GC/MS Analysis to Distinguish between Vapor Intrusion and Indoor Sources of VOC (McHugh, Molofsky, Gorder, Dettenmaier, Rivera-Duarte), Version 3, Aug 2012.
GSI, 2012b. ESTCP Project ER-201119, Protocol for Site Investigations, Use of On-Site GC/MS Analysis to Distinguish between Vapor Intrusion and Indoor Sources of VOC (McHugh, Beckley, Gorder, Dettenmaier, Rivera-Duarte), Version 2, May 2012.
GSI, 2012c. ESTCP Project ER-201119, Demonstration Plan, Use of On-Site GC/MS Analysis to Distinguish between Vapor Intrusion and Indoor Sources of VOC (McHugh, Beckley, Gorder, Dettenmaier, Rivera-Duarte), Version 2, May 2012.
GSI, 2012d. ESTCP Project ER-201025, Demonstration Plan, Use of Compound-Specific Isotope Analysis to Distinguish between Vapor Intrusion and Indoor Sources of VOC (McHugh, Kuder, Philp), Version 2, June 2012.
GSI, 2013. ESTCP Project ER-201119 Final Report, Use of On-Site GC/MS Analysis to Distinguish between Vapor Intrusion and Indoor Sources of VOC (Beckley, McHugh, Gorder, Dettenmaier, Rivera-Duarte), Version 2, November 2013.
Interstate Technology & Regulatory Council, 2007. Vapor Intrusion: A Practical Guideline, Interstate Technology & Regulatory Council, Washington, DC.
McHugh T., L. Beckley, D. Bailey, K. Gorder, et al, 2012. Evaluation of Vapor Intrusion Using Controlled Building Pressure, Environmental Science and Technology, Vol. 46, No. 9, pp. 4792–4799.
New York Department of Health, 2006. Guidance for Evaluating Soil Vapor Intrusion in the State of New York, Available at http://www.health.state.ny.us/environmental/investigations/soil_gas/svi_guidance/.
34
U.S. Environmental Protection Agency (USEPA), 2002. Draft Guidance for Evaluating the Vapor Intrusion to Indoor Air Pathway from Groundwater and Soils (Subsurface Vapor Intrusion Guidance), Available at http://www.epa.gov/epaoswer/hazwaste/ca/eis/vapor.htm.
USEPA, 2011a. Background Indoor Air Concentrations of Volatile Organic Compounds in North American Residences (1990-2009), U.S. Environmental Protection Agency, Office of Solid Waste and Emergency Response, EPA 530-R-10-001.
USEPA, 2011b. Environmental Technology Verification Report: Verification of Building Pressure Control as Conducted by GSI Environmental, Inc. for the Assessment of Vapor Intrusion, Available at: http://www.epa.gov/nrmrl/std/etv/vt-ams.html#sctvi.
USEPA, 2013. Regional Screening Table, Available at http://www.epa.gov/reg3hwmd/risk/human/rb-concentration_table/index.htm. May 2013 update, accessed 24 June 2013.

A-1
APPENDIX A
POINTS OF CONTACT
Point of Contact Organization
Phone E-Mail Role In Project
Tom McHugh GSI Environmental Inc. 2211 Norfolk Street, Suite 1000 Houston, TX 77098
E-Mail: [email protected]
Principal Investigator
Lila Beckley GSI Environmental Inc. 9600 Great Hills Trail, Suite 350E Austin, TX 78759
Phone: 512-346-4474 Fax: 512-346-4476 E-mail: [email protected]
Project Team Member
Kyle Gorder 75CEG/CEVR 7274 Wardleigh Road Hill AFB, Utah 84056-5137
Phone: 801-775-2559 E-mail: [email protected]
Project Team Member
Erik Dettenmaier
75CEG/CEVR 7274 Wardleigh Road Hill AFB, Utah 84056-5137
Phone: 801-777-3804 E-mail: [email protected]
Project Team Member
Ignacio Rivera-Duarte
SPAWAR Systems Center Pacific Code 71752, Environmental Analysis and Compliance 53475 Strothe Road San Diego, CA 92152-6343
Phone: 619 553-2373 E-mail: [email protected]
Project Team Member
Dr. Sam Brock AFCEC 3300 Sidney Brooks Brooks City-Base TX, 78235
Phone: 210-536-4329 Fax: 210-536-4330 E-mail: [email protected]
Contracting Officer’s Rep.
William Myers Environmental Restoration Bldg 2012 Liggett Avenue Room 313 Box 339500, MS-17 JBLM, WA 98433-9500
Phone: 253-477-3742 E-mail: [email protected]
Site Project Manager (Demonstration Site #1)
Cheryl Neades Environmental Division, IMMI-PWE U.S. Army Garrison Detroit Arsenal, MI 48397
Phone: 586-282-8345 E-mail: [email protected]
Site Project Manager (Demonstration Site #2)
Miguel Plaza Environmental Restoration Flight 325 CES/PMO 119 Alabama Avenue Tyndall AFB, FL 32403
Phone: 850-283-2398 E-mail: [email protected]
Site Project Manager (Demonstration Site #3)
Sandra Piettro Environmental Branch U.S. Army Corps of Engineers NY District Jacob K. Javits Federal Building 26 Federal Plaza Room 1811 New York, NY 10278-0098
Phone: 917-790-8487 E-mail: [email protected]
Site Project Manager (Demonstration Site #4)
Andrea Leeson ESTCP Office 4800 Mark Center Drive Suite 17D08 Alexandria, VA 22350-3805
Phone: 571.372.6565 E-mail: [email protected]
Environmental Restoration Program Manager

This page left blank intentionally.