Use of mode-I cohesive-zone models to describe the ...thouless/Li(2005b).pdf · 1 Use of mode-I...
50
1 Use of mode-I cohesive-zone models to describe the fracture of an adhesively-bonded polymer-matrix composite S. Li 1 , M. D. Thouless 1,2 , A. M. Waas 3 , J. A. Schroeder 4 , and P. D. Zavattieri 4 1 Department of Mechanical Engineering 2 Department of Materials Science & Engineering 3 Department of Aerospace Engineering University of Michigan, Ann Arbor, MI 48109 4 General Motors Research and Development 30500 Mound Rd. Warren, MI 48090 Abstract In this paper, the use of a cohesive-zone approach to model the mode-I fracture of adhesive joints made from a polymer-matrix composite is demonstrated. Cohesive-zone parameters were obtained by matching numerical results to experimental observations. It is shown that there is a distinction between the characteristic strength of the interface associated with the toughness, and the intrinsic cohesive strength of the interface. While the characteristic strength and toughness are often sufficient to describe fracture in the presence of a crack, the intrinsic cohesive strength is also required to analyze some geometries that have very small characteristic dimensions or crack lengths. It is shown that cohesive-zone models accurately predict the behavior of the joints studied. In particular, not only are the strengths and deformations accurately described, but the transition between failure of the composite and failure of the interface can also be predicted. This mode-I transition cannot be predicted by conventional fracture mechanics as it depends on both the energy-based and strength-based failure parameters associated with cohesive-zone models. (June 2004)
Transcript of Use of mode-I cohesive-zone models to describe the ...thouless/Li(2005b).pdf · 1 Use of mode-I...

1
Use of mode-I cohesive-zone models to describe the fracture of an
adhesively-bonded polymer-matrix composite
S. Li1, M. D. Thouless1,2, A. M. Waas3, J. A. Schroeder4, and P. D. Zavattieri4
1Department of Mechanical Engineering 2Department of Materials Science & Engineering
3Department of Aerospace Engineering University of Michigan, Ann Arbor, MI 48109
4General Motors Research and Development
30500 Mound Rd. Warren, MI 48090
Abstract
In this paper, the use of a cohesive-zone approach to model the mode-I
fracture of adhesive joints made from a polymer-matrix composite is
demonstrated. Cohesive-zone parameters were obtained by matching numerical
results to experimental observations. It is shown that there is a distinction
between the characteristic strength of the interface associated with the toughness,
and the intrinsic cohesive strength of the interface. While the characteristic
strength and toughness are often sufficient to describe fracture in the presence of
a crack, the intrinsic cohesive strength is also required to analyze some
geometries that have very small characteristic dimensions or crack lengths. It is
shown that cohesive-zone models accurately predict the behavior of the joints
studied. In particular, not only are the strengths and deformations accurately
described, but the transition between failure of the composite and failure of the
interface can also be predicted. This mode-I transition cannot be predicted by
conventional fracture mechanics as it depends on both the energy-based and
strength-based failure parameters associated with cohesive-zone models.
(June 2004)

2
1. Introduction
The mechanical performance of structural assemblies containing
adhesively-bonded components are generally analyzed using finite-element-
based commercial codes. These codes do not have built-in procedures that are
robust and well-tested for the purpose of modeling the failure of adhesively-
bonded joints. Therefore, a strong need exists to develop techniques that can be
used in conjunction with standard finite-element procedures to analyze
structures containing adhesively-bonded joints.
The field of linear-elastic fracture mechanics (L.E.F.M.) provides one
theoretical framework by which the strength of adhesive bonds can be
characterized. In principle, the toughness of a bonded interface can be
determined as a function of the phase angle (which is a measure of the relative
amounts of shear and opening at the crack tip [Hutchinson and Suo, 1992]).
Provided the geometry of the bonded system, including characteristic
dimensions such as the crack length, and the applied loads are known, it is
possible to calculate the energy-release rate and phase angle for a crack. A
comparison of the calculated energy-release rate with the experimentally-
determined value of toughness at the appropriate degree of mode-mixedness
then permits an assessment of whether a crack will propagate. In principle, it is
possible to determine values of toughness for a variety of crack trajectories (in
the adhesive, along the interface, or through the adherend), and to use the
concepts of mixed-mode fracture mechanics to predict the appropriate crack path
[Drory et al., 1988; He and Hutchinson, 1989; Chen and Dillard, 2001; 2002].
3
Unfortunately, predicting the behavior of a joint can require a fairly expert
interpretation of the fracture mechanics involved, especially if multiple crack
paths are possible, or if a modulus mismatch complicates the definition of the
phase angle [Hutchinson and Suo, 1992]. Furthermore, while the mechanics and
the methods of analysis are fairly-well established, there has been relatively little
effort in the adhesion community to demonstrate quantitative predictability.
Work has generally concentrated on the experimental determination of
toughness using established test configurations, with a limited demonstration of
predictive capabilities. Additional complicating factors fundamentally limit the
use of L.E.F.M. in practical applications. The first of these is that the implicit
assumptions about the stress fields are not rigorously correct. For example, with
laminated structures, it is easy to induce large-scale plasticity in the adherends.
A second factor is that well-fabricated joints may not have macroscopic defects
large enough to be considered cracks for the purposes of fracture mechanics.
These issues negate the utility of a single energy-based parameter to describe
fracture, which is the basis of L.E.F.M. design, and alternative approaches need
to be sought.
Recent developments in the mechanics community have led to a renewed
interest in the concepts of cohesive-zone models to characterize failure
[Needleman, 1987; Ungsuwarungsri and Knauss, 1987; Tvergaard and
Hutchinson, 1992]. These models are refinements of concepts first discussed by
Dugdale [1960] and Barenblatt [1962]. At their core is the introduction of a
second fracture parameter in addition to the toughness, Γ. This second
parameter is a characteristic strength,
!
ˆ " , that relates the toughness to the critical
4
crack-tip opening required for crack advance. 1 Typically, this is often taken to be
the cohesive strength of the interface. But, as discussed later, it is possible to
have traction-separation laws for which the cohesive strength is not coupled to
the toughness. Under these conditions, the characteristic strength might more
appropriately be thought of as a measure of the average strength of the interface,
rather than as a measure of the maximum strength. The two fracture parameters
of characteristic strength and toughness lead to a length scale for fracture given
by
!
E" / ˆ # 2 , where E is the modulus of the material. A comparison of this length
scale to the characteristic dimensions of the geometry indicates whether the
assumptions of linear-elastic fracture mechanics are met. If all characteristic
geometrical lengths are significantly bigger than the fracture length scale, then Γ
alone can be used for failure analyses (Li et al., 2004a). Otherwise, a cohesive-
zone model using both the toughness and characteristic strength must be used to
analyze fracture. Not only does the cohesive-zone approach eliminate the
length-scale restrictions imposed by conventional fracture-mechanics, but
situations in which conventional fracture mechanics is appropriate are easily
solved as special cases of the more general cohesive-zone framework. Moreover,
the nature of the implementation of cohesive-zones into numerical analyses
results in essentially automatic predictions of fracture, providing a smooth
transition between different failure regimes.
Failure of adhesive joints subjected to both linear and non-linear
deformations of the adherends has been studied using these techniques [Yang et
al., 1999; Yang and Thouless, 2001; Kafkalidis and Thouless, 2002; Swadener et al.,
1 An appropriate crack opening that is related to the toughness can also be used as the second
5
2002], as have the fracture and delamination of laminated composites [Shahwan
and Waas, 1997; Song and Waas, 1994; 1995]. In particular, it has been
demonstrated that it is possible to determine the appropriate cohesive-zone
parameters of an adhesive layer experimentally, and to incorporate them into
numerical analyses that have excellent predictive capabilities [Yang and
Thouless, 1999; Kafkalidis and Thouless, 2002; Sørensen, 2002; Sørenson and
Jacobsen, 2003]. It has also been demonstrated that cohesive-zone models have
the potential to be used to predict arbitrary crack trajectories [Xu and
Needleman, 1994; Camacho and Ortiz, 1996; Zavattieri and Espinosa, 2001].
Establishing a framework for the development of cohesive-zone models
for adhesively-bonded composite joints was the overall goal of this work.
Meeting this goal will eventually require the incorporation of mixed-mode
effects on fracture. However, while this is the focus of related work [Li et al.,
2004c], attention is limited to mode-I fracture in this initial paper. Particular
issues that are addressed in this paper are (i) how to determine the mode-I
cohesive parameters of a bonded interface and what the physical significance of
these parameters might be, and (ii) to verify the predictive capabilities of the
model, with a focus on predicting the failure mechanism of a bonded joint.
2. Specimen fabrication and characterization of the materials
The adherends were a polypropylene-based thermoplastic composite
reinforced with 19% (by volume) glass fibers, in the form of a randomly-oriented
mat.2 Coupons of the composite with the desired dimensions were cut from
parameter, instead of the characteristic strength. 2 Azdel R401 provided by Azdel, Inc..
6
plaques that were re-molded from the as-received material using a hydraulic
press at 70 °C and 13 MPa for about 1.5 minutes. These coupons were bonded
using an experimental, two-part adhesive,3 that cures at room temperature and
was specially formulated to bond low-surface-energy materials such as
polypropylene. During bonding, the adhesive layer was kept at a uniform
thickness of 0.6 ~ 0.8 mm by using glass beads as spacers. Where required, a
strip of Teflon tape was inserted into one of the adhesive/composite interfaces
before applying the adhesive, so as to define the limit of the adhesive. The
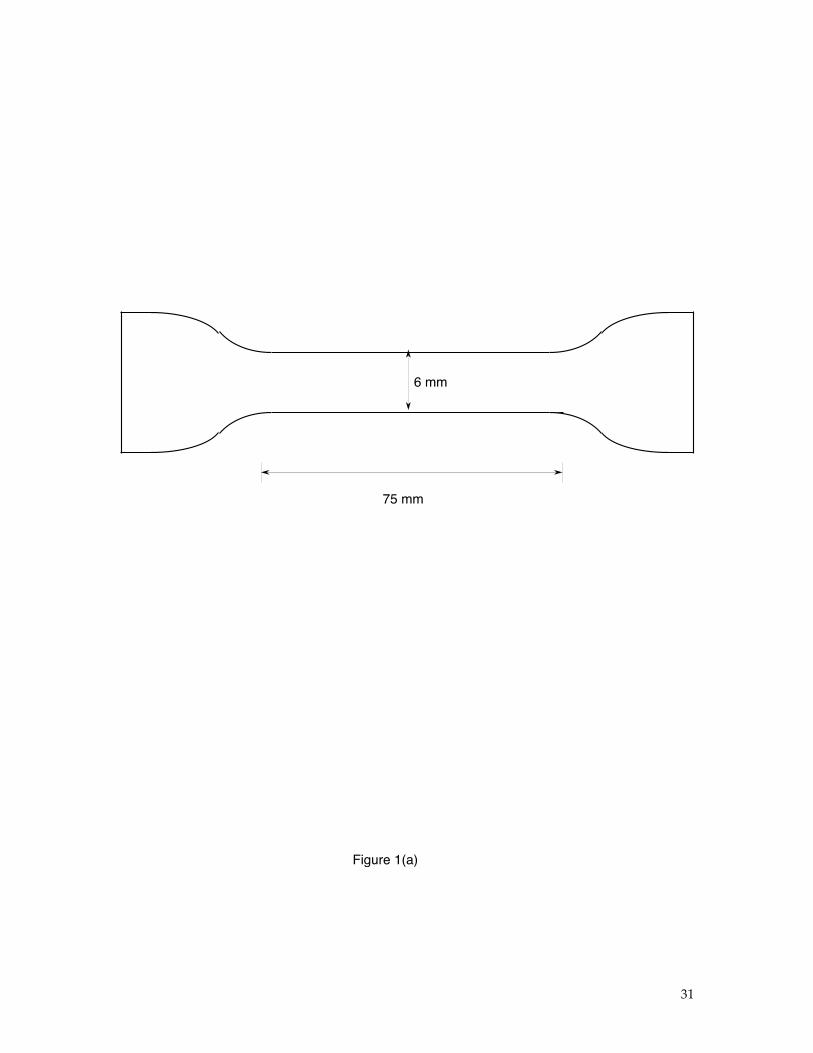
tensile constitutive properties of the adhesive were determined from cast
coupons of the adhesive (Fig. 1a), and are shown in Fig. 1(b).
The constitutive properties of the adherends always need to be known
when developing and using cohesive-zone models for the interface between
them. Furthermore, cohesive-zone models for the adherends need to be known if
there is a possibility of the crack branching out of the interface. The
characterization of the composite used in these studies and the development of
an appropriate cohesive-zone model for it, have been described elsewhere [Li et
al., 2004b]. A summary of the important points is provided here. The
constitutive properties of the composite used in this study were determined
using uniaxial tensile tests and Iosipescu shear tests [Li et al., 2004b]. While the
mechanical properties varied considerably between specimens, it was found that
the composite could be characterized as being transversely isotropic with
approximately linear-elastic / perfectly-plastic properties. The in-plane tensile
modulus showed considerable specimen-to-specimen variation, lying in the
3 Provided by Dow Chemical Company.

7
range of 4.5 to 7.5 GPa. Poisson’s ratio was determined to be 0.30 ± 0.03, and the
shear yield strength varied between 50 and 80 MPa. Crack propagation
perpendicular to the fibers was accompanied by a significant amount of fiber
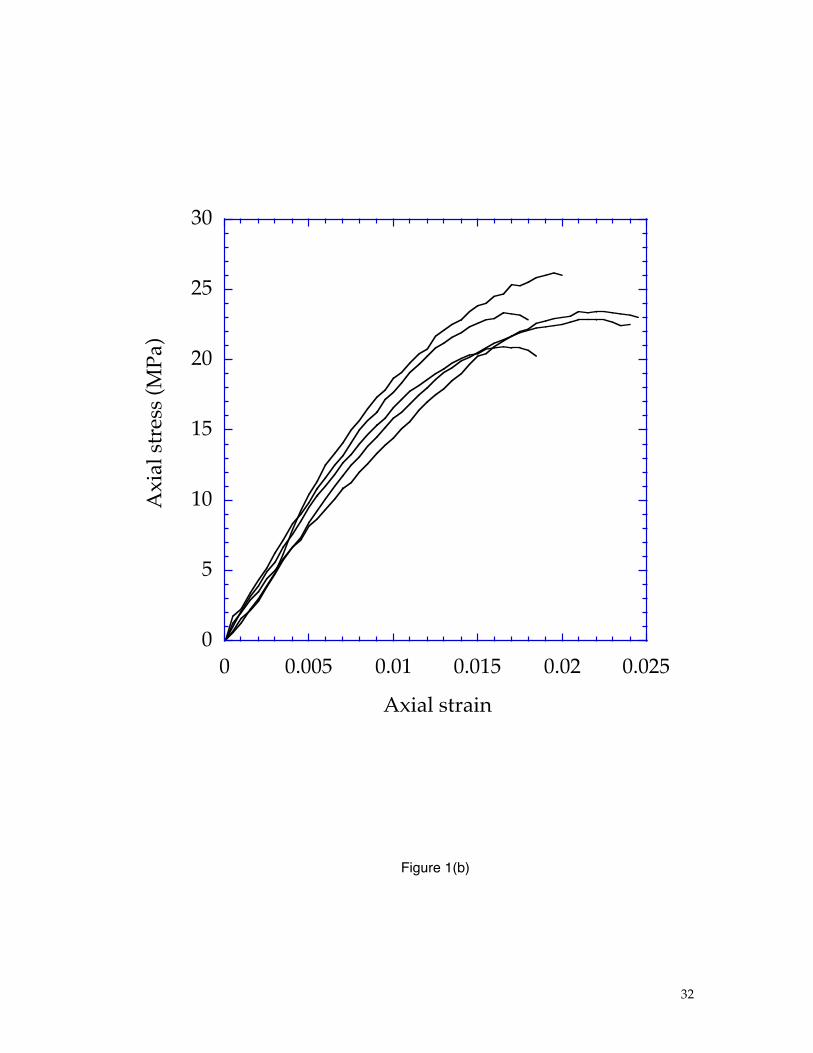
pull-out. The mode-I fracture properties of the composite could be described by
a cohesive law of the form shown in Fig. 2, which captures the observed behavior
of matrix cracking followed by fiber pull-out. The three important parameters
that describe the mode-I cohesive law for the composite are the matrix-cracking
strength,4
!
ˆ " m
=100 ± 20 MPa, the fiber-bridging strength,
!
ˆ " b = 79 ± 8 MPa, and
the toughness, ΓΙc = 40 ± 4 kJm-2. It was shown that good quantitative predictions
for the fracture of the composite could be obtained by incorporating this traction-
separation law into a commercial 2-D finite-element code (ABAQUS version 6.3),
through the use of 4-node, user-defined elements [Li et al., 2004b].
3. Determination of the mode-I interfacial cohesive parameters
3.1 Two-parameter model
The two characteristic mode-I cohesive properties of an interface, the
characteristic strength,
!
ˆ " i, and the toughness, ΓIi, can be obtained quite easily
from plots of applied load versus displacement for a bonded double-cantilever
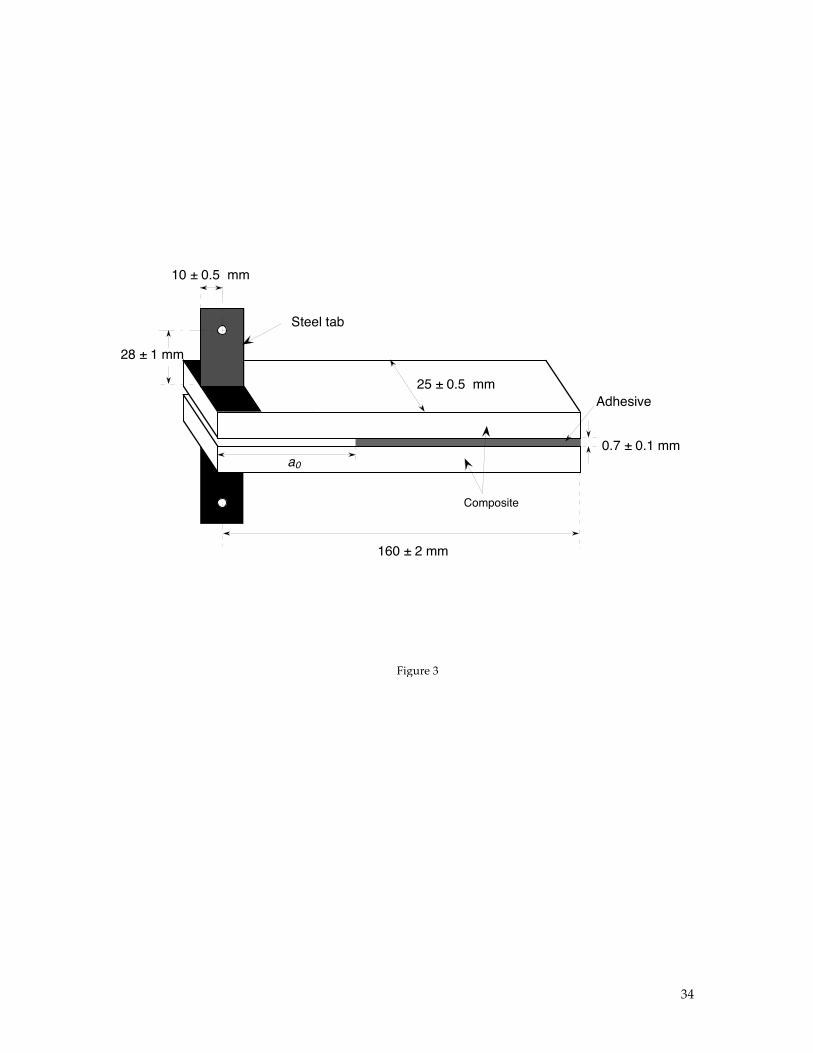
beam (Fig. 3). The cohesive zone reaches its fully-developed state at the peak
load, and then the load decreases with increasing displacement as the crack
begins to propagate. Provided that bending of the arms occurs in a linear
fashion, a simple relationship exists between the applied load (per unit width), F,
and the displacement, δ, [Li et al., 2004a] during this stage:
4 This value of matrix cracking strength is a lower bound to the actual strength. It is an effective value useful for predictive purposes that amalgamates the toughness and intrinsic

8
!
F
E h
"
# $
%
& '
2
=1
3 3
(Ii
E h
"
# $
%
& '
3 / 2
)
h
"
# $ %
& '
*1
, (1)
where h is the thickness of the arms, and
!
E is the modulus of the arms.5 The
crack length and the characteristic interfacial strength do not affect the
relationship between the applied load and displacement after the peak load has
been reached. Therefore, the toughness of an interface can be determined by a
simple graphical interpretation of the decaying portion of load-displacement
curves for a double-cantilever beam. After the toughness has been determined,
the characteristic strength of the interface can be found from a full cohesive-zone
analysis in which the initial crack length has an important role. By running
successive numerical simulations with the known toughness and different values
of strength, numerical predictions of the rising portion of the load-displacement
curve and, in particular, of the peak load can be compared to the experimental
load-displacement curves. The best fit between the numerical predictions and
the experimental results gives the characteristic strength of the interface. Of
course, if the fracture length scale is too small,
!
ˆ " i does not affect the failure load.
Under these conditions, the characteristic strength cannot be determined, and the
geometry may need to be changed.
Double-cantilever-beam specimens with the geometry shown in Fig. 3
were fabricated by cutting coupons of the composite and bonding them with the
adhesive, as described in the previous section. A region of the interface had no
adhesive applied to it, so as to create an initial debond region. The end of this
inhomogeneities in the composite. The precise value of the matrix cracking strength does not generally affect the numerical analyses, except for nominally uncracked materials.
9
region was delineated by a piece of Teflon tape. The specimens were loaded in a
screw-driven mechanical testing machine by a pin joint through steel tabs
bonded to the surface of the composite. The nominal displacement rate for all
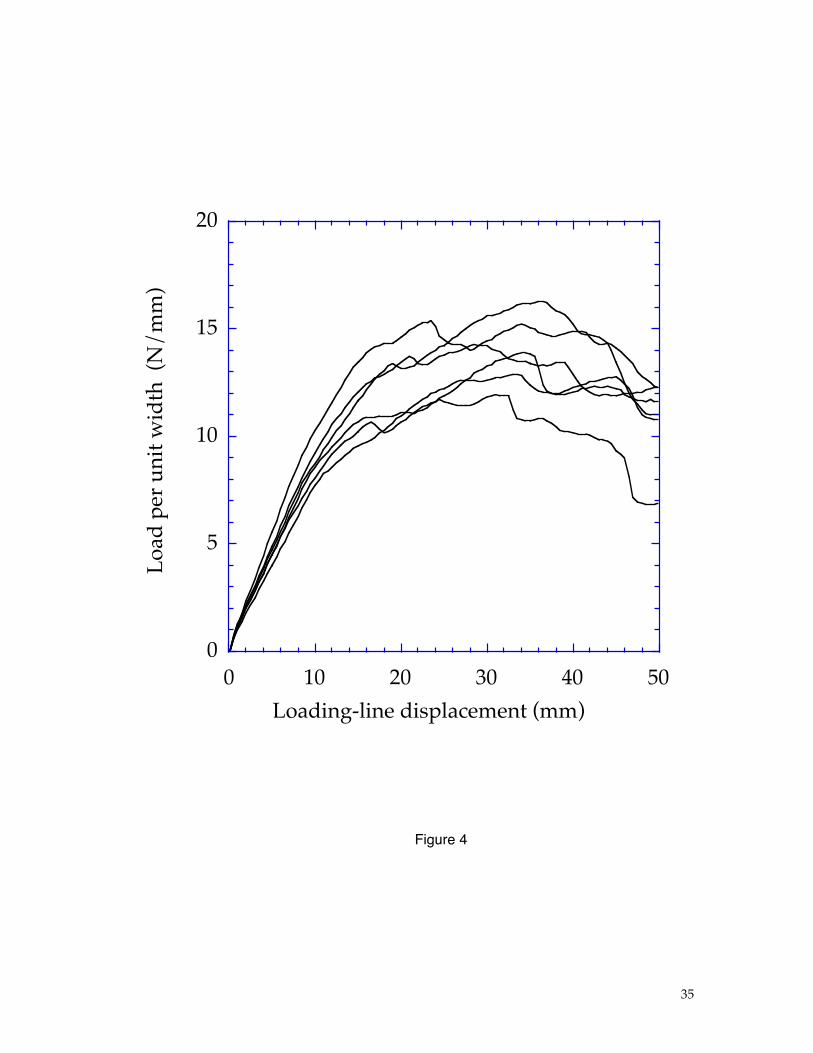
studies was maintained at 1 mm/minute. Figure 4 shows examples of the
relationship between the applied load and its displacement for specimens with
an arm thickness of h = 7.6 ± 0.2 mm, and initial crack lengths in the range of 67
to 75 mm. Optical micrographs of the fracture region at the crack tip are shown
in Fig. 5. From these it can be seen that, although the geometry is mode-I, the
crack grows in the interfacial region rather than through the middle of the
adhesive. In the specimens used in this initial study, the crack always ran
parallel to the interface with no tendency to break the arms. However, the
fracture process did leave a small amount of the composite material on the
adhesive, and fiber pull-out was observed. This indicates that the toughness for
interfacial fracture, ΓIi, and the associated characteristic strength,
!
ˆ " i, may be
controlled by fiber bridging, rather than by the intrinsic properties of the
adhesive itself.
Owing to the toughness of the interface and the compliance of the arms,
the deformations were sufficiently large for non-linear effects to affect the rigor
of Eqn. 1. Therefore, both the interface toughness and the cohesive strength were
found by full cohesive-zone analyses using the ABAQUS finite-element program
(version 6.3) [Li, 2004]. The entire adhesive layer was replaced by four-noded,
user-defined elements with an initial thickness of 0.7 mm. The adherends were
5
!
E = E/ 1 " #2( ) in plane strain and
!
E = E in plane stress, where E is Young’s modulus and ν is Poisson’s ratio.
10
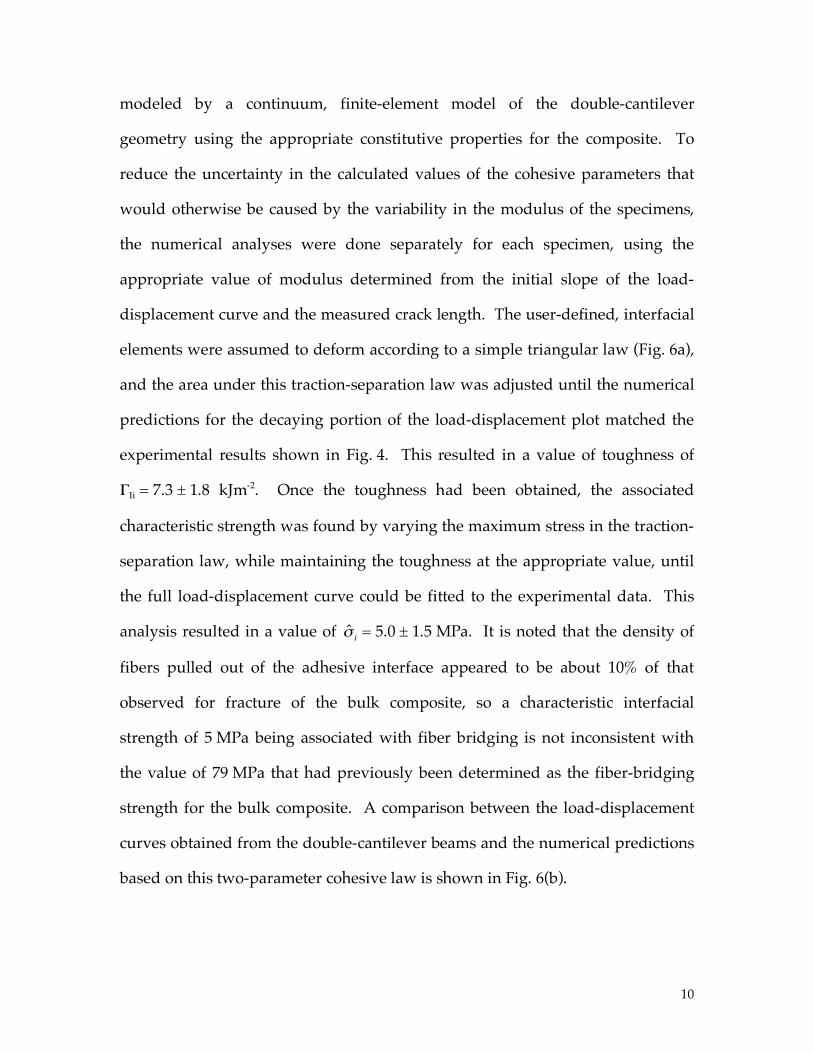
modeled by a continuum, finite-element model of the double-cantilever
geometry using the appropriate constitutive properties for the composite. To
reduce the uncertainty in the calculated values of the cohesive parameters that
would otherwise be caused by the variability in the modulus of the specimens,
the numerical analyses were done separately for each specimen, using the
appropriate value of modulus determined from the initial slope of the load-
displacement curve and the measured crack length. The user-defined, interfacial
elements were assumed to deform according to a simple triangular law (Fig. 6a),
and the area under this traction-separation law was adjusted until the numerical
predictions for the decaying portion of the load-displacement plot matched the
experimental results shown in Fig. 4. This resulted in a value of toughness of
ΓΙi = 7.3 ± 1.8 kJm-2. Once the toughness had been obtained, the associated
characteristic strength was found by varying the maximum stress in the traction-
separation law, while maintaining the toughness at the appropriate value, until
the full load-displacement curve could be fitted to the experimental data. This
analysis resulted in a value of
!
ˆ " i = 5.0 ± 1.5 MPa. It is noted that the density of
fibers pulled out of the adhesive interface appeared to be about 10% of that
observed for fracture of the bulk composite, so a characteristic interfacial
strength of 5 MPa being associated with fiber bridging is not inconsistent with
the value of 79 MPa that had previously been determined as the fiber-bridging
strength for the bulk composite. A comparison between the load-displacement
curves obtained from the double-cantilever beams and the numerical predictions
based on this two-parameter cohesive law is shown in Fig. 6(b).

11
3.2 Three-parameter model
Numerical studies showed that the results of Fig. 6(b) are not sensitive to
details of the traction-separation law chosen to model the fracture, provided that
the law has a toughness of 7.3 ± 1.8 kJm-2 and a characteristic strength
corresponding to the 5.0 ± 1.5 MPa that was used for the triangular law.6
However, the observations of fiber bridging indicated that, as with the bulk
composite material (Fig. 2), a second strength parameter associated with the
intrinsic cohesive strength of the interface,
!
ˆ " io
, that is distinct from the
characteristic strength of the interface,
!
ˆ " i, might be physically appropriate. To be
of practical significance, this intrinsic cohesive strength would have to be
substantially greater than the characteristic strength, and the characteristic
dimensions of the specimen would have to be small enough to cause fracture at
an average stress greater than
!
ˆ " i.
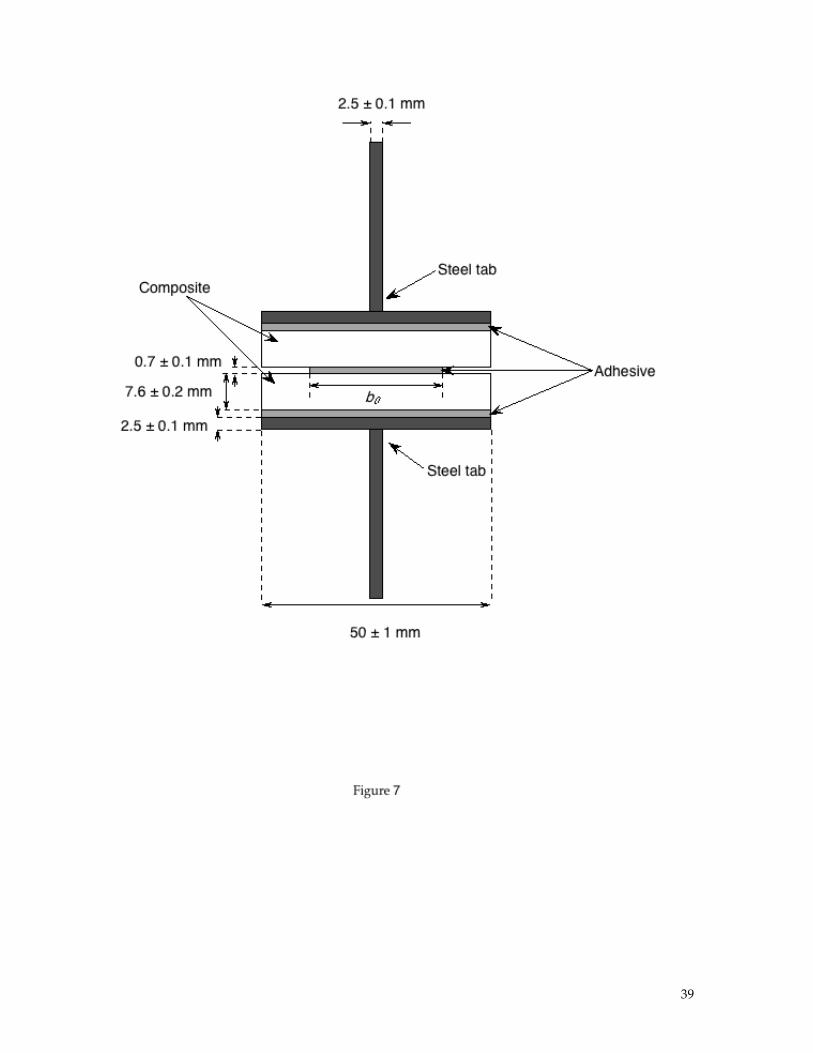
To investigate the intrinsic cohesive strength of the interface, butt joints of
the form shown in Fig. 7 were fabricated. Two coupons of the composite were
bonded together using the experimental adhesive under the bonding conditions
described earlier. This interface was then machined to leave a short ligament
between the two coupons. In order to provide structural support, the composite
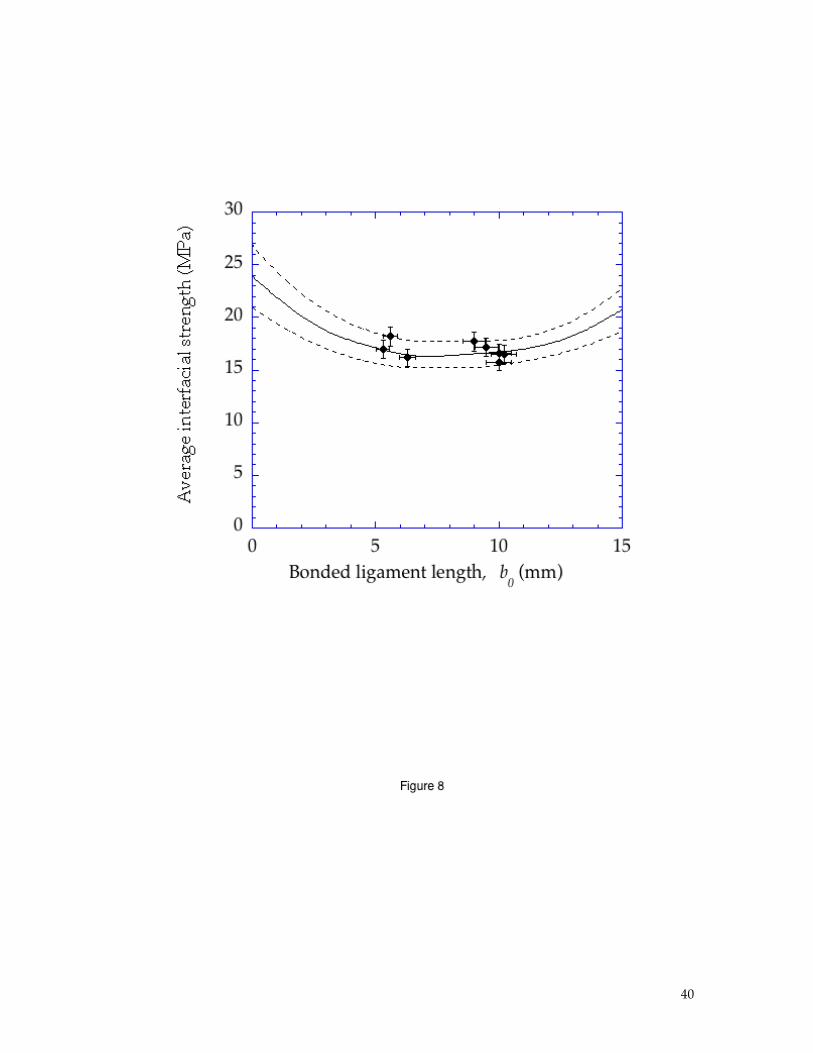
coupons were bonded to steel tabs using the same adhesive. The average
interfacial strength, defined as the maximum applied load divided by the
bonded area, is shown for two different ligament lengths in Fig. 8. It will be
observed that the average strength of the interface in these studies is
considerably higher than the characteristic strength of the interface determined

12
in the previous section. Furthermore, it is impossible to match these tensile data
with any two-parameter cohesive law that describes the propagation of
macroscopic cracks properly. Conversely, it is also impossible to match the data
of Fig. 4 using any two-parameter cohesive law that describes the data of Fig. 8.
The two sets of data can only be rationalized by a cohesive law that identifies
two separate strengths. This confirms the conjecture that a cohesive strength can
be associated with interface failure that may be distinct from the characteristic
strength associated with the primary toughening mechanism. It also illustrates a
potential problem with determining strength parameters for cohesive laws by
what might seem to be the direct approach of using tensile tests with short
bonded ligaments. However, it should be noted that these issues associated with
the shape of the cohesive law may not always be significant. It is to be expected
that in many systems, the cohesive strength and the characteristic strength are
intimately connected. Under these conditions, one strength parameter would be
expected to suffice to predict the behavior of different geometries, as illustrated
by Mohammed and Liechti [2000].
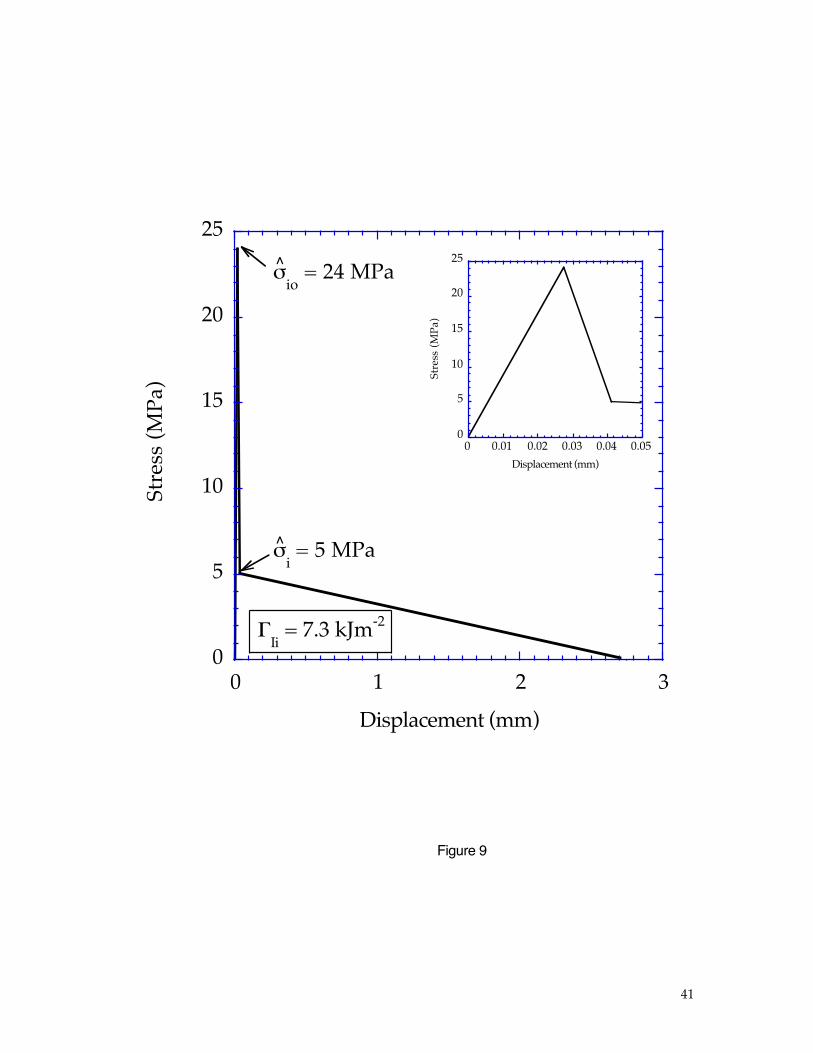
A schematic cohesive law that captures the physics of interfacial cracking
followed by fiber bridging is shown in Fig. 9. The displacements corresponding
to the points of maximum stress were chosen so as to mimic an initial elastic
behavior followed by a sudden drop in strength without causing extensive
numerical difficulties. Based on the double-cantilever beam results, the
characteristic strength,
!
ˆ " i, was set equal to 5.0 ± 1.5 MPa, and the toughness, ΓIi
was set equal to 7.3 ± 1.8 kJm-2. The cohesive strength of the interface,
!
ˆ " io
was
6 In other words, different laws that had an average strength in the range of 2.3 to 4.0 MPa and a
13
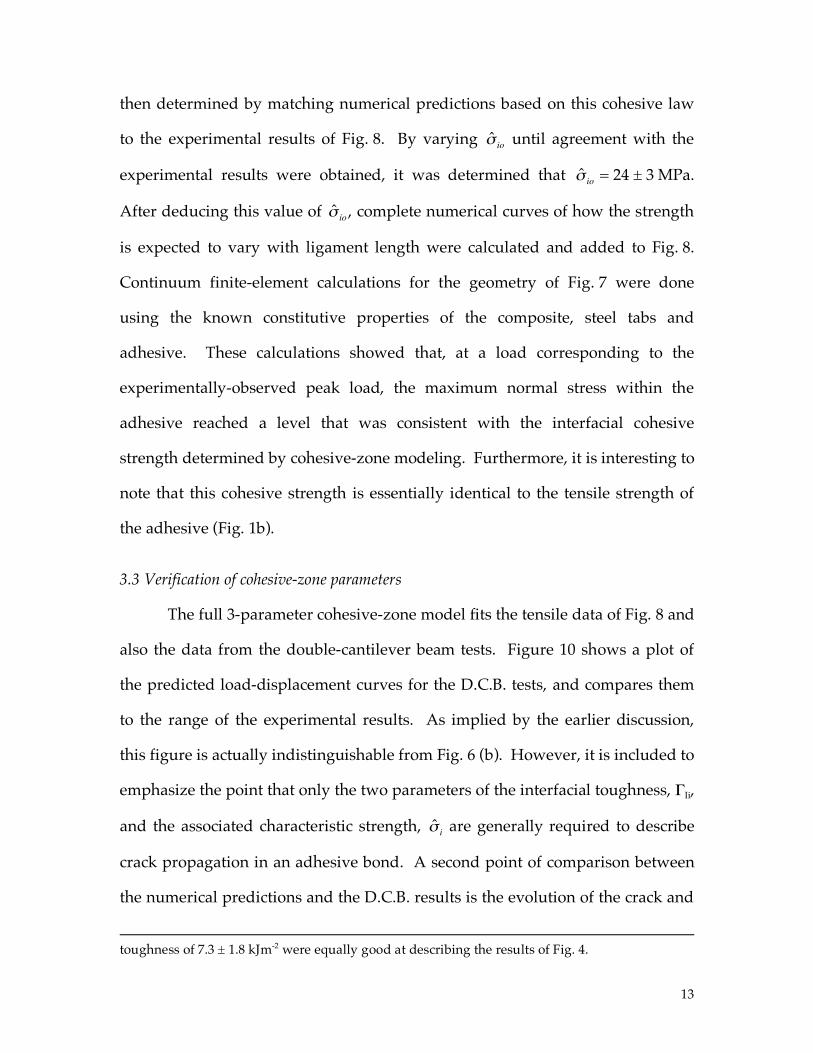
then determined by matching numerical predictions based on this cohesive law
to the experimental results of Fig. 8. By varying
!
ˆ " io
until agreement with the
experimental results were obtained, it was determined that
!
ˆ " io
= 24 ± 3 MPa.
After deducing this value of
!
ˆ " io
, complete numerical curves of how the strength
is expected to vary with ligament length were calculated and added to Fig. 8.
Continuum finite-element calculations for the geometry of Fig. 7 were done
using the known constitutive properties of the composite, steel tabs and
adhesive. These calculations showed that, at a load corresponding to the
experimentally-observed peak load, the maximum normal stress within the
adhesive reached a level that was consistent with the interfacial cohesive
strength determined by cohesive-zone modeling. Furthermore, it is interesting to
note that this cohesive strength is essentially identical to the tensile strength of
the adhesive (Fig. 1b).
3.3 Verification of cohesive-zone parameters
The full 3-parameter cohesive-zone model fits the tensile data of Fig. 8 and
also the data from the double-cantilever beam tests. Figure 10 shows a plot of
the predicted load-displacement curves for the D.C.B. tests, and compares them
to the range of the experimental results. As implied by the earlier discussion,
this figure is actually indistinguishable from Fig. 6 (b). However, it is included to
emphasize the point that only the two parameters of the interfacial toughness, ΓIi,
and the associated characteristic strength,
!
ˆ " i are generally required to describe
crack propagation in an adhesive bond. A second point of comparison between
the numerical predictions and the D.C.B. results is the evolution of the crack and
toughness of 7.3 ± 1.8 kJm-2 were equally good at describing the results of Fig. 4.

14
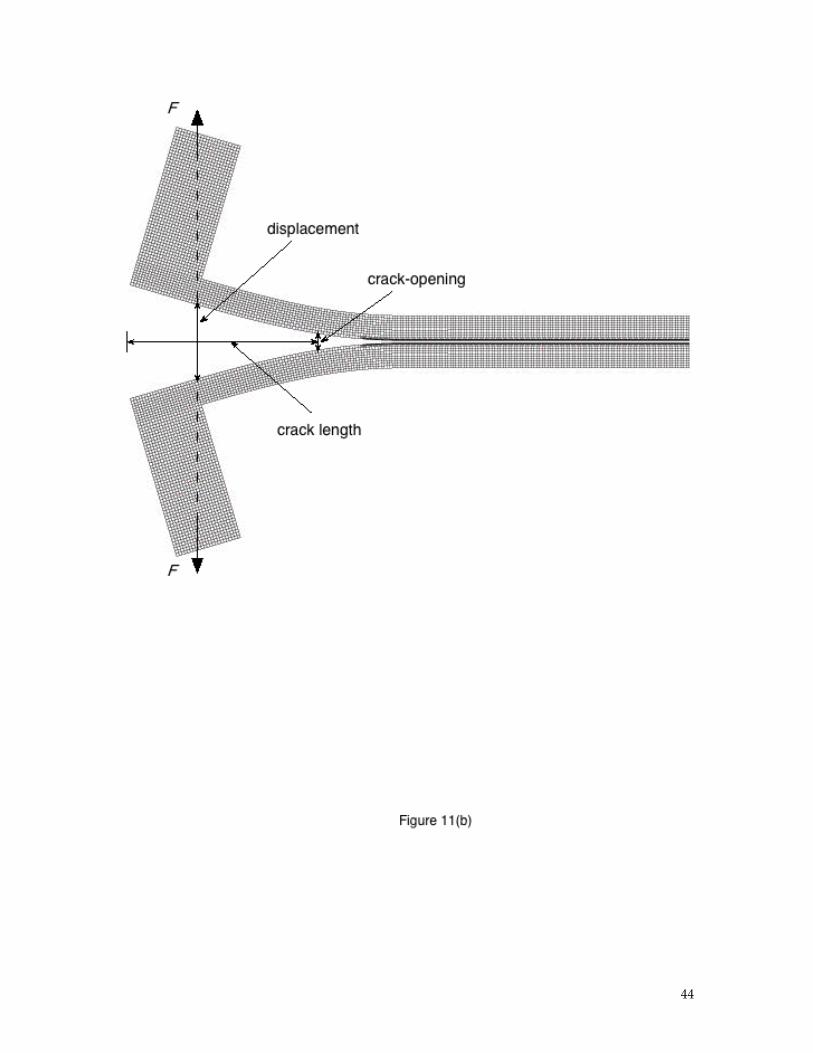
bridged region. This was done by monitoring how the location of a point at
which the crack-opening had a specified value moved as a function of the
displacement (Fig. 11). Specifically, a scale was fixed to the side of a double-
cantilever beam that allowed the distance from the crack mouth to be measured.
A C.C.D. camera was used to record images of the bridged region of the crack.
As the load increased and the crack advanced, these images were used to
determine the distance from the crack mouth where the crack opening was equal
to a specific value, arbitrarily set at 1.2 mm. This distance from the crack mouth
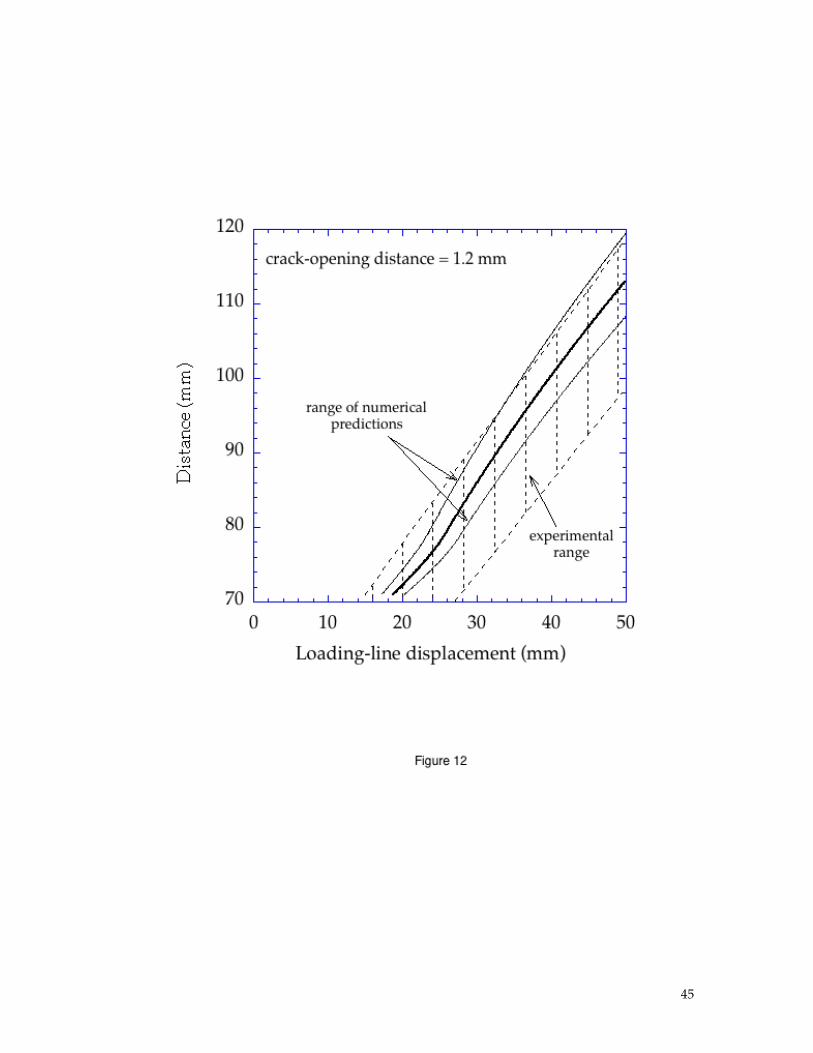
was then plotted as a function of displacement of the applied load. Numerical
calculations were performed for the geometry using the three-parameter
cohesive-zone model. The results of these calculations were analyzed in the
same way as the experiments to produce a plot of distance from the crack mouth
at which the crack opening reached 1.2 mm as a function of displacement. A
comparison between the experimental data and the numerical predictions is
shown in Fig. 12. While there is a fairly large range of experimental uncertainty,
the numerical predictions lie well within the experimental band, supporting the
values of the cohesive-zone parameters deduced for this adhesive. Again, it
should be noted that the two-parameter and the three-parameter cohesive laws
give equally good fits to the data, as the evolution of the bridging zone in the
wake of the crack is dominated by the toughness and characteristic strength.
4. Transitions in fracture mechanisms
4.1 Numerical predictions and experimental observations
It has already been shown that a cohesive-zone model accurately predicts
the behavior of a metal joint in which plastic deformation of the adherends can
15
occur [Yang et al., 1999; Yang and Thouless, 2001; Kafkalidis and Thouless, 2002].
While yield of the adherends is not an issue in the present study, the possibility
of the composite fracturing does need to be considered. Therefore, it is
appropriate to include the cohesive laws for both the interface and the composite
in full analyses of these joints. In this section, the results of such an analysis are
described and compared to experimental observations. Since only a mode-I
model has been developed in this paper, attention is focused on the double-
cantilever-beam geometry, with different thicknesses of arm. The performance
of mixed-mode geometries will be the focus of a companion paper [Li et al.,
2004c]. Two additional sets of double-cantilever-beam specimens were made
following the procedures described earlier. The initial crack length for both sets
was 40 ± 1.5 mm; one set had arms that were 2.8 ± 0.2 mm thick, while the other
had arms that were 5.0 ± 0.2 mm thick. The specimens were tested at a
displacement rate of 1 mm/minute.
A calculation in which both the composite and interface are fully modeled
by cohesive elements would be computationally intensive. A less intensive
approach was used in this study by doing the numerical calculations in several
stages. In the first stage, the composite was modeled by its continuum
properties, and the adhesive layer was replaced by the appropriate 3-parameter
cohesive-zone model of the interface (Fig. 9). These initial calculations were used
to identify the direction in the arms for which the normal stress was a maximum.
In the present case, this direction was approximately perpendicular to the
interface. In the second stage of the calculations, additional user-defined
elements, describing the cohesive properties of the composite (Fig. 2), were

16
embedded in the composite around the initial crack tip, and aligned
perpendicular to the interface. To keep the numerical model to a reasonable size,
the region in which cohesive-zone elements were embedded was limited to
10 mm in length. Once the calculations had begun, the propagation of the crack
was monitored and the program terminated if the interfacial crack tip passed the
region in which cohesive-zone elements were embedded in the composite. The
model was then re-meshed with a new region of composite cohesive-zone
elements, and the analysis re-started. This process was repeated until the crack
had either grown completely along the interface or had caused failure of the
composite. No attempt was made to analyze the crack path within the
composite. The analysis was focused on the conditions required to initiate a
crack within the composite. The numerical calculations were done allowing
large-scale, non-linear deformations to occur (although all strains were small),
and the effects of uncertainty and variation in the cohesive parameters, the
constitutive properties of the composite, and in the geometry were all explored.
Numerical calculations with combined cohesive elements for the
composite and interface were first done for specimens with arms that were
7.6 mm thick. The results indicated that these specimens should always fail
along the interface, with no tendency for the arms to break. This dominance of
interfacial fracture was consistent with the experimental observations shown in
Fig. 4. The predicted load-displacement plots were unaffected by the inclusion of
cohesive-elements within the composite. Therefore, comparisons between the
numerical predictions and experimental observations for the load-displacement
curves are identical to those already given in Figs. 10 and 6(b).
17
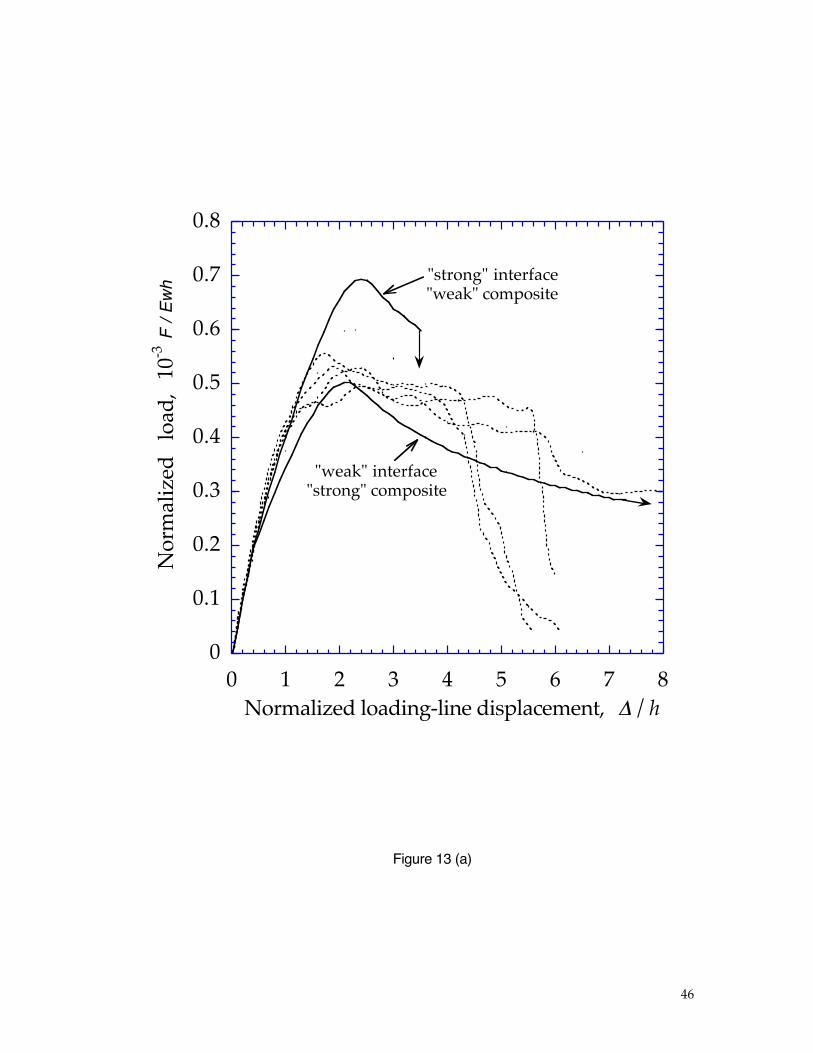
The predictions for specimens with arms that were 5.0 mm thick showed
the possibility of a transition between interfacial fracture and composite fracture,
depending on the material and cohesive properties. Figure 13(a) shows how the
predicted load-displacement plot depended on the cohesive parameters when
the modulus of the composite arms was 6.0 GPa, and the loading was assumed to
be perfectly symmetrical. When the interfacial cohesive parameters were at the
weakest end of their range, and the composite parameters were at the strongest
end of their range, an interfacial crack propagated without deviating into the
composite. At the other extreme, with a “weak” composite and a “strong”
interface, the crack deviated into the composite after a limited amount of crack
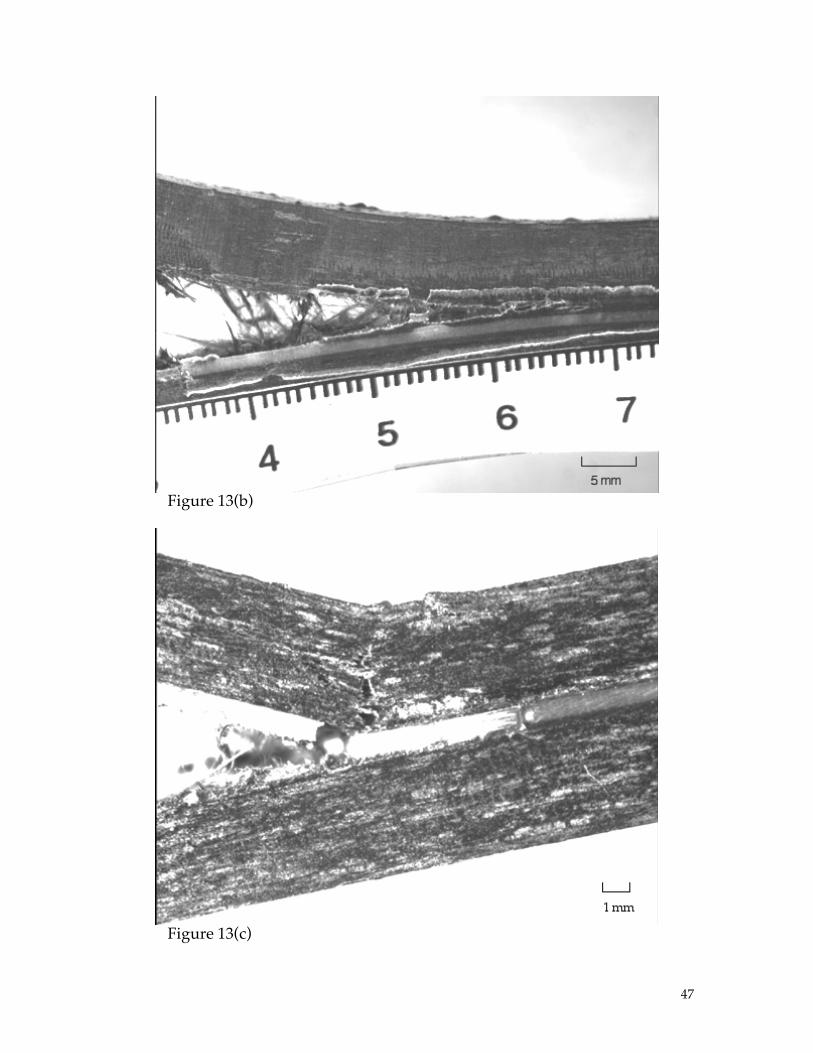
growth. These predictions were consistent with experimental observations
where both stable interfacial crack growth (Fig. 13b), and composite failure were
observed (Fig. 13c). The experimental load-displacement plots obtained for a set
of data for which the composite arms had a modulus of 6.0 GPa have been
superimposed on the numerical predictions plotted in Fig. 13(a).
The predictions for the 2.8 mm specimens indicated a much more marked
tendency for composite fracture. Generally, these calculations indicated that the
arms would fracture after the crack had propagated between about 10 and
18 mm along the interface. The precise distance that the interface crack was
predicted to propagate depended on the properties of the specimen. It was
observed from the numerical simulations that a fully-bridged crack always
propagated some distance along the interface before the adherends failed. This
indicated that the transition to composite fracture was triggered by non-
linearities in the deformation of the arms; otherwise, once steady-state had been

18
achieved there would have been no effect of crack length on the failure
mechanism. Extensive interfacial crack propagation could be obtained only with
a “strong” composite, a “weak” interface and a relatively low value of composite
modulus. At higher values of the composite modulus, the composite failed even
when the cohesive parameters were in the range that would otherwise have
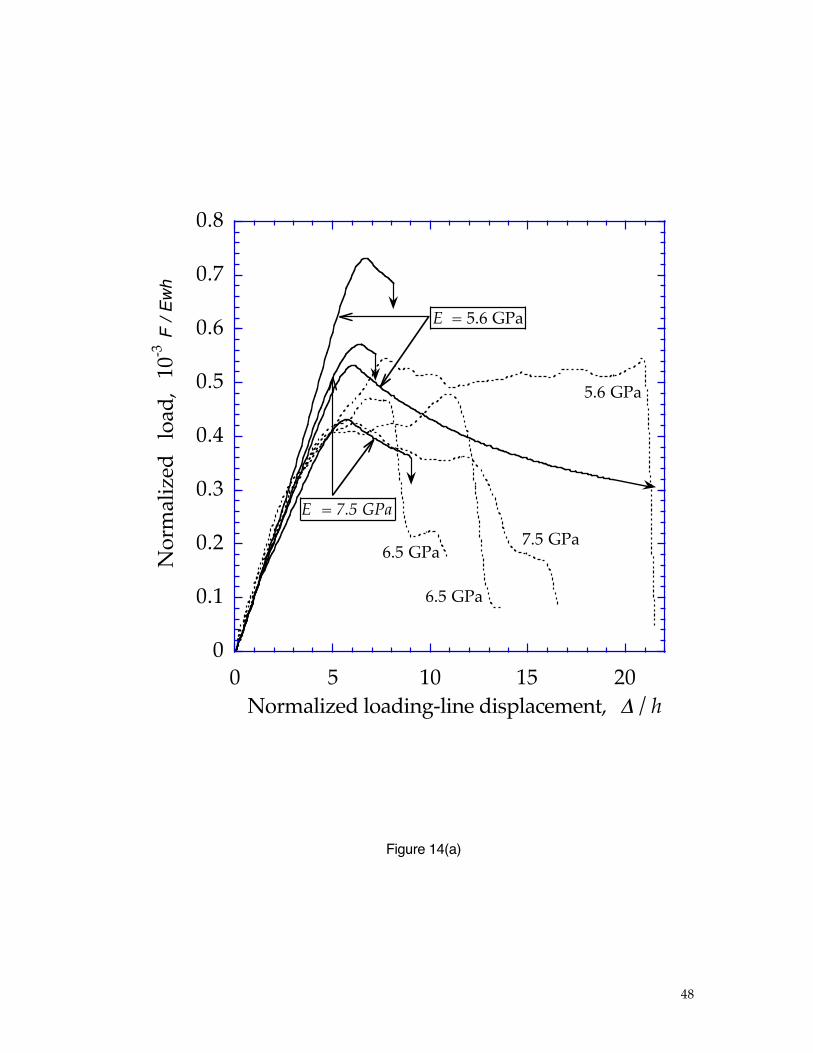
favored interfacial fracture. Comparisons between the predicted load-
displacement curves and experimentally observed curves are shown in Fig. 14(a).
The specimens used for the experimental observations exhibited a wide range of
moduli. Since the predicted results are very sensitive to the modulus, the
numerical results shown in this plot have been selected to illustrate the effects of
both modulus and cohesive parameters. Although the numerical predictions
suggest that stable interfacial fracture might be observed occasionally for this
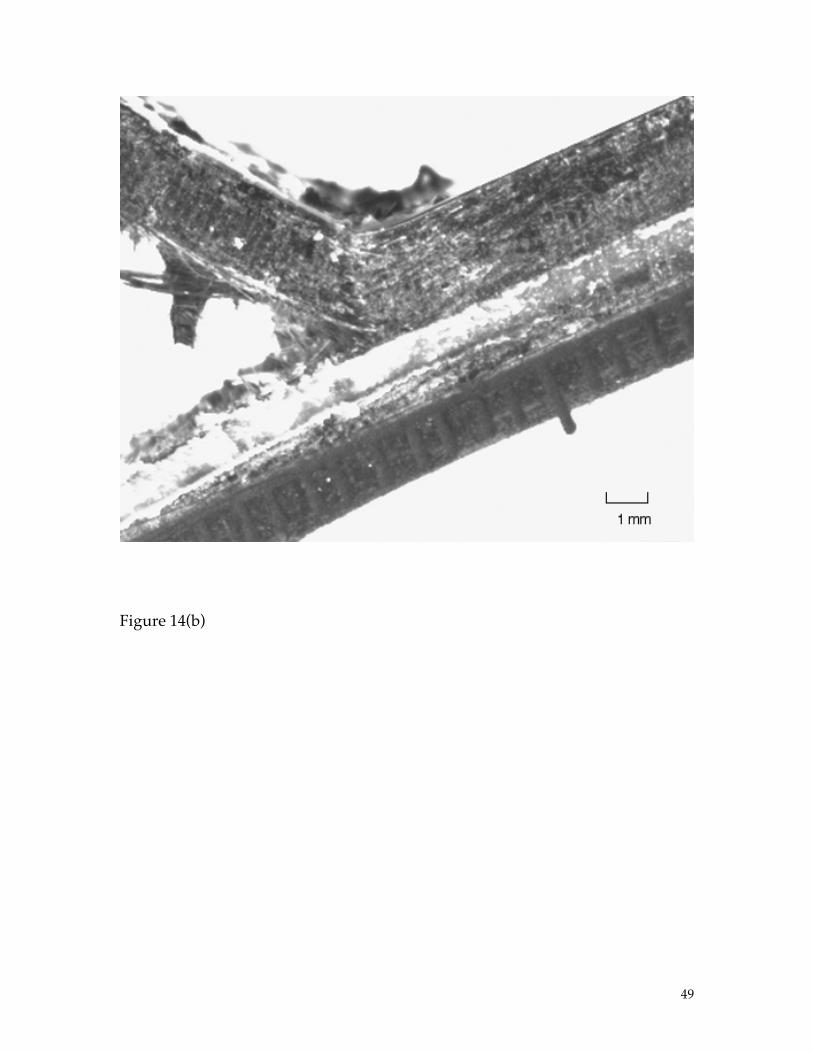
geometry, it was not actually seen experimentally. All the samples exhibited
catastrophic failure of the composite (Fig. 14b).
The micrographs of Figs. 13(c) and 14(b) indicate a clear asymmetry in the
fracture. One arm breaks catastrophically, the other does not. The numerical
predictions of Figs. 13(a) and 14(a) were done assuming perfect symmetry for the
properties and geometry of both arms. Therefore, symmetrical failure in both
arms evolved from the calculations. The asymmetry in failure that was observed
could arise from variations in the fracture properties of the two arms. However,
it could also arise from asymmetrical loading. As can be seen from Fig. 5(a) there
was some misalignment of the steel tabs during the fabrication of the specimens,
and hence the load was not always applied symmetrically. The effect of this
19
misalignment was explored numerically.7 It did not significantly affect the
predicted behavior of the 7.6 mm thick specimens which always failed by
interfacial failure, even with significant asymmetry in the loading However, it
did have an influence on the fracture of the 2.8 mm specimens. Not only did
asymmetry of loading cause one composite arm to fail before the other, even
when the cohesive properties of both arms were identical, but the asymmetry
could trigger a transition from interfacial failure to composite fracture. This is
illustrated in Fig. 15, where a transition to composite fracture occurred solely as
the result of introducing asymmetrical loading. This effect of asymmetry is
believed to be responsible for the fact that no pure interfacial fracture was seen
experimentally with the 2.8 mm thick specimens.
4.2 Comments on the failure transition
The results of the previous section show the conditions for a transition in
failure mechanism between interfacial fracture and adherend fracture in a
nominally mode-I geometry. Interfacial fracture is stabilized by a “weak”
interface, a “strong” adherend, a “low” modulus of the arms, and “thick” arms.
While it is well-documented that the plane of symmetry in a mode-I geometry
may not be a stable trajectory if there is a tensile “T-stress” parallel to the crack
plane [Cotterell, 1965; Cotterell and Rice 1980; Fleck et al., 1991, Akisanya and
Fleck, 1992], predictions for a transition in the failure mode cannot be addressed
by conventional fracture mechanics when only energy is used as a failure
criterion. Furthermore, a ratio in the range of five to eight between the
7 Technically this misalignment introduces some mode-II effects. However, on-going mixed-mode investigations confirm previous results (Yang and Thouless, 2001) that fracture of this type of mixed-mode geometry is not very sensitive to the values of the mode-II parameters.

20
toughness of the two competing fracture paths would normally preclude such a
transition with an energy-based criterion. However, the addition of the strength
criterion that is associated with cohesive-zone models introduces a length scale
that immediately allows scale-dependent failure transitions of the type discussed
in the previous section to exist.
A simple analytical calculation for a symmetrical double-cantilever beam
illustrates the effect of introducing a strength criterion to fracture models. If
L.E.F.M. conditions are assumed to be valid, then the energy-release rate for a
D.C.B. loaded by a pure moment M would be given by:
G = 12M2 / Eh3 (2)
where E is the modulus of the composite and h is the thickness of the arms. An
estimate for the maximum bending stress in the arms is given by
!
"max = 6M/h2 (3)
If the fracture strength of the composite is
!
ˆ " m
, and the toughness of the interface
is ΓΙi, the arms of the specimen will fracture before the interface if
h
!
ˆ " m
2 / EΓΙi < 3 (4)
Substituting appropriate values for the composite and interface (E = 6.0 GPa,
ΓΙi = 5.0 kJ/m2,
!
ˆ " m
= 100 MPa), an estimate for the critical thickness, hc, is obtained
as approximately 9 mm. While this value is much larger than that obtained from
the cohesive-zone models, this simple analysis does reveal the underlying
physics of the problem, and Eqn. 4 shows similar effects of the different
parameters on the failure mode as do the results of the cohesive-zone models.
In particular, adherend failure is more likely with “thin” arms, a “weak” and
“stiff” adherend, and a “strong” interface. These are, of course, the same
21
conditions that favor plastic deformation over fracture when ductile adherends
are bonded together (Kim and Kim, 1988; Kim and Aravas, 1988).
5. Conclusions
A three-parameter mode-I cohesive-zone model has been developed for
the adhesive bond between two adherends made of a polymer-matrix composite.
The values for these parameters were found by comparing numerical predictions
to experimental observations. Generally, only two cohesive parameters, a
toughness and a characteristic strength associated with the dominant toughening
portion of the cohesive law, are sufficient for failure analysis. However, if the
cohesive zone has a cohesive strength that is independent of and significantly
larger than the characteristic (or average) strength associated with the dominant
toughening mechanism at the crack tip, then a two-parameter model will give
erroneous predictions of strength when the characteristic dimensions of the
geometry are very small. In other words, additional information about the shape
of the traction-separation law may be required under these conditions. In
particular, it is noted that simple tensile tests with small ligament lengths (or
small crack lengths) conducted to determine the strength of an interface may not
necessarily result in the appropriate characteristic strength required to model
crack propagation. Similarly, with this type of cohesive law, two-parameter
models deduced from cracking experiments may not predict the strengths of
bonded structures correctly when the characteristic dimensions (such as flaw or
ligament lengths) are too small. The adhesive interface examined in this paper
provided an example of this effect.
22
In the system studied in this paper, it was observed that failure could
occur either along the interface or by catastrophic failure of the arms, despite the
geometry being maintained as a nominally mode-I geometry, and despite the
large difference in steady-state toughness between the arms and the interface.
Interfacial fracture was stabilized when the interface was relatively weak, the
composite was relatively strong, and the arms were thick and had a low
modulus. This transition cannot be explained by a fracture-mechanics approach
to crack propagation that uses only an energy criterion for fracture. However,
the introduction of a characteristic strength into the failure criterion results in a
length scale that determines this transition. In particular, it was shown that by
combining a cohesive-zone model for the interface with a cohesive-zone model
for the composite, the essential features of the transition in failure mechanism
could be predicted within the range of uncertainties established for the cohesive
properties.
Acknowledgements
S. L., M. D. T. and A. M. W. gratefully acknowledge the financial support
of General Motors. All the authors gratefully acknowledge the supply of the
adhesive from Dow Chemical, and the supply of the composite from Azdel, Inc..
23
References
Akisanya, A. R. and N. A. Fleck, “Analysis of a wavy crack in sandwich specimens,” International Journal of Fracture, 55, 29-45 (1992).
Barenblatt, G. I., “The mathematical theory of equilibrium of cracks in brittle fracture,” Advances in Applied Mechanics, 7, 55-129 (1962).
Camacho, G. T. and M. Ortiz, “Computational modeling of impact damage in brittle materials,” International Journal of Solids and Structures, 33, 2899-2938 (1996).
Chen, B., D. A. Dillard, J. G. Dillard and R. L. Clark Jr., “Crack path selection in adhesively-bonded joints: The role of material properties,” Journal of Adhesion, 75, 405-434 (2001).
Chen, B., D. A. Dillard, J. G. Dillard and R. L. Clark Jr., “Crack path selection in adhesively bonded joints: The roles of external loads and specimen geometry,” International Journal of Fracture, 114, 167-190 (2002).
Cotterell, B., “On brittle fracture paths,” International Journal of Fracture, 1, 96-103 (1965).
Cotterell, B., and J. R. Rice, “Slightly curved or kinked cracks,” International Journal of Fracture, 16, 155-169 (1980).
Drory, M. D., Thouless, M. D. and A. G. Evans, “On the decohesion of residually stressed thin films,” Acta Metallurgica, 36(8), 2019-2028 (1988).
Dugdale, D. S., “Yielding of steel sheets containing slits,” Journal of the Mechanics and Physics of Solids, 8, 100-108 (1960).
Fleck, N. A., Z. Suo and J. W. Hutchinson, “Crack path selection in a brittle adhesive layer,” International Journal of Solids and Structures, 27, 1683-1703 (1991).
He, M. Y. and J. W. Hutchinson, “Kinking of a crack out of an interface,” Journal of Applied Mechanics, 56, 270-278 (1989).
Hutchinson, J. W. and Z. Suo, “Mixed-mode cracking in layered materials,” Advances in Applied Mechanics, 29, 64-187 (1992).
24
Kafkalidis, M. S. and M. D. Thouless, “The effects of geometry and material
properties on the fracture of single lap-shear joints,” International Journal of
Solids and Structures, 39, 4367-4383 (2002).
Kim, K. S. and N. Aravas, “Elastoplastic analysis of the peel test,” International Journal of Solids and Structures, 24, 417-435 (1988).
Kim, K. S. and J. Kim, “Elastoplastic analysis of the peel test for thin film adhesion,” Journal of Engineering Materials and Technology, 110, 266-273 (1988).
Li, S., "Fracture analysis of an adhesively-bonded polymer-matrix composite," PhD dissertation, University of Michigan, Ann Arbor, MI (2004).
Li, S., J. Wang and M. D. Thouless, “The effects of shear on delamination in layered materials,” Journal of Mechanics and Physics of Solids, 52, 193-214 (2004a)
Li, S., M. D. Thouless, A. M. Waas, J. A. Schroeder, and P. D. Zavattieri, “Cohesive-zone models for a polymer-matrix composite,” Journal of Composites Science and Technology, in press (2004b).
Li, S., M. D. Thouless, A. M. Waas, J. A. Schroeder, and P. D. Zavattieri, “Mixed-mode cohesive-zone models for fracture of an adhesively-bonded polymer-matrix composite” manuscript in preparation (2004c).
Mohammed, I and K. M. Liechti, “Cohesive zone modeling of crack nucleation at bimaterial corners,” Journal of the Mechanics and Physics of Solids, 48, 735-764 (2000).
Needleman, A. “A Continuum Model for Void Nucleation by Inclusion Debonding,” Journal of Applied Mechanics, 54, 525-531 (1987).
Shahwan, K., and A. M. Waas, “Non-self-similar decohesion along a finite interface of unilaterally constrained delaminations,” Proceedings of the Royal Society, 453A, 515-550, (1997).

25
Song, S. J. and A. M. Waas, " An energy based model for mixed mode failure of laminated composites" AIAA Journal , 33, 739-745 (1995).
Song, S. J. and A. M. Waas, "Modeling crack growth in laminates via a novel strength criterion," ASME Transactions, Journal of Engineering Materials and Technology, 116, 512-516 (1994).
Sørensen, B. F., “Cohesive law and notch sensitivity of adhesive joints,” Acta Materialia, 50, 1053-1061 (2002).
Sørensen, B. F and T. K. Jacobsen, "Determination of cohesive laws by the J-integral approach," Engineering Fracture Mechanics, 70, 1841-1858 (2003).
Swadener, J. G., Liechti, K. M. and Liang Y-M., “Shear induced toughening in bonded joints: experiments and analysis,” International Journal of Fracture, 114, 113-132 (2002).
Tvergaard, V. and J. W. Hutchinson, “The relation between crack growth resistance and fracture parameters in elastic-plastic solids,” Journal of the Mechanics and Physics of Solids, 40, 1377-1397 (1992).
Ungsuwarungsri, T. and W. G. Knauss, “Role of damage-softened material behavior in the fracture of composites and adhesives,” International Journal of Fracture, 35, 221-241 (1987).
Xu, X. P. and A. Needleman, “Numerical simulations of fast crack growth in brittle solids,” Journal of Mechanics and Physics of Solids, 42, 1397-1434 (1994).
Yang, Q. D. and M. D. Thouless, “Mixed-mode fracture analyses of plastically-deforming adhesive joints,” International Journal of Fracture, 110, 175-187 (2001).
Yang, Q. D, M. D. Thouless and S. M. Ward, “Numerical simulations of adhesively bonded beams failing with extensive plastic deformation,” Journal of Mechanics and Physics of Solids, 47, 1337-1353 (1999).
Zavattieri, P. D. and H. D. Espinosa, “Grain lever analysis of crack initiation and propagation in brittle materials,” Acta Materialia, 49, 4291-4311 (2001).

26
Figure captions
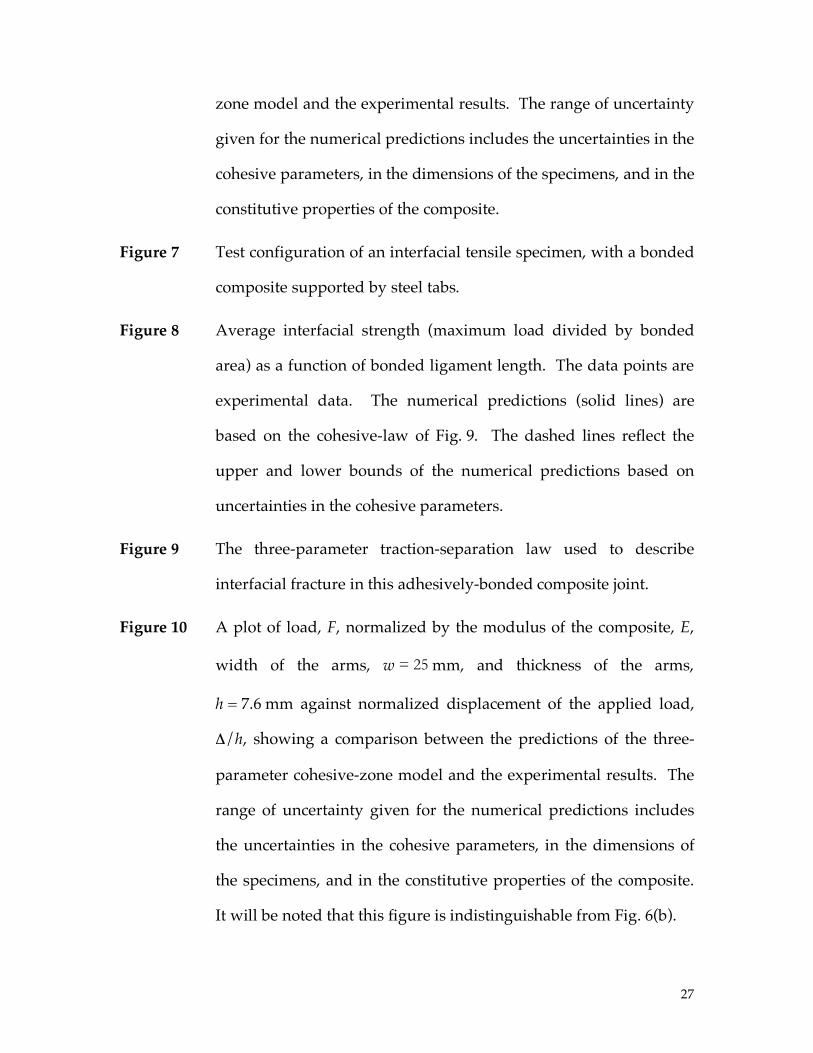
Figure 1 (a) Tensile coupons used to investigate the constitutive properties
of the adhesive. (b) Uniaxial tensile stress-strain curves for the
adhesive obtained at a nominal strain rate of approximately
0.00017 s-1.
Figure 2 Schematic traction-separation law used to describe the mode-I
fracture of the composite (from Li et al. [2004b]).
Figure 3 Geometry and dimensions for the double-cantilever beam
specimens used to investigate the mode-I fracture properties of the
adhesive-composite interface.
Figure 4 Plots of load per unit width versus displacement of the applied load
for the double-cantilever beams with the geometry given in Fig. 3,
and an arm thickness of 7.6 ± 0.2 mm. The initial crack length for
these studies varied between 67 and 75 mm.
Figure 5 Micrographs of the interface and crack-tip region under load: (a) a
large-scale micrograph of the specimen; (b) details of the crack-tip
region. The scale shown in (a) is in centimeters.
Figure 6 (a) Schematic illustration of the triangular traction-separation law
used for the 2-parameter cohesive law. (b) A plot of load, F,
normalized by the modulus of the composite, E, width of the arms,
w = 25 mm, and thickness of the arms, h = 7.6 mm against
normalized displacement of the applied load, Δ/h, showing a
comparison between the predictions of a two-parameter cohesive-
27
zone model and the experimental results. The range of uncertainty
given for the numerical predictions includes the uncertainties in the
cohesive parameters, in the dimensions of the specimens, and in the
constitutive properties of the composite.
Figure 7 Test configuration of an interfacial tensile specimen, with a bonded
composite supported by steel tabs.
Figure 8 Average interfacial strength (maximum load divided by bonded
area) as a function of bonded ligament length. The data points are
experimental data. The numerical predictions (solid lines) are
based on the cohesive-law of Fig. 9. The dashed lines reflect the
upper and lower bounds of the numerical predictions based on
uncertainties in the cohesive parameters.
Figure 9 The three-parameter traction-separation law used to describe
interfacial fracture in this adhesively-bonded composite joint.
Figure 10 A plot of load, F, normalized by the modulus of the composite, E,
width of the arms, w = 25 mm, and thickness of the arms,
h = 7.6 mm against normalized displacement of the applied load,
Δ/h, showing a comparison between the predictions of the three-
parameter cohesive-zone model and the experimental results. The
range of uncertainty given for the numerical predictions includes
the uncertainties in the cohesive parameters, in the dimensions of
the specimens, and in the constitutive properties of the composite.
It will be noted that this figure is indistinguishable from Fig. 6(b).

28
Figure 11 Definitions of the quantities used to determine the evolution of the
cohesive zone in the double-cantilever beam specimens. (a) A
micrograph of the specimen, and (b) a mesh from the numerical
calculations.
Figure 12 Plots of how the distance from the crack mouth at which the crack
opening is equal to 1.2 mm varies with loading-line displacement
for a double-cantilever beam specimen with arms 7.6 mm thick. A
comparison is shown between the experimentally-observed range
and the range predicted from the cohesive-zone model. The range
of uncertainty given for the numerical predictions includes the
uncertainties in the cohesive parameters, the dimensions of the
specimens, and the constitutive properties of the composite.
Figure 13 (a) Comparison between the numerical predictions for the
normalized load-displacement curves and the experimentally
observed curves for specimens with arms 5.0 mm thick, an initial
crack length of 40 ± 1.5 mm, and a modulus of 6.0 ± 0.1 GPa. The
results of the numerical calculations shown are for perfectly
symmetrical loading. The lower curve indicates the results of
assuming the lower bound for the interfacial cohesive parameters
(ΓΙi = 5.5 kJm-2,
!
ˆ " io
= 21 MPa,
!
ˆ " i = 3.5 MPa) and the upper bound
for the composite cohesive parameters (ΓΙc = 44 kJm-2,
!
ˆ " m
=120 MPa,
!
ˆ " b = 88 MPa). The upper curve indicates the results of assuming
the upper bound for the interfacial cohesive parameters (ΓΙi = 9.1
kJm-2,
!
ˆ " io
= 27 MPa,
!
ˆ " i = 6.5 MPa) and the lower bound for the

29
composite cohesive parameters (ΓΙc = 36 kJm-2,
!
ˆ " m
=80 MPa,
!
ˆ " b = 71 MPa). A transition between stable interfacial fracture and
unstable composite fracture is observed between these two limits.
(b) Micrograph of a double-cantilever beam specimen with 5.0 mm
thick arms, showing an interfacial crack that did not result in
failure of the composite.
(c) Micrograph of a double-cantilever beam specimen with 5.0 mm
thick arms, showing failure of the composite.
Figure 14 (a) Comparison between the numerical predictions for the
normalized load-displacement curves (solid lines) and the
experimentally observed curves (dotted lines) for double-cantilever
beam specimens with arms 2.8 mm thick. The modulus
corresponding to each experimental curve is indicated on the plot.
The initial crack lengths were 40 ± 1.5 mm. Two sets of numerical
calculations were performed with the largest and smallest values of
the moduli for this particular set of experimental data (E = 5.6 GPa
and 7.5 GPa). The range of both sets of numerical calculations
illustrate the full effects of the uncertainties in the cohesive-zone
parameters for both the interface and the adherend, but assuming
perfectly symmetrical loading.
(b) Micrograph of a double-cantilever beam specimen with arms
2.8 mm thick, showing failure of the composite.

30
Figure 15 Comparison between the numerically-predicted load-displacement
curves for symmetrical loading and asymmetrical loading. Both
calculations are performed with a composite modulus of 5.6 GPa, a
composite toughness of ΓΙc = 44 kJm-2, a matrix strength of
!
ˆ " m
=120 MPa, a fiber-bridging strength of
!
ˆ " b = 88 MPa, an
interfacial toughness of ΓΙi = 5.5 kJm-2, an interfacial cohesive
strength of
!
ˆ " io
= 21 MPa, and an interfacial characteristic strength of
!
ˆ " i = 3.5 MPa. The loading line was perfectly aligned for the
symmetrical loading, aligned, but there was an offset of 5.8 mm in
the loading for the asymmetrical case. The initial crack length for
both calculations was 40 mm, and the arms were 2.8 mm thick.
31
75 mm
6 mm
Figure 1(a)
32
0
5
10
15
20
25
30
0 0.005 0.01 0.015 0.02 0.025
Axial strain
Ax
ial
stre
ss (
MP
a)
Figure 1(b)
33
0
20
40
60
80
100
120
0 0.2 0.4 0.6 0.8 1
Str
ess
(MP
a)
Displacement (mm)
0
20
40
60
80
100
120
0 0.01 0.02S
tre
ss (
MP
a)
10-4 mm
10-2 mm
Displacement (mm)
!Ic
= 40 kJm-2
"m
= 100 MPa^
"b = 79 MPa^
Figure 2
34
h
a0
25 ± 0.5 mm
160 ± 2 mm
0.7 ± 0.1 mm
Composite
Steel tab
Adhesive
10 ± 0.5 mm
28 ± 1 mm
Figure 3
35
0
5
10
15
20
0 10 20 30 40 50
Lo
ad p
er u
nit
wid
th (
N/
mm
)
Loading-line displacement (mm)
Figure 4

36
Figure 5(a)
Figure 5(b)

37
Stress
Displacement
! = 0.01!c
"̂
!c
Figure 6(a)
i
#I i

38
0
0.1
0.2
0.3
0.4
0.5
0.6
0 1 2 3 4 5 6
Normalized loading-line displacement,
No
rmal
ized
lo
ad,
! / h
F /
Ew
h10
-3
Figure 6(b)
39
40
41
0
5
10
15
20
25
0 1 2 3
Str
ess
(MP
a)
Displacement (mm)
0
5
10
15
20
25
0 0.01 0.02 0.03 0.04 0.05S
tres
s (M
Pa)
Displacement (mm)
!io
= 24 MPa^
!i = 5 MPa^
Figure 9
"Ii = 7.3 kJm-2

42
0
0.1
0.2
0.3
0.4
0.5
0.6
0 1 2 3 4 5 6
Normalized loading-line displacement,
No
rmal
ized
lo
ad,
! / h
Figure 10
F /
Ew
h10
-3

43
44
45
46
0
0.1
0.2
0.3
0.4
0.5
0.6
0.7
0.8
0 1 2 3 4 5 6 7 8
Normalized loading-line displacement, ! / h
"weak" interface"strong" composite
"strong" interface"weak" composite
Figure 13 (a)
No
rmal
ized
lo
ad,
F /
Ew
h10
-3
47
Figure 13(b)
Figure 13(c)
48
0
0.1
0.2
0.3
0.4
0.5
0.6
0.7
0.8
0 5 10 15 20
Normalized loading-line displacement, ! / h
= 5.6 GPaE
6.5 GPa
= 7.5 GPaE
6.5 GPa
7.5 GPa
5.6 GPa
Figure 14(a)
No
rmal
ized
lo
ad,
F /
Ew
h10
-3
49
Figure 14(b)

50
0
0.1
0.2
0.3
0.4
0.5
0.6
0.7
0.8
0 5 10 15 20
Normalized loading-line displacement, ! / h
symmetrical loading
asymmetrical loading
Figure 15
No
rmal
ized
lo
ad,
F /
Ew
h10
-3