Use of ions for the radiotherapeutic treatment of tumours · Use of ions for the radiotherapeutic...
56
What is the hadron-therapy? Use of ions for the radiotherapeutic treatment of tumours 0 20 40 60 80 100 120 0 5 10 15 20 25 30 depth cm of water % dose response 8 MV X-rays 200 MeV protons 20 MeV electrons cobalt 60
Transcript of Use of ions for the radiotherapeutic treatment of tumours · Use of ions for the radiotherapeutic...

What is the hadron-therapy?
Use of ions for the radiotherapeutictreatment of tumours
0
20
40
60
80
100
120
0 5 10 15 20 25 30depth cm of water
% d
ose
resp
onse
8 MV X-rays200 MeV protons20 MeV electronscobalt 60

So we can answare to the question:Why clinical proton beams?
• penetration depth is well-defined and adjustable
• most energy at end-of -range
• protons travel in straight lines
• dose to normal tissue minimised
• no dose beyond target
PROTONS PERMIT TO DELIVER AN HIGH DOSE TOTHE TUMOUR SPARING THE SOURRONDING TISSUES

In Catania we developed a facility
CATANAfor the treatment of ocular tumours with proton beams of 62
AMeV
The Laboratori Nazionali del Sud
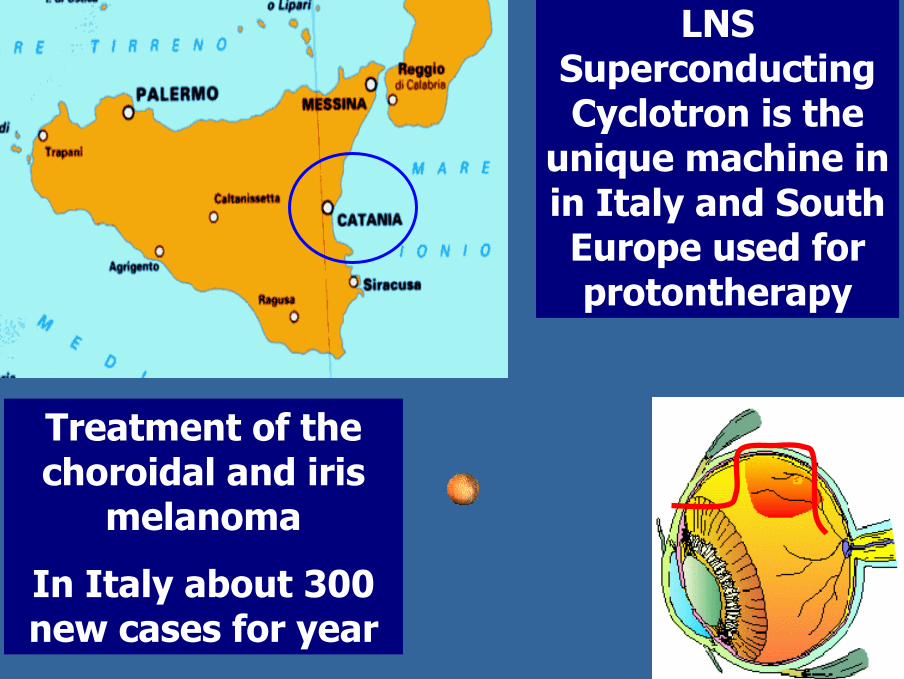
LNS Superconducting Cyclotron is the
unique machine in in Italy and South Europe used for protontherapy
Treatment of the choroidal and iris
melanoma
In Italy about 300 new cases for year

CyclotronLocation
Treatment Room
Location
Laboratori Nazionali del Sud –INFN Catania, Italy
Proton Beam

•0 ° respect the switching magnet
•80 meter after extraction
•3 m proton beam line
LAYOUT OF LNSPRESENT TREATMENT ROOM
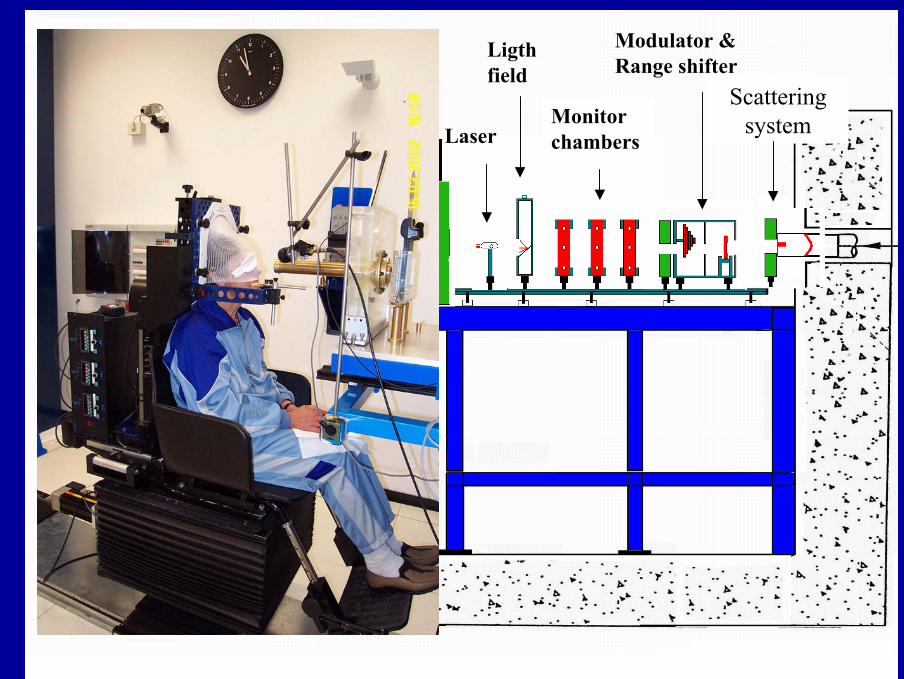
Scattering system
Modulator &Range shifter
Monitorchambers
Ligth field
Laser
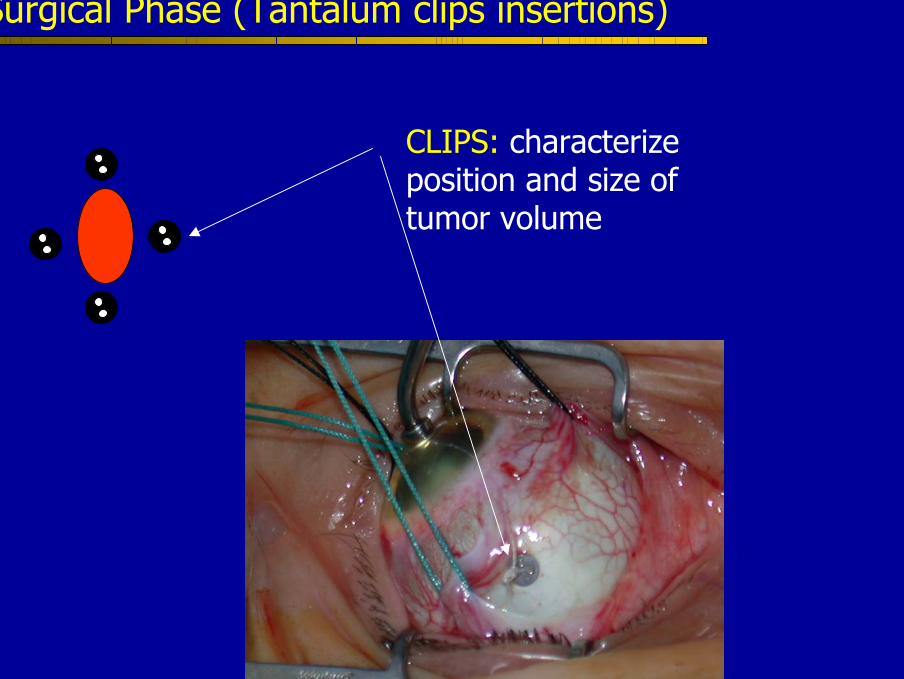
CLIPS: characterizeposition and size of tumor volume
Surgical Phase (Tantalum clips insertions)

EYEPLANEYEPLAN
In origin developed by Michael Goiten e Tom Miller ( Massachussetts General
Hospital) e ora mainteined by Martin Sheen(Clatterbridge Center for Oncology) e Charle
Perrett (PSI)
Treatment Planning System

Isodoses curves for different planes
Treatment Planning System Output

Patiens look at the fixation light during the treatment
PROTON BEAM

20
6
5
5
5
4
2
2
1
1
1
N.B Total number of patients : 66
Patient Distribution by Origin Region
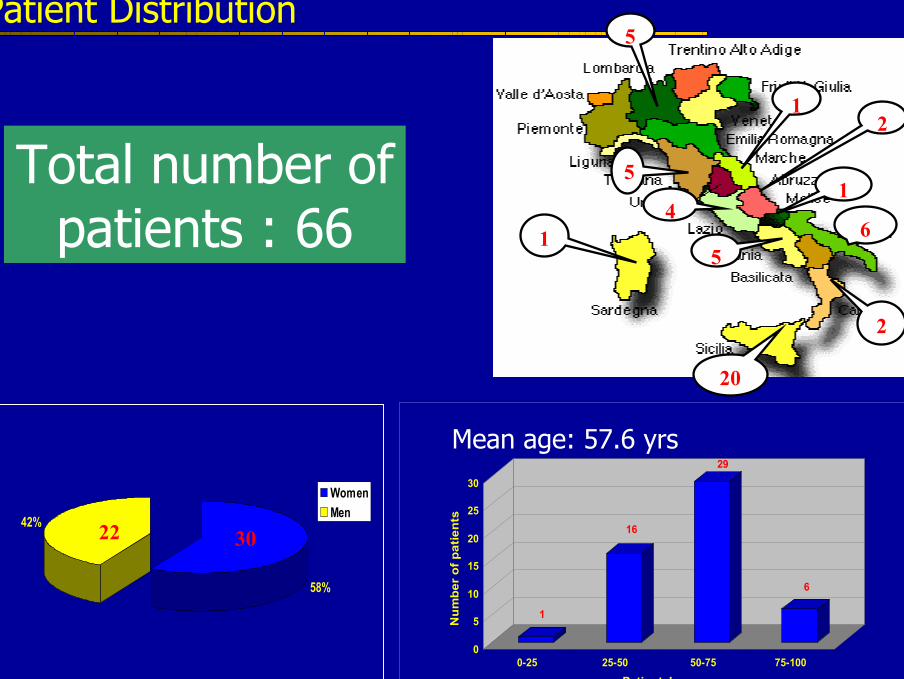
58%
42%
WomenMen
22 30
Patient Distribution
1
16
29
6
0
5
10
15
20
25
30
Num
ber
of p
atie
nts
0-25 25-50 50-75 75-100
Patients' age
20
6
5
5
5
4
2
2
1
1
1
Total number ofpatients : 66
Mean age: 57.6 yrs
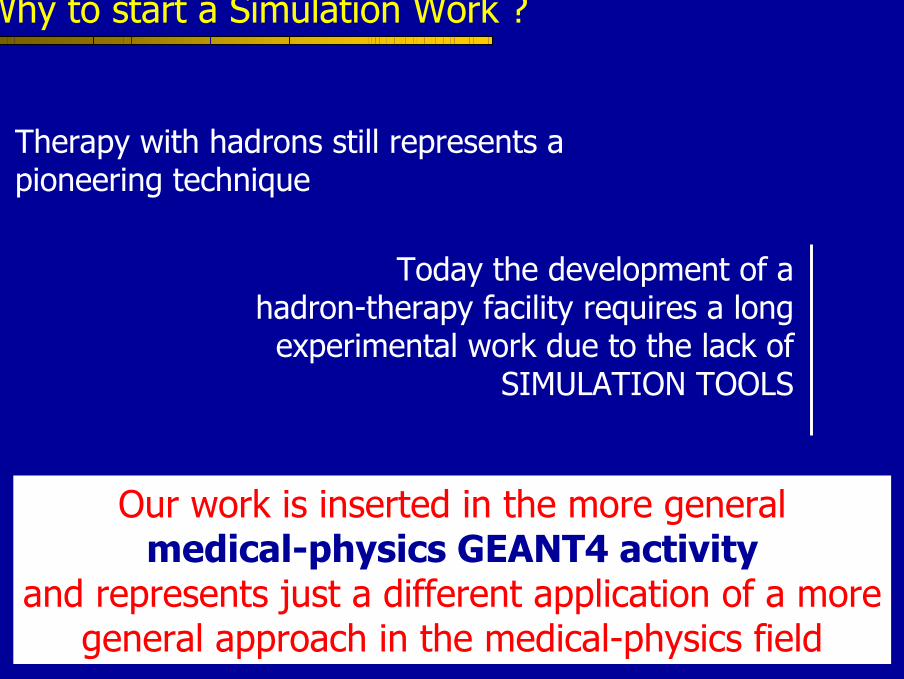
Why to start a Simulation Work ?
Therapy with hadrons still represents a pioneering technique
Today the development of ahadron-therapy facility requires a long
experimental work due to the lack of SIMULATION TOOLS
Our work is inserted in the more general medical-physics GEANT4 activity
and represents just a different application of a more general approach in the medical-physics field

Why to start a Simulation Work ?
This work concerns mainly:
Design and optimization of thetansport beam line elements:
Test of the elements
Test of the detectorsReconstruction of the dosedistributions:
To measure dose distribution also in difficult experimental region
To verify the radiotherapytreatment planning systems
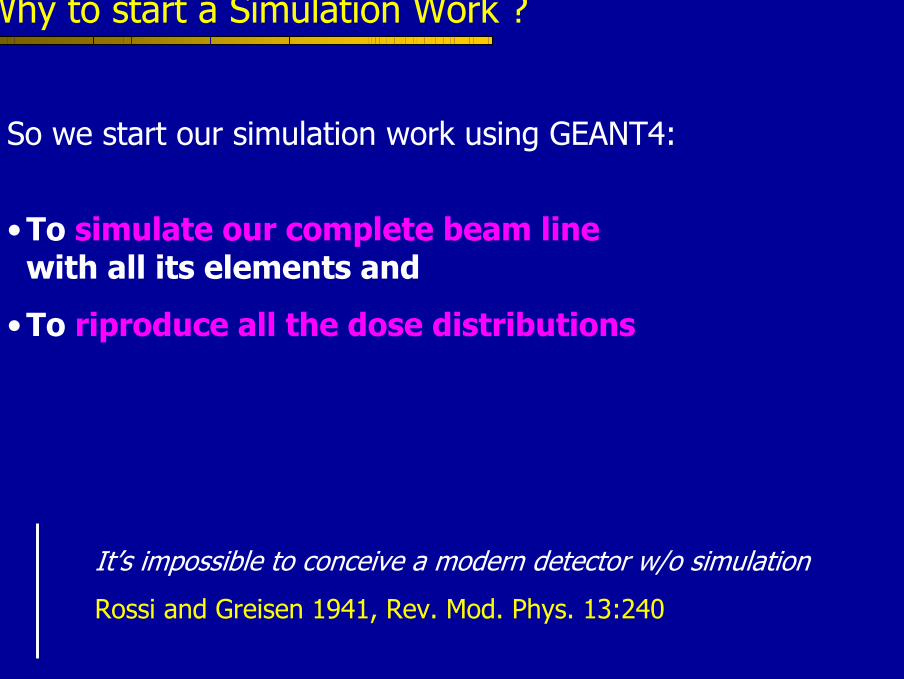
So we start our simulation work using GEANT4:
•To simulate our complete beam linewith all its elements and
•To riproduce all the dose distributions
It’s impossible to conceive a modern detector w/o simulation
Rossi and Greisen 1941, Rev. Mod. Phys. 13:240
Why to start a Simulation Work ?

Our GEANT4 Application:
hadronTherapy.cc
Complete simulation of CATANAhadron-therapy beam line with two dosemeters
• Depth Dose Distribution in Water ( Bragg curve ):Markus type ionization chamber;
• Lateral Dose Distribution:Radiochromic film;

Materialand
Methods

DETECTORS USED FOR DOSE DISTRIBUTION MEASUREMENTS
DEPTH DOSE DISTRIBUTION
•Markus Ionization chamber
2 mm
Sensible Volume = 0.05 cm3
LATERAL DOSE DISTRIBUTION
•GAF Chromic Film
Resolution 100 µm for DDP and 200 µm for LDP
Markus Chamber layout Irradiated GAF Chromic

Camera a ionizzazione TLD Gaf
Diodi Diamanti MOSFET Scintillatore + CCD
TIPICI RIVELATORI PER LA RICOSTRUZIONE DELLE CURVE DI DOSE
0
10
20
30
40
50
60
70
80
90
100
0 5 10 15 20 25 30 35
Depth in water (mm)
Rel
ativ
e Io
nizz
atio
n (%
)
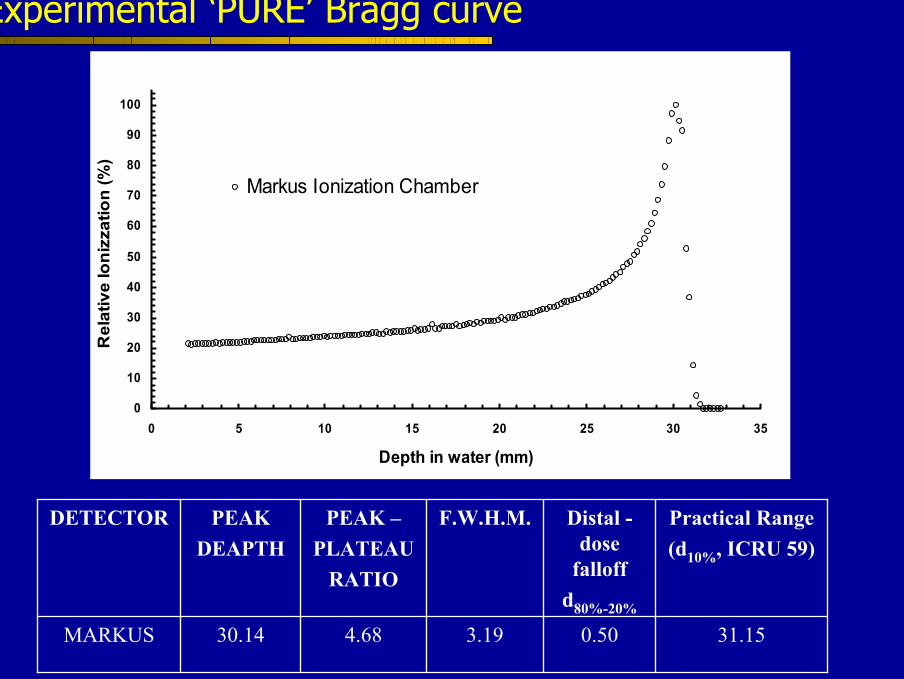
Markus Ionization Chamber
Experimental ‘PURE’ Bragg curve
31.150.503.194.6830.14MARKUS
Practical Range(d10%, ICRU 59)
Distal -dose
falloffd80%-20%
F.W.H.M.PEAK –PLATEAU
RATIO
PEAK DEAPTH
DETECTOR

0
20
40
60
80
100
120
0 10 20 30 40Depth in water (mm)
Rel
ativ
e D
ose
(%)
95%
R90%
80%
20%
Experimental ‘modulated’ Bragg curve
Modulated region

Experimental Lateral Dose Distribution
R 90%-50% Ps [mm]
Pd [mm]
Simmetry [%]
Homogeneity at 95% level
[mm] LNS 0.92 0.8 1 2.4 21 CCO 0.93 0.75 0.75 2.6 23
0
20
40
60
80
100
-20 -15 -10 -5 0 5 10 15 20
Distance from axis [ mm ]
Sig
nal [
% ]
Radiochromic Film

Detector is simulated with20 K air cylindrical slices, 200 µm thick to reproduce experimental Markus chamber responce
Energy deposited ineach slice is collected
We calculated range values for the detectorsimulation validation from Bragg curve
Bragg Curve Reconstruction
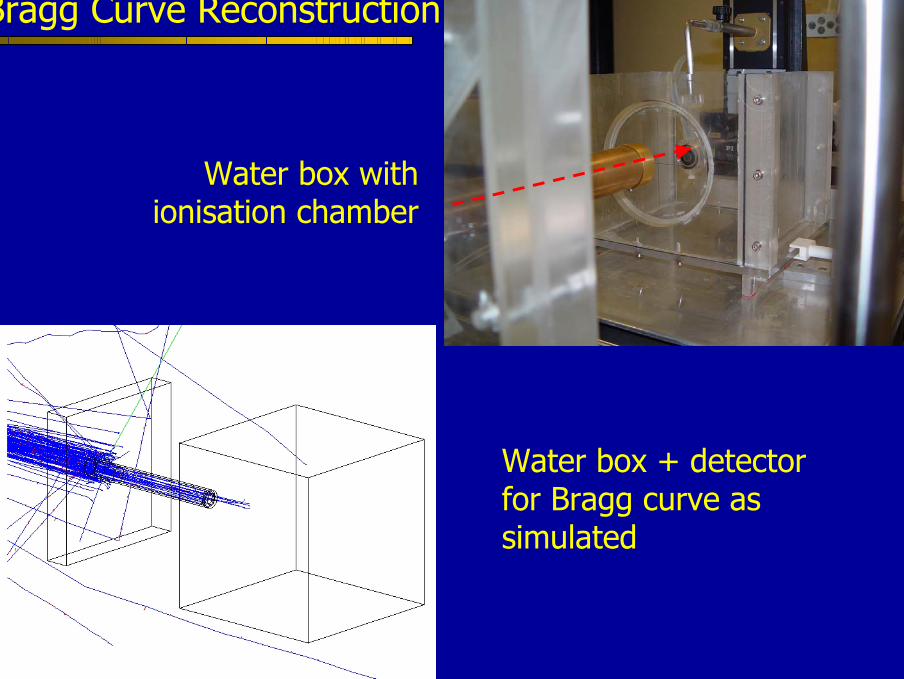
Water box with ionisation chamber
Water box + detector for Bragg curve as simulated
Bragg Curve Reconstruction
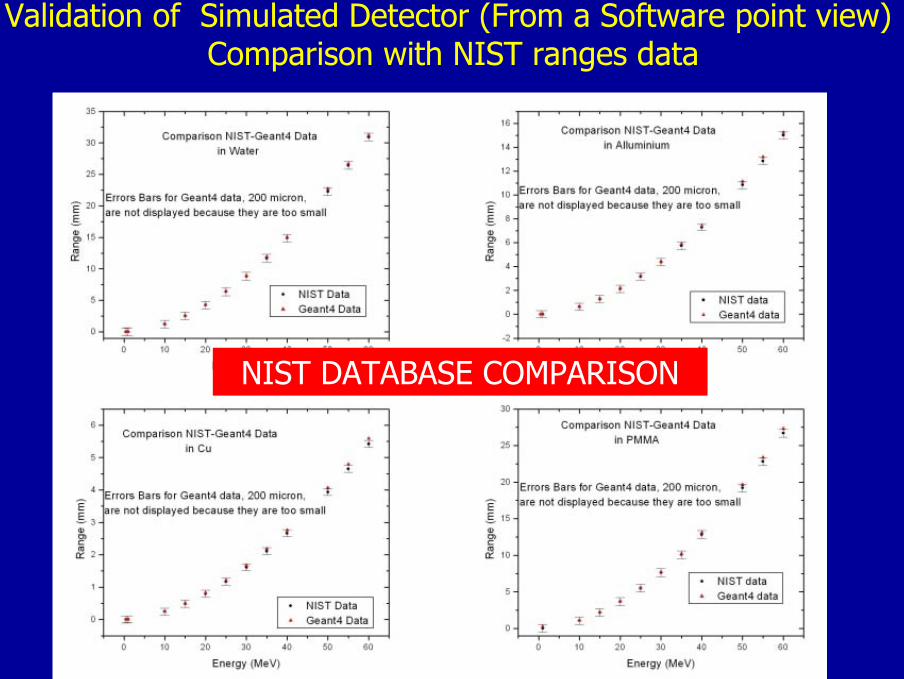
Validation of Simulated Detector (From a Software point view)Comparison with NIST ranges data
NIST DATABASE COMPARISON

Beam Line Simulation: Scattering system
Permits to obtain an homogeneus lateraldose distribution at isocenter
DOUBLE SCATTERER FOIL WITH CENTRAL STOPPER15 µm + 25 µm + 7 mm thick copper beam stopper

Real hadron-therapy beam line
GEANT4 simulation
Each element of the line can be modified (in shape, material and position) and other kinds of dosemeters can be easily
inserted
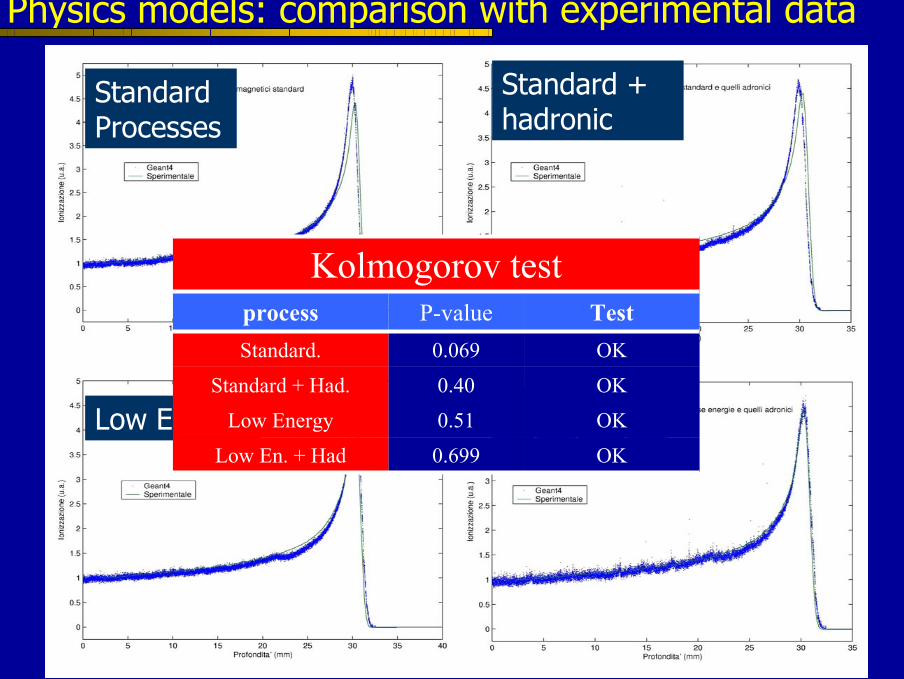
Physics models: comparison with experimental data
Standard Processes
Standard + hadronic
Low Energy Low Energy+ hadronicOK0.699Low En. + Had
OK0.51Low Energy
TestP-valueprocess
OK0.40Standard + Had.
OK0.069Standard.
Kolmogorov test

Physics models: hadronic models
Validity range up to 6.8 MeV for protons and for any target matherial (Z>5)
G4LFissionFission
classprocess
G4HadronElasticProcessElastic Nucl. Scatt.
G4HEProtonInelasticInel. Nucl. Scatt..
Hadronic processes
The best hadronic model we find in our investigation is the precompound(Theory Driven Model of GEANT4)
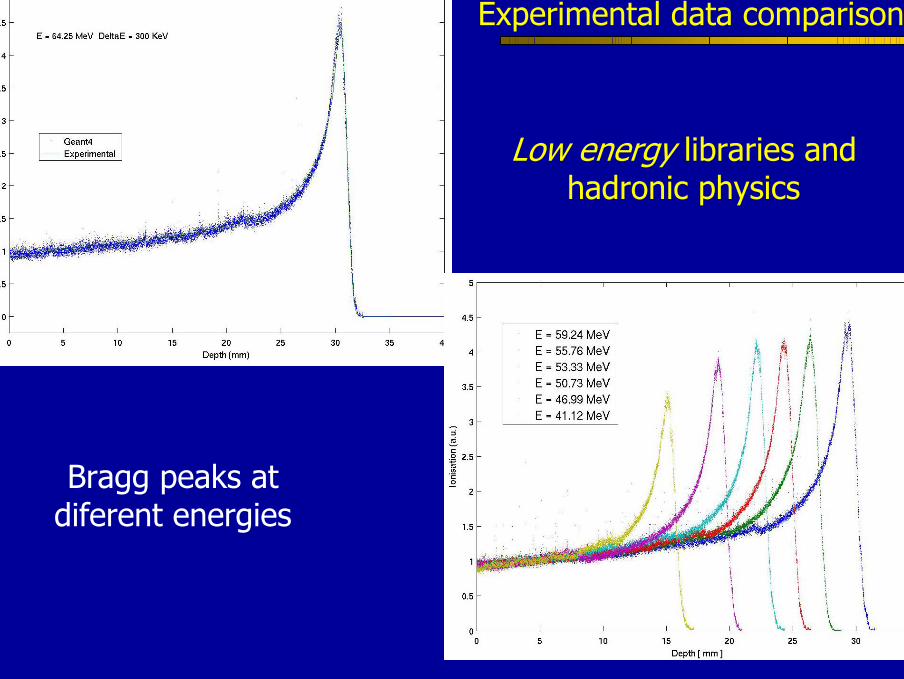
Low energy libraries and hadronic physics
Experimental data comparison
Bragg peaks at diferent energies

Simulated and experimental range in water and copper
Acqua
Rame
Experimental Data Comparison
testP-valuemateriale
Accettato0.999Rame
Accettato0.9876Acqua
Kolmogorov test
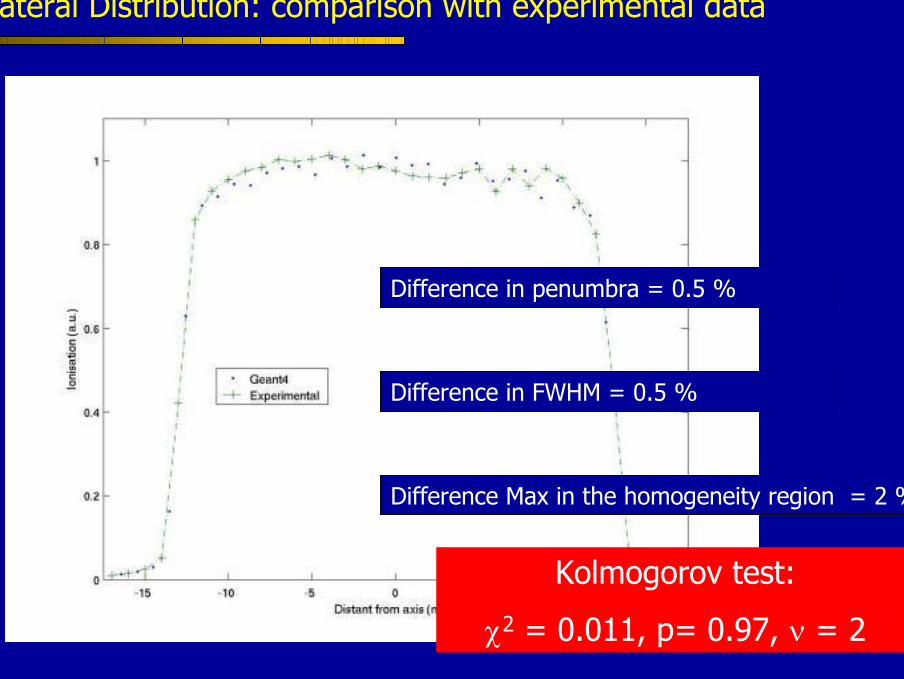
Difference in penumbra = 0.5 %
Difference in FWHM = 0.5 %
Difference Max in the homogeneity region = 2 %
Lateral Distribution: comparison with experimental data
Kolmogorov test:
χ2 = 0.011, p= 0.97, ν = 2

Monte Carlo eamples to study and improve the
transport beam line

Lateral distribution in the phase space distribution
H.Paganetti, Monte Carlo method to study the proton fluence for treatment planningMed. Phys. 25, 1998
Study of the influence of the beam transport elements in the dose distribution at isocenter
PHASE SPACE DISTRIBUTION: position of each particle is reporten versus the cosine directon value considering a plan transversal to the beam direction
x
zk
α
β
γ
x
y
z A = cos(α)B = cos(β)C = cos(γ)
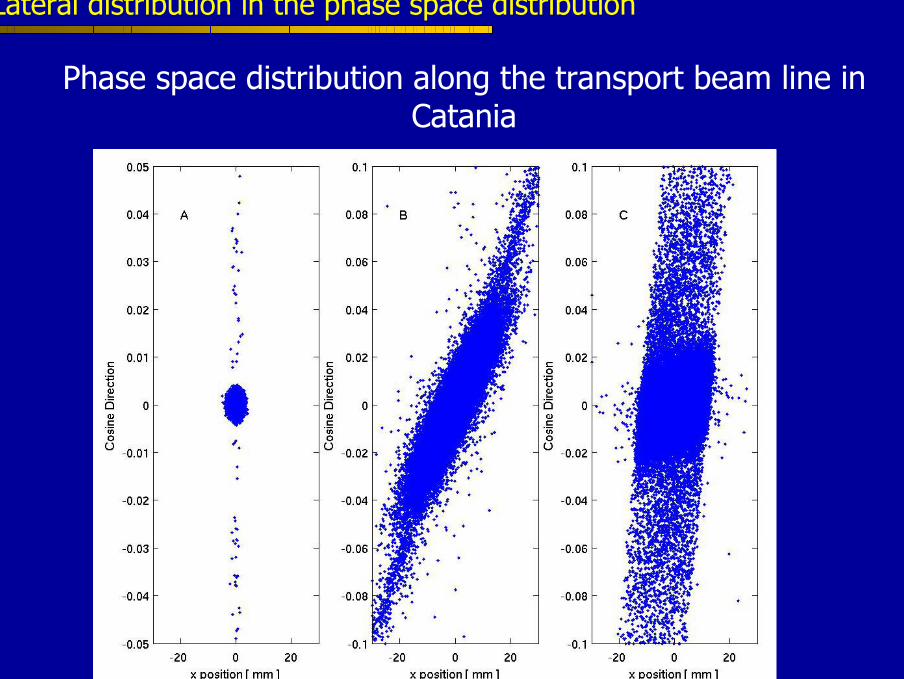
Phase space distribution along the transport beam line in Catania
Lateral distribution in the phase space distribution
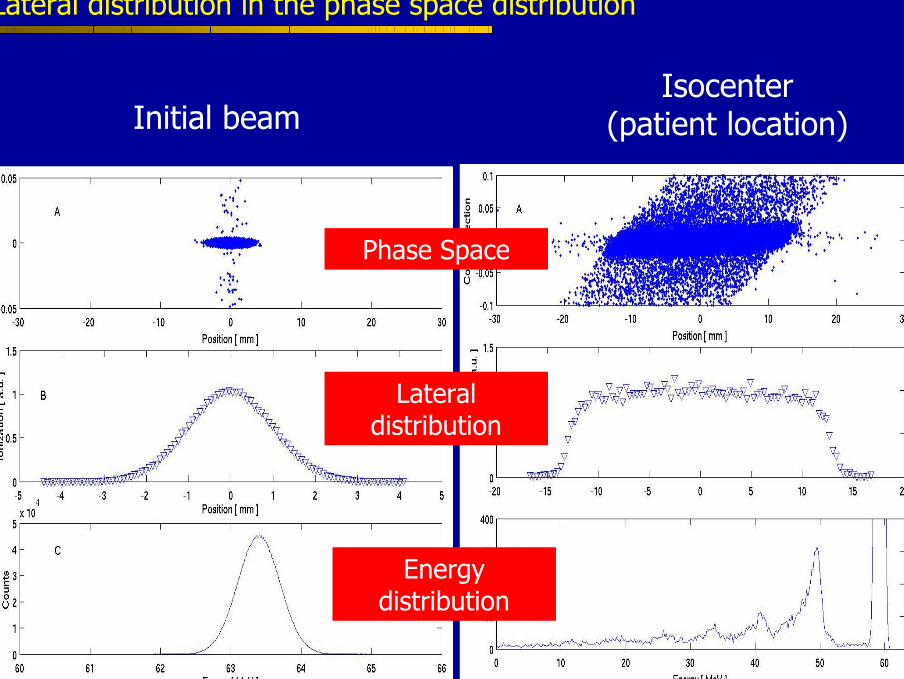
Phase Space
Lateral distribution
Energy distribution
Isocenter (patient location)Initial beam
Lateral distribution in the phase space distribution

A variation of a beam element along beam linecan be studied with Monte Carlo studing phase space
distributions: conventional dosemeter cannot be so sensible
0.16°/cm 0.24°/cm
Lateral distribution in the phase space distribution

For our proton beam line penumbra increases up to 34%
Energy sigma encreases up to 83%
Dose distributions inside patients

Work in progress
Modulator simulation for the SOBP reconstruction
0
10
20
30
40
50
60
70
80
90
100
110
0 5 10 15 20 25 30 35
Depth in water [mm]
Nor
mal
ized
Dep
th D
ose
Dis
trib
utio
n
tumour
Geant4 Modulator we simulated next weex

Work in progress
Monte Carlo in the clinical practice can be limited by the long calculation times
On the other hand velocity is mandatory for a medicalphysicis and a medical doctor when they are to plan a
treatment
GRID technologies could represent a solution see the talk of Giorgio Russo

DICOM images insertion
More realisti dose ditributions
Statistical comparison between analitical based treatment planning systems
Feature Developments
ClatterbridgeChester
Liverpool
Douglas Cyclotron UnitClatterbridge Centre of Oncology
We decided to start this work with the Clatterbridge center for oncology where the
EYEPLAN TPS system was developedand now mantained
We are studying different Hadronicmodels and the nuclear components to the released dose for proton and carbon
Low Energy range measurements (5 MeV– 100 KeV)
Feature Developments
In the next week we’ll compare a bragg peak for a 62 MeV Carbon beam with GEANT4 simulation

The sycilian Center for Hadron Therapy
250 MeV for protons, 1500 MeV for Litium and 3000 MeV for Carbon Ions
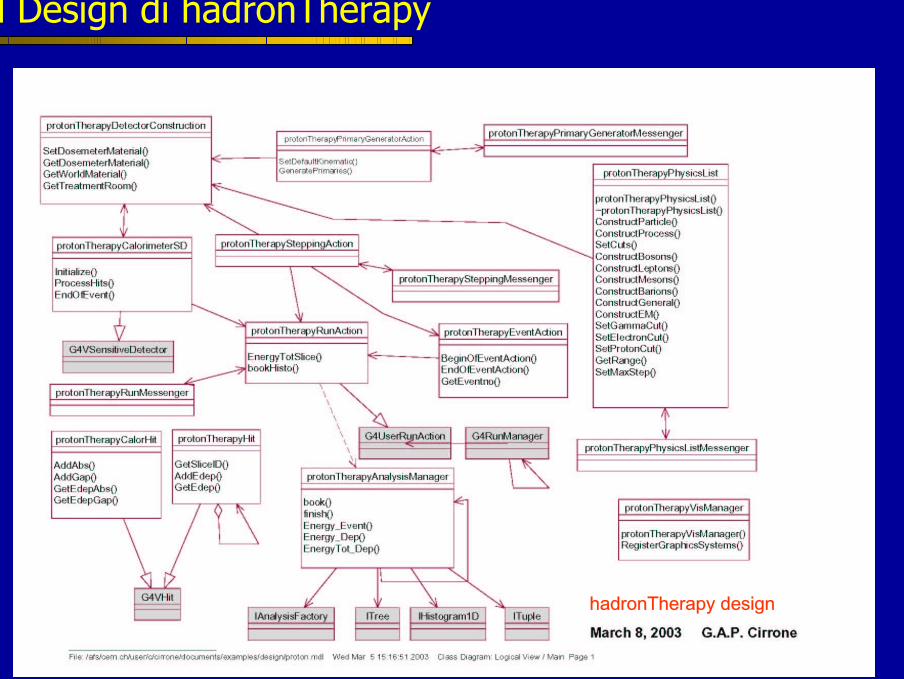
Il Design di hadronTherapy
hadronTherapy design
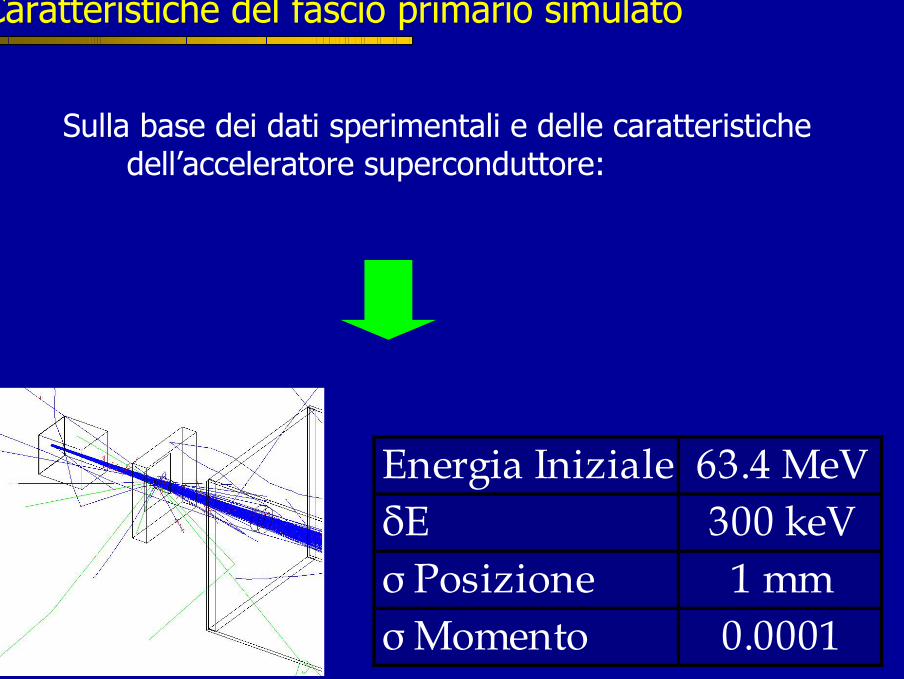
Sulla base dei dati sperimentali e delle caratteristiche dell’acceleratore superconduttore:
Energia Iniziale 63.4 MeVδE 300 keVσ Posizione 1 mmσ Momento 0.0001
Caratteristiche del fascio primario simulato

Sulla base delle curve di Bragg sperimentali abbiamo definito le caratteristiche iniziali del
fascio di protoni
•Energia
•Spread in energia
•Distribuzione spaziale
•Distribuzione dei momenti
Caratteristiche del fascio primario simulato

“Fotografia” del fascio all’isocentro

Perche iniziare un lavoro di simulazione Monte Carlo ?
La terapia con adroni è considerata ancora oggi una tecnica pionieristica
Numerosi centri in Europa si svilupperanno nei prossimi anni:
•RPTC, Munich Germania
•PSI, Villigen Svizzera
•Trento, Italia
•TERA, Italia
•Heidelberg/GSI, Darmstadt Germania
•Centro di Adroterapia, Catania Italia
Perchè GEANT4 in applicazioni mediche
• Codice Trasparente (open source)• Librerie specifiche per i processi fisici alle basse
energie e per i processi adronici• Tecnologia Object Oriented• Numerose validazioni del software• Supporto On-Line• Interfaccie User Friendly• Interattività

Validazione sui dati sperimentali: matrice degli indici γ
γ > 1
Distribuzione delle iso-gamma nelle regioni per le quali il test fallisce

Validazione del programma sviluppato
0
10
20
30
40
50
60
70
80
90
100
0 5 10 15 20 25 30 35
Profondità in acqua (mm)
Ioni
zzaz
ione
Rel
ativ
a (%
)
Rapporto Picco Plateau
Range Pratico
0
20
40
60
80
100
-20 -15 -10 -5 0 5 10 15 20
Distanza dall'asse [ mm ]
Seg
nal
e [
% ]
FWHM
R90/50Confronto dei parametri di interesse medico con i
dati sperimentali.
Curva di Bragg
Distribuzione spaziale del fascio di protoni
Range Pratico Rapporto picco-plateau
Penombra LateraleFWHMR90/50
Penombralaterale

0
10
20
30
40
50
60
70
80
90
100
0 5 10 15 20 25 30 35
Depth in water (mm)
Rel
ativ
e Io
nizz
atio
n (%
)
Markus Ionization Chamber
Dati sperimentali: distribuzioni di dose in profondità
0
20
40
60
80
100
120
0 10 20 30 40Depth in water (mm)
Rel
ativ
e D
ose
(%)
95%
R90%
80%
20%

1. Primo diffusore2. Secondo diffusore,
stopper di ottone3. Camera con il
modulatore4. Collimatore5. Camere Monitor6. Collimatore finale e
del paziente7. Cubo contenente il
rivelatore sensibile
Sistema di diffusione
Elementi tipici di una linea di protonterapia

Maggiore trasparenza rispetto agli altri codici nei processi fisici implementati
NIST
Ziegler
Processi fisici implementatiIn hadronTherapy
ElettromagneticiAdronici
Librerie Standard
Librerie LowEnergy
100 GeV – 250 eV per fotoni ed elettroni100 GeV – 1 keV per protoni e ioni
1 PeV – 1 keV per fotoni ed elettroni1 PeV – 10 keV per protoni e ioni
Fisica implementata in GEANT4