Use of information systems as tools to improve and measure … · Os sistemas de informação...
69
UNIVERSIDADE DA BEIRA INTERIOR Ciências da Saúde Use of information systems as tools to improve and measure leadership skills acquisition through medical simulation Duarte Sequeira Dissertação para obtenção do Grau de Mestre em Medicina (ciclo de estudos integrado) Orientador: Prof. Doutor Henrique Martins Co-orientador: Dr. Luís Patrão Covilhã, Junho de 2016
Transcript of Use of information systems as tools to improve and measure … · Os sistemas de informação...

UNIVERSIDADE DA BEIRA INTERIOR Ciências da Saúde
Use of information systems as tools to improve and measure leadership skills acquisition through
medical simulation
Duarte Sequeira
Dissertação para obtenção do Grau de Mestre em Medicina
(ciclo de estudos integrado)
Orientador: Prof. Doutor Henrique Martins Co-orientador: Dr. Luís Patrão
Covilhã, Junho de 2016

ii

iii
À minha Família.

iv

v
Agradecimentos Aos meus pais, pelo permanente apoio;
Ao Albano;
Ao meu tio, por ser uma referência para mim e à minha avó;
Aos meus amigos, em especial à Camila, Pedro, Torres e Dunkel;
Ao Professor Henrique, pelos inúmeros rabiscos que deram bom caminho a esta dissertação e
que tanto me ensinaram;
A esta Faculdade que me formou e em especial à equipa do Laboratório de Competências
(Luís, Juliana, Magda), pela amizade, apoio e disponibilidade.

vi

vii
Resumo alargado
Contexto e objetivos
Num contexto de crescimento nos gastos com a saúde, acompanhado por uma pressão para
redução desses mesmos custos, espera-se hoje dos médicos que sejam lideres em ambiente
clínico e não clínico, com diferentes graus de responsabilidade. Contudo, a maior parte dos
curricula médicos não inclui o ensino formal da Liderança e Gestão em Saúde. Por outro lado,
estes curricula pré-graduados incluem cada vez mais a simulação biomédica enquanto método
de ensino seguro e viável. Estes momentos representam muitas vezes a primeira oportunidade
para os estudantes de atuarem enquanto equipa, gerindo uma situação de crise, durante a
qual as competências de liderança são cruciais. No entanto, a maior parte das simulações não
usa um sistema de registos clínicos eletrónicos que seja auxiliar nestes cenários. Assim,
pretende-se através deste estudo demonstrar como é que a Liderança e Gestão em Saúde
pode ser ensinada recorrendo à simulação e provar a possibilidade de introduzir um sistema
de informação para gerir este processo. Ao fazê-lo, será possível sugerir um modelo de
sistema de informação integrado para o ensino desta área de ensino.
Materiais e métodos
Foi utilizada uma metodologia mista, tendo sido combinadas duas experiências de
investigação. Estas tiveram lugar no Laboratório de Competências da Faculdade de Ciências
da Saúde da Universidade da Beira Interior, em Portugal. Em primeiro lugar, o autor concebeu
e desenvolveu uma ferramenta para simular um software de registos clínicos eletrónicos.
Depois, utilizando um modelo de triangulação, foi desenhada uma investigação no contexto
do modulo de Liderança e Gestão em Saúde desta faculdade. Diversas sessões de simulação
foram levadas a cabo, com o propósito de treinar as competências de liderança e trabalho em
equipa. Foi recolhida e integrada informação de diversas fontes, nomeadamente de dois
questionários, informação quantitativa do sistema de registos clínicos simulado, bem como de
avaliação qualitativa dos vídeos gravados das sessões
Resultados
Foram avaliadas 16 equipas, num total de 85 estudantes (com idades compreendidas entre os
21 e os 36 anos, média de idades de 23,4, desvio padrão de 2,21). Uma componente
importante da informação utilizada neste estudo foi obtida pelo sistema de registos clínicos
simulado, sem o qual não teria sido possível recolher estes dados em qualidade e quantidade.
Em termos de métricas de eficiência, as equipas levaram entre 0 a 8 minutos para
interagirem pela primeira vez com o sistema, entre 7 a 22 minutos para estabelecer um

viii
diagnóstico correto para o paciente simulado e entre 9 e 27 minutos para executar o
procedimento terapêutico de correção. Houve dois grupos que não estabeleceram o
diagnóstico correto e consequentemente não efetuaram a terapêutica adequada. Em média,
cada equipa fez quarto requisições de métodos complementares de diagnóstico, registou 2,44
entradas de história clínica e listou no sistema 74,3% dos procedimentos efetuados ao
paciente. As equipas gastaram uma média de € 55,01 em métodos complementares de
diagnóstico, quando traduzido em custo real.
Considerando a autoavaliação de competências de liderança e gestão em equipa, os grupos
obtiveram uma classificação média global entre 2,83 e 4,28, de uma escala de Likert de 5
graus.
Numa avaliação externa global às competências de liderança dos grupos, obteve-se uma
média de 3,43 e 3,33, respetivamente, recorrendo à mesma escala usada pelos estudantes e
aplicando uma escalada adicional desenvolvida para o observador externo. 7 grupos foram
classificados por este observador como tendo um estilo de liderança vertical, 4 foram
classificados como alternantes, 3 com liderança partilhada e 2 como caóticos.
Do total de 85 estudantes, 35 preencheram um inquérito dois meses após a simulação. Todos
os 35 estudantes (100% das respostas) sentiram que a simulação foi útil em termos de
aquisição de competências de liderança e gestão. 88,6% estão interessados em ver as suas
gravações de vídeo e 82,9% gostariam de ter este tipo de sessões de forma regular e
frequente.
Discussão/conclusões
Foi possível estabelecer uma associação entre as métricas de tempo/eficiência com os estilos
de liderança presentes em cada grupo. Equipas categorizadas como caóticas não chegaram a
um diagnóstico final nem foram capazes de efetuar o procedimento terapêutico adequado. O
maior número de interações com o sistema de registos, algumas delas repetidas, poderão
suportar a atribuição destas categorias às equipas.
Este número de interações, num contexto real, poderia ter sido traduzido em custos
superiores, quando comparado com outros estilos de liderança que não o caótico.
Numa realidade de responsabilização dos profissionais de saúde em funções de liderança,
pareado com um crescente desenvolvimento tecnológico, bem como com uma utilização
global da simulação enquanto ferramenta de ensino, o ensino da liderança recorrendo à
simulação torna-se emergente e necessário.
Liderança e trabalho de equipa não se adquirem espontaneamente. Estes devem ser
aprendidos e treinados, sendo a simulação uma ferramenta crucial para tal. A prática está

ix
associada a melhores e mais rápidas decisões, dado que as equipas passam a reconhecer mais
cedo os eventos críticos e iniciam ações em resposta a estes. De facto, os estudantes indicam
ter desenvolvido competências de liderança através destas simulações.
É possível introduzir um sistema de informação para gerir este processo, providenciando um
enorme conjunto de dados, como os que foram utilizados neste estudo. Os sistemas de
informação possibilitam a melhoria da qualidade dos dados e a capacidade para os analisar,
extraindo métricas e análises relevantes, que não seriam obtidas de outra forma.
Apesar da amostra pequena deste estudo, foram encontradas diferenças relativamente à
autoavaliação e heteroavaliação de grupos caóticos, que atribuíram classificações superiores
a si próprios, quando comparados com a heteroavaliação efetuada por observador externo.
Como sugerido por Rudy et. Al (2001) e Bryan et al. (2005), está demonstrado que estudantes
com boas capacidades de liderança tendem a ser mais autocríticos na altura de se
autoavaliarem.
A aprendizagem da liderança deve começar cedo, em ambiente universitário, e deve assentar
em programas curriculares bem estruturados. Com esta estratégia, será possível enriquecer os
estudantes com as competências necessárias para se tornarem os médicos do futuro, a cargo
de múltiplas tarefas de gestão — clínicas ou não clínicas — ultrapassando os desafios
colocados por uma saúde globalizada.
Este estudo demonstra a necessidade urgente de criar sistemas de informação integrados para
monitorizar tais atividades de ensino, em tempo real, com potentes ferramentas de análise.
Tal poderá permitir estudos retrospetivos e prospetivos, baseados em resultados clínicos ou
outros, de médio e longo termos
Palavras-chave Simulação biomédica, liderança, trabalho de equipa, registos clínicos eletrónicos, sistemas de informação, software.

x

xi
Abstract
Background & Aims
In a context of health care rising demands, paired with a pressure to reduce costs, doctors
are now expected to be leaders in clinical and non-clinical settings, with different levels of
responsibility. However, the majority of medical curricula do not include formal training in
management and leadership. Undergraduate medical curricula are integrating advanced
clinical simulation as a safe and reliable learning method. It usually represents the first
opportunity for students to act as a team managing a critical situation, during which
leadership skills are crucial. Most of simulations do not use electronic health records system
(EHR), thus not providing training in this important field. This study aims to demonstrate how
an information system can assist medical simulations, both as learning and assessment tools,
in terms of leadership skills acquisition. Thus, it is intended to show how can leadership and
management be taught using simulation and prove if it’s possible to introduce an information
system to manage this process. By doing so, it might be possible to suggest a model of an
integrated information system for teaching management and leadership.
Materials & Methods
A mixed methodology was used where two main research initiatives were combined. These
took place in the Clinical Skills Lab of the Faculty of Health Sciences (University of Beira
Interior), in Portugal. First, the author designed and developed a tool to simulate an
electronic health records system, in tight collaboration with the Clinical Skills Lab. Then,
using a triangulation model, an experiment was designed in the context of the Leadership and
Management subject. Several simulation-based classes took place, with the purpose of
training medical students in leadership. Data was collected and integrated with two survey
data sets, quantitative information extracted from the EHR simulated system, as well as other
qualitative data obtained or assessed by the author with the help of a video recording system.
Results
There were 16 teams/groups assessed, in a total of 85 students (aged between 21 and 36
years, average age of 23.4, standard deviation of 2.21. An important part of the data used for
this study was obtained from the simulated EHR system, without whom it would not be
possible to gather this study results.
On efficiency metrics, teams took between 0 and 8 minutes to make the first interaction with
the simulated EHR, took between 7 and 22 minutes to establish the correct diagnosis and took
between 9 and 27 minutes to execute the desired therapeutically procedure. There were 2
xii
groups who didn’t establish the correct diagnosis and consequently didn’t performed the
desired clinical attitudes and additional plus two groups that also didn’t made the corrective
therapeutic procedure. In average, each team made four complementary diagnostic test
requisitions, registered 2,44 clinical history entries and listed in the system 74,3% of the
executed procedures. Teams spent in average € 55,01, stated as real costs, in diagnostic
tests.
Considering leadership and teamwork competencies self-assessment, groups obtained an
average global rate between 2,83 and 4,28, out of a Likert scale of 5 degrees.
In a global external assessment on leadership skills, a total average of 3,43 e 3,33 was
obtained, respectively, in a scale parallel to the one used in the self-assessment and in an
additional questionnaire applied only during external analysis. 7 groups were categorized as
having a direct leadership style, 4 as alternate, 3 as shared and 2 as chaotic.
From the 85 students, 35 filled a two month post simulation survey. All the 35 students (100%
of the responses) feel this simulation was useful in terms of leadership skills acquisition.
88,6% are interested in having access to their own session’s video recordings and 82,9%
showed interest in having these sessions frequently.
Discussion/conclusion
It was possible to establish an association with time-related efficiency metrics with the
leadership style present in each group. Groups categorized as chaotic did not reach a final
diagnosis neither treat the simulated patient at their responsibility. The higher number of
system interactions, sometimes repeated, can support the attribution of this categories to the
groups.
These number of interactions, in a real situation, could have brought higher costs to the team
when compared with other teams categorized with the remaining three leadership styles.
In a growing context of higher responsibility in healthcare worker’s leadership, as with a
crescent technological development and also with a broader use of simulation as a learning
methodology, simulation based leadership learning becomes mandatory.
Teamwork and leadership does not occur spontaneously. It has to be learned and rehearsed
and simulation is an excellent tool for teaching, rehearsing and analyzing team performance.
Training is associated with timelier decision making as teams recognize critical events earlier
and initiated interventions in a time critical manner. In fact, students claim to have learned
by these simulation sessions.
xiii
It is possible to introduce an information system to manage this process, providing such
amount of useful data used in this study. Information systems give us the ability to improve
quality of data and capacity to work on that data, extracting useful metrics and analysis.
Despite the small sample of this study, differences were found regarding self-assessment and
external assessment for chaotic groups, who rated themselves higher than the external
observer did. Previously published results by Rudy et al. (2001) and Bryan et al. (2005)
demonstrated that student leaders consistently scored themselves lower than their peers on
many aspects of leadership, including altruism, compassion, integrity, accountability,
commitment to excellence, and self-reflection.
Leadership learning must start early on, in the context of higher education, and it must settle
in well-structured curricula. With this strategy it will be possible to provide students with the
necessary skills to become the doctors of tomorrow, in charge of multiple management
activities, being clinical or non-clinical, and exceeding the challenges posed by globalized
healthcare.
This study showed the urgent necessity for the creation of systems that analyze training
activities, around the clock and with powerful analytics engines. Such could allow prospective
and retrospective studies based on clinical outcomes on a medium and long term.
Keywords Medical simulation, leadership, teamwork, electronic health records, information systems, software

xiv
xv
Index
1. Introduction ............................................................................................ 11. Theoretical review .................................................................................... 4
1.1. Simulation in medical education ............................................................. 51.2. Information systems in medical education ................................................. 61.3. Teamwork skills education with simulation ................................................ 71.4. Leadership skills education through simulation ............................................ 8
2. Methods ............................................................................................... 102.1. Type of study and methods ................................................................. 102.2. Study design ................................................................................... 10Pathway A – Design and development of a simulated EHR tool ................................. 12
Software design process ........................................................................ 12Students’ interface features ................................................................... 13Control room interface features ............................................................... 14Used technology .................................................................................. 15
Pathway B – Simulations in the context of a Management and Leadership module .......... 162.3. Data analysis ................................................................................... 18
3. Results ................................................................................................ 203.1. Study population .............................................................................. 203.2. Metrics obtained through simulated EHR and video ..................................... 20
Times .................................................................................................. 20System interactions and compliance metrics ................................................... 21Costs with diagnostic tests ......................................................................... 23
3.3. Leadership and teamwork: self-assessment (post-simulation survey) ................ 233.4. Leadership and teamwork: external assessment (video analysis) ..................... 24
I. Leadership style classification .................................................................. 25II. Leadership and teamwork scale (same as students) ........................................ 25III. Leadership and teamwork scale (specific for the observer) .............................. 26
3.5. Two month after simulation survey ........................................................ 27Self-perception on leadership skills acquisition ................................................ 27
4. Analysis and integration of results ................................................................ 284.1. Leadership and teamwork ................................................................... 28
Self-assessment ...................................................................................... 28External assessment ................................................................................ 29Differential between perception of leadership and its external assessment .............. 30
4.2. Efficiency and performance ................................................................. 31Metrics concerning times and system interactions ............................................. 31Diagnostic tests: costs and time .................................................................. 31
5. Discussion ............................................................................................. 345.1. Future work: a model for an integrated Leadership Learning System (LLS)? ........ 37
Objectives ............................................................................................ 37Requirements ........................................................................................ 37Design ................................................................................................. 38
6. Conclusions ........................................................................................... 397. References ........................................................................................... 41Annexes ..................................................................................................... 45
ANNEX 1 – Post-simulation questionnaire ........................................................... 45ANNEX 2 – Two month after simulation questionnaire ............................................ 47

xvi
xvii
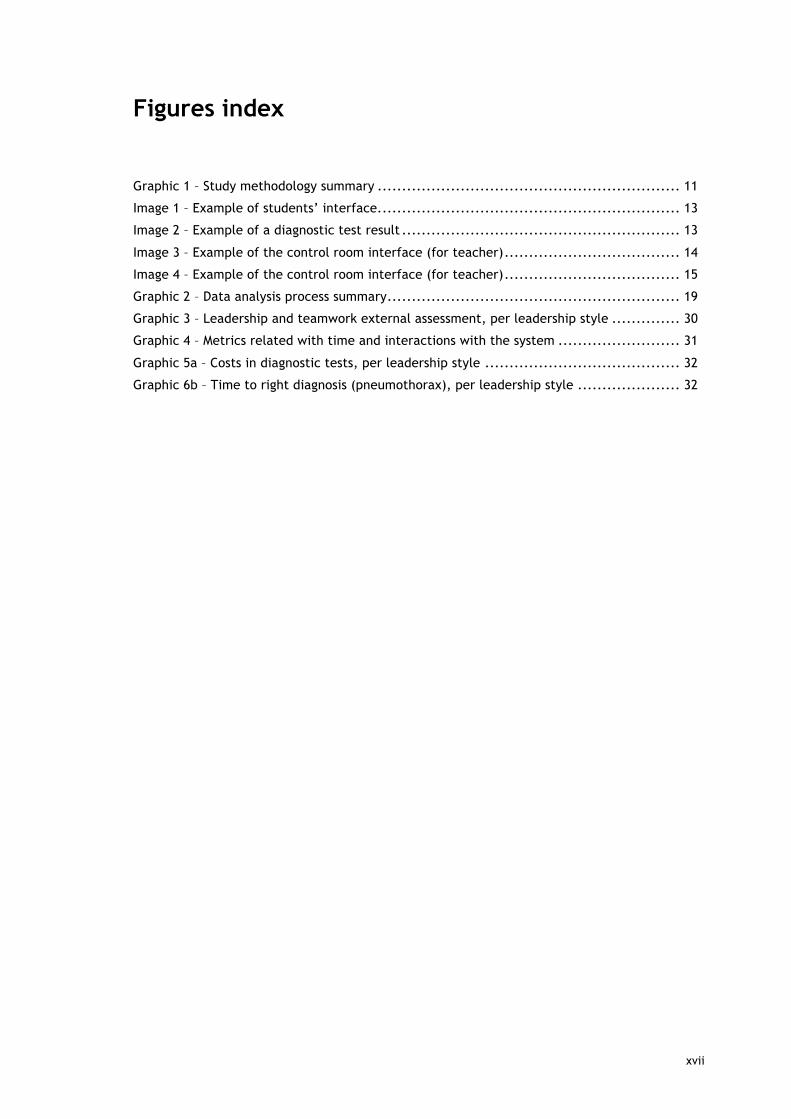
Figures index
Graphic 1 – Study methodology summary .............................................................. 11Image 1 – Example of students’ interface. ............................................................. 13Image 2 – Example of a diagnostic test result ......................................................... 13Image 3 – Example of the control room interface (for teacher) .................................... 14Image 4 – Example of the control room interface (for teacher) .................................... 15Graphic 2 – Data analysis process summary ............................................................ 19Graphic 3 – Leadership and teamwork external assessment, per leadership style .............. 30Graphic 4 – Metrics related with time and interactions with the system ......................... 31Graphic 5a – Costs in diagnostic tests, per leadership style ........................................ 32Graphic 6b – Time to right diagnosis (pneumothorax), per leadership style ..................... 32

xviii

xix
Table Index
Table 1 – List of some references consulted. ............................................................ 4Table 2 – Description of analyzed data sources and its relationship with capture time and specific dimension. ........................................................................................ 18Table 3 – Study population and its distribution per team. .......................................... 20Table 4 – Measured times ................................................................................. 21Table 5 – System interactions and compliance ........................................................ 22Table 6 – Costs with diagnostic tests, per group ...................................................... 23Table 7 – Self-assessment of leadership and teamwork, per group, based on surveys for each team member .............................................................................................. 24Table 8 – Leadership styles and group distribution. .................................................. 25Table 9 – Leadership and teamwork external assessment ........................................... 26Table 10 – Leadership and teamwork external assessment (specific for observer) .............. 27Table 11 – Leadership and teamwork self-assessment, per leadership style. .................... 29Table 12 – Leadership and teamwork external assessment, per leadership style. .............. 29Table 13 – Differential between external and self-assessment. .................................... 30Table 14 – Cost/time, per leadership style. ........................................................... 33Table 15 – LLS objectives. ................................................................................ 37Table 16 – LLS requirements. ............................................................................ 37Table 17 – LLS design ...................................................................................... 38

xx

xxi
Acronyms list
UBI University of Beira Interior LaC Laboratório de Competências (Clinical Skills Lab) OECD Organization for Economic Co-operation and Development GDP Gross domestic product EHR Electronic health records simEHR Simulated electronic health records system LLS Leadership Learning System EKG Electrocardiogram IT Information technology

xxii
1
1. Introduction
In several countries, policy makers have a keen interest to understand population’s health
status, and to know how well their health systems are able to deliver good outcomes, the
Organization for Economic Co-operation and Development (OECD) countries had organized
themselves to monitor this annually1. People are living longer than ever before, with life
expectancy now exceeding 80 years on average, a result of improvements in living conditions,
educational support, but also, of the advances in healthcare processes. In most countries,
universal health coverage provides financial protection against the cost of illness and
promotes access to care for the whole population. The quality of care has also improved, as
noted by the decline of the mortality rate from ischemic heart disease or cerebrovascular
disease, and the earlier detection and effective treatments for serious diseases such as
diabetes and cancer. This growth has come at a cost, however, with health spending now on
averaging 9%-10% of the Gross Domestic Product (GDP) in OECD countries, and exceeding 10%
in many countries. Growing health spending is not a problem if the benefits clearly exceed
the costs, but there is broad evidence of inequities and inefficiencies in health systems which
need fixture. There is also a impending need to achieve a proper balance between spending
on disease prevention and treatment.
Healthcare expenditure in relation to the spending on all the other goods and services in the
economy can be a function of both fluctuations in the rate of health spending itself as well as
growth in the economy. The 2000s were characterized by a period of health spending growth
above that of the overall economy so that health expenditure as a share of GDP rose sharply
in many OECD countries. However, the economic sub-prime crisis that took place in 2008
resulted in an initial rise followed by a reduction in the health spending to GDP ratio across
many OECD countries. Health spending accounted for 8.9% of GDP on average across OECD
countries in 2013, unchanged from 2012 and up marginally from 8.8% in 2011. As an example,
in 2013 the United States spent 16.4% of GDP on health. Portugal, despite being above the
OECD average — spending 9.1% of its GDP in health care in 2013 — had an average of 3%/year
reduction on its per capita health expenditure between 2009-13.
Yet even as demand rises and the economy flourishes, the pressure to reduce costs and
demonstrate value is intensifying. While healthcare systems vary in their structure and
available resources, it is widely recognized that medical doctors play a key role in the
adaptation and performance of these systems (Waring J, et al. 2009). Physicians have a
unique and decisive influence on the utilization of healthcare resources by prescribing
1 http://www.oecd-ilibrary.org/social-issues-migration-health/health-at-a-glance-2015_health_glance-2015-en

2
treatments and drugs. They can play various formal and informal roles that help creating a
rich environment for improved practices and ultimately increase patient safety and the
performance of healthcare organizations (Bohmer RMJ, 2011 and Baker GR, et al. 2011)
Leadership and engagement of other professionals are crucial for crisis management and
health system improvement as a whole. Leadership skills acquisition, contrary to what many
believe does not come from daily practice context alone nor spontaneously. Like many skills
it can come in different basal levels in different people but it surely requires on specific focus
and effort for improvement, and particularly if it is to be start from early years in the
medical training process.
The Faculty of Health Sciences (University of Beira Interior, Covilhã, Portugal), founded in the
very beginning of this millennium, provides, through its medical curriculum, pioneer subjects
and teaching methods in its daily activity.
Supported by a state-of-art Clinical Skills Lab (LaC)2 students train several attitudes and
procedures, in a fully implemented structured and transversal program, developing their
professional and clinical skills.
Aware of the importance of leadership training starting at undergraduate education, this
Faculty is the first and unique medical school in Portugal having a mandatory subject on
leadership and management skills. This subject was introduced ten years ago and is
integrated in the 5th year of the medical curriculum. Since its creation was aimed that
simulation could be part of this subject’s teaching methods, as a way to achieve higher levels
of skills acquisition. In 2016, with the actual development of the Clinical Skills Lab’s human
and technical resources, the perfect environment was created for teaching leadership
through medical simulation.
However, using simulation for the teaching of leadership skills to medical students,
particularly college entry as it is the most common case in Portugal, is a subject that has not
been addressed. Moreover, the role that simulated health information system records may
have in this process was never studied, to the author’s knowledge.
The aim of this study is to demonstrate how an information system can assist medical
simulations, both as learning and assessment tools, in terms of leadership skills acquisition.
In order to attain to its aim, this study focuses on addressing four research questions:
• Is it possible to teach leadership and management with added value using simulation?
2 https://www.ubi.pt/en/page/LaC

3
• Is it possible to introduce an information system to manage this process?
• Assuming an established role for this information system support, is there any
difference between self-perception and external observation of leadership skills
acquisition?
• Is it possible to suggest a model of an integrated information system for teaching
management and leadership?
4
1. Theoretical review
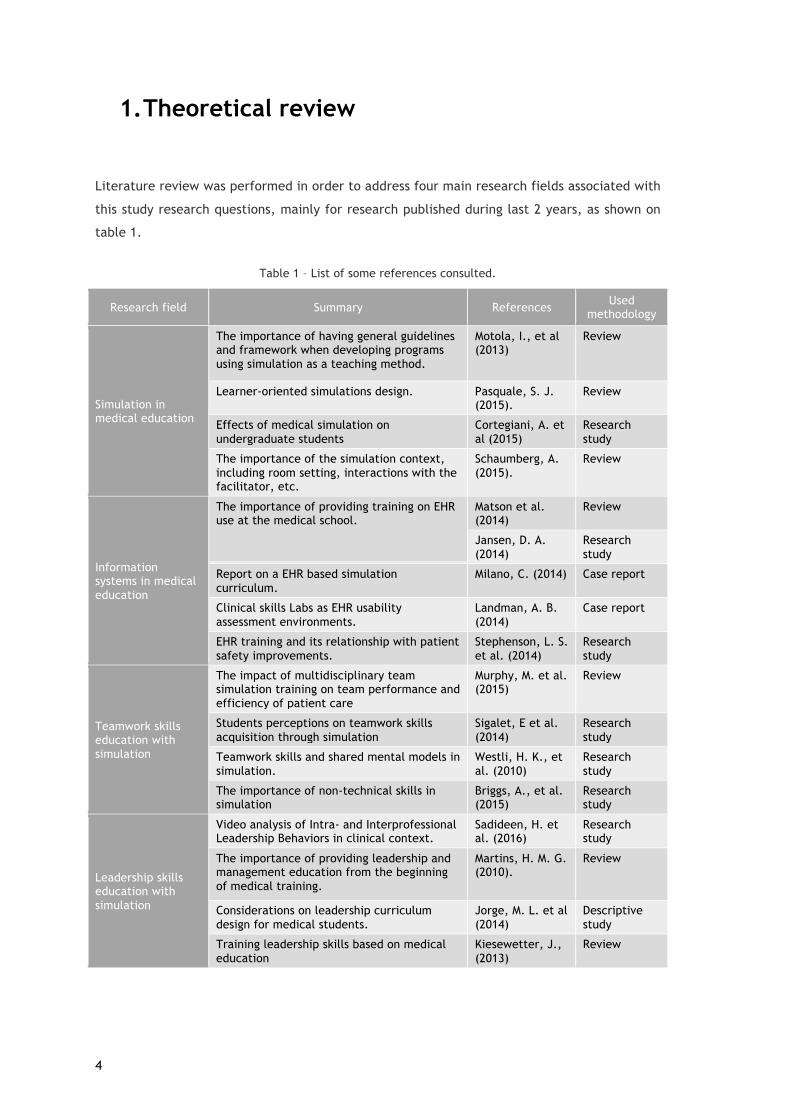
Literature review was performed in order to address four main research fields associated with
this study research questions, mainly for research published during last 2 years, as shown on
table 1.
Table 1 – List of some references consulted.
Research field Summary References Used methodology
Simulation in medical education
The importance of having general guidelines and framework when developing programs using simulation as a teaching method.
Motola, I., et al (2013)
Review
Learner-oriented simulations design. Pasquale, S. J. (2015).
Review
Effects of medical simulation on undergraduate students
Cortegiani, A. et al (2015)
Research study
The importance of the simulation context, including room setting, interactions with the facilitator, etc.
Schaumberg, A. (2015).
Review
Information systems in medical education
The importance of providing training on EHR use at the medical school.
Matson et al. (2014)
Review
Jansen, D. A. (2014)
Research study
Report on a EHR based simulation curriculum.
Milano, C. (2014) Case report
Clinical skills Labs as EHR usability assessment environments.
Landman, A. B. (2014)
Case report
EHR training and its relationship with patient safety improvements.
Stephenson, L. S. et al. (2014)
Research study
Teamwork skills education with simulation
The impact of multidisciplinary team simulation training on team performance and efficiency of patient care
Murphy, M. et al. (2015)
Review
Students perceptions on teamwork skills acquisition through simulation
Sigalet, E et al. (2014)
Research study
Teamwork skills and shared mental models in simulation.
Westli, H. K., et al. (2010)
Research study
The importance of non-technical skills in simulation
Briggs, A., et al. (2015)
Research study
Leadership skills education with simulation
Video analysis of Intra- and Interprofessional Leadership Behaviors in clinical context.
Sadideen, H. et al. (2016)
Research study
The importance of providing leadership and management education from the beginning of medical training.
Martins, H. M. G. (2010).
Review
Considerations on leadership curriculum design for medical students.
Jorge, M. L. et al (2014)
Descriptive study
Training leadership skills based on medical education
Kiesewetter, J., (2013)
Review

5
1.1. Simulation in medical education A series of recent events has led to an increase use of clinical simulation in healthcare
education. These include a higher focus on patient safety, based on a new training model not
founded solely on knowledge acquisition, an ambition for standardized educational
opportunities that are easily available, and a demand to practice skills in a monitored
environment. In addition, validity in using simulation for healthcare education is increasingly
reported in several articles, proving its benefits (Issenberg et al. 2005; McGaghie et al.
2010a).
“Simulation is a ‘hands-on’ (experiential learning) educational modality, acknowledged by
adult learning theories to be more effective” (Ziv A. 2009) than learning that is not
experiential in nature. It represents an opportunity for the learner to become engaged in the
learning. In simulation, trainees learn with each other, with the educator and with the
content presented in a specific environment.
Experiential learning stimulates students' critical thinking, problem-solving, and decision-
making skills, all being goals of teaching using simulation. It “involves reflective thought, and
influences subsequent actions and personal development” (Dunn WF, 2004). In experiential
learning, trainees build knowledge by means of their interactions and experiences. Lave
points out that “knowledge needs to be presented in settings and situations that would
normally involve that knowledge” (Lave J, 2014). This process assumes that experiential
learning builds knowledge in a more effective way, when compared with didactic
presentations or online content distribution alone. Simulation improves the acquisition and
retention of new knowledge compared with traditional methods. There is consensus in that
“simulation offers a conducive environment for focused reflection and critical thought”
(Huang GC, 2007). Harden et al. (2009) reminds us that “educators are becoming more aware
of the need to develop forms of learning that are rooted in the learner's practical experience
and in the job they are to undertake as a professional on completion of training.” Further,
“learning takes place through the active behavior of the learner; it is what he does that he
learns, not what the educator does” (Tyler R, 1949). Thus, the development of critical
reflection skills, crucial in the debriefing process, is fundamental to effectiveness in
healthcare.
It is important for learners to be engaged in activities that stimulate them to apply the
knowledge they are trying to learn so they have the ability to apply it in differing situations.
Application of knowledge is an essential feature of simulation and the learner's ability to
apply the knowledge in various situations is crucial in clinical practice. Experiential learning
offers the learner the opportunity to build knowledge and skills that are vital to their clinical
practice. However, learning to apply previously acquired knowledge and skills to new
situations requires practice and feedback. As noted in Kolb's cycle of experiential learning,

6
the learner progresses through a cycle consisting of four related phases: concrete experience
(an event), reflective observation (what happened), abstract conceptualization (what was
learned and future implications), and active experimentation (what will be done differently).
The learner's previous experiences have a direct impact to future learning, thus reflecting the
importance of the four phases of the experiential learning process, in particular the aspects
of what happened, what was learned, and future implications. As learners increasingly
internalize this process of reflection on action, which takes place in simulation debriefings, it
is expected that it will be supplemented by “reflection in action”, which occurs immediately,
while the learning event is occurring (Kaufman DM, 2003).
1.2. Information systems in medical education It has been increasingly demonstrated that EHR use improves the quality, efficiency, and cost
of patient care. (Chaudhry B, et al. 2006; Buntin MB, et al. 2011);
To fully prepare medical school graduates to assume roles of increasing responsibility and
leadership in modern health care systems requires developing their competence in patient-
centered EHR use. However, most medical trainees receive little directed and uniform
education in optimal use of EHRs (Hammoud MM, et al. 2012). Further, because of concerns
about liability, billing, and patient safety, medical students’ access to EHRs is often limited,
making them unable to document encounters, register past medical history, or enter create
treatment/investigation orders (Mintz M. 2009).
Thus, although academic health centers are most of the time at the forefront of new
technologies implementation - including electronic health records (EHR) – and often software
and clinical simulation equipment, there is often a pitfall of functional and logical bridges
between these two fields regarding medical learning (Jha AK, et al. 2009).
This lack of access and practices of EHR-based education prevents students from learning to
use EHRs. Rather than being given opportunities to experience in simulated settings the
mistakes and frustrations inherent in using EHRs, students often embark on a haphazard and
variable learning curve in patient care settings, where their EHR education is directed with
differing skill levels. Given this model, few students are likely to graduate feeling fully
proficient or comfortable with their ability to use EHRs (Christina E, et al. 2014).
In fact, the use of EHR, at least in real clinical environment, is proven to be an important
source of data, allowing for several metrics’ analysis and with an increasing potential to
improve processes in several fields, from leadership to efficiency (Weiner J, et. al 2012)

7
1.3. Teamwork skills education with simulation Teams are now expected to share a common goal, and to synchronize individual skills in
interdependent collaboration in order to provide safe and efficient patient care (Murphy, M.
et al. 2015). Although team members are sufficiently trained individually, teamwork skills
have traditionally been less emphasized in medical training (Sexton JB, et. al 2000). The
knowledge that fatal errors due to ‘human factors’ can occur in 70-80% of medical mishaps
has led to growing interest in medical teams’ cognitive and interpersonal skills, such as
leadership and communication, which are referred to as ‘non-technical skills’. Such ability
has shown to have a critical role in maintaining patient safety (Fletcher G. 2000).
Teamwork is a key factor to patient safety. Healthcare is a multidisciplinary task where
interaction of individuals from diverse backgrounds (expertise, training, experience, and
culture) can affect patient care. These teams could be functioning in an environment
characterized by high stress, high-stakes outcomes, and time pressures. Likewise, patient
safety is directly impacted by teamwork. (Motola, I. et al 2013). The Joint Commission
reports indicate miscommunication as the root cause of nearly 70% of sentinel events.
Furthermore, a review linking teamwork and patient outcomes found empirical support for
the relationship between teamwork behaviors and clinical patient outcomes.
Teamwork is a key factor to patient safety. Healthcare involves multidisciplinary work where
interaction of individuals from diverse backgrounds (expertise, training, experience, and
culture) have been show to affect patient care. These teams often operate in an environment
characterized by high stress, high-stakes outcomes, and time pressures. Likewise, patient
safety is directly impacted by teamwork. (Motola, I. et al 2013). The Joint Commission
reports indicate miscommunication as the root cause of nearly 70% of sentinel events.
Furthermore, a review linking teamwork and patient outcomes found empirical support for
the relationship between teamwork behaviors and clinical patient outcomes. Salas and
colleagues point out that:
‘‘training also provides opportunities to practice (when used with simulation) both
task- and team-related skills in a ‘consequence-free’ environment, where errors truly are
opportunities for learning and providers receive feedback that is constructive, focused on
improvement, and non-judgmental’’ (Salas et al. 2008)
Team training works in carefully designed curricula which allow opportunities for the
deliberate practice of teamwork skills in a simulation-based medical environment (McGaghie
et al. 2010a). A growing body of literature indicates the impact of teamwork on clinical
outcomes in several diverse clinical settings, such as ambulatory care (Campbell et al. 2001),
nursing homes (Rantz et al. 2004), community-based care (Mukamel et al. 2006), emergency

8
departments (Morey et al. 2002), intensive care units (Young et al. 1998; Wheelan et al. 2003;
Dubose et al. 2008), operating rooms (Undre et al. 2006; Lingard et al. 2008), labor and
delivery units (Thomas et al. 2006;Mooney & Neily 2007) and inpatient wards (Curley et al.
1998; Strasser et al. 2008). Despite the growing evidence and involvement from various
healthcare disciplines, team training programs have struggled to achieve desired outcomes.
Training success is highly dependent not only on curricula and instructional strategies, but on
several more complex organizational variables such as leadership support, resource
availability, training environment, and readiness for change (Salas et al. 2009).
Teamwork does not occur spontaneously. It has to be learned and rehearsed and simulation is
a valuable tool for teaching, studying and analyzing multidisciplinary team performance.
1.4. Leadership skills education through simulation Key leadership attributes are well defined in the literature and encompass multiple virtues,
which include technical competence, professionalism, motivation, innovation, teamwork,
effective communication, emotional competence, and teaching; they can be developed
through observation, experience, and education. (Patel VM, et al. 2010). Leadership is
particularly important in highly complex health care contexts involving a number of staff,
some from the same specialty (intraprofessional), and others from different specialties
(interprofessional). Recently, interprofessional teamwork has become an important aspect of
work in healthcare (Reeves S. et al. 2012). Maximizing patient safety and reducing medical
errors depends not only on technical expertise but also on how decisions are made and how
relevant information is communicated and tasks are coordinated.
Despite the importance of training of leadership skills in medical curricula for professional
collaboration as well as patient care, it is under-represented in several known catalogues of
learning objectives (Kiesewetter, J. et al. 2013)
There is a correspondingly low number of findings as to how the development of leadership
skills can be integrated into medical training and what effects the development measures can
aim to attain. It is well established that simulation can play a powerful role in clinical training
(Sadideen H. et al. 2012). Educational theory highlights the importance of contextualized
simulation for effective learning (Kneebone R. 2010). Such elements are more complex and
much harder to define than technical skills. Within the appropriate context and design,
simulation may therefore provide a unique opportunity to help trainees/residents develop
adequate leadership skills. Simulation-based team training and debriefing is an evolving
educational strategy that encourages work-based learning, collaboration, and teamwork
(Severson MA. et al. 2014).
9
This training can be useful at the different stages of a physician's career and are likely to be
taught best in a progressive manner, in a spiral educational structure, which can be split into
four main stages: A) medical school; B) residency; C) medium-level responsibilities (e.g.,
leadership of a unit); and D) senior levels (e.g., leadership of a department). Each stage has
inherent challenges and opportunities, which will make education in these areas invaluable
(Martins H. 2010).
Yet from their very first day at work, physicians are expected to take on the role of a leader,
to bear responsibility and to make important medical decisions facing a heterogeneous
environment. As they do this, taking an active leadership role and implementing managerial
behavior contribute to more effective teamwork and good patient care (McGaghie WC, et al.
2009).
The need for medical students and young doctors to be introduced to their leadership roles in
the context of their training is well accepted. The concept of leadership here comprises
exercising conscious, goal-oriented social influence on people for the purpose of performing
shared tasks in pursuit of common objectives, and focuses on leading subordinates, colleagues
and teams (Bruch H. et al. 2006). The active adoption of a leadership role and the associated
implementation of leadership skills include, as stated by Schmidt-Huber, Frey, Peus &
Weisweiler, motivating team members, building up on trust, organizing work activities and
delegating tasks and responsibility, being able to communicate effectively while managing
change and conflicts. The good leader should ensure good quality work, in an efficient way.

10
2. Methods
2.1. Type of study and methods
There are several factors impacting medical education processes, including those relating to
the school, faculty, other students, specific project, dimensions of assessment and cultural
and social context. Therefore, using a single research perspective may be reductionist for
studying medical education. While knowing what works is important, an appreciation of why
it works, when it works, and for whom it works is needed to deepen our understanding of
learning and teaching in medicine (Cook, Bordage, & Schmidt 2008).
Different methods can be combined to the development and extension of the research scope
and depth of analysis. Mixed methods research is ideal for the improvement of teaching and
learning in the medical profession. The comprehensive and heterogeneous approach supports
validity, answers questions in a rich and meaningful way, provides new insights and,
potentially, raises new questions on the nature of learning and instruction. This approach
offers the researcher an opportunity to go in a new direction, to experiment, and to create
meanings that could not be possible to achieve by using a single method. (Lavelle, et. al
2013)
Leech & Onwuegbuzie (2009) provide a simple definition of mixed methods research:
“collecting, analyzing, and interpreting both qualitative and quantitative data in a single
study, or series of studies that investigate the same underlying paradigm”.
2.2. Study design A mixed methodology was used where two main research initiatives were combined. These
took place in the Clinical Skills Lab of the Faculty of Health Sciences (University of Beira
Interior), in Portugal.
First, the author designed and developed a tool to simulate an electronic health records
system, in tight collaboration with the Clinical Skills Lab. Then, using a triangulation model,
an experiment was designed in the context of the Leadership and Management subject.
Several simulation-based classes took place, with the purpose of training medical students in
leadership.
Data was collected and integrated, two survey data sets, quantitative information extracted
from the EHR simulated system, as well as other qualitative data obtained or assessed by the
author with the help of a video recording system.
11
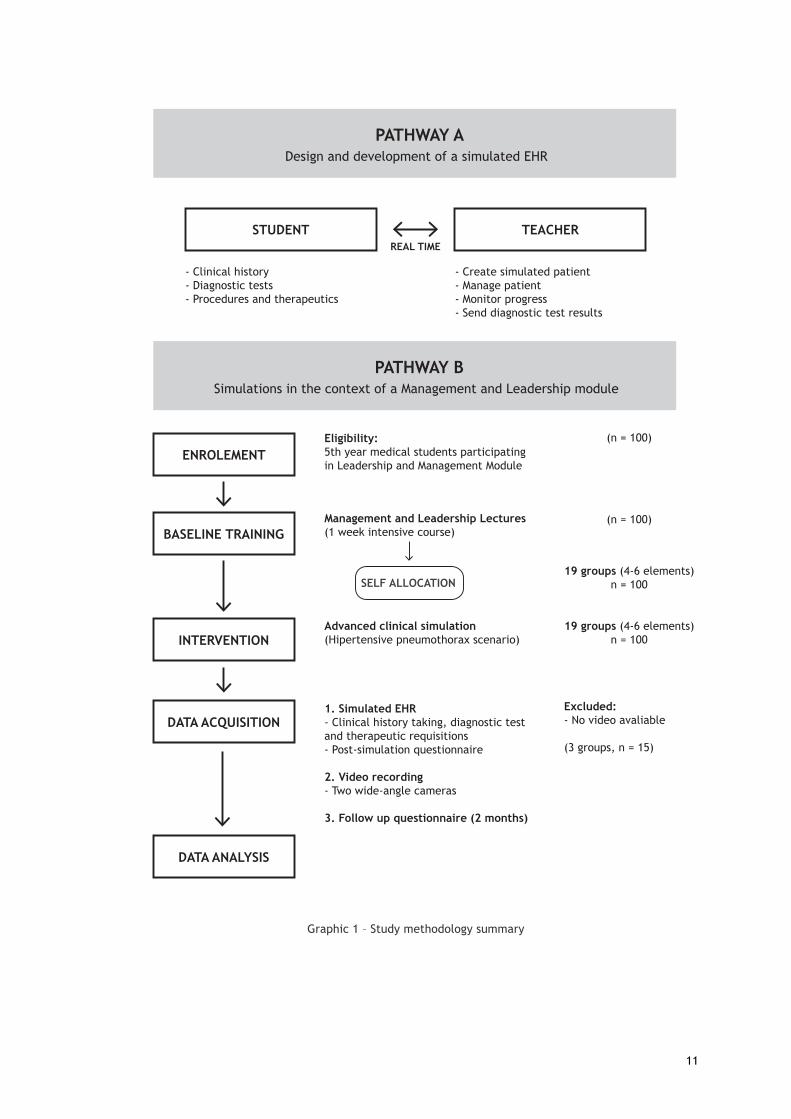
Graphic 1 – Study methodology summary
PATHWAY ADesign and development of a simulated EHR
STUDENT TEACHER
- Create simulated patient- Manage patient- Monitor progress- Send diagnostic test results
PATHWAY BSimulations in the context of a Management and Leadership module
ENROLEMENT
REAL TIME
BASELINE TRAINING
INTERVENTION
DATA ACQUISITION
DATA ANALYSIS
- Clinical history- Diagnostic tests- Procedures and therapeutics
Eligibility:5th year medical students participating in Leadership and Management Module
Management and Leadership Lectures (1 week intensive course)
SELF ALLOCATION
Advanced clinical simulation(Hipertensive pneumothorax scenario)
1. Simulated EHR- Clinical history taking, diagnostic test and therapeutic requisitions- Post-simulation questionnaire
2. Video recording- Two wide-angle cameras
3. Follow up questionnaire (2 months)
(n = 100)
(n = 100)
19 groups (4-6 elements)n = 100
19 groups (4-6 elements)n = 100
Excluded:- No video avaliable
(3 groups, n = 15)

12
Pathway A – Design and development of a simulated EHR tool
Medical simulations lack high fidelity in several aspects. One of the areas that can be better
addressed is the integration of information systems, specifically concerning the use of
electronic health records. No commercial software was found to be available for clinical
management of advanced medical simulation scenarios.
Software design process
A software application was designed and developed. This is a two-way interface system,
allowing for real-time interaction between trainees in the simulated emergency room and the
educators, functionality was a key concern. This software was created to be used as support
tool in the context of a simulated emergency room with an advanced mannequin simulator.
A series of most frequent diagnostic tests that could be useful in a simulation context, based
on the preprogramed scenarios, as well as, common clinical practice, was collected to inform
software design. Biochemical, analytical, imaging and microbiology categories were covered,
as well as general diagnostic tests such as electrocardiogram (EKG). Each diagnostic test had
information about the commonly used units in typical Portuguese hospitals and reference
values when applicable. In the back office of the application, these were additionally marked
with the NHS cost.
Given the educational context and the turnover of clinical scenarios, it was assumed that the
educator should be capable of creating standardized patients, based on their presenting
diagnosis. For each presenting diagnosis, the educator is able to define a range of presenting
age (10 years range), patient gender and to configure several diagnostic test results sets, one
for each phase of the scenario, including image upload for imaging tests or EKG.
It is then possible to create one unique patient for each simulation session, with a
randomized name based on defined gender, an age with 10% variability around the predefined
value of the standardized patient created before, as well as diagnostic test results with some
variability (5%). This variability is possible for diagnostic test results represented by numbers.
Every time a new patient is created from a predefined diagnosis, the queue of observation is
updated, allowing students to select the desired patient and to start the simulation. This
randomization is important to assure that students cannot easily recognize the scenario.
After selecting the desired patient, students have at their disposal a series of features,
allowing for close interaction with the control room, as described in the following sections.
13
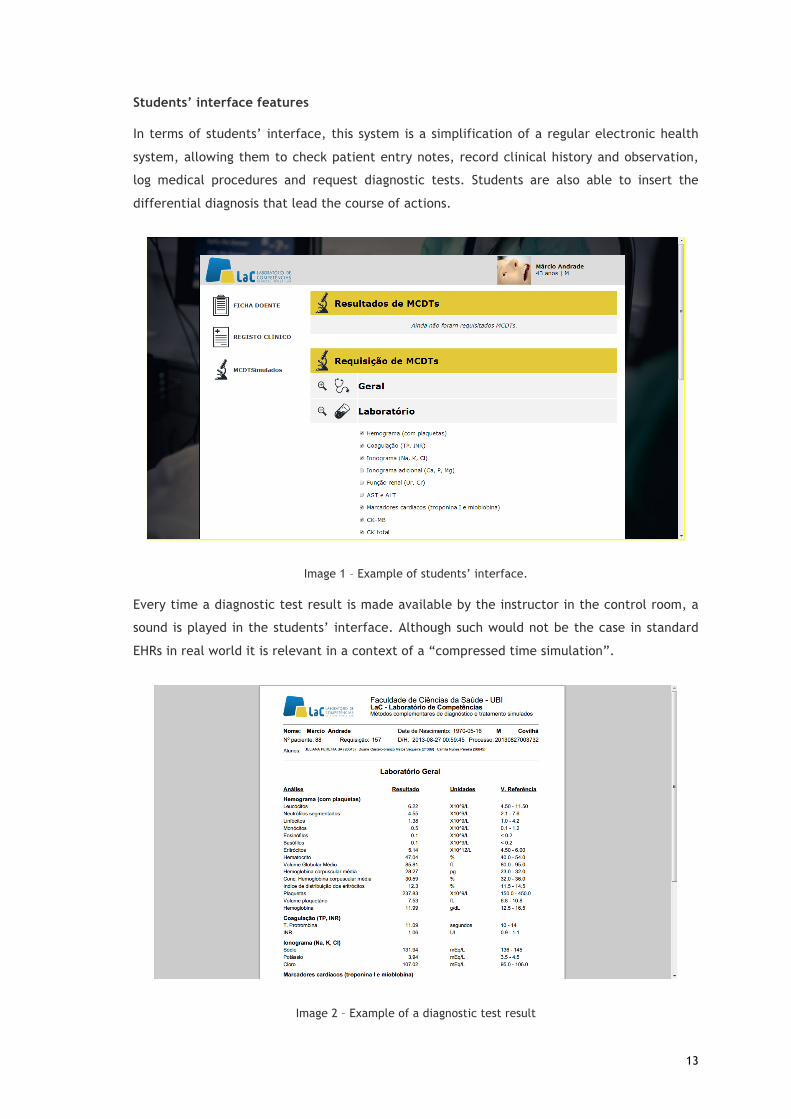
Students’ interface features
In terms of students’ interface, this system is a simplification of a regular electronic health
system, allowing them to check patient entry notes, record clinical history and observation,
log medical procedures and request diagnostic tests. Students are also able to insert the
differential diagnosis that lead the course of actions.
Image 1 – Example of students’ interface.
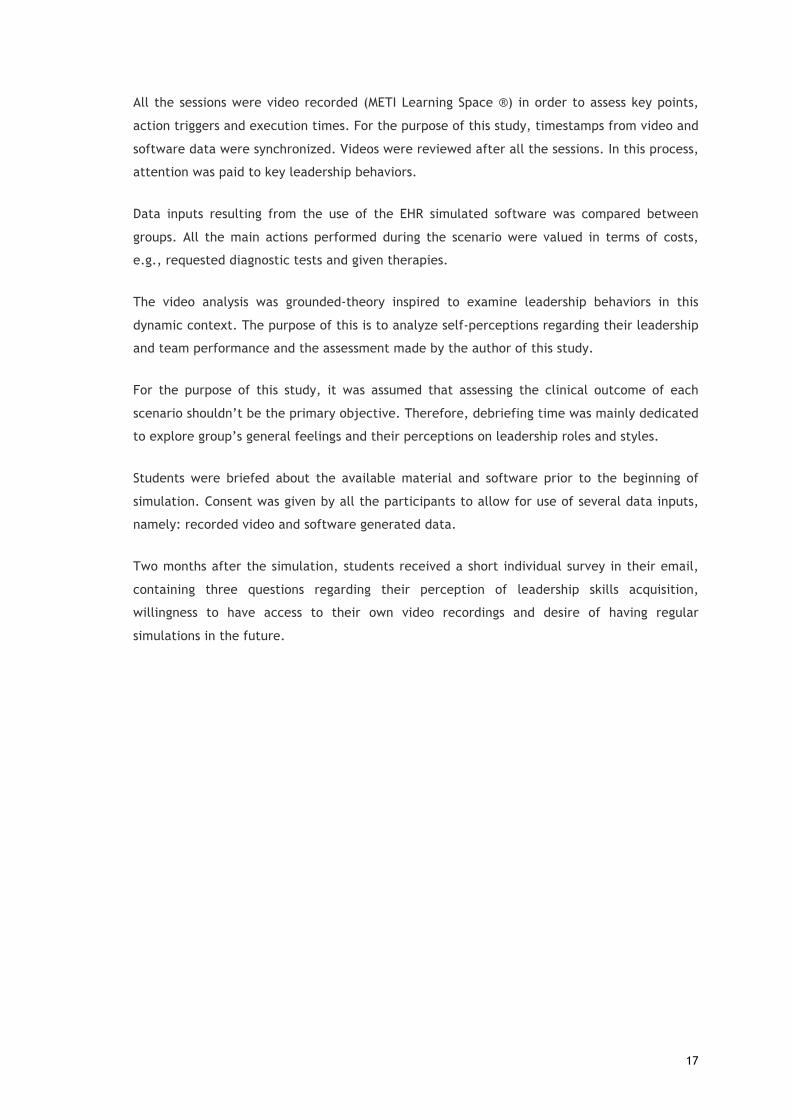
Every time a diagnostic test result is made available by the instructor in the control room, a
sound is played in the students’ interface. Although such would not be the case in standard
EHRs in real world it is relevant in a context of a “compressed time simulation”.
Image 2 – Example of a diagnostic test result

14
Control room interface features
Educators have the ability to create predefined patients based on diagnosis and to generate
patients from them. These patients are then made available for use in a simulation session, as
described previously.
Image 3 – Example of the control room interface (for teacher)
Focus is put in the control room interface, designed for real-time checking of students’
performance in terms of data entries and as a manner to reply with diagnostic tests results as
they request them, allowing students to consult them in their interface. Educators also have
the possibility to rate every action (data entry, diagnostic test requisition, etc.) as positive,
negative or neutral and to send text alerts to the room.

15
Image 4 – Example of the control room interface (for teacher)
This tool allows for different metrics extraction, timeline visualization and graphics
generation. Thus, it facilitating the debriefing process as the reports that are generated are
an important source of data.
Used technology
This web-based software runs in a regular internet browser and was developed using PHP® as
the server-side language, combined with HTML®, CSS® and JavaScript for the front-end
interface design. All the information is stored in a MySQL® database. As a way to allow for
high portability, this system is hosted by a small Raspberry Pi®, a single board computer with
the size of a credit card, connected to the intranet of the Clinical Skills Lab.

16
Pathway B – Simulations in the context of a Management and Leadership
module
This pathway was conducted in the Clinical Skills Lab of the Faculty of Health Sciences
(University of Beira Interior), in Portugal, during February 2016, in the context of
Management and Leadership module, a compulsory program for 5th year medical students as
previously described. In the last step of the program, students were given freedom to group
themselves in teams of 4-6 students (n=100 students) and were scheduled to participate in an
advanced simulation.
All the teams were submitted to the same clinical case (although patient personal details
varied) and were specifically asked not to share information with the other groups. Neither of
the groups were aware of the simulated patient condition before having contact with it. Each
clinical scenario started with a role-playing nurse urgently asking the team to assess and
manage patient’s condition. The simulated patient (iStan METI ® Simulator) represented a
male individual aged between 67 and 73 presenting with an acute onset dyspnea losing
consciousness within two minutes from the start. Students were expected to use an ABCDE
approach, asking for needed diagnostic tests and performing clinical procedures. In all
sessions, an actor performed as an nurse, collaborating with students during simulation.
Sessions took 15-30 minutes each, with some outliers with more duration, caused by clinical
condition worsening events. Those events were induced when there wasn’t proper
management of the presenting clinical condition, aiming to introduce leadership style
transformations within the team.
Simulated scenarios were run in an advanced simulation room, equipped the same way as an
emergency ward, including a crash cart, a vital signs monitor, a telephone (contact with
consultants, labs, radiology) and visible Advanced Cardiac Life Support guidelines posted on
the wall.
There was also a computer with the simulated electronic health records software, as
described previously.
During the study, several action triggers were introduced in each scenario and improved to
which the participants were exposed, such as the need to deal with the simulated patient
family, the ought to wait for the diagnostic tests results or even the need to hold the line
while dialing to other “hospital” departments, when asking for their collaboration.
In the end of the simulation, prior to debriefing moment, students were asked to fill out an
individual survey addressing their perceptions about individual and group attitudes towards
the session, regarding leadership and clinical reasoning skills (annex 1).
17
All the sessions were video recorded (METI Learning Space ®) in order to assess key points,
action triggers and execution times. For the purpose of this study, timestamps from video and
software data were synchronized. Videos were reviewed after all the sessions. In this process,
attention was paid to key leadership behaviors.
Data inputs resulting from the use of the EHR simulated software was compared between
groups. All the main actions performed during the scenario were valued in terms of costs,
e.g., requested diagnostic tests and given therapies.
The video analysis was grounded-theory inspired to examine leadership behaviors in this
dynamic context. The purpose of this is to analyze self-perceptions regarding their leadership
and team performance and the assessment made by the author of this study.
For the purpose of this study, it was assumed that assessing the clinical outcome of each
scenario shouldn’t be the primary objective. Therefore, debriefing time was mainly dedicated
to explore group’s general feelings and their perceptions on leadership roles and styles.
Students were briefed about the available material and software prior to the beginning of
simulation. Consent was given by all the participants to allow for use of several data inputs,
namely: recorded video and software generated data.
Two months after the simulation, students received a short individual survey in their email,
containing three questions regarding their perception of leadership skills acquisition,
willingness to have access to their own video recordings and desire of having regular
simulations in the future.
18
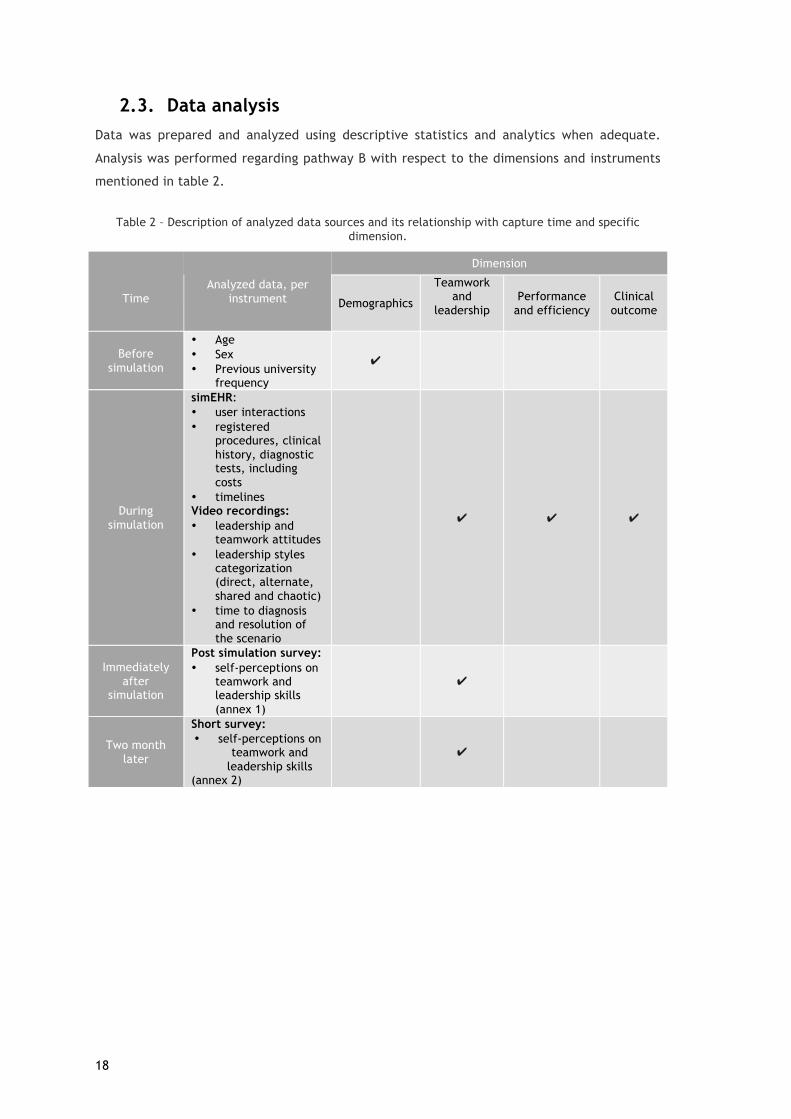
2.3. Data analysis Data was prepared and analyzed using descriptive statistics and analytics when adequate.
Analysis was performed regarding pathway B with respect to the dimensions and instruments
mentioned in table 2.
Table 2 – Description of analyzed data sources and its relationship with capture time and specific dimension.
Time
Analyzed data, per instrument
Dimension
Demographics
Teamwork and
leadership
Performance and efficiency
Clinical outcome
Before simulation
• Age • Sex • Previous university
frequency
✔
During simulation
simEHR: • user interactions • registered
procedures, clinical history, diagnostic tests, including costs
• timelines Video recordings: • leadership and
teamwork attitudes • leadership styles
categorization (direct, alternate, shared and chaotic)
• time to diagnosis and resolution of the scenario
✔ ✔ ✔
Immediately after
simulation
Post simulation survey: • self-perceptions on
teamwork and leadership skills (annex 1)
✔
Two month later
Short survey: • self-perceptions on
teamwork and leadership skills
(annex 2)
✔

19
Graphic 2 – Data analysis process summary
Data and graphics were analyzed and generated using Microsoft Office Excel 2016® and
Google Spreadsheets®.
Demographic information
simEHR:
user interactions, registered
procedures, clinical history,
diagnostic tests, including
costs , timelines
Video recordings:
leadership and teamwork
attitudes, leadership styles
categorization (direct,
alternate, shared and
chaotic, time to diagnosis
and resolution of the
scenario
Post simulation survey:
self-perceptions on teamwork
and leadership skills (annex
1)
Debriefing
Short survey:
self-perceptions on
teamwork and leadership
skills
(annex 2)
Surveys
VideoSimEHR
T= 0 min (before
simulation)
T= [0,20] (during
simulation)
T= 20 min (after
simulation)
T= 2 month
Leadership learning
through simulation

20
3. Results
3.1. Study population As previously stated, 100 students grouped themselves in 19 teams, according to their
preferences. From those 19, 3 teams were excluded from the study since there was a a
technical problem with the video recording system, not allowing for video capture. Thus, 16
teams participated in this study with a total of 85 medical students attending the fifth year in
the University of Beira Interior, aged 21 to 36 years (mean 23.4; standard deviation of 2.21).
Table 3 – Study population and its distribution per team.
Group Number of Students
Average age
Age (standard Deviation)
Women (%)
Men (%)
Previous University frequency
A 5 22,60 1,95 60% 40% 20%
B 6 24,00 2,10 100% 0% 33%
C 5 22,60 0,89 60% 40% 0%
D 4 23,00 1,41 50% 50% 25%
E 5 23,80 1,30 100% 0% 80%
F 5 22,80 0,84 0% 100% 20%
G 7 22,29 0,49 57% 43% 29%
H 7 23,29 1,60 71% 29% 29%
I 7 23,86 1,77 86% 14% 57%
J 5 26,40 3,36 0% 100% 60%
K 5 22,80 1,10 60% 40% 20%
L 5 22,20 0,45 80% 20% 20%
M 5 22,60 0,55 40% 60% 40%
N 5 25,40 5,98 100% 0% 40%
O 5 23,00 2,35 40% 60% 40%
P 4 23,75 1,50 0% 100% 50% Population
average 5,3 23,38 2.21 59% 41% 35%
3.2. Metrics obtained through simulated EHR and video In order to assess the group’s performance and efficiency, metrics were extracted from the
software running a simulated EHR and coupled with data from observation of recorded video.
Times
Decision-making, can take more or less time. In the context of team or collective decision-
making this variability is often dependent on communication and leadership. Measuring time
for relevant or critical decisions can serve as a proxy of efficiency in team decision-making
and its leadership. Such values can be interpreted as a measurement of efficiency. A series of
time periods were measured, these were:

21
a) time (in minutes) to the first interaction with the simulated EHR (to register clinical
information, assign prescription or request complementary diagnostic tests),
b) time (in minutes) to requisition of the first complementary diagnostic test was obtain
through the software, considering the clinical case being used, time to EKG and
thoracic radiograph requisition were considered;
c) time (in minutes) to correct diagnosis - pneumothorax
d) time (in minutes) to execution of the desired therapeutic procedure – chest tube
placement
In the specific cases where groups could not reach the final diagnostic or procedure, no time
was considered. Table 4 presents teams’ different times.
Table 4 – Measured times
(Greener tones indicate better performance than the yellow average. Red indicates the
opposite)
System interactions and compliance metrics
Several metrics were obtained concerning the number of input registrations performed by
users:
Group
Time to first contact to
simEHR (min)
Time to first diagnostic test order
(min)
Time to EKG (min)
Time to chest x-ray
(min)
Time to diagnosis
(min)
Time to resolution
(min)
A 2 5 - - - -
B 2 2 2 2 9 -
C 2 6 8 - 11 -
D 8 8 - 8 11 13
E 2 2 2 4 16 27
F 3 3 3 6 13 17
G 2 8 - 9 9 18
H 0 2 11 6 17 25
I 1 1 1 7 9 9,5
J 0 3 - 3 13 15
K 3 3 3 20 22 25
L 3 4 8 5 - -
M 4 4 4 5 7 9
N 6 6 6 15 15 15
O 2 5 5 6 14 16
P 2 4 11 14 18 23
Average 2 4 4,5 6 13 16,5
22
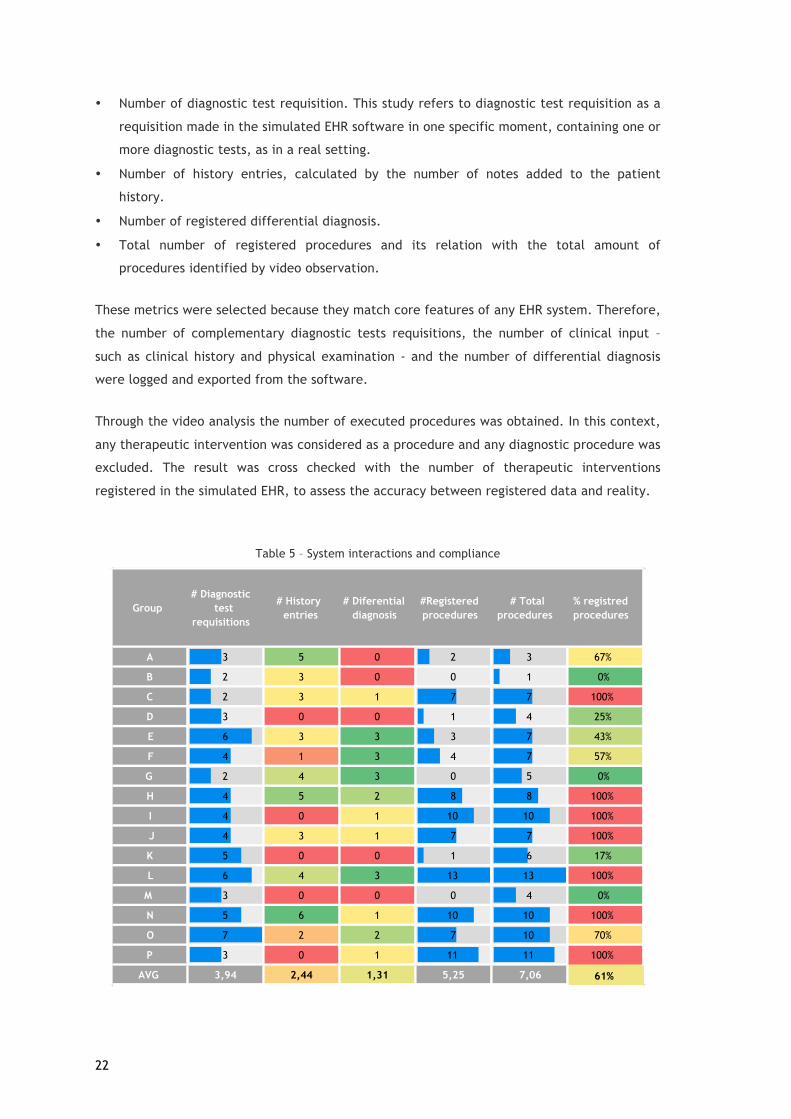
• Number of diagnostic test requisition. This study refers to diagnostic test requisition as a
requisition made in the simulated EHR software in one specific moment, containing one or
more diagnostic tests, as in a real setting.
• Number of history entries, calculated by the number of notes added to the patient
history.
• Number of registered differential diagnosis.
• Total number of registered procedures and its relation with the total amount of
procedures identified by video observation.
These metrics were selected because they match core features of any EHR system. Therefore,
the number of complementary diagnostic tests requisitions, the number of clinical input –
such as clinical history and physical examination - and the number of differential diagnosis
were logged and exported from the software.
Through the video analysis the number of executed procedures was obtained. In this context,
any therapeutic intervention was considered as a procedure and any diagnostic procedure was
excluded. The result was cross checked with the number of therapeutic interventions
registered in the simulated EHR, to assess the accuracy between registered data and reality.
Table 5 – System interactions and compliance
Group# Diagnostic
test requisitions
# History entries
# Diferential diagnosis
#Registered procedures
# Total procedures
% registred procedures
A 3 5 0 2 3 67%
B 2 3 0 0 1 0%
C 2 3 1 7 7 100%
D 3 0 0 1 4 25%
E 6 3 3 3 7 43%
F 4 1 3 4 7 57%
G 2 4 3 0 5 0%
H 4 5 2 8 8 100%
I 4 0 1 10 10 100%
J 4 3 1 7 7 100%
K 5 0 0 1 6 17%
L 6 4 3 13 13 100%
M 3 0 0 0 4 0%
N 5 6 1 10 10 100%
O 7 2 2 7 10 70%
P 3 0 1 11 11 100%
AVG 3,94 2,44 1,31 5,25 7,06 61%

23
Costs with diagnostic tests
The following values were obtained, in euros, per group, calculated from exams ordered via
application exams. All the requested diagnostic tests for each team were counted in this
section.
Table 6 – Costs with diagnostic tests, per group
3.3. Leadership and teamwork: self-assessment (post-
simulation survey) Immediately after the simulation scenario, students were asked to fill a questionnaire (annex
1) to assess their perception of the group’s leadership and teamwork actions during the
scenario. All the eighty-five students completed the questionnaire, composed of five
questions answered through a Likert scale from one to five.
Group Spent money on diagnostic tests
A 57,42 €
B 26,00 €
C 31,45 €
D 29,70 €
E 87,52 €
F 61,92 €
G 52,65 €
H 61,32 €
I 51,37 €
J 55,52 €
K 41,47 €
L 104,20 €
M 35,62 €
N 70,12 €
O 91,87 €
P 22,00 €
AVG 55,01 €

24
Table 7 – Self-assessment of leadership and teamwork, per group, based on surveys for each team member
(Greener tones indicate better performance than the yellow average. Red indicates the opposite)
3.4. Leadership and teamwork: external assessment (video
analysis) One analyst watched the recorded videos – total duration of six hours and eleven minutes –
without having access to the students’ self-assessment, neither to other metrics of this study
during his assessment.
This process had three objectives:
I. Classify the groups with one predominant leadership style;
II. Assess the group’s leadership and teamwork actions with the same self-assessment
questionnaire students were asked to answer;
III. Assess the group’s leadership and teamwork skills based on a different scale, in order
to gather more data, according to Zaccaro et al, 2001.
Group
Did you feel that there
was a clear leadership
of the team in all
moments?
Did you feel that tasks
were clearly assigned
and distributed?
Did you feel all team
members participated actively in
case resolution?
Did you feel the team
communicated
effectively?
Did team members asked for group's
opinions?
GROUP AVERAGE
A 2,4 3,2 3,8 3,6 4,4 3,48
B 2 2,17 3,67 2,5 3,83 2,83
C 3 2,8 3,4 3,6 4,2 3,4
D 2,25 2 3,25 3,75 4,5 3,15
E 3 2,6 4,2 3,4 4,6 3,56
F 3 2,8 4,4 3,6 4,4 3,64
G 3 2,43 3,71 3,14 4,43 3,34
H 2,86 3,29 4,43 3,57 4,43 3,71
I 3,57 4 4 3 3,43 3,6
J 2,2 2,8 3,8 2,8 3,4 3
K 2,8 2,6 4,2 3,6 4,4 3,52
L 2,8 2,8 4,6 4,2 4,6 3,8
M 2,4 3 4,2 2,6 4,2 3,28
N 2,4 2,4 3,2 2,8 4,4 3,04
O 4 4,2 4,4 4,2 4,6 4,28
P 2,5 4 4,75 4,5 4,75 4,1
Question average
2,76 2,94 4,00 3,43 4,29 3,48
25
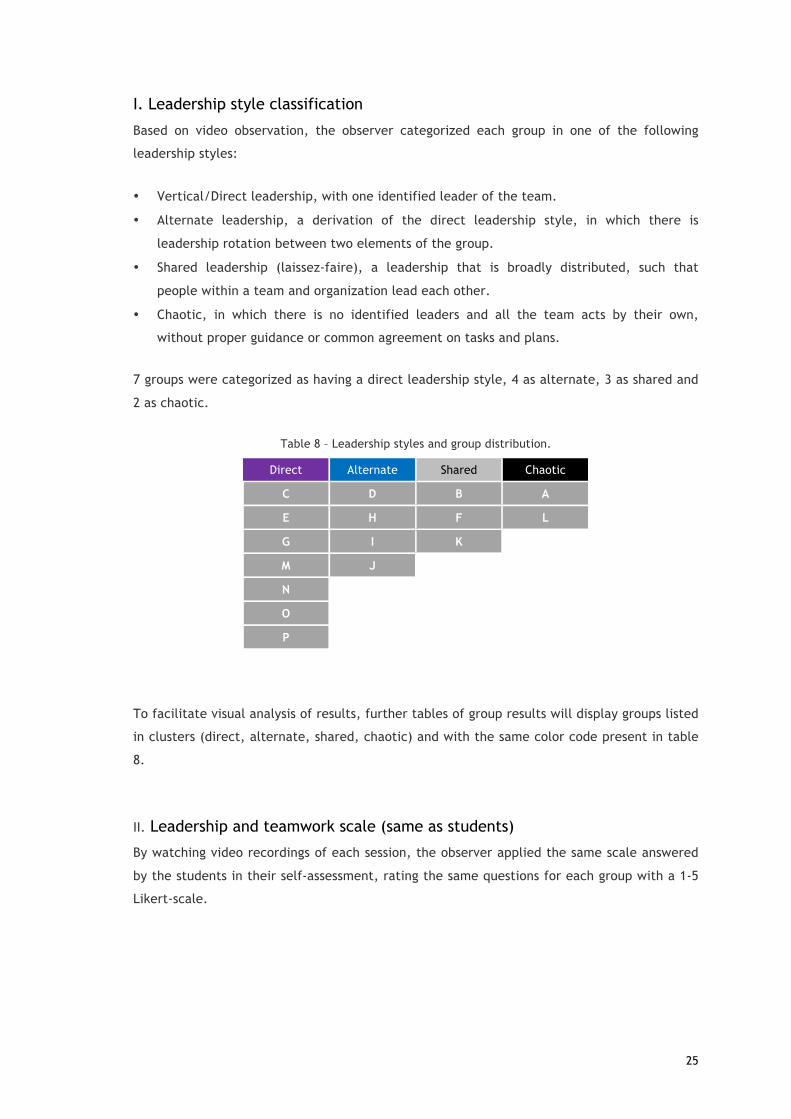
I. Leadership style classification
Based on video observation, the observer categorized each group in one of the following
leadership styles:
• Vertical/Direct leadership, with one identified leader of the team.
• Alternate leadership, a derivation of the direct leadership style, in which there is
leadership rotation between two elements of the group.
• Shared leadership (laissez-faire), a leadership that is broadly distributed, such that
people within a team and organization lead each other.
• Chaotic, in which there is no identified leaders and all the team acts by their own,
without proper guidance or common agreement on tasks and plans.
7 groups were categorized as having a direct leadership style, 4 as alternate, 3 as shared and
2 as chaotic.
Table 8 – Leadership styles and group distribution.
Direct Alternate Shared Chaotic
C D B A
E H F L
G I K M J
N O P
To facilitate visual analysis of results, further tables of group results will display groups listed
in clusters (direct, alternate, shared, chaotic) and with the same color code present in table
8.
II. Leadership and teamwork scale (same as students)
By watching video recordings of each session, the observer applied the same scale answered
by the students in their self-assessment, rating the same questions for each group with a 1-5
Likert-scale.

26
Table 9 – Leadership and teamwork external assessment
(Greener tones indicate better performance than the yellow average. Red indicates the
opposite)
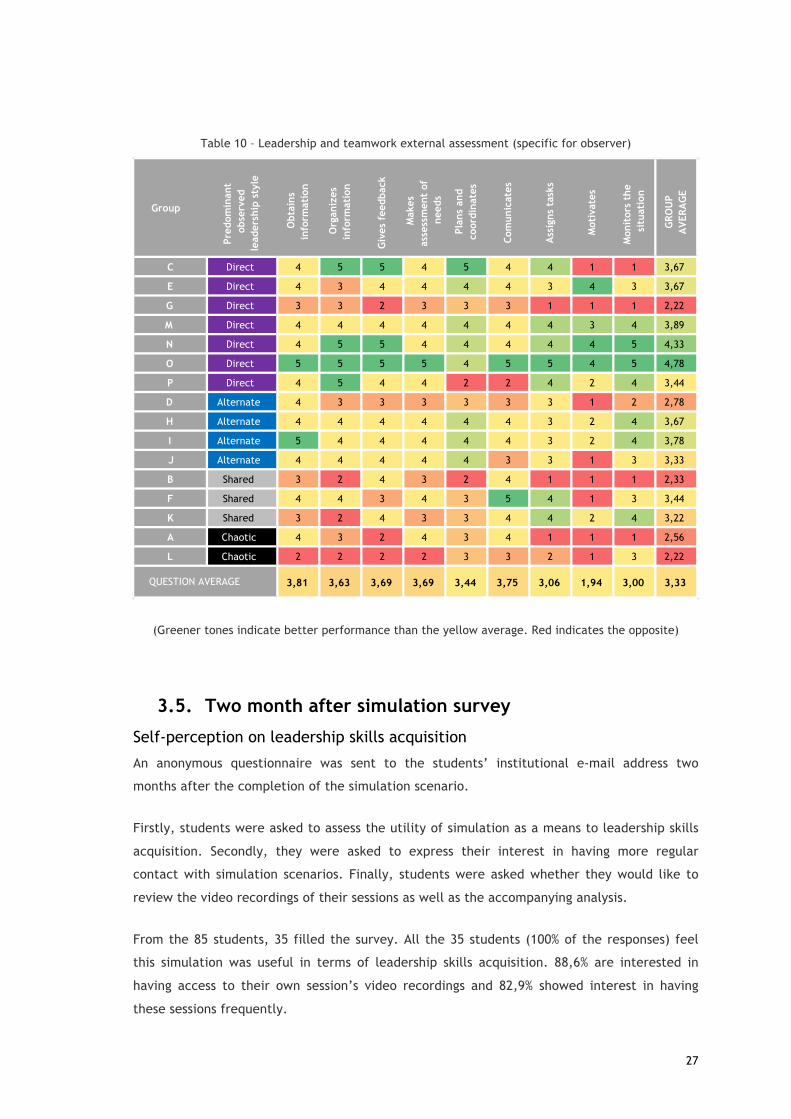
III. Leadership and teamwork scale (specific for the observer)
This results from the application of a 1-5 likert-scale, based on video observation, according
to Zaccaro et al, 2001, translated into three parameters each:
• Information search and structuring:
o Data acquisition
o Organization and structuring of data
o Information feedback
• Information use in problem solving:
o Identification of additional needs and restrictions
o Planning and coordination
o Communication
• Managing resources:
o Assigning tasks to team members
o Motivation
o Monitoring
OBSERVADOR
Group
Pred
omin
ant
obse
rved
le
ader
ship
sty
le
Did you feel that there
was a clear leadership
of the team in all
moments?
Did you feel that tasks
were clearly assigned
and distributed?
Did you feel all team
members participated actively in
case resolution?
Did you feel the team
communicated
effectively?
Did team members asked for group's
opinions?
GROUP AVERAGE
C Direct 4 4 3 5 4 4
E Direct 3 3 4 3 4 3,4
G Direct 3 1 4 3 4 3
M Direct 4 3 4 3 4 3,6
N Direct 3 4 4 4 4 3,8
O Direct 5 4 5 5 4 4,6
P Direct 2 4 4 3 3 3,2
D Alternate 2 2 3 3 3 2,6
H Alternate 3 3 4 4 4 3,6
I Alternate 4 4 4 4 4 4
J Alternate 2 3 4 3 4 3,2
B Shared 3 3 3 4 4 3,4
F Shared 2 3 5 5 5 4
K Shared 3 2 4 3 4 3,2
A Chaotic 1 2 4 2 3 2,4
L Chaotic 2 2 4 3 3 2,8
2,88 2,94 3,94 3,56 3,81 3,43QUESTION AVERAGE
27
Table 10 – Leadership and teamwork external assessment (specific for observer)
(Greener tones indicate better performance than the yellow average. Red indicates the opposite)
3.5. Two month after simulation survey
Self-perception on leadership skills acquisition
An anonymous questionnaire was sent to the students’ institutional e-mail address two
months after the completion of the simulation scenario.
Firstly, students were asked to assess the utility of simulation as a means to leadership skills
acquisition. Secondly, they were asked to express their interest in having more regular
contact with simulation scenarios. Finally, students were asked whether they would like to
review the video recordings of their sessions as well as the accompanying analysis.
From the 85 students, 35 filled the survey. All the 35 students (100% of the responses) feel
this simulation was useful in terms of leadership skills acquisition. 88,6% are interested in
having access to their own session’s video recordings and 82,9% showed interest in having
these sessions frequently.
Group
Pred
omin
ant
obse
rved
le
ader
ship
sty
le
Obt
ains
in
form
atio
n
Org
aniz
es
info
rmat
ion
Giv
es f
eedb
ack
Mak
es
asse
ssm
ent
of
need
s
Plan
s an
d co
ordi
nate
s
Com
unic
ates
Ass
igns
tas
ks
Mot
ivat
es
Mon
itor
s th
e si
tuat
ion
GRO
UP
AVE
RAG
E
C Direct 4 5 5 4 5 4 4 1 1 3,67
E Direct 4 3 4 4 4 4 3 4 3 3,67
G Direct 3 3 2 3 3 3 1 1 1 2,22
M Direct 4 4 4 4 4 4 4 3 4 3,89
N Direct 4 5 5 4 4 4 4 4 5 4,33
O Direct 5 5 5 5 4 5 5 4 5 4,78
P Direct 4 5 4 4 2 2 4 2 4 3,44
D Alternate 4 3 3 3 3 3 3 1 2 2,78
H Alternate 4 4 4 4 4 4 3 2 4 3,67
I Alternate 5 4 4 4 4 4 3 2 4 3,78
J Alternate 4 4 4 4 4 3 3 1 3 3,33
B Shared 3 2 4 3 2 4 1 1 1 2,33
F Shared 4 4 3 4 3 5 4 1 3 3,44
K Shared 3 2 4 3 3 4 4 2 4 3,22
A Chaotic 4 3 2 4 3 4 1 1 1 2,56
L Chaotic 2 2 2 2 3 3 2 1 3 2,22
3,81 3,63 3,69 3,69 3,44 3,75 3,06 1,94 3,00 3,33QUESTION AVERAGE
28
4. Analysis and integration of results Groups were categorized by leadership style observed by the video reporter, then each
leadership style was evaluated in two main areas: leadership and teamwork; efficiency and
performance.
4.1. Leadership and teamwork
Self-assessment
As it was described above, self-assessment of leadership and teamwork relied on the
evaluation of the self-awareness of leadership, clear distribution and assignment of tasks,
active participation of the entire team, effective communication and integration of team’s
opinions.
In the first question, only the direct leadership groups rated (2,90) above the average (2,79)
in having a clear self-perception of leadership. Chaotic and shared groups rated the same
2.60 points.
As for task division and assignment, direct leadership groups rated themselves higher with an
average of 3,06 points. On the other hand, shared leadership groups rated themselves the
lowest, with an average of 2,52 points in this question. Global average was 2,95 points.
In active participation of the team’s members, chaotic and shared leadership groups rated
themselves above global average (4,00) with 4,20 and 4,09 points, respectively. Below
average were direct and alternate leadership groups with 3,98 and 3,87 points.
In the self-assessment of communication, differences were more pronounced, chaotic groups
participants rated themselves with an average of 3,90 points, the highest score, and shared
leadership rated themselves with an average of 3,23 points, the lowest. The global average
was 3,39 points.
Finally, regarding integration of group’s opinions, chaotic groups rated themselves higher
with 4,50 points and alternate leadership groups rated themselves the lowest with an average
of 3,94 points. Global average was 4,26.
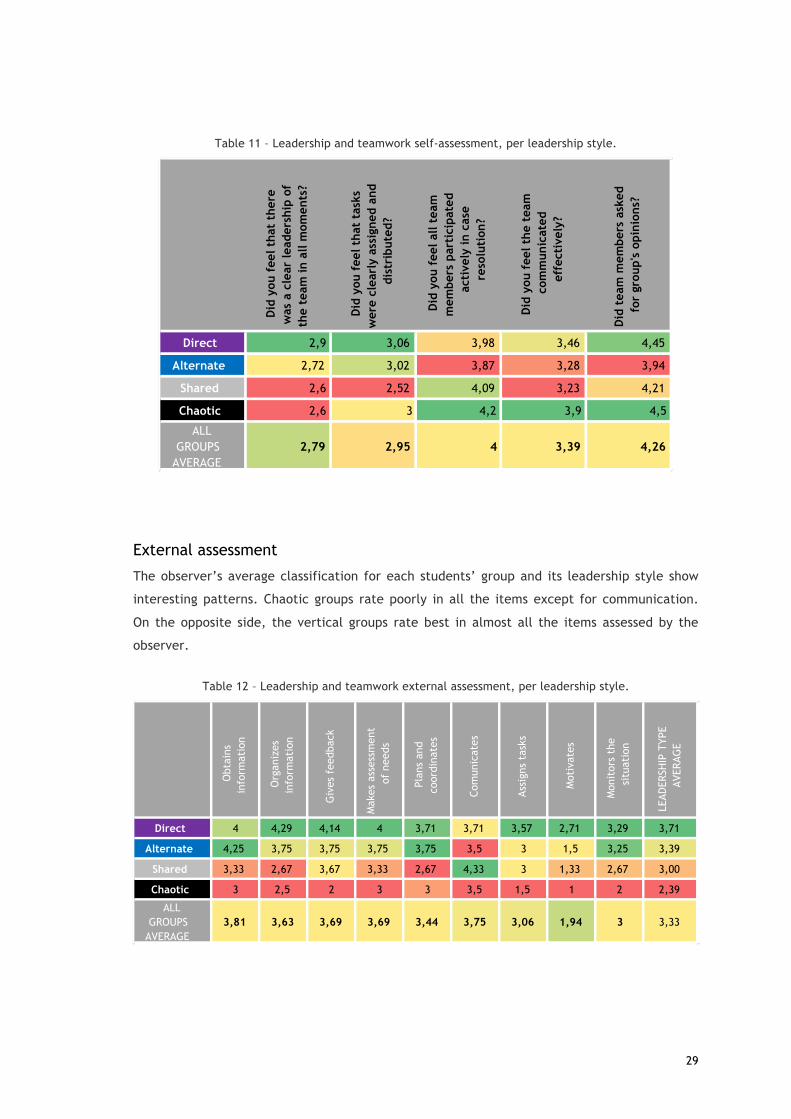
29
Table 11 – Leadership and teamwork self-assessment, per leadership style.
External assessment
The observer’s average classification for each students’ group and its leadership style show
interesting patterns. Chaotic groups rate poorly in all the items except for communication.
On the opposite side, the vertical groups rate best in almost all the items assessed by the
observer.
Table 12 – Leadership and teamwork external assessment, per leadership style.
Did
you f
eel that t
here
was a
cle
ar leadership
of
the t
eam
in a
ll m
om
ents?
Did
you f
eel that t
asks
were c
learly
assig
ned a
nd
dis
trib
uted?
Did
you f
eel all t
eam
mem
bers p
artic
ipated
activ
ely
in c
ase
resolu
tio
n?
Did
you f
eel the t
eam
com
munic
ated
eff
ectiv
ely
?
Did
team
mem
bers a
sked
for g
roup's
opin
ions?
Direct 2,9 3,06 3,98 3,46 4,45
Alternate 2,72 3,02 3,87 3,28 3,94
Shared 2,6 2,52 4,09 3,23 4,21
Chaotic 2,6 3 4,2 3,9 4,5
ALL GROUPS
AVERAGE2,79 2,95 4 3,39 4,26
Obt
ains
in
form
atio
n
Org
aniz
es
info
rmat
ion
Giv
es f
eedb
ack
Mak
es a
sses
smen
t of
nee
ds
Plan
s an
d co
ordi
nate
s
Com
unic
ates
Assi
gns
task
s
Mot
ivat
es
Mon
itor
s th
e si
tuat
ion
LEAD
ERSH
IP T
YPE
AVER
AGE
Direct 4 4,29 4,14 4 3,71 3,71 3,57 2,71 3,29 3,71
Alternate 4,25 3,75 3,75 3,75 3,75 3,5 3 1,5 3,25 3,39
Shared 3,33 2,67 3,67 3,33 2,67 4,33 3 1,33 2,67 3,00
Chaotic 3 2,5 2 3 3 3,5 1,5 1 2 2,39
ALL GROUPS
AVERAGE3,81 3,63 3,69 3,69 3,44 3,75 3,06 1,94 3 3,33

30
Graphic 3 – Leadership and teamwork external assessment, per leadership style
Differential between perception of leadership and its external assessment
There is a higher differential between self and external assessment in chaotic groups. For the
others, the average rates are similar.
Table 13 – Differential between external and self-assessment.
0
0,5
1
1,5
2
2,5
3
3,5
4
4,5Obtainsinformation
Organizesinformation
Givesfeedback
Makesassessmentofneeds
PlansandcoordinatesComunicates
Assignstasks
Motivates
Monitorsthesituation
Externalassessmentofleadership,foreachleadershipstyle
Vertical Alternate Shared Chaotic
Self-assessment global average
External assessment global average Difference
Direct 3,57 3,54 0,04Alternate 3,37 3,03 0,33Shared 3,33 3 0,33Chaotic 3,64 2,47 1,17

31
4.2. Efficiency and performance
Metrics concerning times and system interactions
Graphic 4 – Metrics related with time and interactions with the system
HowteamworkandleadershiprelateswithsysteminteractionsGroups with alternate and vertical style of leadership asked first for EKG and Chest X-ray,
considered important for our scenario. Groups classified as chaotic took longer to ask for
those diagnostic tests. They made more text entries, related with the clinical history and
performed more clinical procedures.
Diagnostic tests: costs and time
In terms of costs with diagnostic tests, groups categorized by the observer as chaotic spent
more money than the other leadership styles. Also, they do not identify the right diagnosis
during the simulation. Direct leadership groups appear to take more time than the other two
to achieve the right diagnosis.
0
2
4
6
8
10
12
Time to first contact to simEHR (min)
Time to first order (min)
# Diagnostic test requisitions
Number of history entriesTotal procedures
Time to EKG (min)
Time to chest xray (min)
Simulated electronic health records - some metrics
Vertical Alternate Shared Chaotic
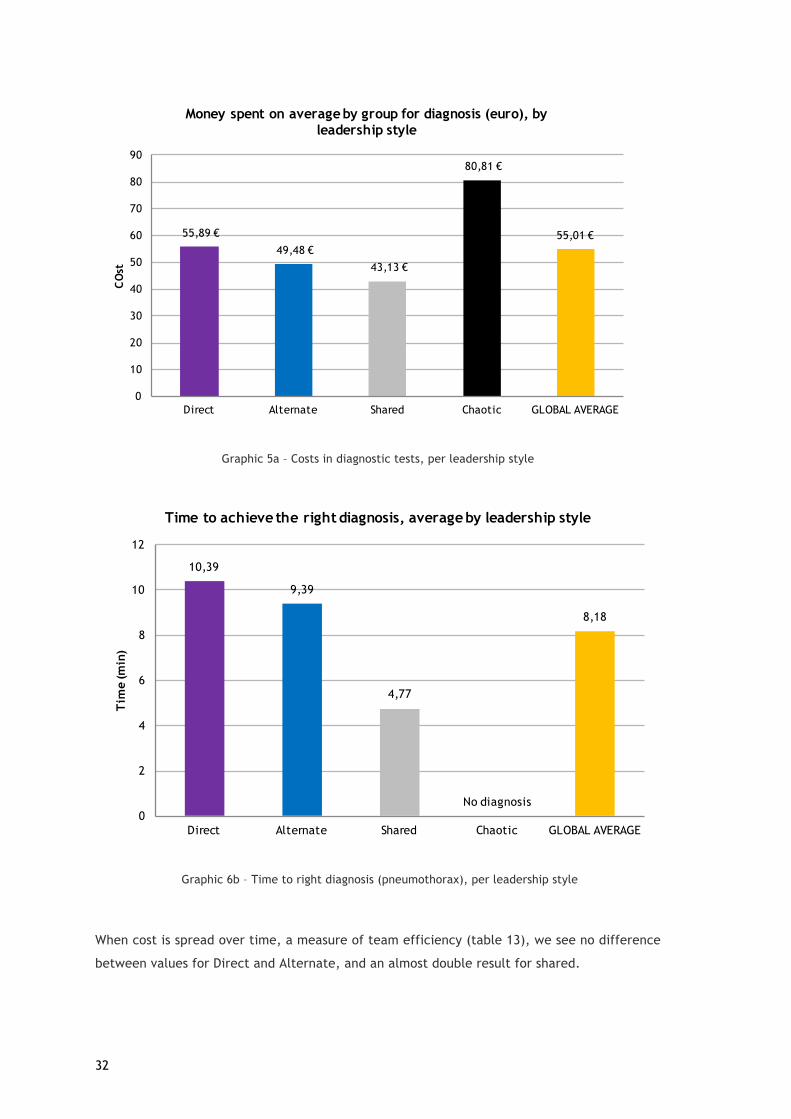
32
Graphic 5a – Costs in diagnostic tests, per leadership style
Graphic 6b – Time to right diagnosis (pneumothorax), per leadership style
When cost is spread over time, a measure of team efficiency (table 13), we see no difference
between values for Direct and Alternate, and an almost double result for shared.
55,89 €
49,48 €
43,13 €
80,81 €
55,01 €
0
10
20
30
40
50
60
70
80
90
Direct Alternate Shared Chaotic GLOBAL AVERAGE
CO
stMoney spent on average by group for diagnosis (euro), by
leadership style
10,39
9,39
4,77
No diagnosis
8,18
0
2
4
6
8
10
12
Direct Alternate Shared Chaotic GLOBAL AVERAGE
Tim
e (m
in)
Time to achieve the right diagnosis, average by leadership style

33
Table 14 – Cost/time, per leadership style.
Coluna1 Coluna2 Coluna3 Coluna4 Coluna5 Coluna6Direct Alternate Shared Chaotic Average
Cost(€) 55,89€ 49,48€ 43,13€ 80,81€ 55,01€Time(min) 10,39 9,39 4,77 N/ACost/time 5,38€ 5,27€ 9,04€ N/A

34
5. Discussion In this observational study, using a mixed methodology, the sample was composed of
individuals with ages between 21 and 36 years. 35% of the participants have had a previous
higher education experience, before entering medical school. Some of these participants
were also previously employed for more than six months, which theoretically has been
associated with a better capacity to organize and manage teamwork. This confirms the
researched literature, by stating differences in terms of leadership for experienced and non-
experienced workers. As in Portugal we have a college entry system, there is a lack of studies
considering this particular situation, as many countries have different access systems to
medical school.
It was possible to establish an association with time-related efficiency metrics with the
leadership style present in each group. Direct and alternate leadership groups have better
external assessments on leadership and teamwork skills. Groups categorized as chaotic did
not reach a final diagnosis neither could solve the diagnosis nor treat the simulated patient at
their responsibility. Chaotic groups also spent significantly more money. The higher number of
system interactions, sometimes repeated, can support the attribution of this categories to the
groups. These number of interactions, in a real situation, could have brought higher costs to
the team when compared with other teams categorized with the remaining three leadership
styles. Concerning time to diagnosis, despite chaotic groups (who don’t reach the right
diagnosis), direct leadership groups take longer to get to it. This might be explained by direct
leaders who might not share that much information, not enabling their team members to
cooperate in the clinical reasoning process. We could not find enough literature on this topic,
so further studies might be needed.
With a restricted sample it is difficult to conclude which is the most efficient leadership style
to this scenario. Nevertheless, we can infer that the alternate leadership style resulted in
better clinical indicators, e.g., time to diagnosis, time to key diagnostic tests.
Regarding questionnaires answered immediately after the simulation, they promote a self-
critic and reflection about the performance of the team. This is also verified during the
debriefing, which was not the focus of the present study, but was observed by the author. It
is curious to note that chaotic groups have an optimistic perception of their performance,
probably due to a higher degree of active, though unorganized, participation. This might be
explained by less self-awareness/critical thinking capabilities in those groups (Laura, P. et al,
2006). Special focus should be given to these groups in order to promote self-awareness on
leadership skills.
35
Medical students at UBI are more familiar with simulation than probably any other medical
students in Portugal. This is important and evident during the study’s simulations, particularly
noted in easeful and smooth procedure execution. Simulations, as live experiments, are an
essential component of hands-on learning.
Depending on the organization of each group concerning task allocation, led by the
participants before the initiation of the simulation, the interaction with the system differed.
It is important to note that while there were groups highly dependent on the system, who
would wait for the diagnostic tests results and sometimes forgetting the patient’s physical
examination or monitoring, opposite groups were also observed.
Any of these cases reveals a lack of teaching in this area, confirming the reviewed literature
(Schenarts, P. et al). This demands for leadership teaching.
It is also important to note that different action triggers (family, patient clinical status
change, phone interactions, etc.) were important leadership shifters. Even though some
groups made task distributions before starting the scenario, those factors were important “ice
breakers”, in terms of leadership patterns. Simulation is particularly important for this
objective, so that teams can better understand their leadership individual profiles.
However, in some cases, the perception of high fidelity in a simulation scenario is only
supported by the physical presence of a patient simulator, leaving the scenario too focused
on the “robot”, while context and non-technical skills are disregarded.
The used systems (simulated EHR, video and questionnaires) gather an immense amount of
data that, when integrated, reveal an outstanding quantity of useful information. However,
there is a lack of evidence on how can a researcher dig in this complex field (Schenarts, P. et
al). Further studies will be needed to assess and validate this kind of frameworks.
In summary and addressing the four research questions:
• Teamwork and leadership does not occur spontaneously. It has to be learned and
rehearsed and simulation is an excellent tool for teaching, rehearsing and analyzing
team performance. Introduced action triggers offer realistic training opportunities
that were linked to observable team processes and performance metrics. Debriefing
sessions followed each simulation. Discussion on team dynamics and interactions at
team level occurred, allowing team members to have a comprehensive view on team
process issues and to develop a shared mental model of the team’s performance, as
suggested by Murphy, M et. al. Teams were able to identify which processes worked
and decide on strategies to improve future performance. The same author suggests
that training was associated with timelier decision making as teams recognize critical
36
events earlier and initiated interventions in a time critical manner. In fact, students
claim to have learned by these simulation sessions.
• It is possible to introduce an information system to manage this process. In fact, after
this experience it’s difficult to imagine how such amount of useful data could be
obtained without the used systems. Information systems give us the ability to improve
quality of data and capacity to work on that data, extracting useful metrics and
analysis.
• Despite the small sample of this study, differences were found regarding self-
assessment and external assessment for chaotic groups, who rated themselves higher
than the external observer did. Previously published results by Rudy et al. (2001) and
Bryan et al. (2005) demonstrated that student leaders consistently scored themselves
lower than their peers on many aspects of leadership, including altruism, compassion,
integrity, accountability, commitment to excellence, and self-reflection. Several
reasons may account for this discrepancy in self- and peer evaluation of student
leaders. Self-evaluation scores may be lower than peer scores because student
leaders lack self-confidence in their own leadership abilities. Medical students find it
difficult to be objective when evaluating their own performance (Laura, P. et al,
2006). Despite these considerations, the simple fact of promoting this individual
critical reflection adds enormous value, when combined to a post simulation
debriefing for all team members.
• This study showed the urgent necessity for the creation of systems that analyze
training activities, around the clock and with powerful analytics engines. Such could
allow prospective and retrospective studies based on clinical outcomes on a medium
and long term. In the next section, supported by all the apprenticeship provided by
this research, it is outlined some requirements, objectives and design considerations
on how an integrated information system to manage this process could be.

37
5.1. Future work: a model for an integrated Leadership
Learning System (LLS)?
It was outlined the main objectives, requirements and design of a possible integrated
information system to manage leadership learning (LLS). The keys for success are integration
and power analytics engines. It was envisioned a system that could integrate all the steps of a
simulation-based curriculum (pre-simulation, during simulation, immediate post-simulation,
debrief and follow-up), in a longitudinal way. This way, data analysis can be facilitated
promoting retrospective evaluation and prospective identification and planning for needed
training, according to each trainee profile, along the time.
Objectives
Table 15 – LLS objectives.
OBJECTIVES
Train/Assessment Test Compare Leadership Processes Personal development Teamwork Systems’ usability Team performance
Clinical competencies Faculties and Hospitals Clinical reasoning Clinical Scenarios
Compliance with processes User experiences Conflict management Processes
Costs Requirements
Table 16 – LLS requirements.
REQUIREMENTS Simulation Interaction Data Collection
Learners authentication system Patient configuration Data entries with timestamp
EHR with interoperability Case pre-sets Diagnostic tests and therapeutics with timestamp
Multidisciplinary integration (nurses, assistants, etc.) Library of diagnostic test results Diagnostics coded with HL7
Diagnostic test requisition and visualization Interactions with the system
Electronic prescription Prescription pattern analysis Cost calculation
Voice: - Number of different
voices - Dominant voice
Video: - Movement patterns
(color stick in learners back)
- Gestures and posture tracking
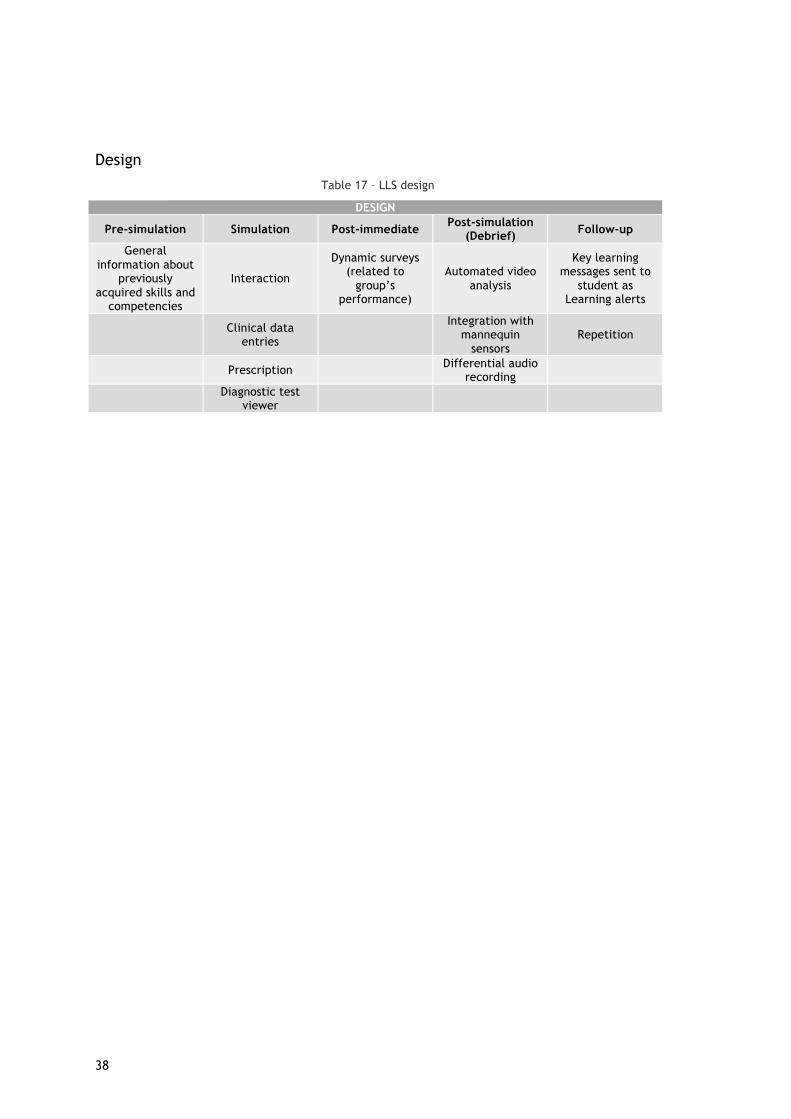
38
Design Table 17 – LLS design
DESIGN
Pre-simulation Simulation Post-immediate Post-simulation (Debrief) Follow-up
General information about
previously acquired skills and
competencies
Interaction
Dynamic surveys (related to
group’s performance)
Automated video analysis
Key learning messages sent to
student as Learning alerts
Clinical data entries
Integration with mannequin
sensors Repetition
Prescription Differential audio recording
Diagnostic test viewer
39
6. Conclusions Healthcare costs have increased with the higher availability of expensive treatments and the
expansion of life expectancy, which means patient-centered care is the rule with patient
safety, teamwork and efficiency gaining even more relevance.
Higher degrees of professionalism and multi professionalism development within healthcare
workers are key to this challenge. Such skills are more important now as different health
professionals are involved in management roles. Biomedical simulation is a growing reality in
under and post-graduate contexts. With a high degree of realism, supported by high-fidelity
simulators executing a variety of behaviors and actions, simulation is gathering an increasing
number of followers.
In Covilhã, it was developed a Leadership and Health management curricula for medical
students, mandatory in the fifth year, and pioneer in Portugal. After ten year of experience,
it was decided to climb the Millers pyramid of competencies, introducing simulation as an
instrument of teaching. The attention was focused on the development of non-technical skills
and teamwork. In order to augment the fidelity and realism of the sessions, as well as
optimizing its maximum potential, a simulated EHR was developed.
Regarding the review conducted, leadership and management can use simulation as a way to
add value to the theoretical bases of teaching. It creates a more real context than what can
be though in lectures, with special importance to the debriefing as a way to reveal and tackle
failures and discover improvement opportunities. Although, in a global context, simulation is
most of the times used with the primary objective of technical competencies acquisition and
clinical reasoning, it is demonstrated by the present study that it is also possible to use these
same sessions placing the primary objective on leadership and teamwork skills training.
It was also proved to be possible the introduction of an information system, not only to
support this process, as to add value as a factor augmenting fidelity and easing interaction
between trainees and educators. Serving as an electronic health records tool, useful as a
means of communication and perpetuating information, but placing the focus on learning with
the measurement of several indicators, we can prove the role this system can have in
learning.
In fact, this is the approach, in some way, reported in the literature, although most of the
times a real system is used with a black database. In this case, important data is lost.
Using this system made it possible to collect self and external perceptions of leadership in our
study groups. Differences were found regarding chaotic groups, who rated themselves higher
than the other groups.

40
On the other hand, as explained in the discussion, the existence of a simulated software for
electronic health records can be an important source for software training, user experience
testing and, of course, development of clinical reasoning competencies.
In Portugal, being one of the OCDE countries with most evolved healthcare IT solutions,
having a pioneering public healthcare system, we are in the perfect ecosystem to introduce
solutions such as the one reported in this study, early in the curriculum of medical students
and even extend it two post-graduate context. In this way, professionals can become more
efficient and important conclusions may be gather to influence future developments.

41
7. References
Abbas, M. R., Quince, T. a, Wood, D. F., & Benson, J. a. (2011). Attitudes of medical students to medical leadership and management: a systematic review to inform curriculum development. BMC Medical Education, 11(1), 93. http://doi.org/10.1186/1472-6920-11-93
Bloice, M. D., Simonic, K.-M., & Holzinger, A. (2014). Casebook: a virtual patient iPad application for teaching decision-making through the use of electronic health records. BMC Medical Informatics and Decision Making, 14(1), 66. http://doi.org/10.1186/1472-6947-14-66
Briggs, A., Raja, A. S., Joyce, M. F., Yule, S. J., Jiang, W., Lipsitz, S. R., & Havens, J. M. (2015). The role of nontechnical skills in simulated trauma resuscitation. Journal of Surgical Education, 72(4), 732–739. http://doi.org/10.1016/j.jsurg.2015.01.020
Chen, Y., Carroll, R. J., Hinz, E. R. M., Shah, A., Eyler, A. E., Denny, J. C., & Xu, H. (2013). Applying active learning to high-throughput phenotyping algorithms for electronic health records data. Journal of the American Medical Informatics Association, 20(e2), 1–7. http://doi.org/10.1136/amiajnl-2013-001945
Cheng, A., Eppich, W., Grant, V., Sherbino, J., Zendejas, B., & Cook, D. A. (2014). Debriefing for technology-enhanced simulation: A systematic review and meta-analysis. Medical Education, 48(7), 657–666. http://doi.org/10.1111/medu.12432
Cortegiani, A., Russotto, V., Montalto, F., Iozzo, P., Palmeri, C., Raineri, S. M., & Giarratano, A. (2015). Effect of High-Fidelity Simulation on Medical Students’ Knowledge about Advanced Life Support: A Randomized Study. PloS One, 10(5), e0125685. http://doi.org/10.1371/journal.pone.0125685
Erdogan, A., Dong, Y., Chen, X., Schmickl, C., Sevilla Berrios, R. A., Garcia Arguello, L. Y., … O’Horo, J. C. (2016). Development and validation of clinical performance assessment in simulated medical emergencies: an observational study. BMC Emergency Medicine, 16(1), 4. http://doi.org/10.1186/s12873-015-0066-x
Farri, O., Pieckiewicz, D. S., Rahman, A. S., Adam, T. J., Pakhomov, S. V, & Melton, G. B. (2012). A qualitative analysis of EHR clinical document synthesis by clinicians. AMIA ... Annual Symposium Proceedings / AMIA Symposium. AMIA Symposium, 2012(11), 1211–20. Retrieved from http://www.pubmedcentral.nih.gov/articlerender.fcgi?artid=3540510&tool=pmcentrez&rendertype=abstract
Fernandez Castelao, E., Boos, M., Ringer, C., Eich, C., & Russo, S. G. (2015). Effect of CRM team leader training on team performance and leadership behavior in simulated cardiac arrest scenarios: a prospective, randomized, controlled study. BMC Medical Education, 15(1), 116. http://doi.org/10.1186/s12909-015-0389-z
Fletcher, G., Flin, R., McGeorge, M., Glavin, R., Maran, N., & Patey, R. (2003). Anaesthetists’ non-technical skills (ANTS): Evaluation of a behavioural marker system. British Journal of Anaesthesia, 90(5), 580–588. http://doi.org/10.1093/bja/aeg112
Hu, Y.-Y., Parker, S. H., Lipsitz, S. R., Arriaga, A. F., Peyre, S. E., Corso, K. A., … Greenberg, C. C. (2015). Surgeons’ Leadership Styles and Team Behavior in the Operating Room. Journal of the American College of Surgeons, 222(1), 41–51. http://doi.org/10.1016/j.jamcollsurg.2015.09.013
Huettermann, H., Doering, S., & Boerner, S. (2014). Leadership and team identification: Exploring the followers’ perspective. Leadership Quarterly, 25(3), 413–432. http://doi.org/10.1016/j.leaqua.2013.10.010
Humbert, A. J., Besinger, B., & Miech, E. J. (2011). Assessing clinical reasoning skills in scenarios of uncertainty: Convergent validity for a script concordance test in an emergency medicine clerkship and residency. Academic Emergency Medicine, 18(6), 627–634. http://doi.org/10.1111/j.1553-2712.2011.01084.x

42
Jansen, D. A. (2014). Student perceptions of electronic health record use in simulation. Journal of Nursing Education and Practice, 4(9), 163–172. http://doi.org/10.5430/jnep.v4n9p163
Jarodzka, H., Balslev, T., Holmqvist, K., Nyström, M., Scheiter, K., Gerjets, P., & Eika, B. (2012). Conveying clinical reasoning based on visual observation via eye-movement modelling examples. Instructional Science, 40(5), 813–827. http://doi.org/10.1007/s11251-012-9218-5
Jorge, M. L. da S. G., Coelho, I. C. M., Paraizo, M. M., & Paciornik, E. F. (2014). Leadership, management and teamwork learning through an extra-curricular project for medical students: descriptive study. Sao Paulo Medical Journal = Revista Paulista de Medicina, 132(5), 303–306. http://doi.org/10.1590/1516-3180.2014.1325685
Kiesewetter, J., Schmidt-Huber, M., Netzel, J., Krohn, A. C., Angstwurm, M., & Fischer, M. R. (2013). Training of leadership skills in medical education. GMS Zeitschrift Für Medizinische Ausbildung, 30(4), Doc49. Retrieved from http://www.pubmedcentral.nih.gov/articlerender.fcgi?artid=3839077&tool=pmcentrez&rendertype=abstract
Kolbe, M., Grande, B., & Spahn, D. R. (2015). Briefing and debriefing during simulation-based training and beyond: Content, structure, attitude and setting. Best Practice and Research: Clinical Anaesthesiology, 29(1), 87–96. http://doi.org/10.1016/j.bpa.2015.01.002
Kononowicz, A. A., Zary, N., Edelbring, S., Corral, J., & Hege, I. (2015). Virtual patients--what are we talking about? A framework to classify the meanings of the term in healthcare education. BMC Medical Education, 15(1), 11. http://doi.org/10.1186/s12909-015-0296-3
Kuhn, T. M., Barr, M. S., & Gardner, L. A. (2010). EHR- Based Quality Measurement and Reporting: Critical for Meaningful Use and Health Care Improvement. The Medical Informatics Subcommittee of the American College of Physicians (ACP), (February 2010). Retrieved from http://www.acponline.org/acp_policy/policies/ehr_quality_measurement_critical_meaning_hc_2010.pdf
Landman, A. B., Redden, L., Neri, P., Poole, S., Horsky, J., Raja, A. S., … Poon, E. G. (2014). Using a medical simulation center as an electronic health record usability laboratory. Journal of the American Medical Informatics Association, 21(3), 558–563. http://doi.org/10.1136/amiajnl-2013-002233
Levett-Jones, T., & Lapkin, S. (2013). A systematic review of the effectiveness of simulation debriefing in health professional education. Nurse Education Today, 34(6), e58–e63. http://doi.org/10.1016/j.nedt.2013.09.020
Lewis, R., Strachan, A., & Smith, M. M. (2012). Is high fidelity simulation the most effective method for the development of non-technical skills in nursing? A review of the current evidence. The Open Nursing Journal, 6, 82–9. http://doi.org/10.2174/1874434601206010082
March, C. a., Steiger, D., Scholl, G., Mohan, V., Hersh, W. R., & Gold, J. A. (2013). Use of simulation to assess electronic health record safety in the intensive care unit: a pilot study. BMJ Open, 3(4), e002549–e002549. http://doi.org/10.1136/bmjopen-2013-002549
March, C. a., Steiger, D., Scholl, G., Mohan, V., Hersh, W. R., & Gold, J. A. (2013). Use of simulation to assess electronic health record safety in the intensive care unit: a pilot study. BMJ Open, 3(4), e002549–e002549. http://doi.org/10.1136/bmjopen-2013-002549
Martins, H. M. G. (2010). Why management and leadership education for internists? European Journal of Internal Medicine, 21(5), 374–376. http://doi.org/10.1016/j.ejim.2010.04.014
Masters, K. (2015). The e-patient and medical students. Medical Teacher, (December), 1–3. http://doi.org/10.3109/0142159X.2015.1112896
Matson, Christine, Stephens, Mark, Steiner, Beat, Kozakowski, S. M. (2014). Electonic Health Records: How will Students Learn if they can’t Practice? Annals of Family Medicine, 12(6), 582–583. http://doi.org/10.1370/afm.1716.ELECTRONIC

43
Milano, C. E., Hardman, J. A., Plesiu, A., Rdesinski, R. E., & Biagioli, F. E. (2014). Simulated electronic health record (Sim-EHR) curriculum: teaching EHR skills and use of the EHR for disease management and prevention. Academic Medicine : Journal of the Association of American Medical Colleges, 89(3), 399–403. http://doi.org/10.1097/ACM.0000000000000149
Morgan, P. J., Kurrek, M. M., Bertram, S., LeBlanc, V., & Przybyszewski, T. (2011). Nontechnical Skills Assessment After Simulation-Based Continuing Medical Education. Simulation in Healthcare: The Journal of the Society for Simulation in Healthcare, 6(5), 255–259. http://doi.org/10.1097/SIH.0b013e31821dfd05
Motola, I., Devine, L. A., Chung, H. S., Sullivan, J. E., & Issenberg, S. B. (2013). Simulation in healthcare education: A best evidence practical guide. AMEE Guide No. 82. Medical Teacher, 35(10), e1511–e1530. http://doi.org/10.3109/0142159X.2013.818632
Murphy, M., Curtis, K., & McCloughen, A. (2015). What is the impact of multidisciplinary team simulation training on team performance and efficiency of patient care? An integrative review. Australasian Emergency Nursing Journal. http://doi.org/10.1016/j.aenj.2015.10.001
O’Meara, P., Munro, G., Williams, B., Cooper, S., Bogossian, F., Ross, L., … McClounan, M. (2015). Developing situation awareness amongst nursing and paramedicine students utilizing eye tracking technology and video debriefing techniques: A proof of concept paper. International Emergency Nursing, 23(2), 94–99. http://doi.org/10.1016/j.ienj.2014.11.001
Passmore, G. G. (2014). Concept Mapping as a Meaningful Learning Tool to Promote Conceptual Understanding and Clinical Reasoning for Resident and Distance Learning Students Concept Mapping as a Meaningful Learning Tool to Promote Conceptual Understanding and Clinical Reasoning f.
Pell, G., Homer, M., & Fuller, R. (2015). Investigating disparity between global grades and checklist scores in OSCEs. Medical Teacher, 37(December), 1106–1113. http://doi.org/10.3109/0142159X.2015.1009425
Quince, T., Abbas, M., Murugesu, S., Crawley, F., Hyde, S., Wood, D., & Benson, J. (2014). Leadership and management in the undergraduate medical curriculum: a qualitative study of students’ attitudes and opinions at one UK medical school. BMJ Open, 4(6), e005353. http://doi.org/10.1136/bmjopen-2014-005353
Radovich, P., Palaganas, J., Kiemeney, J., Strother, B., Bruneau, B., & Hamilton, L. (2011). Enhancing leadership orientation through simulation. Critical Care Nurse, 31(5), 58–63. http://doi.org/10.4037/ccn2011463
Sadideen, H., Weldon, S. M., Saadeddin, M., Loon, M., & Kneebone, R. (2016). A Video Analysis of Intra- and Interprofessional Leadership Behaviors Within “the Burns Suite”: Identifying Key Leadership Models. Journal of Surgical Education, 73(1), 31–39. http://doi.org/10.1016/j.jsurg.2015.09.011
Saitwal, H., Feng, X., Walji, M., Patel, V., & Zhang, J. (2010). Assessing performance of an Electronic Health Record (EHR) using Cognitive Task Analysis. International Journal of Medical Informatics, 79(7), 501–506. http://doi.org/10.1016/j.ijmedinf.2010.04.001
Schenarts, P. J., & Schenarts, K. D. (2012). Educational impact of the electronic medical record. Journal of Surgical Education, 69(1), 105–112. http://doi.org/10.1016/j.jsurg.2011.10.008
Schmutz, J., Eppich, W. J., Hoffmann, F., Heimberg, E., & Manser, T. (2014). Five steps to develop checklists for evaluating clinical performance: An integrative approach. Academic Medicine, 89(7), 996–1005. http://doi.org/10.1097/ACM.0000000000000289
Seidel, B. M., Campbell, S., & Bell, E. (2015). Evidence in clinical reasoning: a computational linguistics analysis of 789,712 medical case summaries 1983-2012. BMC Medical Informatics and Decision Making, 15(1), 19. http://doi.org/10.1186/s12911-015-0136-8

44
Sigalet, E., Donnon, T., Cheng, A., Cooke, S., Robinson, T., Bissett, W., & Grant, V. (2013). Development of a Team Performance Scale to Assess Undergraduate Health Professionals. Academic Medicine, 88(7), 989–996. http://doi.org/10.1097/ACM.0b013e318294fd45
Sigalet, E., Donnon, T., & Grant, V. (2012). Undergraduate students’ perceptions of and attitudes toward a simulation-based interprofessional curriculum: the KidSIM ATTITUDES questionnaire. Simulation in Healthcare : Journal of the Society for Simulation in Healthcare, 7(6), 353–8. http://doi.org/10.1097/SIH.0b013e318264499e
Skog, A., Peyre, S. E., Pozner, C. N., Thorndike, M., Hicks, G., & Dellaripa, P. F. (2012). Assessing Physician Leadership Styles: Application of the Situational Leadership Model to Transitions in Patient Acuity. Teaching and Learning in Medicine, 24(3), 225–230. http://doi.org/10.1080/10401334.2012.692269
Sousa, M., & Van Dierendonck, D. (2016). Introducing a short measure of shared servant leadership impacting team performance through team behavioral integration. Frontiers in Psychology, 6(January), 1–12. http://doi.org/10.3389/fpsyg.2015.02002
Steinemann, S., Kurosawa, G., Wei, A., Ho, N., Lim, E., Suares, G., … Berg, B. (2016). Role confusion and self-assessment in interprofessional trauma teams. The American Journal of Surgery, 211(2), 482–488. http://doi.org/10.1016/j.amjsurg.2015.11.001
Stephen J. Zaccaroa,*, A. L. R., & Michelle A. Marksb. (2001). Team leadership. The Leadership Quarterly, 12, 451–483. http://doi.org/10.1016/S1048-9843(01)00093-5
Stephenson, L. S., Gorsuch, A., Hersh, W. R., Mohan, V., & Gold, J. a. (2014). Participation in EHR based simulation improves recognition of patient safety issues. BMC Medical Education, 14(1), 224. http://doi.org/10.1186/1472-6920-14-224
Szulewski, A., & Howes, D. (2014). Combining first-person video and gaze-tracking in medical simulation: A technical feasibility study. The Scientific World Journal, 2014. http://doi.org/10.1155/2014/975752
Thinking, C., & Reasoning, C. (2010). Critical thinking and clinical reasoning. Pearsonhighered.com. Retrieved from http://www.pearsonhighered.com/berman-10e-info/assets/pdf/CH10.pdf
Weiner, J. P., Fowles, J. B., & Chan, K. S. (2012). New paradigms for measuring clinical performance using electronic health records. International Journal of Quality Health Care, 24(3), 200–205. http://doi.org/10.1093/intqhc/mzs011
Weller, J., Henderson, R., Webster, C. S., Shulruf, B., Torrie, J., Davies, E., … Merry, A. F. (2014). Building the Evidence on Simulation Validity. Anesthesiology, 120(January 2014), 142–148.
Westli, H. K., Johnsen, B. H., Eid, J., Rasten, I., & Brattebø, G. (2010). Teamwork skills, shared mental models, and performance in simulated trauma teams: an independent group design. Scandinavian Journal of Trauma, Resuscitation and Emergency Medicine, 18(1), 47. http://doi.org/10.1186/1757-7241-18-47
Wills, M. J., El-Gayar, O. F., & Deokar, A. V. (2012). Evaluating the Impact of Electronic Health Records on Clinical Reasoning Performance. 2012 45th Hawaii International Conference on System Sciences, 2830–2839. http://doi.org/10.1109/HICSS.2012.254
Wu, B., Wang, M., Johnson, J. M., & Grotzer, T. A. (2014). Improving the learning of clinical reasoning through computer-based cognitive representation. Medical Education Online, 19(1), 1–8. http://doi.org/10.3402/meo.v19.25940
Yu, T.-C., & Zhou, H. (2015). Benefits of applying a proxy eligibility period when using electronic health records for outcomes research: a simulation study. BMC Research Notes, 8, 229. http://doi.org/10.1186/s13104-015-1217-6

45
Annexes
ANNEX 1 – Post-simulation questionnaire
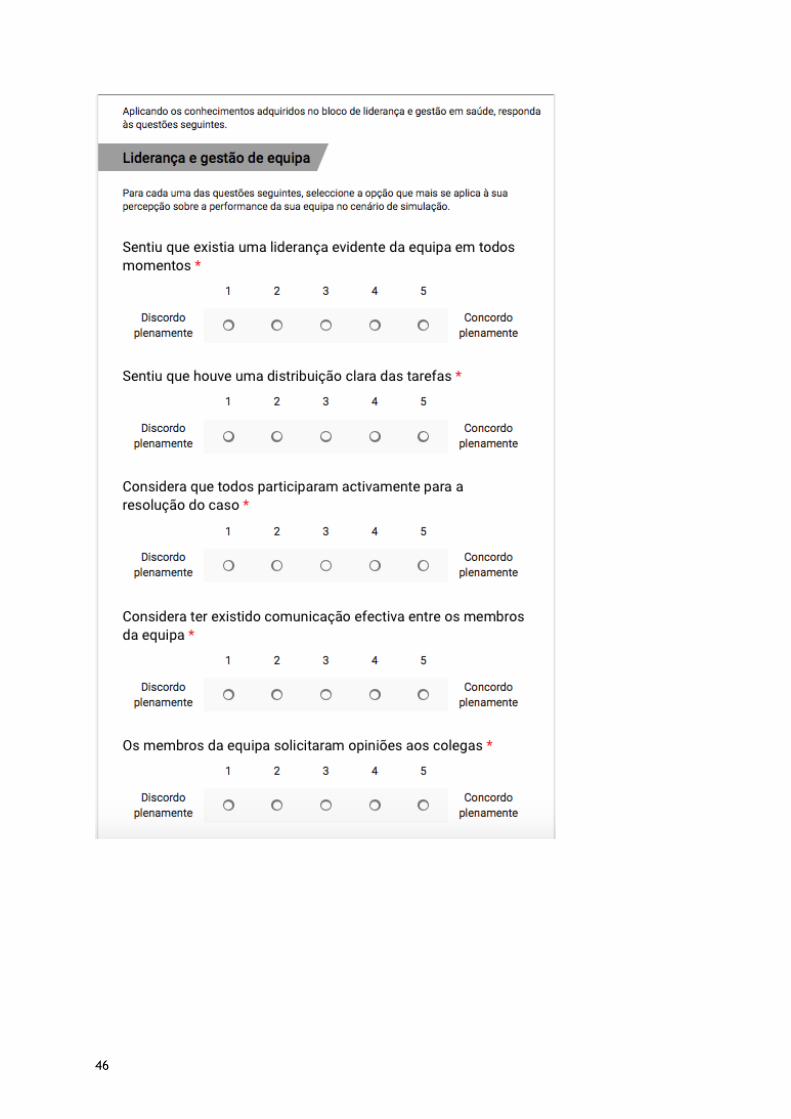
46
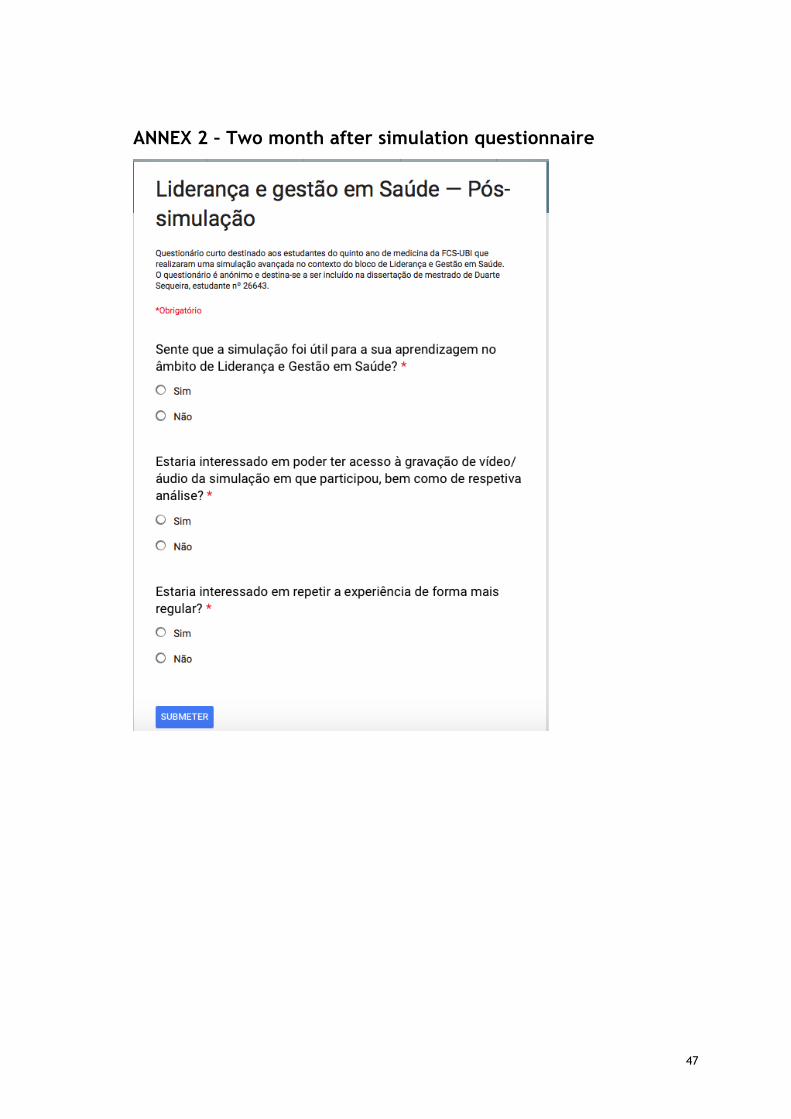
47
ANNEX 2 – Two month after simulation questionnaire