Use of Handheld XRF may2015 -...
21
Use of Handheld XRF Bruker Tracer III-SD Research Laboratories of Archaeology The University of North Carolina at Chapel Hill Lindsay Bloch Last updated June 2015
-
Upload
hoangxuyen -
Category
Documents
-
view
219 -
download
0
Transcript of Use of Handheld XRF may2015 -...

UseofHandheldXRFBrukerTracerIII-SD
ResearchLaboratoriesofArchaeologyTheUniversityofNorthCarolinaatChapelHill
LindsayBloch
LastupdatedJune2015

ThisguideisintendedtoorientuserstotheproperoperationofthehandheldXRFanalyzer,andtodetailmethodsforanalyzingarchaeologicalmaterials,especiallyceramics.TheinformationinthisguidehasbeencompiledfrommultiplesourcessuppliedbyBruker,aswellasinformationimpartedbyBrukerrepresentativesintrainingsessions,andDr.JeffSpeakman,DirectoroftheCenterforAppliedIsotopeStudies,UniversityofGeorgia.AlldocumentsreferencedinthisguidearelocatedinfolderBasicInformationontheDesktopofXRFlaptop.

TABLEOFCONTENTS
I. ANALYZERSPECIFICATIONS…………………………………………………….……………………………………….1II. SAFETY……………………………………………………….……………………………………………………………………1III. INSTRUMENTCOMPONENTSANDINVENTORY……………………………………….……………………….1 A.TheBrukerTracerIII-SDHandheldXRFAnalyzer…………………………….……………………………….1 B.VacuumPump……………………………………………………………………….…………………………..……..…….2 C.Computer…………………………..………………………………….………………………………………………....…….2 D.AuxiliaryEquipment…………………………………………………………………………………………………………2IV. BASICOPERATION………………………………………….………………………………………………….…………….3
A.Connecting……………………………………………………………………………………………………………………..3 B.S1PXRFProgram………………………………………………………………………………………..……………………4
i)Settings………………………………………………………………………………………………………..…..…………6ii)XRayOpsProgram………………………………………………………………………………………….……………7iii)AnalyzingSamples……..……………………………….……………………………………………..……………...7iv)InterpretingSpectra……………………………………………………………….………………….………………8v)SpectrumOverlay…………………………………………………….……………………………………………….10
C.ArtaxProgram……………………………………………………………………………………………….……….………10i)Installation…………………………………………………………….…………………………………..……………..10ii)CreatingProjects…………………………………………………….……………………………….……………….11iii)ExtractingNetPhotonCounts………………………………………………………………………………….11iii)ExportingData…………………………………………………………………………………………….…………..13iv)Visuals……………………………………………………………………………………………………………….…….13
IV. QUANTIFICATION…………………………………………………………….…………….…………….…………….….13A. UseofCalibrations…………………………………………………….………………………………………………..13B. UsinganExistingCalibration………………………….……………………………………………………........14
i)S1PXRFCalibration………………………………………….…………………………………………………………15 ii)S1CalProcessCalibration…………………………………………………………………………………………..15
C. AddingorRemovingCalibrationReferenceMaterial………………………..…………………………15D. TestingYourCalibration………………………………………………………………….……………………….….16
V. SELECTINGAPPROPRIATESAMPLES…………………………………………………..…………………………..16 Appendix.SettingsforCeramicsCalibration…………………………..…………….…………….………….18

I. ANALYZERSPECIFICATIONS
TheBrukerTracerIII-SDhasanX-raytubewitharhodiumtargetandasilicondriftdetector(SiPINdiode).Itcontainsnoradioactivematerial.TheTracerII-SDoperateswitharesolutionof147eVFWHMfor5.9keV,at200,000countspersecond.TheX-raybeamiscollimatedwithdimensionsof4mmx3mm.Spotsizeofanalysisisapproximately10mmindiameter.Themaximumvoltageis40keV,whichisinthesoftX-rayrange,anddoesnotpenetrateasdeeplyintoobjectsashardX-raysusedformedicalapplications.
II. SAFETY
X-raysareharmfultothehumanbody.Inordertominimizeexposureduringtheoperationoftheinstrument,allsafetyproceduresmustbefollowedatalltimes.ThereareanumberofsafetyresourcesfortheBrukerTracerIII-SD.Beforeoperatingthisinstrument,allUNCusersmust:
• ReadtheBrukerRadiationSafetyguide(onlaptop),• CompleteabriefonlinecourseinanalyticalradiationsafetythroughUNC
EnvironmentalHealthandSafety:http://ehs.unc.edu/training/self-study/analytical-x-ray-training/
• ReadUNCRadiationProtectionProgramguidefortheuseofX-raydevicesandsigntheincludedoperatorspage(inbinderwithlaptop).
III. INSTRUMENTCOMPONENTSANDINVENTORY
ThefullhandheldXRFrigconsistsofthreemainelements:theXRFanalyzer,thevacuumpump,andthelaptopcomputerorPDA.Eachuserisresponsibleforinventoryingallcomponentsbeforeandafterinstrumentuse.Anydiscrepanciesordamagesshouldbereportedimmediately.
A. TheBrukerTracerIII-SDHandheldXRFAnalyzer
Inadditiontotheinstrument,thecasefortheanalyzershouldalsocontain:
2rechargeablebatterypacks,Powercable-fordirectlypoweringtheanalyzerorrechargingthebatteries,Beigecommunicationcable,Boxof4filterslides,Tweezersforinsertingandremovingfilters,Metalnoseprotector-tobeplacedontheinstrumentbeforestorageandremovedpriortouse,

2
Sampletable,Safetycap,Foldingmirror,Plastictabletopstand,Replacementfilmwindowsfornose,InstrumentkeyBehindthefoamonthelidofthebox:UserGuide,QuickStartGuide,ChartofPeriodicTableandX-rayenergiesSoftwarediscs.
B. VacuumPumpThevacuumpumpmaybepluggedintothewallorrunonbatterypower.Thecaseforthevacuumshouldalsocontain:
Powercable,Replacementbattery,Batterycharger,Connectingtubing.
C. ComputerThemajorityofusersprefertousetheinstrumentsoftwareprovidedonthelaptop.NotethatthiscomputerhasnotbeennetworkedtoconnecttotheUNCnetwork.Thisallowsustooperatethesystemwithouttheuseofpasswords,andmaintainsdatasecurity.Thecomputerbagwillcontain: HPlaptop, Powercable, Mouseandmousepad, X-raysafetybinder. D.AuxiliaryEquipmentInadditiontotheessentialcomponents,referencematerialsandotherequipmentmaybecheckedoutasneeded.Theseinclude: PDAandassortedPDAaccessories, Fullyadjustabletripodfortheanalysisoflargeorstationaryobjects, Standardreferencematerialsaspressedpowdersorglass, Additionalfilmwindows, Samplecupsandfilm, Referencebooksandreadings, Externalharddrivefordatabackup.
3
IV. BASICOPERATIONA. Connecting
TheQuickStartGuidemaybefoundintheanalyzerboxorinBasicInformationFolder.
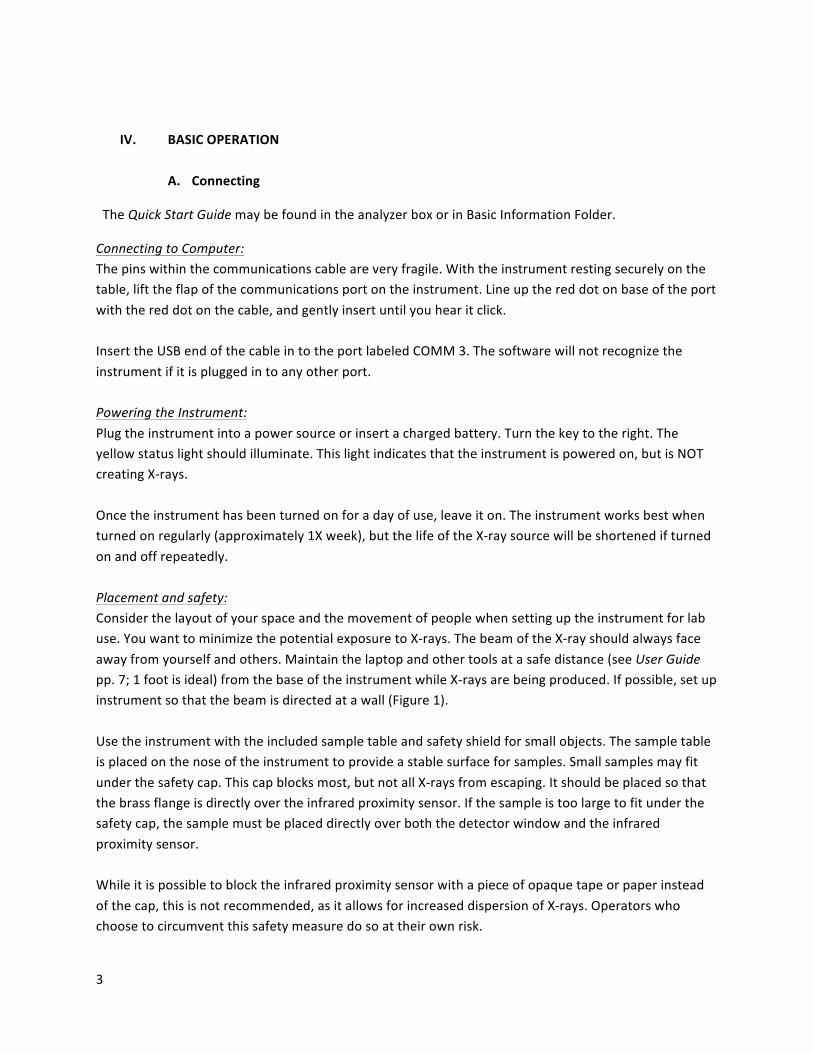
ConnectingtoComputer:Thepinswithinthecommunicationscableareveryfragile.Withtheinstrumentrestingsecurelyonthetable,lifttheflapofthecommunicationsportontheinstrument.Lineupthereddotonbaseoftheportwiththereddotonthecable,andgentlyinsertuntilyouhearitclick.InserttheUSBendofthecableintotheportlabeledCOMM3.Thesoftwarewillnotrecognizetheinstrumentifitispluggedintoanyotherport.PoweringtheInstrument:Plugtheinstrumentintoapowersourceorinsertachargedbattery.Turnthekeytotheright.Theyellowstatuslightshouldilluminate.Thislightindicatesthattheinstrumentispoweredon,butisNOTcreatingX-rays.Oncetheinstrumenthasbeenturnedonforadayofuse,leaveiton.Theinstrumentworksbestwhenturnedonregularly(approximately1Xweek),butthelifeoftheX-raysourcewillbeshortenedifturnedonandoffrepeatedly.Placementandsafety:Considerthelayoutofyourspaceandthemovementofpeoplewhensettinguptheinstrumentforlabuse.YouwanttominimizethepotentialexposuretoX-rays.ThebeamoftheX-rayshouldalwaysfaceawayfromyourselfandothers.Maintainthelaptopandothertoolsatasafedistance(seeUserGuidepp.7;1footisideal)fromthebaseoftheinstrumentwhileX-raysarebeingproduced.Ifpossible,setupinstrumentsothatthebeamisdirectedatawall(Figure1).Usetheinstrumentwiththeincludedsampletableandsafetyshieldforsmallobjects.Thesampletableisplacedonthenoseoftheinstrumenttoprovideastablesurfaceforsamples.Smallsamplesmayfitunderthesafetycap.Thiscapblocksmost,butnotallX-raysfromescaping.Itshouldbeplacedsothatthebrassflangeisdirectlyovertheinfraredproximitysensor.Ifthesampleistoolargetofitunderthesafetycap,thesamplemustbeplaceddirectlyoverboththedetectorwindowandtheinfraredproximitysensor.Whileitispossibletoblocktheinfraredproximitysensorwithapieceofopaquetapeorpaperinsteadofthecap,thisisnotrecommended,asitallowsforincreaseddispersionofX-rays.Operatorswhochoosetocircumventthissafetymeasuredosoattheirownrisk.

4
Figure1.Typicalanalyzersetup.TheX-raybeamisdirectedtowardsasolidwall.ThemirrortotheleftallowstheoperatortochecktheX-raylight.Laptopislocatedonefootfromthebaseoftheanalyzer.
B. S1PXRF
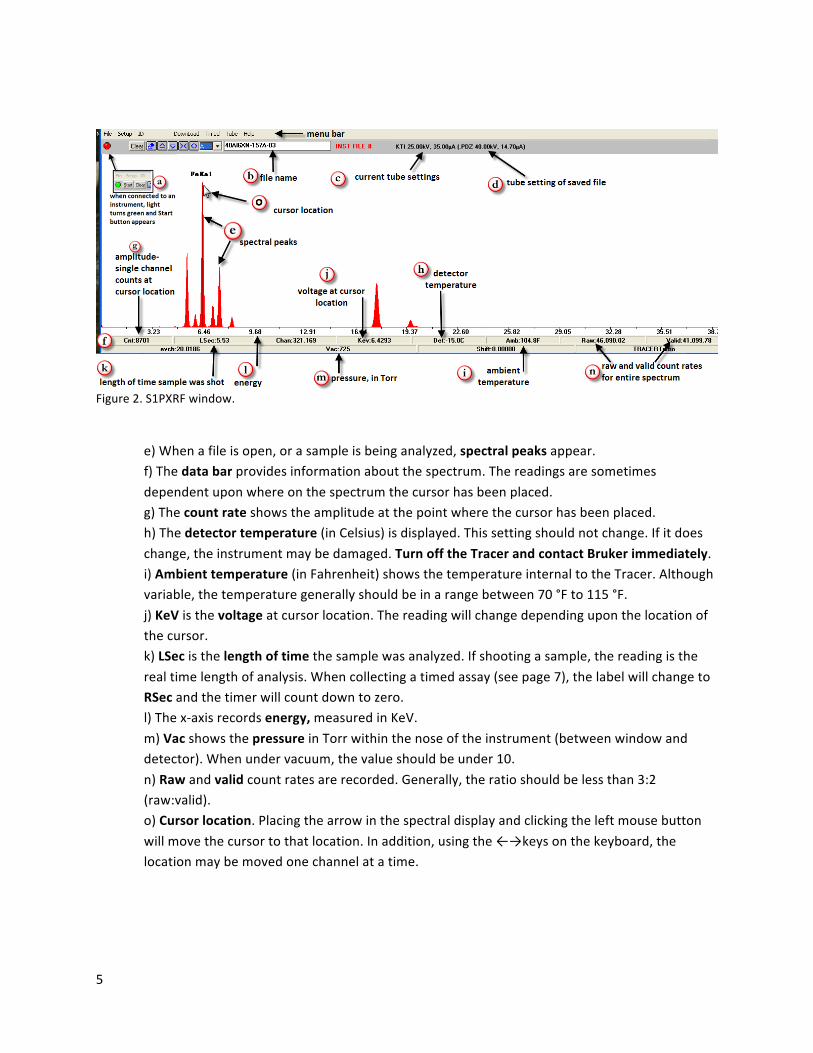
S1PXRFistheprimarysoftwareforcollectingandanalyzingXRFdata.Thisprogramisusedtoestablishinstrumentsettings,viewandexportcollecteddata,andanumberofotheractions,detailedbelow.Oncetheanalyzerhasbeenconnectedtothecomputerandpoweredon,openS1PXRF.Itwillautomaticallyopendisplayingthelastspectrumthatwasgenerated.ThecontentsoftheS1PXRFwindowareshownbelow(Figure2).
a)Start/Stopindicator.OncetheTracerinstrumentisconnectedtothecomputer,andkeyhasbeenturnedtoon,clickontheredbutton.Ifasuccessfulconnectionismade,thelightwillturngreenandtheStartbuttonwillappear.b)Thenameofthecurrentlyopenfileappearsinthefilefield.Whenfirstopened,thewindowwillshowthelastsavedoropenedfile.TheseriesofbuttonstotherightoftheStart/Stopindicatorexpands,shrinks,compresses,andbroadensthespectrumforeasierviewing.Thehouseiconrestoresthespectrumtoitsoriginaldimensions.Thedropdownwindowremovesoraddsthebackgroundorforegroundspectra,ifoverlayhasbeenenabled(seeSpectrumOverlaybelow).c)WhentheTracerinstrumentisonandconnectedtoS1PXRF,theinstrument’scurrenttubesettingswillappear.d)Thetubesettingsusedtorecordthefileonscreen(seebabove)willappearinparentheses.
5
Figure2.S1PXRFwindow.
e)Whenafileisopen,orasampleisbeinganalyzed,spectralpeaksappear.f)Thedatabarprovidesinformationaboutthespectrum.Thereadingsaresometimesdependentuponwhereonthespectrumthecursorhasbeenplaced.g)Thecountrateshowstheamplitudeatthepointwherethecursorhasbeenplaced.h)Thedetectortemperature(inCelsius)isdisplayed.Thissettingshouldnotchange.Ifitdoeschange,theinstrumentmaybedamaged.TurnofftheTracerandcontactBrukerimmediately.i)Ambienttemperature(inFahrenheit)showsthetemperatureinternaltotheTracer.Althoughvariable,thetemperaturegenerallyshouldbeinarangebetween70°Fto115°F.j)KeVisthevoltageatcursorlocation.Thereadingwillchangedependinguponthelocationofthecursor.k)LSecisthelengthoftimethesamplewasanalyzed.Ifshootingasample,thereadingistherealtimelengthofanalysis.Whencollectingatimedassay(seepage7),thelabelwillchangetoRSecandthetimerwillcountdowntozero.l)Thex-axisrecordsenergy,measuredinKeV.m)VacshowsthepressureinTorrwithinthenoseoftheinstrument(betweenwindowanddetector).Whenundervacuum,thevalueshouldbeunder10.n)Rawandvalidcountratesarerecorded.Generally,theratioshouldbelessthan3:2(raw:valid).o)Cursorlocation.Placingthearrowinthespectraldisplayandclickingtheleftmousebuttonwillmovethecursortothatlocation.Inaddition,usingthe←→keysonthekeyboard,thelocationmaybemovedonechannelatatime.

6
i) Settings
FollowtheinstructionsintheUserGuideorQuickStartGuidetosetupforanalysis:
1. Placesampletableandsafetycaponinstrumentnose.ThiscontainstheX-rays thatareproducedatseveralpointsduringsetup. 2. OpenDownloadTab.EnsureBaudrateissetto115200, EnsurePortissettoCOMM3.
3. Clickonreddotinupperleft,toturnitgreen. 4. OpenSetupTab.EnsureBackScatterboxisunchecked. EnsurePCTriggerboxischecked.
Theguidetoinstrumentsettingsforanalysisofspecificmatricesand/orelementsiscalledFilterandVoltageandCurrentSelection.Yourresearchdesignandsamplematrixwillaffectwhichsettingsyouchoose.Ifyouplantoquantifyyourdatausinganexistingcalibration,makesurethatyoursettingsmatchthecalibrationsettings,asdetailedinSectionIV.Ifusingafilter,unscrewthebrassnutontheanalyzernoseandinsertfilter,withtheovalsidefacingintotheinstrument.Theinstrumentdoesnotneedtobeturnedoffforthisprocedure.BEFOREUSE,ALWAYSCHECKFORTHEPRESENCEOFAFILTER.
Ifusingavacuum,setthevacuumupright.Connectthetubingtothepumpandinstrument,payingattentiontothelabeledends.Switchpumpon,andensurethatthepressurereachesbelow10Torr.Youwillseethewindowonthenosesuckdownintotheinstrument.Thepressuremayfluctuateabitoverthecourseoftheday,butshouldalwayshoverbelow10Torr.Monitorthroughouttheday,andreplacethenosewindowifnecessary.
1. InS1PXRF,OpenTubeTab. 2. SelectKTITube. 3. SelectRead. 4. Selecttheappropriatevoltageandcurrentasindicatedintheguideabove. Pulselengthandfilter#donotneedtobeadjusted.Voltage:theenergyoftheX-raysproducedbytheinstrumentisgivenaskiloelectronvolts(kVorkeV).Adjustthevoltagesettingstofocusonparticularpartsofthespectrum.Ingeneral,asatomicmassincreases,sodoesthevoltageneededtoexcitethatelement.Forexample,uselowvoltagewhenfocusingonmajor(low-Z)elements.Current:theflowofelectronchargeisgivenasmicroamps(µa).Ageneralruleofthumbisthathighdensitymaterials,suchasmetals,uselowcurrent.Lowdensitymatrices,suchasceramicsandglass,usehighcurrent.

7
Inmostcases,thepresetoptionsinS1PXRFwillmeetyourneedsforvoltageandcurrent.Ifyoumustcreatecustomsettings,thisisdonethroughXRayOps(seebelow).Ensurethatsafetycapisonthenose.ChecktheboxforPCtrigger.Youshouldheartheclickoftheanalyzerandseetheredlight,indicationsthatX-raysarebeingproduced.WhenyouclosetheKTITubewindow,X-raysshouldstopbeingproducedandtheredlightwillgooff.Theinstrumentisnowreadytocollectdata.
ii) XRayOps:
ThisprogramallowsyoutomanuallycontrolallthesettingsintheS1PXRF.Inmostcases,thepresetoptionsinS1PXRFwillmeetyourneedsforvoltageandcurrent.OperatethisprogramwithEXTREMECAUTION,asitwilloverwriteexistingpresetsinS1PXRF.
1. BeforeopeningXRayOps,ensurethatS1PXRFisclosed. 2. SelectCOMMPort3. 3. Checkboxforhighspeedcommunications. 4. CheckboxforOpenX-rayCommPort. Theprogramisnowabletoreadthesettingsfromthemotherboardinthe analyzeritself. 5. Takeascreenshotofthedefaultsettingsandsavewithdescriptivetitle. 6. Overwriteasettingrowwiththedesiredsettings.Savesettingsundernewfile name. 7. CloseXRayOpsandreopenS1PXRF. 8. Selectyourcustomvoltageandcurrentsettings. 9. WHENYOURANALYSISISCOMPLETE,RETURNTOXRAYOPSANDRESTORE DEFAULTSETTINGS.
Thisinstrumentisequippedwitha5-wattbulb.Voltagetimescurrent=watts(ex:40keVx30µa=1.2watts).Thecurrentandvoltageproductmustnotexceed5watts.Ingeneral,ifusinghighvoltage,uselowcurrent;lowvoltage,highcurrent.
iii) AnalyzingSamples
Placeyoursampleoverthewindow.Makeasclosecontactasyoucan.EnsurethatIRsensorisblockedbythesampleorthesafetycap.SeeSectionV.forselectingappropriatesamples.Inmostinstances,youwillwanttodoatimedassay.Thiswillensurethatallofyourmeasurementsinastudyareofaconsistentlength.Ifyouwishtoquantifyyourresultsintermsorparts-per-millionorweight%,ensurethatyourtimingandallothersettingsmatchthatofthestandardsusedtocreatethecalibration.FulldetailsoncreatingandusingcalibrationsmaybefoundinSectionIV.Ingeneral,asthe

8
heterogeneityofsamplesincreases,intermsofelementalcompositionandmatrixconsistency,soshouldruntime.AlwaysselectAutosave.Otherwise,youmayinadvertentlyoverwritefiles.Alwayscreate.PDZfiles.Dependingonthetypeofanalysisyouwishtodo,youmayalsocreate.TXTand.CSVfilessimultaneously.Notethatyoucanalsocreatethesefiletypeslater,byopeningaspectrumfile(.PDZ)andselectingFileàSaveAs.Chooseyourfilenamescarefully.Theyshouldincludeacodeforyoursettings,sothattheyareimmediatelydistinguishablefromotheranalyses.Forexample,ifyouarerunningseparateanalysesformajorelementsandtraceelementsonthesamesamples,ensurethatthefilenamesaredistinct.Additionally,itisgoodpracticetoputfilesforeachtypeofanalysisinaseparatefolder.Theinstrumentsettingsarestoredasmetadataineach.PDZfile;however,notethatthefilterinformationmaynotbecorrect.Theinstrumentcan’ttellwhichfilteryou’reusing-thatfieldisautomaticallypopulatedbasedontheKTITubesettings.Onceyouselectsave,thecountdownwillbeginandX-rayswillbeproduced.Ifyouhaveselectedmultipleruns,theywillautomaticallyrun-withfilenamesindexed,e.g.,Sample1-1,Sample1-2,Sample1-3.Whilesamplesarebeingrun,itisimportanttomonitorrawcountratesandvalidcountrates.Thesevaluesappearinthedatabaratthebottomofthewindow.RawCountRate-thecountofphotonsdetectedpersecond.Forthisinstrument,thisvalueshouldnotexceed200,000.ValidCount-theupperlimitofdetection.Thisvalueshouldnotexceed100,000.Ifeithercountrateexceedstherecommendedthresholds,thisisanindicationthatthedetectorisbeing“blinded”bytoomanyphotons.Adjustthecountratebyloweringthecurrentsettings.Whenusingafilter,thecountrateswilloftenbeinthelowthousands.
iv) InterpretingSpectra
S1PXRFdisplaystheresultsofasaspectrum.Thex-axisisenergy,representedaskiloelectronvolts(keV).They-axisisphotoncounts,orintensity.Thespectrumlinethereforedisplaysthecountsofphotonsateachenergylevel.WhenexcitedbyX-rays,eachelementproducescharacteristicsecondaryX-rays.TheirenergyisnotedonthePeriodicTableandX-rayEnergieschart.Identifyingelementalpeaks:ThecharacteristicX-raysforeachelementwillproducepeaksatseveralspecificenergylevels.Thesedependonwhichelectronshellejectsanelectron,andwhichshellgivesupanelectrontofillthespace(Figure3).ElementsuptoandincludingbariumwillshowK-alpha(denotedasKa1)andK-betapeaks.AK-alphapeakrepresentsphotonsproducedwhenelectronsmovefromtheL-shellintotheK-shell.AK-betapeakrepresentsphotonsproducedwhenelectronsmovefromtheM-

9
shellintotheK-shell.ElementsheavierthanbariumwillshowL-shellpeaks,whiletheheaviestelementswillshowM-shellpeaks.BariumandsomemetalswillfluorescefromboththeirK-shellandL-shell.Wherethereisspectralinterference(peakoverlap),thissoftwarecannotdifferentiatebetweentheoverlappingelementalpeaks.Theusermustfamiliarizethemselveswiththeexpectedelementsintheirsamples,orusetheArtaxprogramoutlinedbelowtorunprobabilisticassessmentsofwhichelementsarepresent.
Figure3.Bohrmodelofsiliconatomwithlabeledelectronshells.
1. Inmaintoolbar,SelectID. 2. SelectElem,whichwillpopupaperiodictable. 3. Selecttheshellyouwishtosearch(K,L,M). 4. Selectanelementtoseethelocationofitsx-rayenergy. 5. Toleaveamarkerforthatelement,selectAdd.Itwilllabelonlythealphapeak. 6. Z+andZ-buttonswillmoveelementbyelementupordowntheperiodictable.
Dependingonyoursample,theremaybeseveralpeaksthatareunabletobeidentifiedbyS1PXRF.TheseincludeComptonPeaks,SumPeaks,andEscapePeaks.Itisimportanttorecognizethesepeaks,sothatyoudonotmisidentifythemasanearbyelementalpeak.ComptonPeak-Aspectralpeakthatreflectsthepresenceoflightelementswithinasample.Whileelementssuchascarbonandoxygencannotbemeasureddirectlybytheinstrument,theComptonpeakcanbeviewedasaproxyforcarbondensitywithinasample.Thehigherthepeak,themorecarbon.ThelocationoftheComptonpeakwillvary,dependingonthefiltersettings.Withafilterforlighterelements(low-Z),thepeakwillbebetween2.5-3keV.Underunfilteredconditions,orfilteringforhigh-zelements,theComptonpeakwillfallbetween18.5-19.5.Thispeaktypicallylooksdistinctfromelementalpeaks,beingwiderandflatter,sometimeswithaslopingshoulder.Sumpeaksformwhenanelementisabundantwithinasample.Whentwophotonsfromthatelementreachthedetectorattheexactsametime,thedetectorgivesthemacountofone,andanenergylevelthatisthesumoftheirenergies.Thiswillcauseapeaktoforminthespectrumthatislocatedat2xthecharacteristicenergyoftheabundantelement.Forexample,inasamplewithabundantiron,theK-alphapeakforironwillbelocatedat6.405KeV,andthesumpeakwillbelocatedat12.91KeV.
K" L" M"

10
Escapepeaksalsoformwhenanelementisabundantwithinasample.Thesepeaksformduetotheinterferenceofsiliconfluorescenceatthesurfaceofthedetector.Thepeaksarelocatedonthespectrumat:elementkeV-siliconkeV(1.74keV).Forexample,inasamplehighincopper,theK-alphapeakforcopperwillbelocatedat8.046keV,andthecopperescapepeakwillbelocatedat6.306keV(8.046-1.74).Thiscopperescapepeakisespeciallyimportanttoremember,becausethepeakoverlapswiththeironK-alphapeak,andcouldbemisidentified. v)SpectrumOverlayInS1PXRFitispossibletoviewtwospectraatthesametime.
1. Openorcollectdataononeofthespectrayouwishtooverlay. 2. Fromthemaintoolbar,selectSetup. 3. SelectSpectrumoverlay.Anewboxwillpopup. 4. MoveAtoB.Thecurrentspectrumwillnowbeoutlinedinblue. 5. Openorcollectdataonnewspectrum.Itwillappearoverlaidinredoutline. 6. Thefilewindowwillnowshowthenamesofbothfiles. 7. ClearSpectrumBorMoveAtoBasrequiredforsubsequentanalyses. 8. Fromthedropdownmenutotheleftofthefilewindowyoucanchangewhich fileorfilesyouareviewing.
C. ARTAX
Artaxisaprogramthatallowsforthevisualizationofmultiplespectra,manipulationsofspectra,andreturnscorrectedphotoncounts,whichcanbeusedforquantitativeanalyses.
i) Installation
ArtaxisinstalledontheXRFlaptop.However,ifyouwishtoconductanalysisonyourownPC,copythefolderArtaxfromfolderBasicInformation,andfollowthesedirections.
1. Copythefolder‘Artax’directlyintoyourC:drive. 2. Makeyourcomputershowinvisiblefolders.Thiswillvaryaccordingtoyour operatingsystem.ForWindows7:StartMenuàControlPanelà AppearanceàFolderOptionsàShowHiddenfilesandfolders. 3. CopytheBruker-AXSfolderdirectlyintotheProgramDatafolderonC:drive. 4. Within‘Artax’folder,select‘ArtaxBest’andthendouble-clickonArtax.exeto opentheprogram.Youmaywishtopinthisprogramtothetaskbarorcreatea shortcutontheDesktop.

11
ii) CreatingaProjectinArtax
Ifyouhavealreadycreatedandsavedaprojectwithamethodandelementalpeaksidentified,youcanskipthefollowingsteps,andsimplyreopenyourexistingfile.
1. OpenArtax.Thereisnopassword.Clickthroughtheinitialerrormessages. 2. UnderProjectàNewProject.Adirectorywillthenopenontheleftsideof screen. 3. RightclickonfolderlabeledObjectsàAddNode. 4. Namethisnode:Points.ThenameforthisnodemuststartwithPoints,but anythingelsemayfollow. 5. FileàAddSpectrum.Navigatetoyourspectraandselectalltoimport. 6. RightclickonPointsfolderàAddSpectra 7. Inmainwindow,clickonSpectrumtab.Allofyourspectrashouldappear. 8. FileàSaveProjectAs.Selectanameanddestinationforyourproject.
iii) ExtractingNetPhotonCounts
ThespectrathataregeneratedbytheXRFaredirectlybasedonthecountsofphotonsatparticularenergylevels,asmeasuredbytheX-raydetector.WithinS1PXRFitispossibletoretrievethesecountsateachenergylevel.However,theseinitialvaluesdonotaccountforinter-elementaleffects(whenspectralpeaksoverlap).Forexample,ananalysisofrawphotoncountswouldlikelymisidentifyanumberofironandcobaltpeaksiftheyarebothpresentinthesample,asthepeaksforironandcobaltoverlap.UsingARTAX,itispossibletoovercomesomeoftheseconfoundingeffects,withtheBayesianDeconvolutionprocess.TheresultswillbegivenasNetIntensitiesorNetPhotons,whicharecountsoftheareaundereachspectralpeak,minusbackground,minusinter-elementaleffects.Dependingupontheelementspresent,netphotoncountsshouldbelinearlycorrelatedtoparts-per-millionorweight%values.BayesianDeconvolution-aprobabilisticmethodforassessingthelikelihoodthataparticularelementispresentwithinthesample.WhilethisisanautomatedfunctionofArtax,itisaniterativeprocedurethatreliesupontheuser’sknowledgeandjudgmentoftheirsamples. 1. FindtheComptonPeak.Thispeakisnotrelatedtoasingleelement,ratheritis thereflectionofmultiplelightelements.Ittypicallydoesnotlooklikeother peaksinthespectrum.Itmaybewider,orconsistofmorethanonepeak.For spectrathatrangebetween1-40KeV,theComptonPeakwillbepresentat around19KeV. 2. ClickontheapproximatecenteroftheComptonPeak.Averticallinewill appear.ThenselectSpectrumàNormalizefromthetopmenu.Thespectrawill becomelessfuzzy. 3. Clickthe‘X’totherightofspectrumnameintoolbar.Allwilldisappear.Reopen onespectrumbyselectingitfromtheleftmenu.

12
4. OpentheMethodEditor.Itislocatedtotheleftofthetextboxintoolbar.It lookslikealittleboxwithredandgreendots.Youmayalsofinditbynavigating toMeasurementàMethod. 5. Typeanewnameintothetoptextbox. 6. DonotchangetheMeasurementTab. 7. InCorrections,ensurethatEscapeandBackgroundarechecked.Cycles=10.For mostspectra,Min/Maxwillrangebetween1-40KeV.Ifyou’reunsure.Lookat yourspectraandseetheminandmaxontheX-axis. 8. ClickAddonthetop,andthenOkonthebottomofthiswindow. 9. NowthenameofyourmethodshouldappeartotherightoftheMethodEditor iconintoolbar. 10. OpenthePeriodicTable.ItisjusttotherightoftheMethodnameintoolbar. Thisisaniconwithseriesofverticallines. 11. Clickinthecenterofalargepeakonyourspectrum.Youwillseethatatleast oneoptionappearstotherightoftheperiodictable.Choosetheappropriate element.Ingeneral,thiswillbethemorecommonelementinthelist. 12. ClickontheBayesianDeconvolutionbutton,locatedtotherightofthePeriodic Tablebutton.Abluefitlinewillnowappear.Ensurethatthelinematchesup fairlywellwithyouridentifiedelement.TheBayesiandeconvolutionisa probabilisticmeasureofelementalidentification. 13. Goalongyourspectrumandidentifyeachpeak/setofpeaks.RunBayesian deconvolutionafteraddingeachelement-ensurethatthefitline improves/matches. 14. Onceyouthinkyouhavefoundalloftheelements,reopenMethodEditor. 15. UnderIdentificationtab,selectPresetList.ThePeriodicTablewillappear,as wellasabutton‘GetElements’.Clickthisbuttonandthetablewillpopulate withtheelementsyou’veselected. 16. SelectReplaceandOKinMethodEditorMenu. 17. Closethisspectrumandopenanother.Rundeconvolution.Theelementsshould auto-identify,andthefitlineshouldfitwell.Ifitdoesnot,lookforelementsin thisspectrumthatwerenotidentifiedintheprevious.FollowSteps14-16to addelementstoMethod. 18. RepeatStep17severaltimes,untilyou’reconfidentthatyourmethodaccounts forallelementsinthesamples.

13
iv) ExportingData
1. Toexportyourdataasnetphotoncounts(aka‘netintensities’),clickonPoints folder,thenAnalyzeàEvaluateResults. 2. WhenEvaluationiscomplete,clickonPointsfolder,thenExportàExport ResultstoExcel.Chooseafilenameanddestination. 3. TherewillbeanerrorwhenyougotoopenthisfileinExcel,becausefilewas notcreatedinExcel.Ignorethiserror.Theworkbookwillhavetwosheets:The firstwilllistyourinstrumentsettingsandthesecondwillhavenetintensitiesfor eachelement. 4. Youmayusethesenumbersinsimilarwaystoppm/wt%.Asageneralrule, countsbelow100photonsareconsideredzero.TheBayesiandeconvolutionhas removedinter-elementaleffects(i.e.,accountedforoverlappingpeaksof certainelements)
v) ArtaxVisuals
1. Tozoomintoyourspectrum:holddownCTRL,clickandscrollinmainwindow. 2. Toundozoom,double-clickinmainwindow. 3. Topanacrossspectrum,movecursorbelowX-axis,clickandscroll. 4. OptionsàDisplayPropertieswillallowyoutochangethebackground,remove axes,etc.Tocreateunderfill,OptionsàFilledSpectrum. 5. Toremovethelinesmarkingelementalpeaks:PeriodicTableàUncheck‘Lines.’ 6. TochangethecolorofanElementlabel,openperiodictable,dragthedesired coloroverthedesiredelement. 7. Tochangethecolorofspectrumlineorfill,selectthespectrumfromthe dropdownlistintaskbar.Clickonthecolorboxtoleftofname,andselect desiredcolor. 8. TocopythespectrumintoadocumentExport->CopyGraphic(Ctrl-C).
V. QUANTIFICATION
A. Calibrations
Whilevisualcomparisonsornetphotoncountsmaybesufficientinavarietyofinstances,obtainingquantitativedataasparts-per-millionorweightpercent,isoftendesired.Brukerhasdevelopedanumberofcalibrationsspecifictocertaintypesofmatrices:obsidian,copperalloys,goldalloys,mudrock,andothers.Thesecalibrationswerecreatedbyrunninganumberofstandards,areferencedataset,onthisinstrument,andcalculatingbest-fitmodelsthatcanbeappliedtosamplesofunknowncomposition.

14
Allcalibrationshavebeenbuiltfromanalysescompletedonthisparticularinstrument(T3S2448).Theinternalgeometryofeachinstrumentisslightlydifferent.YoucannotreliablyuseacalibrationdevelopedonanotherBrukeranalyzer.
Foreachtypeofmatrixthereisaseparatereferencedataset,calibrationworksheetandcalibrationfile.Onemayuseaworksheetas-is,oraddandsubtractstandardsinthedatasetinordertoobtainacalibrationthatbestmatchesthesamplesyouintendtoquantify.Itisfundamentaltothecalibrationprocessthatthecalibrationdatasethaselementsinthesamerangeofconcentrationsasthesamplesyouintendtorun.Themodelisnotabletoaccuratelypredicttheconcentrationofelementsthatexceedtheknownquantitiesinthereferencedataset.TheBrukercalibrationdataandworksheetsarefoundinfolderT3S2448onthedesktop.NotethattheExcelfilesusedtocreatethecalibrationsandtoproducequantitativedatahaveanExcelmacrocalledS1CalProcess,whichmustbeenabledinordertofunction.ToinstalltheExcelmacro,seetheinstructionsinBrukerCalProcessServiceBulletininS1CalProcessfolder.Forceramics,usethecalibrationcreatedbyJeffSpeakmanandAliceHuntattheCenterforIsotopeStudies,UniversityofGeorgia(HuntandSpeakman2015).Thiscalibrationreplacesthefactory-installedmudrockcalibrationadvocatedbyBruker.Ifusingthesedatainpublication,propercitationofthecalibrationmustbeincluded.ThecalibrationfilesmaybefoundintheUGACeramicsCalibrationfolderontheDesktop.TheyarebuiltfromtheBrukerS1CalProcessmacro.SpeakmanandHunthavetweakedthestandardsettingsusedtocollectdataforceramics.Whenusingthisceramicscalibration,followthesettingsgiveninAppendix.
B. UsinganExistingCalibration 1. OpentheExcelspreadsheetforthecalibration.Resaveitwithanewnamein yourdatafolder.NEVERedittheoriginalfile!Eachfilehasworksheetsthat createcalibrationsformajorelementsaswellastrace.
2. Checkthesettingsusedtocollectvaluesforthereferencematerial,foundinthe PDZFilestab.Inordertouseacalibration,everythingmustmatch:Timeof Assay,Voltage,Current,Vacuum,Filter.Ifcollectingdataonmajorandtrace elements,youwillneedtoruneachsampletwice,matchingthemajorandtrace settingsforthecalibrationspectra. 3. Collectdataonyoursamples. 4. OpenthereferencestandardsfilesinArtax.Identifyallpeaks,usingBayesian deconvolutiontoconfirm.Makealistofallelements-besuretospecifywhich peakisidentified(K-alpha,L-alpha) 5. OpenspectraforyoursamplesinArtax.Identifyallpeaks,usingBayesian deconvolutiontoconfirm.Makealistofallelements.Ideallyalloftheelements forreferenceandsampleswillalign.Thisisthegoalofreferenceset.Notethat

15
ifthereisanelementpresentinyoursamplesthatisnotinyourreferenceset, youwillnotbeabletomeasurethatelement.Ifyouneedtoaddadditional standards,theprocedureisfoundinthefollowingsection. 6. Ifthereferencesetandyoursamplesareinagreement,you’rereadyto quantify.ThiscanbedonefilebyfileinS1PXRF,orbatchedwithinthe calibrationspreadsheet.
i)S1PXRFcalibration:
1. OpendesiredspectruminS1PXRF.2. SetupàSelectCoef(coefficient)3. Findtheappropriatecalibrationfile.Factory-installedcalibrationsarefoundin
thefolderT3S2448onthedesktop.Thecalibrationwillhavethefileextension .CFZ.Youwillnowseethefilenameappearsingrayonthemenubar,nexttoa CONCbutton.
4. HitCONC.Anewwindowwillappearwiththevaluesofyoursampleinthesame formatastheywereenteredforthecalibrationspectraintheExcelfile.For example,amajorelementcalibrationwilllikelypresentmajorelementsasoxide weightpercent,whichisgeologystandardpractice.Youcancheckontheformat ofthecalibrationspectraonthefarrightoftheMaChem(orTrChem)tabofthe calibrationworksheet.
5. SelectCopyinordertopasteyourresultsintoanewsheet.6. Ifyouwishtolookatbothtraceandmajorelements,youwillneedtochange
theCOEFfileundersetupandrepeatwithyournewspectrum.
ii)S1CalProcesscalibration:
APDFentitledMassCalibrationwithstep-by-stepinstructionsandscreenshotsisinCalibrationsfolderinBasicInformation,aswellasaproselistofinstructionsentitledS1CalProcessQuantification.
C.AddingorRemovingCalibrationReferenceMaterial
1. Collectdataonyournewreferencematerial.Thedatamustbecollectedbythe sameinstrumentonwhichyoursampleswillberun.Youcannotuseanother instrument’scalibrationspectra,asthegeometryofeachdetectorisdifferent andwillreturndifferentvalues.2. Openthebasecalibrationfileforyourmatrixtypeandresavewithanewname.3. OnPDZtab,UnderAdd-InsàS1CalProcessàInsertPDZ.AllyourPDZfilesmust beinthesamefolder.5. ChooseeitherMajorElement(MAChem)orTraceElement(TRchem) worksheet,dependingonwhatsettingyouused.

16
6. InAdd-InsàS1CalProcessàSelect/Removeelementsfromcalibration.Addall elementsthatwereidentifiedinArtaxFORBOTHREFERENCEMATERIALAND SAMPLES.Removeanypreexistingelementsinthelistthatarenotpresentin yourmaterials.Notethatnotallelementscanbeadded(e.g.,gallium).Keep rhodiuminthecalibrationatthispoint.7. InAdd-InsàS1CalProcessàAdd/Removechemfiles.ADDFILESFIRST,anddo notclick“AddNewChemistry”.Thenremoveallunwantedchemfiles.8. YourChemsheetwillnowhavealistofthereferencematerials,butthevalues willbeidentical.THISISOKAY-IGNOREALLVALUESBUTTHOSEONFARRIGHT OFSHEET.Pasteinthereferencevaluesforyourreferencematerialhere.You canuseeitherppmorwt%.9. InAdd-InsàS1CalProcessàCreateChemFile.MakesureComptonis19.5-22if inatracemode.DefaultforMAchemis2.5-3kev.10. Keeptheslopecorrectionsandincludedelements.Gothroughandremovea referencematerialfromanelementifithasazerovalue,oraveryhigh difference.Avg.differenceshouldbelessthan5,butideally0foreachelement.
C. TestingyourCalibration
1. FollowthedirectionsabovetobatchcreateconcentrationsinS1CalProcess,or individuallythroughS1PXF.Addthesevaluestoanewspreadsheet.2. Checkfornegativenumbers.Inmostcases,converttozero.3. Throwoutanyelementswithnomeasuredresults.Forinstance,galliumwas visibleinthespectrainArtax,buttherearenoreferencevaluesinthereference set.Thecalibrationreturned0gallium.4. Ifyouhavezerosinyourdata,addaconstant.Inthiscase-sincetherange betweenhighandlowvalueswasverygreat,Iused0.0001wt%(1ppm).5. Log-transformthedata.6. Plottheexpectedvaluesagainstreferencevaluesforeachelement.Ifthereis referencematerialthatwasnotincludedinthecalibrationforaparticular element,youwanttoremoveitfromtheplotdata.Eachelementshouldshowa positivelinearcorrelation,ideallywithr2valueof1orcloseto1.Elementsthat showpoorcorrelationshouldnotbeincludedinconcentrationsofunknowns- theyshouldbeleftinthecalibration,butvaluesnotrecorded.
VI. SELECTINGAPPROPRIATESAMPLES
WhendevelopingaresearchprojectwiththehandheldXRFanalyzer,therearemanyconsiderationstokeepinmindregardingyoursamples.

17
1. Yoursampleshouldbeflatenoughtorestfirmlyagainsttheinstrument aperture.Anyairspacebetweenasampleandthedetectorwillattenuatethe signal.ThisisespeciallyimportantformeasuringthelighterZelementsusinga vacuumorhelium.2. YoursampleshouldbeInfinitelyThick.IntermsofX-rayfluorescence,infinitely thickmeansthatasampleisthickenoughthattheX-rayspenetratewithout passingallthewaythroughthesample.Thedepthofpenetrationisreferredto astheMassAttenuationCoefficient.Thedepthwillvarydependingonthe matrix,andtheinstrumentsettings.Foranalysisoftraceelementsinsilicates, approximately3.5mmorgreaterisconsideredinfinitelythick.Foramore completediscussionofmassattenuation,seePhysicsfolderinBasic Information.3. Surfaceconditionmatters.WhiletheX-raysdopenetrateintothesample, surfacecontaminantswillmuddythesignal.Thisisespeciallyaconcernfor porousitemslikeceramics.Ifpossible,useafreshlybrokensurfaceorabradea surfacewithatungstencarbideorsiliconcarbidebittorevealafreshsurface withoutsurfacecontaminants,paints,glazes,etc.Rinsewithdeionizedwater andallowtoairdry.4. Bemindfulofsharppointsoredges.Thewindowcoveringthenoseofthe instrumentisverythin,andtearseasily.Whileabrokenwindowcancontinueto beusedwithoutavacuum,itwillhavetobereplacedforvacuumorhelium flow.Windowsareexpensivetoreplace.5. Powderedsamplesshouldbeashomogenousanddenselypackedaspossible. Ideallyallpowdersshouldbepressedintopellets.Samplecupswithovendried andfirmlypackedpowdermaybesubstituted,butthesignalwillbe substantiallyweakerduetotheinterferenceofthesamplecupfilmandthe largerporespaceofthesample.

18
Appendix.UniversityofGeorgiaCeramicCalibrationSettingsForTraceElements(Mn-Nb): GreenFilter NoVacuum Voltage:40keV Current:30μa SampleRunTime:200seconds SampleNamePrefix:TRForMajorElements(Al-Zn): NoFilter Vacuum Voltage:15keV Current:25μa SampleRunTime:200seconds SampleNamePrefix:VForMajorElements(Al-Zn)+Mg: NoFilter HeliumFlow* Voltage:15keV Current:25μa SampleRunTime:200seconds SampleNamePrefix:HeCreateaheliumflowformeasuringmagnesiumbyattachingaheliumtank. 1. Carefullypuncturethewindowfilmonthenosewithoutdamagingthemetal screen. 2. Attachtygontubing(orotherflexible,non-contaminatingtubing)tothehelium tank. 3. Openheliumflow.Keepflowprettylow.Youshouldnotbeabletohearit,and barelyfeelit. 4. Plugtheotherendofthetubingdirectlyontothevacuumportoninstrument. 5. Operatenormally.