Use of GIS and simulation modeling to assess the effects of … · · 2011-06-20MLW MTL MWH...
28
Use of GIS and simulation modeling to assess the effects of accelerated sea level rise on coastal salt marshes in Southern Rhode Island. Robert Hancock and Dr. Frank Golet
Transcript of Use of GIS and simulation modeling to assess the effects of … · · 2011-06-20MLW MTL MWH...

Use of GIS and simulation modeling to assess the effects of accelerated sea level rise on coastal salt marshes in Southern Rhode Island.
Robert Hancock and Dr. Frank Golet


Ecosystems Services of Coastal Wetlands
RI Coastal Resources ManagementCouncil states that coastal wetlands: “provide food and shelter for large
populations of juvenile fish and are nurseries for several species of fish” “are rich in shellfish” “are effective in slowing erosion along
protected shores”

Tool to predict the likelihood of a given salt marsh to survive accelerated sea level rise. Rank existing salt marshes based on
that ability. SLR forecasts outpace existing rates of
accretion for salt marshes in RI. A better tool would determine where
salt marshes may develop in the future.

Sea Level Affecting Marsh Model (SLAMM)
Developed with EPA funding in the 1980s. Now managed by Warren Pinnacle Consulting, Inc.
Cell-based simulation that uses Digital Elevation Models, Wetland Maps and land cover data as inputs.
Simulates the dominant processes involved in wetland conversions and shoreline modifications during long-term sea level rise.
Site specific characteristics such as erosion and accretion rates or frequency of overwash events exist in an operator-generated site file.
Model can run scenarios excluding developed areas in order to forecast the effects of various land management strategies.

Conceptual Model 30m x 30m cells with elevation, slope, aspect,
wetland type Cell size can be variable but many DEMs have 30 m resolution Cells will track movement of multiple land-type categories
2D Representation 3D Representation
Dry Land
Open Water
Various Wetlands
Source: Warren Pinnacle Consulting

SLAMM Inundation Model
Distance Inland
Ele
vatio
n
Tidal Flat Saltmarsh Scrub-Shrub or Brackish
Tidal Fresh and Dry LandMLW
MTL
MWHInland
MWHSInland Salt Boundary
Source: Warren Pinnacle Consulting

SLAMM Inundation Model(Migration of Wetlands Boundaries due to Sea Level Rise)
Distance Inland
Ele
vatio
n
Tidal Flat Saltmarsh Scrub-Shrub or Brackish
Tidal Fresh and Dry Land
MLW
MTL
MWHInland
MWHSInland Salt Boundary
Water
Source: Warren Pinnacle Consulting

Previous Research using SLAMM
Entire Chesapeake Bay (over 7 million hectares) – National Wildlife Federation.
NWF currently sponsoring a model validation exercise in La.
Coast of Georgia and South Carolina (Craft et al. 2009).
Puget Sound and Columbia River Estuary (approx 1.4 million hectares) – National Wildlife Federation.

•Back Barrier Lagoons•Glacial Outwash•Charlestown Moraine•Historic Intermittent Connection•1950’s Permanent Breachways
136,000 hectares
Using SLAMM with RI Coastal Ponds
High resolution LIDAR elevation data with a horizontal resolution of 1.25 meters and a vertical resolution of < 5.5 cm.
Recent coastal wetlands maps derived from 1999 orthophotography.
Recent (2004) land cover data was used to improve the analysis of development protection scenarios.

Project Goals
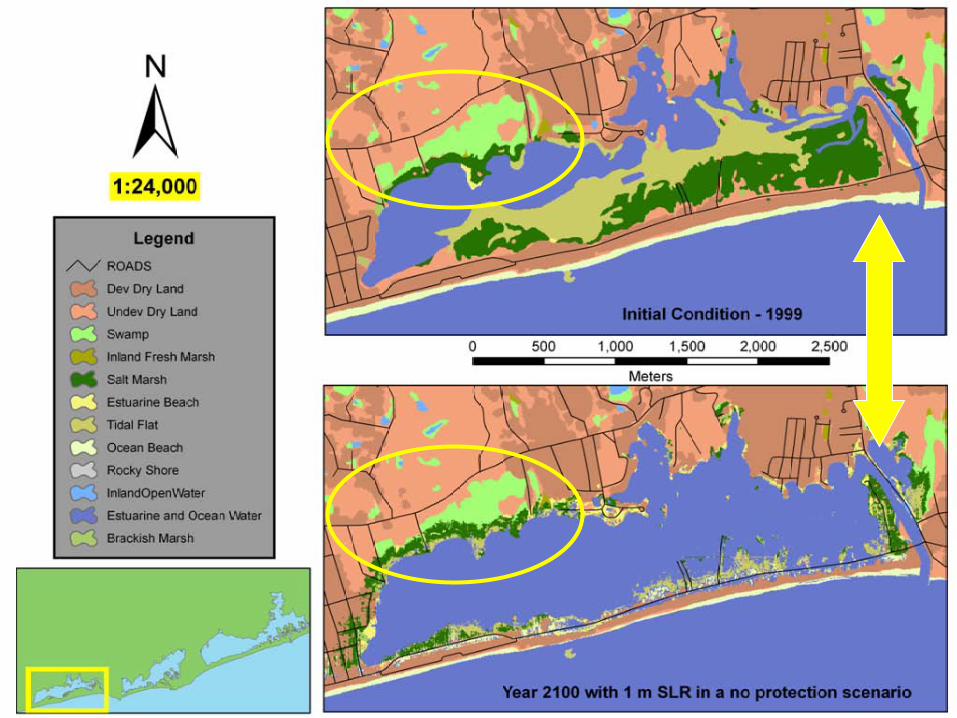
To forecast the net loss of salt marsh habitat by 2100 following a global SLR of 1 meter, 1.5 meters, and 2 meters. To assess the impact of protecting
developed lands. To identify specific locations with the
best potential for salt marsh development.

Reductions in Salt Marsh Extent(values indicate net loss of salt marsh habitat)
No ProtectionExclude
Developed Lands
Exclude all Dry Land
1 meter 43.56% 51.38% 74.96%
1.5 meters 56.30% 64.52% 81.29%
2 meters 65.10% 72.56% 86.41%


Impact of Protecting Developed Lands


Quonochontaug Pond

Quonochontaug Pond


Project SummaryWithin the study area:
Significant reductions in salt marsh cover are likely to occur in all SLR predictions of 1 meter or more. Protecting developed land will reduce
the amount of salt marsh habitat in 2100. There are locations of undeveloped land
with a high potential for salt marsh development.


Conclusions
Too much uncertainty for model results to be the primary driver of management decisions. Add-on component to land conservation
or restoration project assessments. Potential for adaptive management as
SLR projections evolve over time.

Acknowledgements Frank Golet Pete August Mike Bradley Boze Hancock
Kevin Ruddock Jonathan Clough Janet Freedman Kathleen Wainwright

Questions?