Marius Dumitru Sivakumar Harinath Gonzalo Isaza Akshai Mirchandani.
USE OF GEOSYNTHTICS IN PAVEMENTS
G L Sivakumar Babu Professor, Department of Civil Engineering
Associate faculty in CiSTUP and CST Indian Institute of Science
Bangalore 560012 Acknowledgments to Mrs. Lekshmi Nair and Sudheer Prabhu
Department of Science and Technology, New Delhi Field studies: CRRI, New Delhi and KRRDA, Bangalore
1

Back ground
Considerable investments being made in the construction of roads and about 35000 km of length will be built as per the five year plan proposals.
Many roads that have already been constructed need rehabilitation and maintenance measures. Pavement construction involves large quantity of aggregates for sub base and base layers.
Though the mechanistic-empirical design of pavements was introduced in the recent years, the evaluation of response of aggregates under repeated/ cyclic loading is desirable to obtain resilient modulus, elastic deformation and plastic deformation which control fatigue and rutting failures.
Geosynthetics are proven to be highly beneficial in constructing roads because they reduce the material costs, facilitate rapid installation, reduced maintenance costs and improve overall traffic performance. 2

Geosynthetics are “geopolymers”mixed with additives into a formulation
Manufactured into a particular type of geosynthetic material and serve different functions such as separation, filtration, drainage, reinforcement and moisture barrier


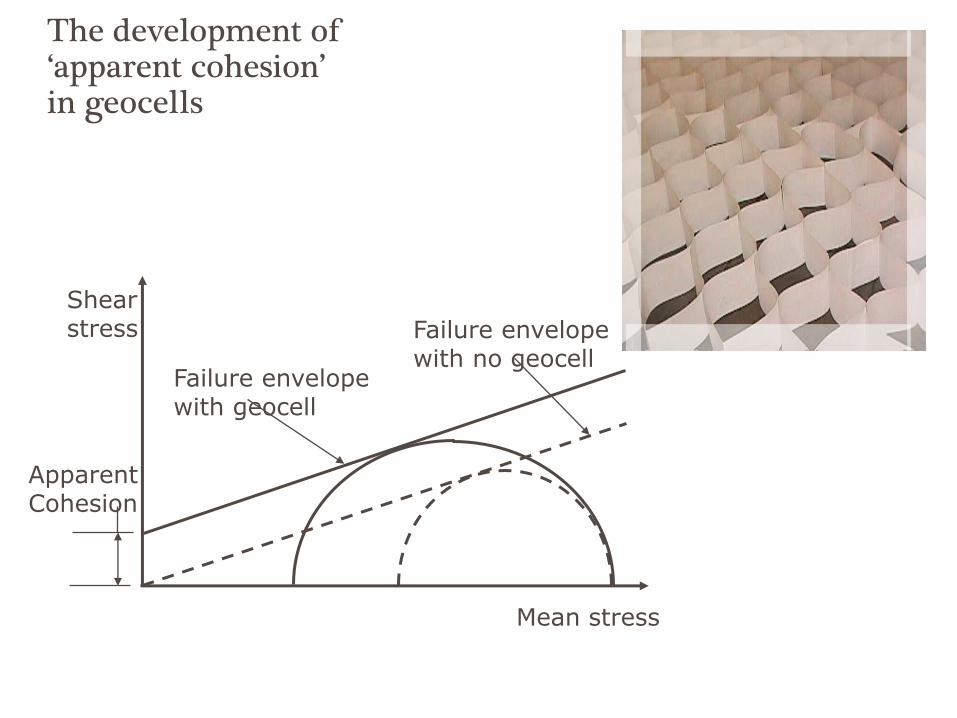
The development of ‘apparent cohesion’ in geocells
Mean stress
Shear stress
Apparent Cohesion
Failure envelope with geocell
Failure envelope with no geocell


Damages due to lack of drainage and confinement
There is a need for proper design methods in this connection to address the above factors
Pavement failures
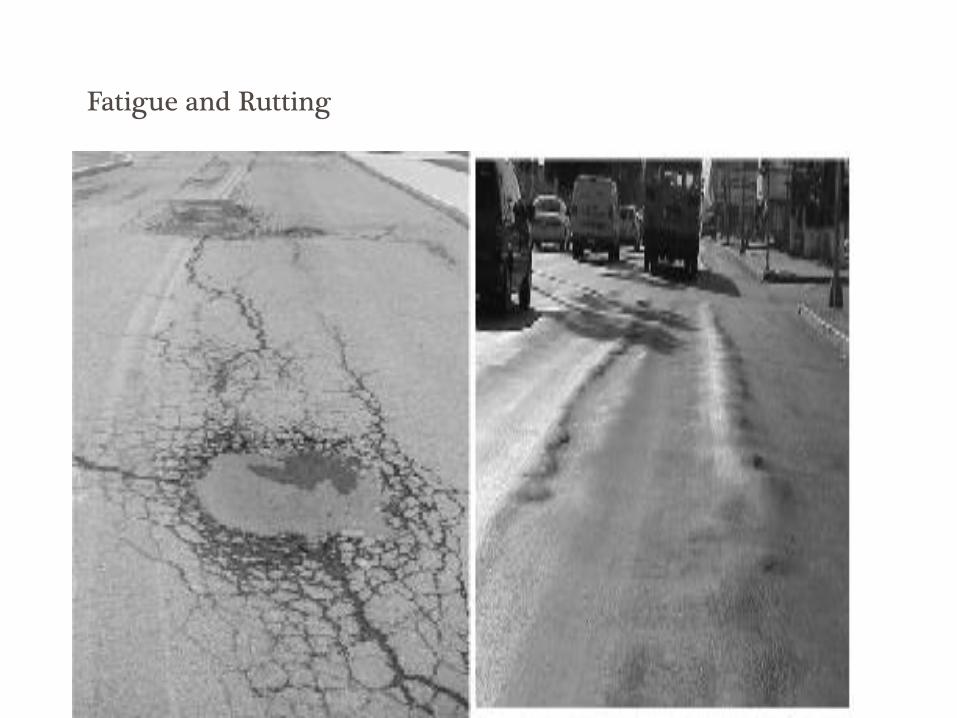
Fatigue and Rutting

Use of geosynthetics results in significant savings, improved
performance and very good serviceability in both short term
and long term
Geosynthetics have made it possible to construct roads and
pavements in seemingly difficult situations such as marshy
stretches, soft and organic deposits and in expansive soil
areas

Functions of Geosynthetics in Roadways
1. Acts as a separator to prevent two dissimilar
materials (subgrade soils and aggregates) from
intermixing. Geotextiles and geogrids perform this
function by preventing penetration of the aggregate
into the subgrade (localized bearing failures)
2. Soft subgrade soils are most susceptible to
disturbance during construction activities such as
clearing, grubbing, and initial aggregate placement.
Geosynthetics can help minimize subgrade
disturbance and prevent loss of aggregate during
construction
.

3. The system performance may also be influenced
by secondary functions of filtration, drainage, and
reinforcement. The geotextile acts as a filter to
prevent fines from migrating up into the aggregate
due to high pore water pressures induced by
dynamic wheel loads
4. It also acts as a drain, allowing the excess pore
pressures to dissipate through the geotextile and
the subgrade soils to gain strength through
consolidation and improve with time
Functions of Geosynthetics (contd..)

Concept of Geotextile Separation

1. Lateral restrainment of the base and
subgrade through friction and interlock between the
aggregate, soil and the geosynthetic
2. Increase the system bearing capacity by
forcing the potential bearing capacity failure surface
to develop along alternate, higher shear strength
surfaces
3. Membrane support of the wheel loads
Mechanisms

Reinforcement Functions
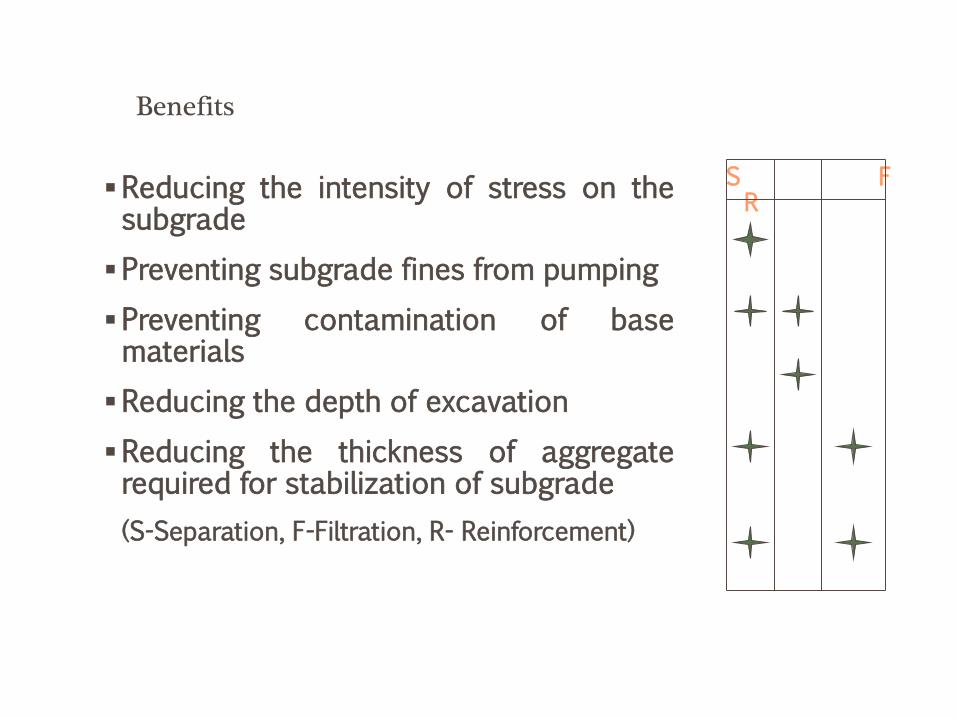
Benefits
Reducing the intensity of stress on the subgrade
Preventing subgrade fines from pumping
Preventing contamination of base materials
Reducing the depth of excavation
Reducing the thickness of aggregate required for stabilization of subgrade
(S-Separation, F-Filtration, R- Reinforcement)
S F R

Benefits
Reducing disturbance of subgrade during construction
Allowing an increase in strength over time
Reducing differential settlement in roadway
and in transition areas from cut to fill
Reducing maintenance and extending the life of the pavement
(S-Separation, F-Filtration, R-Reinforcement)
S F R
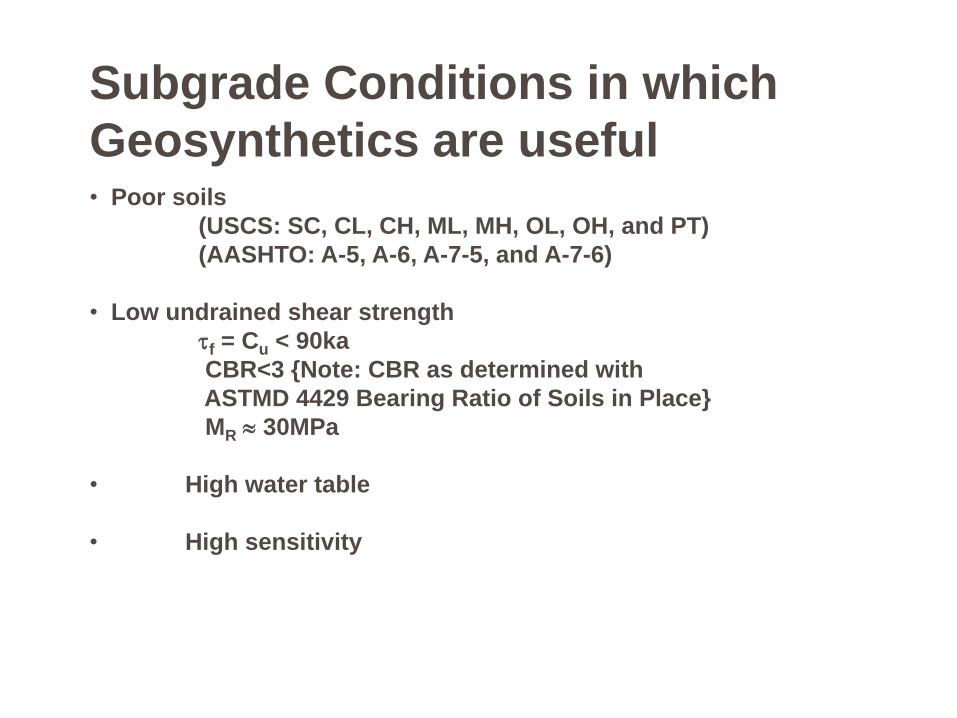
Subgrade Conditions in which
Geosynthetics are useful • Poor soils
(USCS: SC, CL, CH, ML, MH, OL, OH, and PT)
(AASHTO: A-5, A-6, A-7-5, and A-7-6)
• Low undrained shear strength
f = Cu < 90ka
CBR<3 {Note: CBR as determined with
ASTMD 4429 Bearing Ratio of Soils in Place}
MR 30MPa
• High water table
• High sensitivity
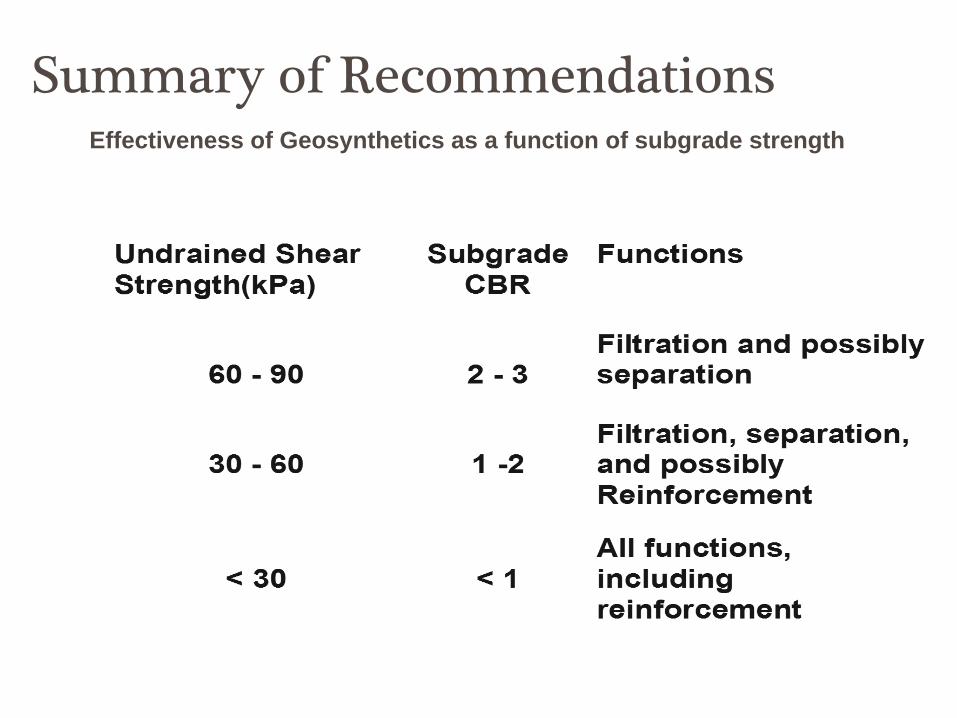
Summary of Recommendations
Effectiveness of Geosynthetics as a function of subgrade strength
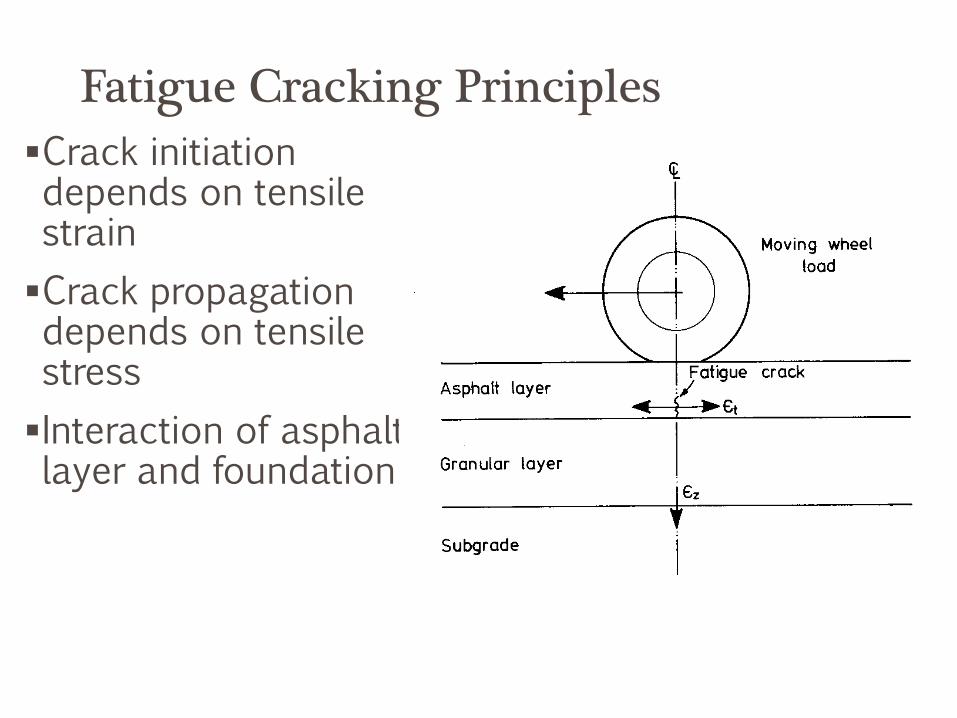
Fatigue Cracking Principles
Crack initiation depends on tensile strain
Crack propagation depends on tensile stress
Interaction of asphalt layer and foundation

Rutting Mechanism for Asphalt Layer
Permanent shear strains near surface
High temperatures
Heavy wheel loads
High traffic volume

Foundation Rutting
Lack of adequate load spreading
Granular layer or soil
Problems of water
Overview of presentation
Background
Materials and Methods
Effect Of Geocell-reinforcement In Granular Bases Under Repeated Loading
Numerical Modeling of Granular Bases Under Repeated Loading
Field studies
Conclusions
23
Objectives
The effectiveness of Geocell reinforcement in the base layer is studied
in terms of permanent deformation, resilient deformation, resilient
modulus at “targeted number of cycles”.
The power term ‘n’ has been calibrated to convert the permanent
deformations at higher loading into permanent deformation due to
standard axle loading
Rut depth reduction studies are carried out in order to compare the
results of geocell reinforced section with unreinforced section
Numerical analysis of geocell reinforced base section was conducted to
calibrate the permanent deformation model
Field studies are conducted to examine the effectiveness
24

Pavement response for different loading conditions (Wermeister et
al.2001)
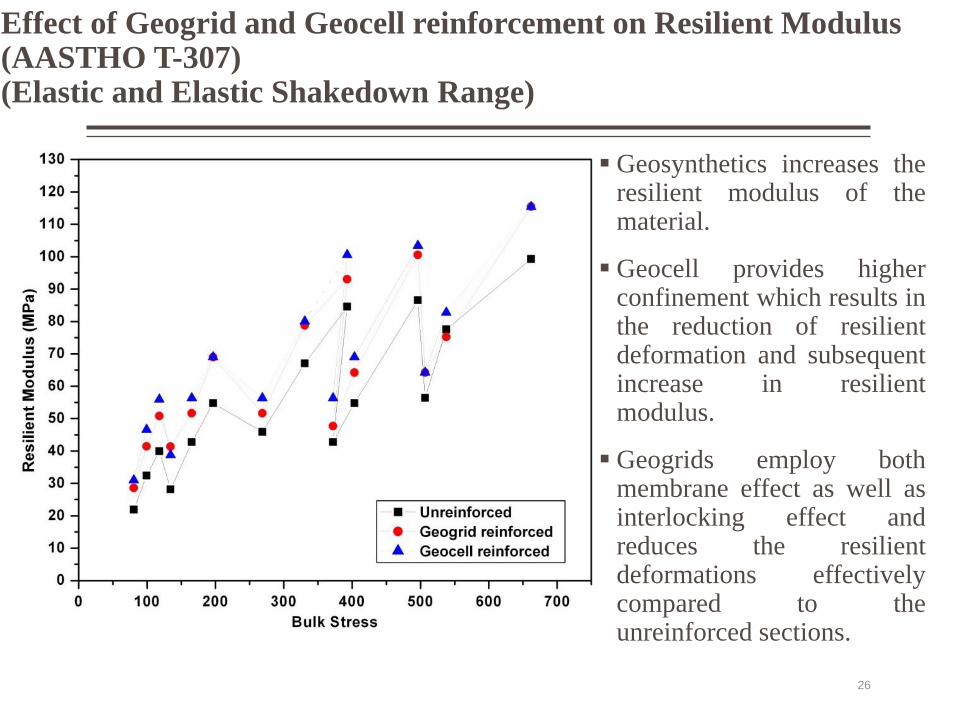
Effect of Geogrid and Geocell reinforcement on Resilient Modulus (AASTHO T-307) (Elastic and Elastic Shakedown Range)
Geosynthetics increases the resilient modulus of the material.
Geocell provides higher confinement which results in the reduction of resilient deformation and subsequent increase in resilient modulus.
Geogrids employ both membrane effect as well as interlocking effect and reduces the resilient deformations effectively compared to the unreinforced sections.
26
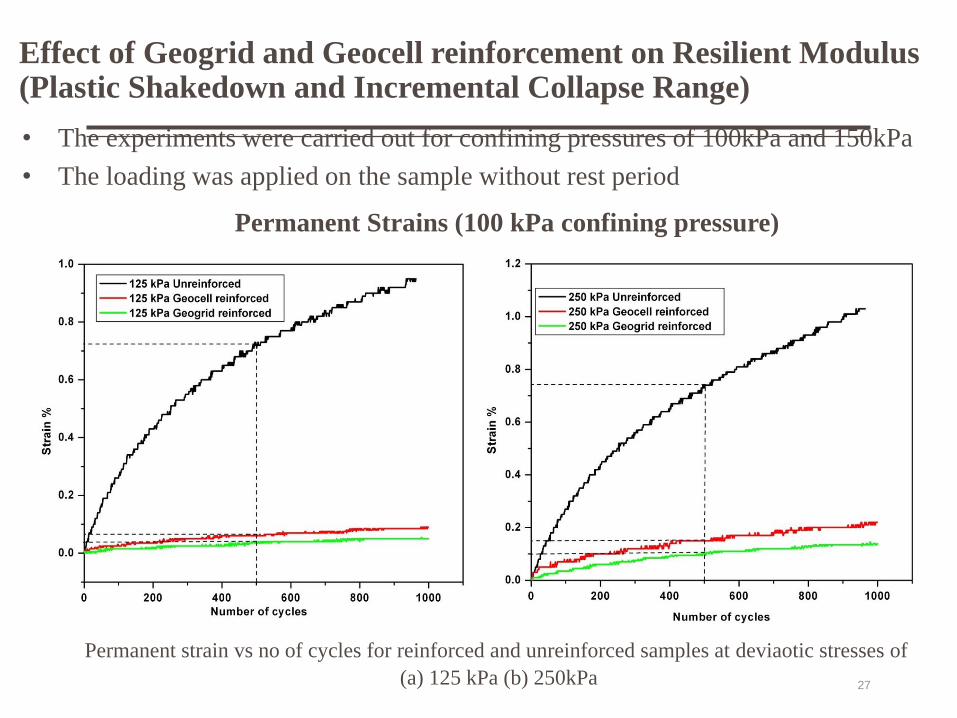
Effect of Geogrid and Geocell reinforcement on Resilient Modulus (Plastic Shakedown and Incremental Collapse Range)
27
Permanent Strains (100 kPa confining pressure)
• The experiments were carried out for confining pressures of 100kPa and 150kPa
• The loading was applied on the sample without rest period
Permanent strain vs no of cycles for reinforced and unreinforced samples at deviaotic stresses of
(a) 125 kPa (b) 250kPa
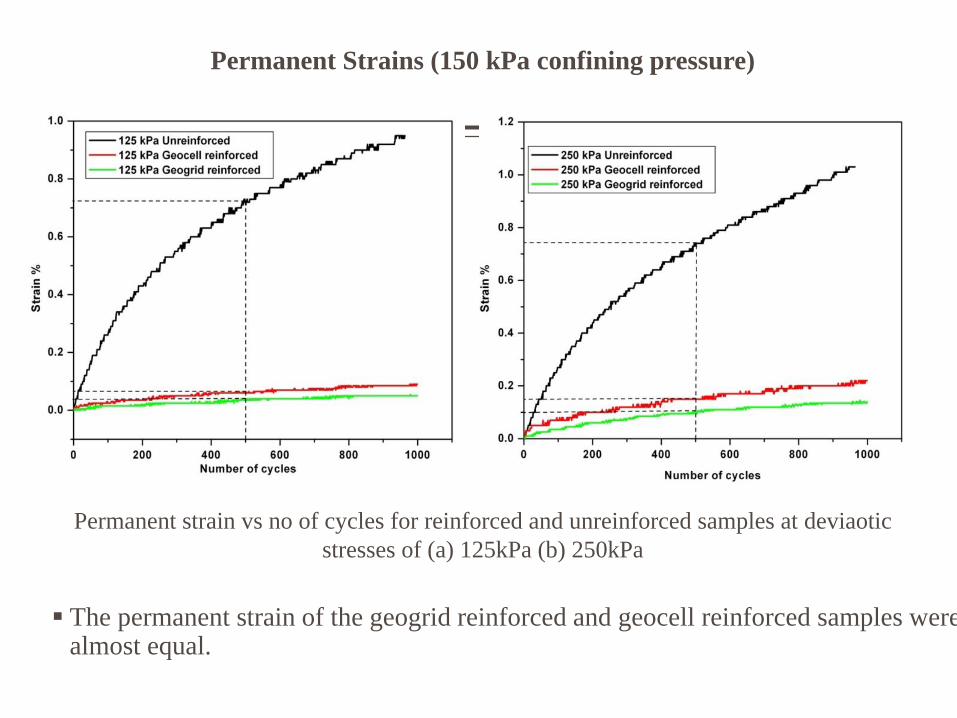
The permanent strain of the geogrid reinforced and geocell reinforced samples were almost equal.
Permanent Strains (150 kPa confining pressure)
Permanent strain vs no of cycles for reinforced and unreinforced samples at deviaotic
stresses of (a) 125kPa (b) 250kPa
Materials And Methods
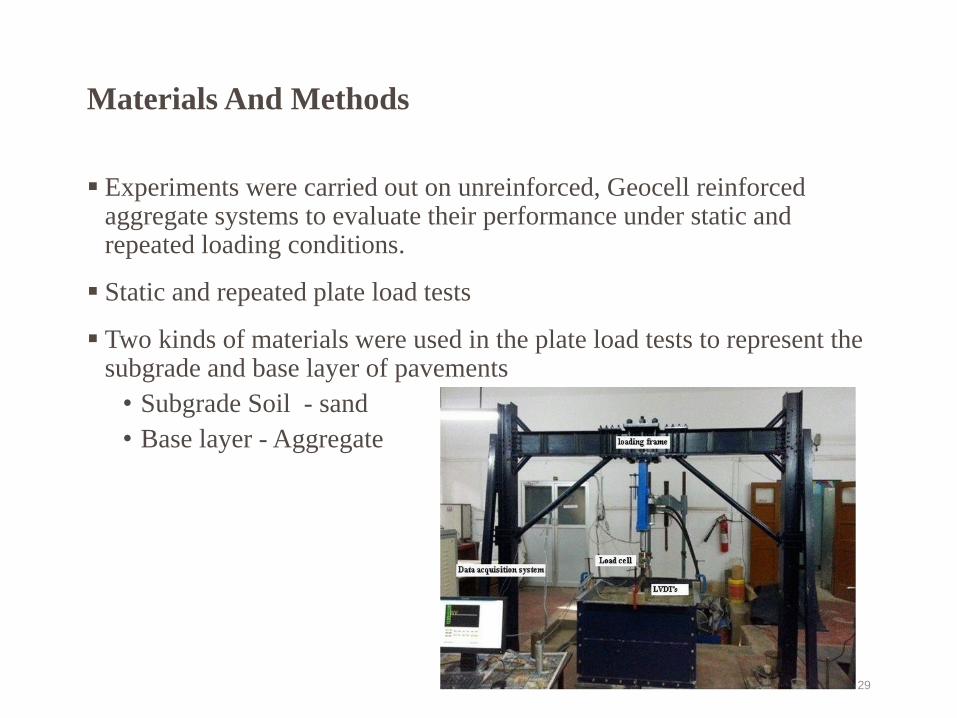
Experiments were carried out on unreinforced, Geocell reinforced aggregate systems to evaluate their performance under static and repeated loading conditions.
Static and repeated plate load tests
Two kinds of materials were used in the plate load tests to represent the subgrade and base layer of pavements
• Subgrade Soil - sand
• Base layer - Aggregate
29

Material Properties Sand Subgrade
Parameter Value
D10 0.2mm
D30 0.4mm
D60 0.48mm
Coefficient of Curvature(Cc) 1.67
Coefficient of uniformity(Cu) 2.4
Relative density 55%
CBR (soaked) 7%
CBR (unsoaked) 10% 30

Material Properties Base Aggregate
Properties Values
CBR (soaked) 78.45%
CBR(unsoaked) 115%
Aggregate Impact Value 24%
Aggregate Crushing Value 24%
31

Material Properties – Geocell
The geocell used in the present
study had a material composition of
High Density Polyethylene (HDPE)
with a density of 0.935 – 0.965 g/cc.
Height 100 mm
Thickness 1.3mm
Cell Size 330 × 180mm
Tensile strength 21 kN/m
Tensile strain at break (%) 93.20 %
Properties of Geocell
32

Experimental program
The experimental program was conducted on a iron tank of size 0.9 X 0.9 X 0.6 m
Hydraulic actuator of capacity 50kN was used to load the base material
A circular steel plate of 150 mm diameter was used to simulate the wheel load
The target load for the static test was 30kN
Each repeated plate load test was run for
3000 loading cycles by varying the loading
from 20kN, 25kN to 30kN after every
1000 cycles.
33
Experimental program
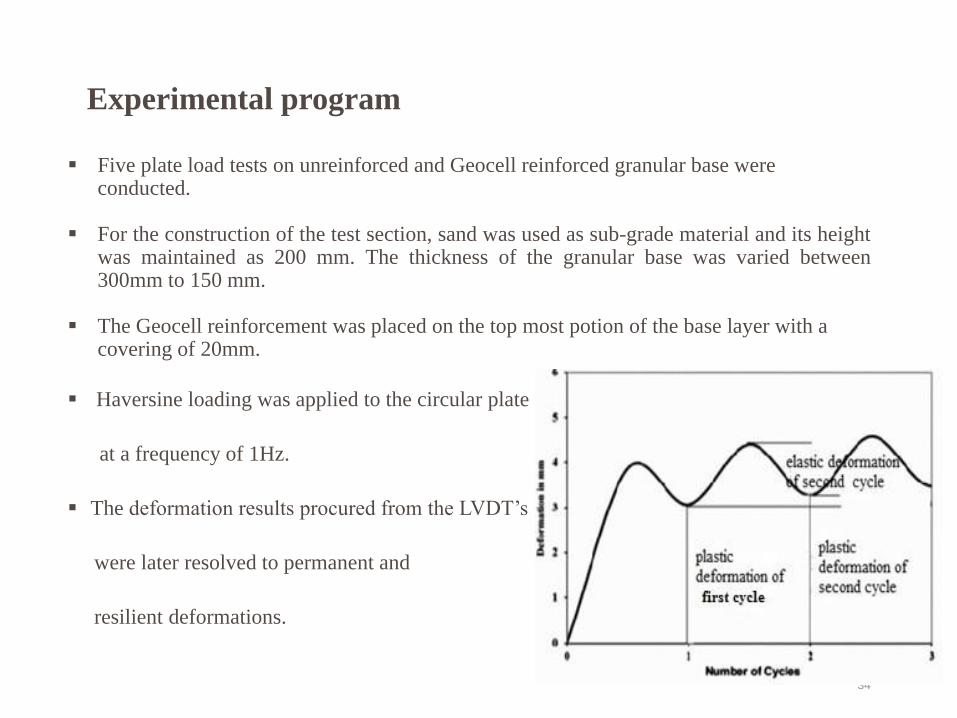
Five plate load tests on unreinforced and Geocell reinforced granular base were conducted.
For the construction of the test section, sand was used as sub-grade material and its height was maintained as 200 mm. The thickness of the granular base was varied between 300mm to 150 mm.
The Geocell reinforcement was placed on the top most potion of the base layer with a covering of 20mm.
Haversine loading was applied to the circular plate
at a frequency of 1Hz.
The deformation results procured from the LVDT’s
were later resolved to permanent and
resilient deformations.
34

Effect of Number of pockets of Geocell Static Loading
The number of pockets
affected the
performance of the
reinforced base layer
tremendously as it
increased the load
carrying capacity of
the base section.
The load is getting
distributed beyond the
width of the 4 cells of
Geocell thus resulting
in performance similar
to that of unreinforced
section.
35

Experimental Results on Repeated loading
36
Total deformation generated with number of cycles

Permanent Deformation Studies
With the increase in the pressure sudden increase in deformations were observed for unreinforced section.
As the loading cycles progressed, the rate of deformation decreased and almost becomes constant in the case of reinforced sections compared to the unreinforced section.
37

Permanent Deformation Studies
The reinforced sections reduce the
deformations by more than 70%
compared to the unreinforced section
having same thickness.
The rate of deformation did not attain a
constant value in the case of unreinforced
section and is much higher than the
reinforced section.
The shake down behavior was clearly
visible in case of Geocell reinforced
section
38

The geocell reinforced sections had
lower resilient deformations
compared to the unreinforced
section.
Even the geocell reinforced section
with lowest thickness of base
section, i.e. 150mm provided high
resistance to the deformations
compared to unreinforced section
of much higher thickness.
As the thickness of the base layer
increases, the resilient deformation
decreased.
As the applied pressure is increased
after each 1000 cycles, the resilient
deformation also increased
Resilient Deformation Studies

Resilient Deformation Studies
The resilient deformation of both reinforced and unreinforced section shows a fluctuating behavior throughout the cycles creating an uncertainty to the data.
All experimental data is correlated up to a certain limit known as correlation distance or scale of fluctuation, beyond which they will be treated as uncorrelated
Coefficient of variation and Correlation distance
40
2
e
1.96
hrN
Section Mean
(mm)
Standard
of deviation
COV
(%)
Scale of
fluctuation
(cycles)
300mm
unreinforced 1.0154 0.0899 11.48 3
300 mm
reinforced 0.7156 0.0822 8.521 17
150mm
reinforced 0.8792 0.0835 9.104 9
Resilient Modulus
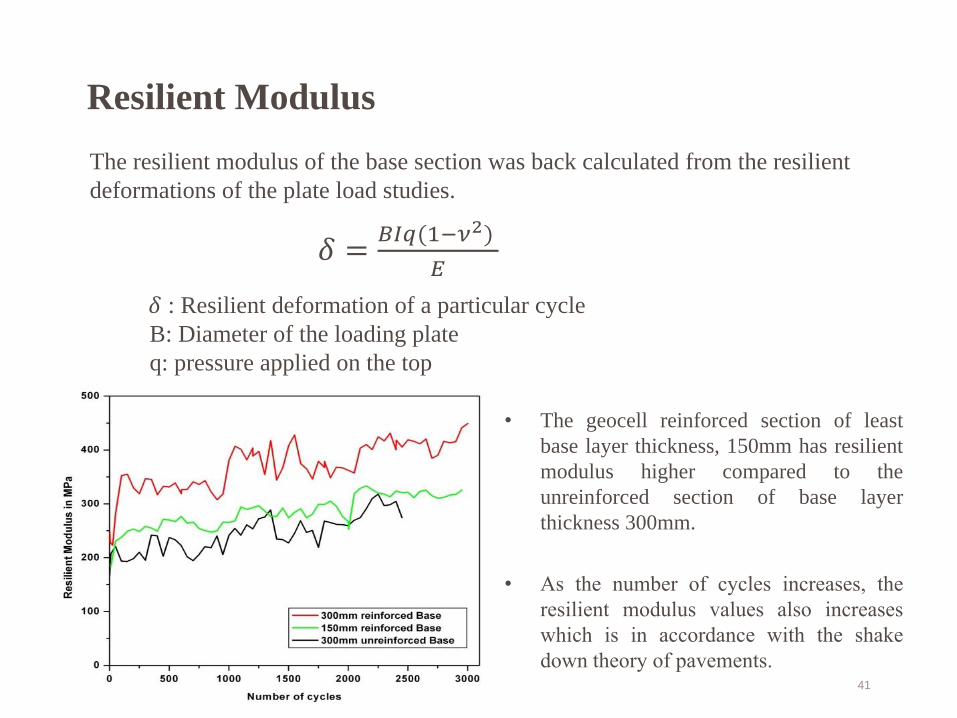
The resilient modulus of the base section was back calculated from the resilient
deformations of the plate load studies.
𝛿 : Resilient deformation of a particular cycle
B: Diameter of the loading plate
q: pressure applied on the top
𝛿 =𝐵𝐼𝑞(1−𝜈2)
𝐸
• The geocell reinforced section of least
base layer thickness, 150mm has resilient
modulus higher compared to the
unreinforced section of base layer
thickness 300mm.
• As the number of cycles increases, the
resilient modulus values also increases
which is in accordance with the shake
down theory of pavements.
41

Equivalent Axle Load Factor
The loading used on the base material was much higher compared to the
standard tyre pressure of 550kPa.
To convert the permanent deformations due to higher loading cycles into
equivalent number of standard axle loading by using the concept of
Equivalent Axle Load Factor (EALF).
The value of n can be found out from the regression analysis by plotting
EALF vs P’/550 as EALF would be known from the experiment for each
loading of P’/550.
Sun et al. (2015) concluded that the value of power term n as 1.9 for
unreinforced section.
'
550
' 550
n
N PEALF
N
42
Equivalent Axle Load Factor
• Repeated plate load tests were carried out on 200mm thick base course to
investigate the load equivalency for Geocell reinforced unpaved road and to
find the value of power term n.
• The intensities of cyclic loading applied were 0.6t, 0.8t, 1t, 1.2t and 1.4t
which correspond to a pressure of 330kPa, 440kPa, 550kPa, 660kPa and
770kPa respectively.
• Each loading was maintained for 250 cycles and the number of cycles
required to reach a certain permanent deformation was noted. Since the
material was strong the deformations were fixed to be 1mm and 2mm.
• By gradually increasing the loading and restricting the number of cycles to
250, the shake down behavior of the aggregate was not allowed to occur.
• This study helps to model the response of an unpaved section under long
term loading stresses in relation to the stress corresponding to the standard
stress (550kPa).
43

Load cycles to reach same surface deformation under different pressure intensities
Type Permanent Deformation
(mm)
Pressure Applied on the Base Material
Geocell
Reinforced
330kPa 440kPa 550kPa 660kPa 770kPa
1 NA 120 85 46 28
2 NA 245 150 92 60
2.55'
550
' 550
N P
N
44
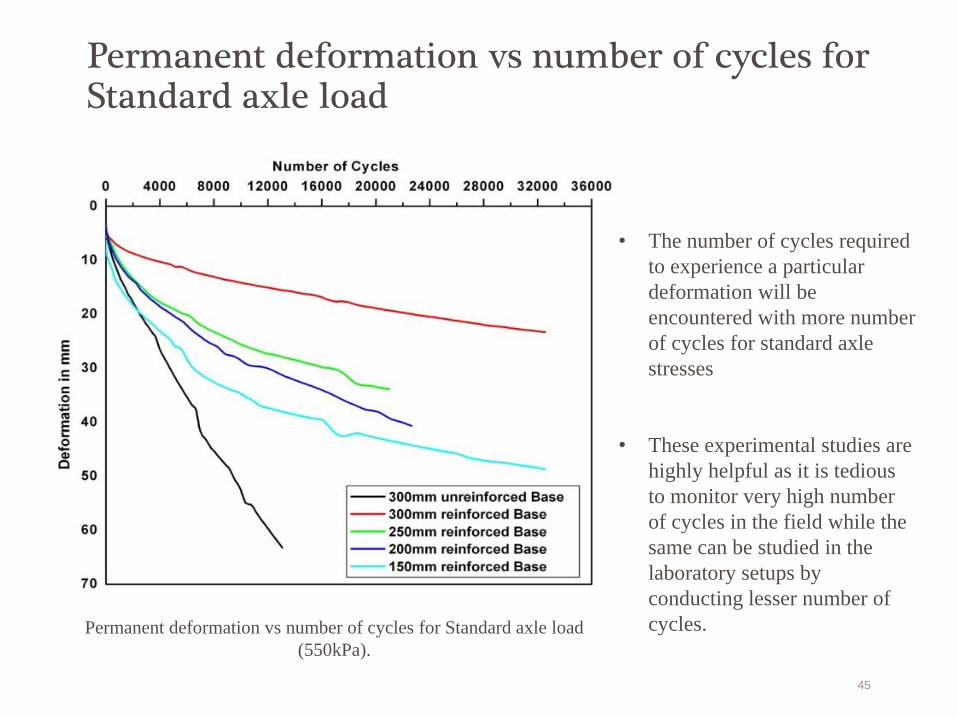
Permanent deformation vs number of cycles for Standard axle load
Permanent deformation vs number of cycles for Standard axle load
(550kPa).
• The number of cycles required
to experience a particular
deformation will be
encountered with more number
of cycles for standard axle
stresses
• These experimental studies are
highly helpful as it is tedious
to monitor very high number
of cycles in the field while the
same can be studied in the
laboratory setups by
conducting lesser number of
cycles.
45

Rut Depth Reduction
• The rut depth reduction is used as to quantify the performance improvement of
geocell reinforcement over unreinforced section under repeated loading.
• The rut depth reduction is defined as the ratio of difference between
cumulative permanent deformations of the unreinforced layer and Geocell
reinforced layer to that of the unreinforced layer for a particular number of
loading cycle
( ) (1 ) *100reinN n N n
unrein
CPDRDR
CPD
46

Rut Depth Reduction
As the thickness of the reinforced section reduced, RDR values also reduced considerably.
The negative value of RDR in the reinforced section of 150mm shows that, during the initial cycles, rate of reduction in permanent deformation or rut depth reduction is not as much as that of unreinforced section having 300mm thickness. But as the number of cycle increases, 150mm thick reinforced layer is found to be more effective in reducing the permanent deformation compared to the unreinforced section.
In all the cases the RDR rate decreased as the number of cycles increased. This was due to the reduction in rate of permanent deformation due to the densification of the reinforced layer.
47

Modeling permanent deformation of Geocell reinforced Base layer
In Mechanistic Empirical Pavement Design Guide (MEPDG), the behavior of
granular soil under repeated load is analyzed using a mechanistic empirical model,
based on the observation that when the applied load is lower than a threshold level,
granular soil will eventually become purely resilient after a large number of load
passes and accumulate permanent strain with the increase in number of load cycles
The model developed for granular base materials by Tseng and Lytton (1989)
The vertical resilient strains along the center line of the load at the mid depth of the
base layer can be acquired by two methods.
Extract the strains from software packages
The strains from strain gauges fixed on the walls of geocell.
0( ) N
p cal v
r
N h e
48

Modeling permanent deformation of Geocell reinforced Base layer
Finite Element modeling (Plaxis 2D) was
used in order to obtain the strain at the
middle of the layer
Standard boundary condition was applied
on the section i.e. the bottom of the model
was fixed in the horizontal and vertical
directions while only horizontal
movement was restrained at the sides of
the model.
The Geocell reinforced base layer was
modeled as a soil layer with improved
properties.
A linear elastic model was used to model
the soil properties of subgrade sand while
the unreinforced and Geocell reinforced
base layers were modeled using Hardening
Soil (HS) model.
49

Modeling permanent deformation of Geocell reinforced Base layer
The parameters like 𝜀0
𝜀𝑟 , ρ and β
along with βcal were calibrated
and validated for unreinforced
and geocell reinforced section
from these two models.
Section Calibrated parameters
Unreinforced
βcal = 1 ; ρ = 700
β = 0.2 ; (𝜀0
𝜀𝑟) = 270
Reinforced
βcal = 1.5 ; ρ = 1800
β = 0.2 ; (𝜀0
𝜀𝑟) = 75
50

Field Studies
• Field studies were carried out to study how geocell reinforced
pavements preformed in the real traffic conditions.
• The performances of the geocell reinforced pavements were
further analyzed by comparing its performance with other
reinforcing methods like geogrid, bamboo and road mesh.
• In Chamarajnagar district, Kestur Village a rural road of
4.285km stretch is selected for the construction and analysis.
• The sections used in the field correspond to a thickness of
20mm for bituminous surface and 175mm thickness for the
granular subbase layer.
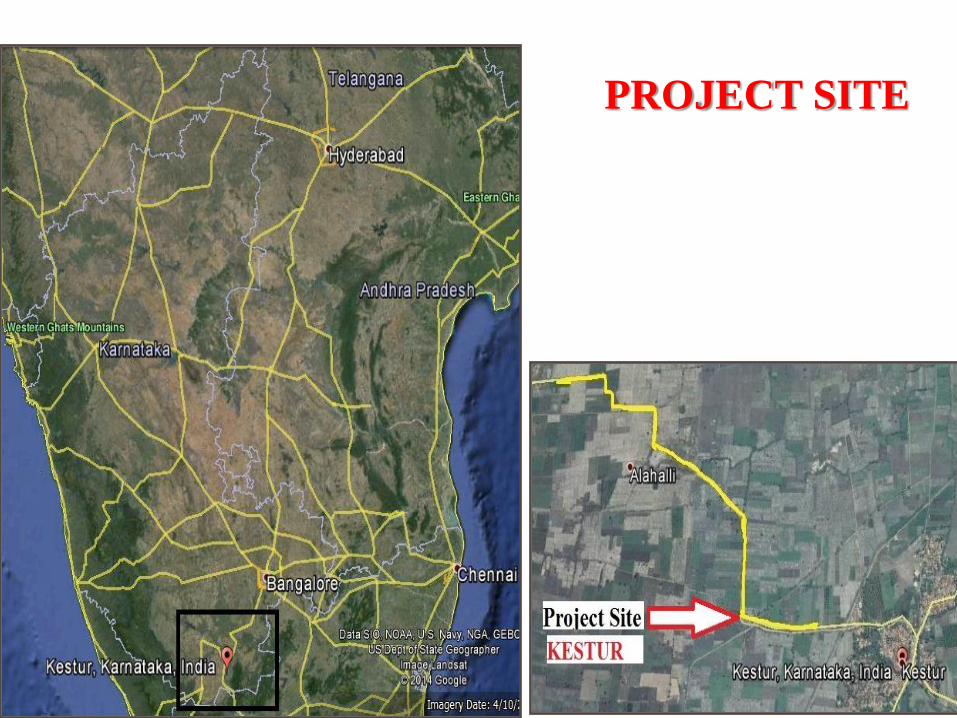
PROJECT SITE

Longitudinal cross section

Table- Cross section details of different experimental sections
Type of Experimental Section Cross section details
Conventional 20mm PMC, 150 mm Granular base, 125mm
GSB, compacted subgrade
Geocell-150mm 20mm PMC, 150mm geocell infilled GSB,
compacted subgrade
Geocell-100mm 20mm PMC, 100mm Geocell in filled GSB,
compacted subgrade
Bamboo 20mm PMC, 250 mm Granular base infilled in
bamboo grid, 125mm GSB, compacted
subgrade
Road Mesh 20mm PMC, 200 mm Granular base infilled in
road mesh, 125mm GSB, compacted subgrade
Geogrid 20mm PMC, 100 mm Granular base above
geogrid, 125mm GSB, compacted subgrade

Fig. Laying of geocell and placing of infill

Fig. Spreading and anchoring geogrid
Fig. Laying of bamboo and placing of infill

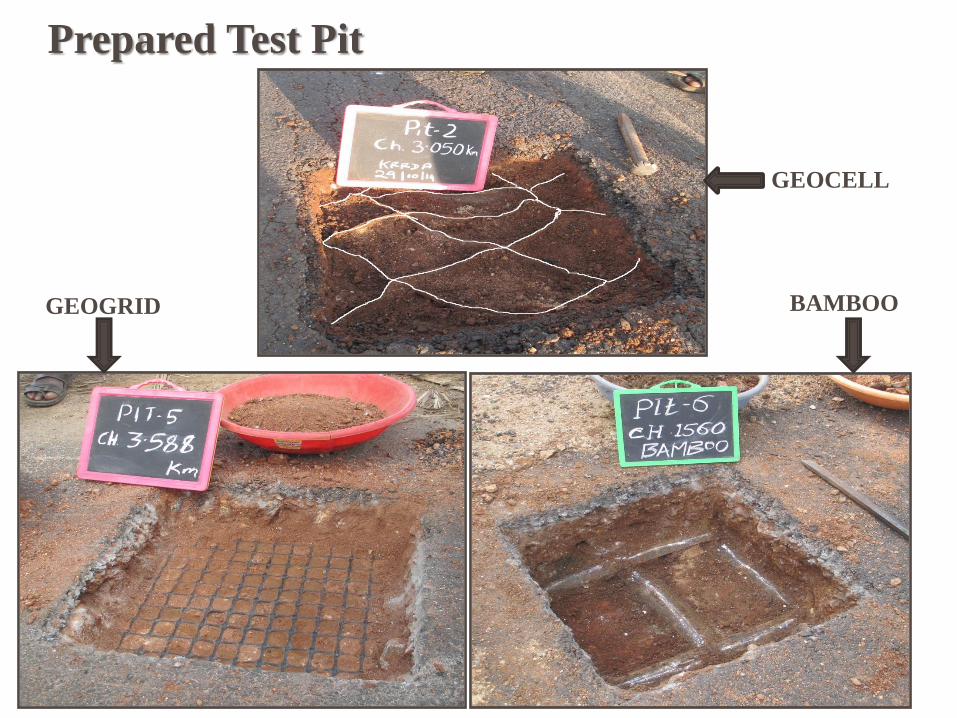
Prepared Test Pit
GEOCELL
GEOGRID BAMBOO

Characteristic Rebound Deflections on Experimental Road Sections by Benkelman Beam Method
Type of
experimental
section
Chainage Measurement
interval (m)
Characteristics
deflection (mm)
From
(km)
To
(km)
Conventional-1 0.9 1.414 50 2.29
Bamboo 1.414 1.917 50 2.60
Conventional-2 1.917 2.659 50 2.65
Road mesh 2.659 2.847 20 2.28
Geocell-150mm 2.847 3.095 20 5.89
Geocell-100mm 3.095 3.347 20 3.27
Geogrid 3.449 3.652 20 2.60
Conventional-3
3.652 4.285 50 2.28

Resilient modulus values of Different Component Layers Based on FWD Data (I Year)
Type of
experiment
al section
Chainage Length
of
section
(m)
E-value s of different component Layers
From
(km)
To
(km) Pre-
mix
carpet
Water
bound
macadam
Bamboo
with soil
aggregat
e
Road
mesh +
soil
aggregate
150mm
geocell
with
GSB
100mm
geocell
with
GSB
Geogrid
with
soil
aggrega
te
GSB Subgrade
Conventiona
l-1
0.9 1.414 514 566 757 - - - - - 377 127
Bamboo 1.414 1.917 503 667 - 498 - - - - 305 86
Conventiona
l-2
1.917 2.659 742 405 563 - - - - - 199 91
Road mesh 2.659 2.847 188 444 - - 451 - - - 304 75
Geocell-
150mm
2.847 3.095 248 520 - - - 248 - - - 54
Geocell-
100mm
3.095 3.347 252 533 - - - - 432 - - 81
Geogrid 3.449 3.652 203 428 - - - - - 561 388 79
Conventiona
l-3
3.652 4.285 633 536 707 - - - - - 241 114

Resilient modulus values of Different Component Layers Based on FWD Data (III Year)
Type of
experiment
al section
Chainage Length
of
section
(m)
E-value s of different component Layers
From
(km)
To
(km) Pre-
mix
carpet
Water
bound
macadam
Bamboo
with soil
aggregat
e
Road
mesh +
soil
aggregate
150mm
geocell
with
GSB
100mm
geocell
with
GSB
Geogrid
with
soil
aggrega
te
GSB Subgrade
Conventiona
l-1
0.9 1.414 514 533 656 - - - - - 256 114
Bamboo 1.414 1.917 503 565 - 310 - - - - 148 73
Conventiona
l-2
1.917 2.659 742 514 358 - - - - - 125 67
Road mesh 2.659 2.847 188 539 - - 338 - - - 157 68
Geocell-
150mm
2.847 3.095 248 519 - - - 207 - - - 57
Geocell-
100mm
3.095 3.347 252 523 - - - - 244 - - 78
Geogrid 3.449 3.652 203 525 - - - - - 410 291 79
Conventiona
l-3
3.652 4.285 633 520 707 - - - - - 265 112
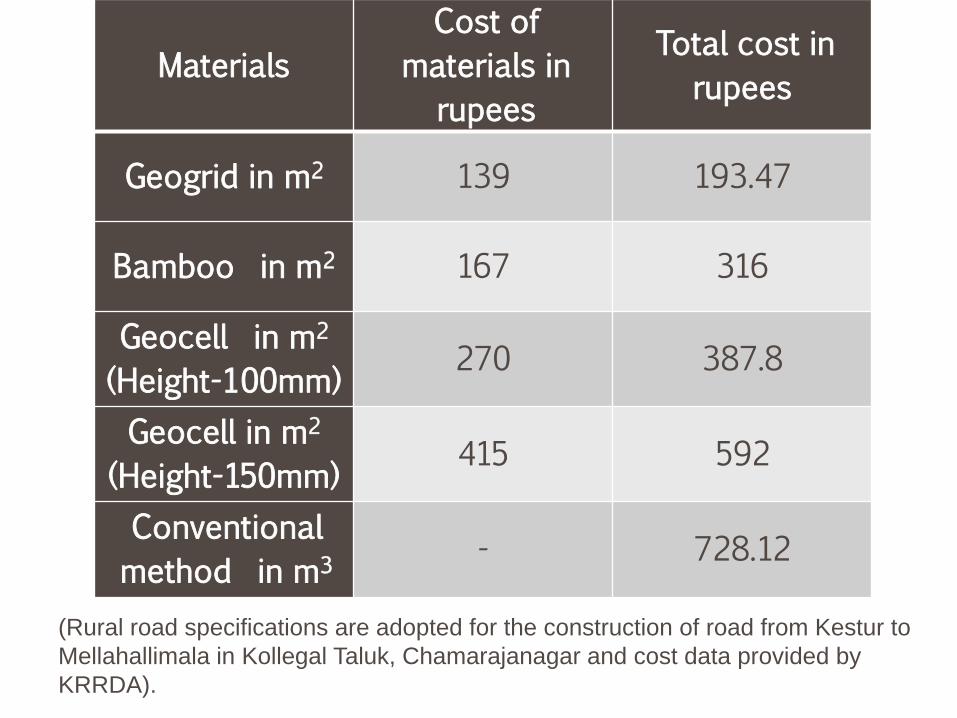
Materials
Cost of
materials in
rupees
Total cost in
rupees
Geogrid in m2 139 193.47
Bamboo in m2 167 316
Geocell in m2
(Height-100mm) 270 387.8
Geocell in m2
(Height-150mm) 415 592
Conventional
method in m3 - 728.12
(Rural road specifications are adopted for the construction of road from Kestur to
Mellahallimala in Kollegal Taluk, Chamarajanagar and cost data provided by
KRRDA).
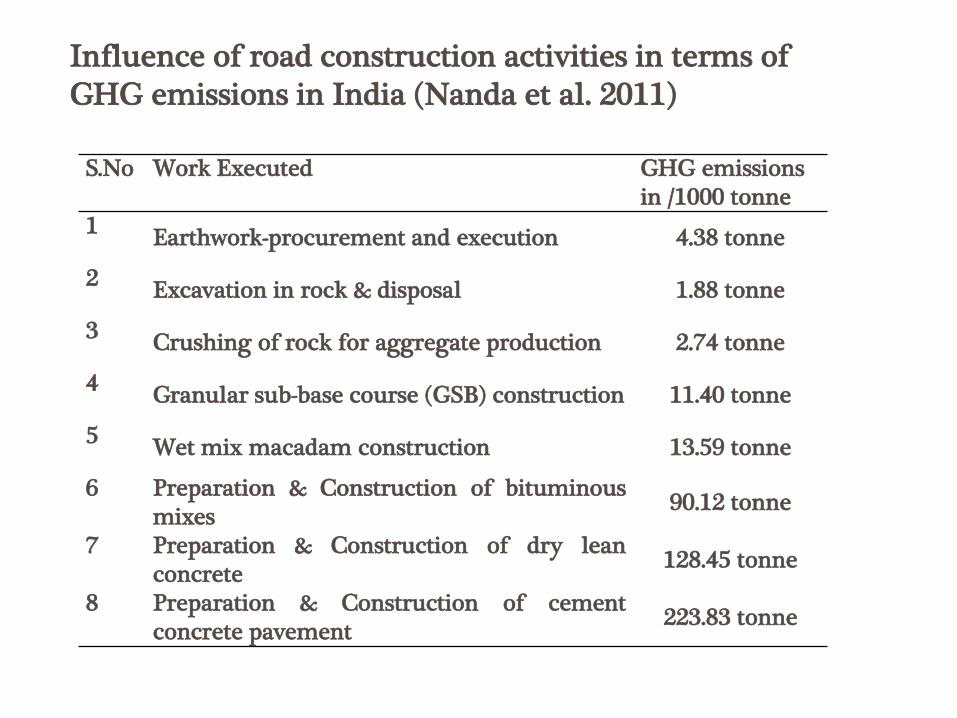
S.No Work Executed GHG emissions in /1000 tonne
1 Earthwork-procurement and execution 4.38 tonne
2 Excavation in rock & disposal 1.88 tonne
3 Crushing of rock for aggregate production 2.74 tonne
4 Granular sub-base course (GSB) construction 11.40 tonne
5 Wet mix macadam construction 13.59 tonne
6 Preparation & Construction of bituminous mixes
90.12 tonne
7 Preparation & Construction of dry lean concrete
128.45 tonne
8 Preparation & Construction of cement concrete pavement
223.83 tonne
Influence of road construction activities in terms of GHG emissions in India (Nanda et al. 2011)
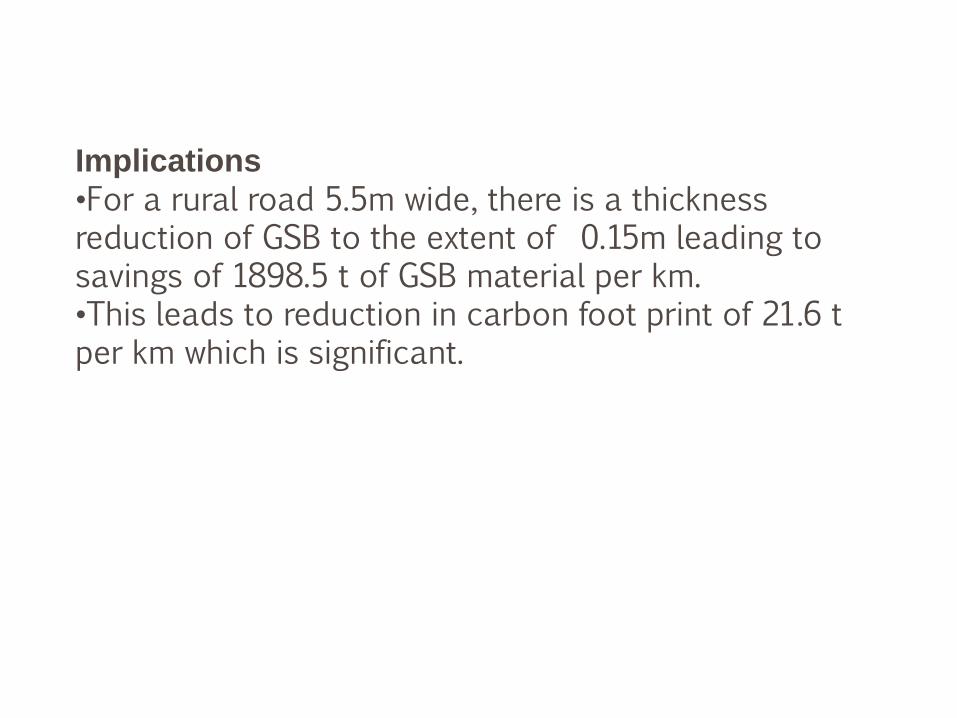
Implications
•For a rural road 5.5m wide, there is a thickness reduction of GSB to the extent of 0.15m leading to savings of 1898.5 t of GSB material per km. •This leads to reduction in carbon foot print of 21.6 t per km which is significant.
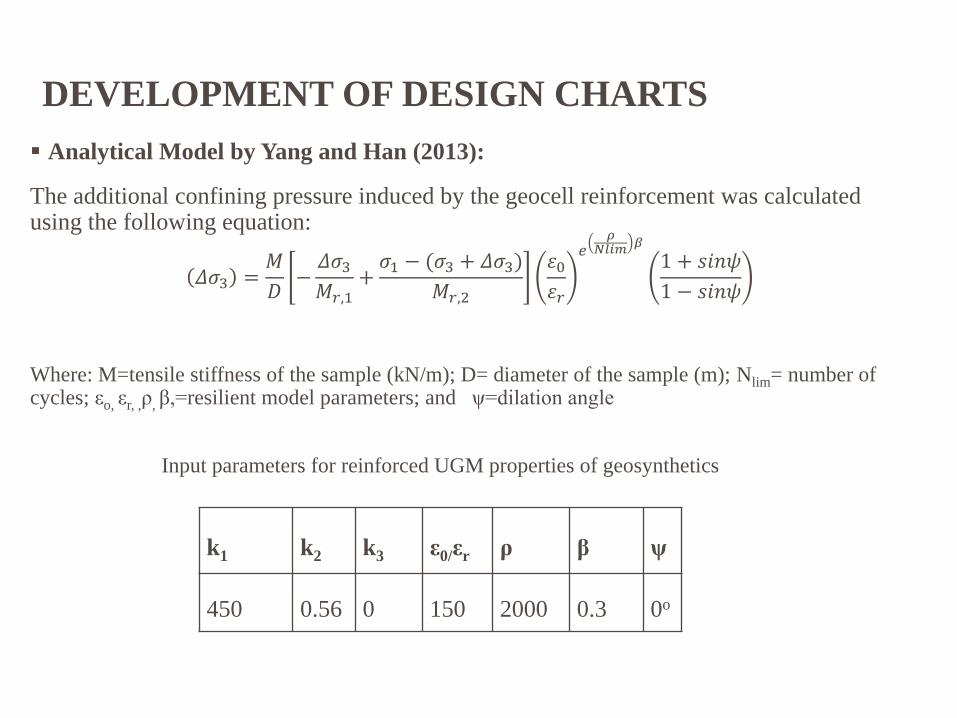
DEVELOPMENT OF DESIGN CHARTS
Analytical Model by Yang and Han (2013):
The additional confining pressure induced by the geocell reinforcement was calculated using the following equation:
𝛥𝜎3 =𝑀
𝐷−
𝛥𝜎3
𝑀𝑟,1+
𝜎1 − (𝜎3 + 𝛥𝜎3)
𝑀𝑟,2
휀0
휀𝑟
𝑒𝜌
𝑁𝑙𝑖𝑚𝛽
1 + 𝑠𝑖𝑛𝜓
1 − 𝑠𝑖𝑛𝜓
Where: M=tensile stiffness of the sample (kN/m); D= diameter of the sample (m); Nlim= number of cycles; εo, εr, ,ρ, β,=resilient model parameters; and ψ=dilation angle
k1 k2 k3 ε0/εr ρ β ψ
450 0.56 0 150 2000 0.3 0o
Input parameters for reinforced UGM properties of geosynthetics


Resilient modulus versus number of cycles
(through Yang et. al (2013) method)


SUMMARY AND CONCLUSIONS
From the studies it was observed that the geosynthetic reinforcement in the unbound granular layers effectively reduces the permanent deformation compared to the unreinforced section.
For the same thickness, it was noted that the permanent deformation per cycle was much higher for unreinforced section compared to the reinforced section
It was noted from the study that the geosynthetic reinforcement could reduce more than 70% of the permanent deformation when compared to that of unreinforced section.
The resilient deformation for the reinforced section was much lower when compared to the resilient deformation of the unreinforced section
Field studies clearly showed the effectiveness of geosynthetics in pavements
70

Thank you for your attention
Dr. G L Sivakumar Babu
Professor
Department of Civil Engineering
Indian Institute of Science
Bangalore 560012
Email: [email protected]
M 9448480671

72
Geotechnical failures
due to natural
hazards, manmade
hazards
…. Welcome to Paris!
Final Meeting, Brussels, 26 January 2009

Natural causes such as earthquakes, rainfall etc
Manmade causes
Site investigations
Insufficient investigations (laboratory and field)
Selection of design parameters
Design deficiencies
Construction errors
Material defects
Maintenance deficiencies
73

December 8-10, 2016
Satish Dhawan Auditoriam Bengaluru

Evidence/data collection
Distress characterization
Design review/Analysis of conditions of failure
Specifications/standards review
Use of diagnostic tests (laboratory and field tests)
Role of instrumentation and sensor based technologies
Failure hypothesis formulation
Back analysis
Technical short comings
Risk analysis
Liability assessment
75

Prof. David Frost, USA Prof. Bob Gilbert, USA
Prof. Krishna Reddy, USA
Prof. Anand Puppala, USA
Prof. Binod Tiwari, USA
Prof. Miguel Pando, USA
Dr. Maureen K. Corcoran, USA
Mr. Mike Drerup, USA
Prof. Ikuo Towhata, Japan
Prof. Masayuki Hyodo, Japan
Prof. Yoshinori Iwasaki, Japan
Prof. Malek Bouazza, Australia
Prof. Gopal Madabhushi, UK
Prof. Limin Zhang, Hong Kong
Prof. Vikas Thakur, Norway
Prof. W F Lee, Taiwan
Prof. Sai Vanapalli, Canada Prof. Manoj Datta, India Prof. . G V Rao, India

Analysis of failures and learning from failures need to form an important of geotechnical engineering analysis and design.
This leads to better design and analysis procedures
Better codal procedures can be developed.
It ultimately saves lives and infrastructure losses and ensures proper accountability.