Drug Formulary Checks Configuring RPMS-EHR for Meaningful Use Resource Patient Management System.

Use of EHR big data to predict patient safety events
Hyeoun-Ae Park, RN, PhD, FAAN, IAHSI
Professor
College of Nursing
Seoul National University

2
Despite the best efforts of health care
providers, errors do occur while caring
for patient

Goal and Scope of the Study
• The goal of this study is to learn from data collected at the point of care and use that learning to promote patient safety or prevent patient safety events.
• Four patient safety problems (fall, pressure ulcer, unplanned extubation and adverse drug reaction of chemotherapy) were studied

Electronic
Health System
Clinical Data
Repository
Prediction system
Clinical Decision
Support System for
Prevention
Literature
Big data analytics
& Prediction model fitting
Knowledge
Database
Development of Computer
Interpretable Guideline
Big data Platform
Clinical
Practice
Guideline
Selecting features
Mapping features
Patient Safety
Reporting system
Extracting knowledge
Phase 1 Phase 2
Phase 3
Target: High Risk Patients Target: Patients with EventsTarget: Inpatients
Extracting data
Patient Safety Prediction and Prevention System

Fall

Study Subjects
• Case group: XXX patients who fell during hospital stay in neurology or hemato-oncology departments from Jan 1, 2015 to May 31, 2016
• Control group: XXXXX patients who did not fall during hospital stay in the same departments during the same period

Identifying Fall cases
• XXX fallers (XX%) were identified with ‘fall’ as a reason for safety event from the patient safety reports
• Additional XXX fallers (XX%) were identified with fall-related narratives from nursing notes
낙상함 (fall) 주저앉음 (drop) 넘어짐 (tumble) 쓰러짐 (collapse) 미끄러져 넘어짐
(slip down)
바닥에 몸을 던짐(throw oneself onto the floor
침대에서 떨어짐 (fall from bed) 침대에서 휠체어로 이동 중 fall down
됨 (fall from bed during transferring to wheelchair)
침대에서 휠체어로 이동 중 slip down 됨 (slip down from bed during transferring to wheelchair)

Feature Selection and Extraction
• 160 features identified from literature review
• 160 features were identified in 10 different
data sources1. Clinical observation
sheet; 2. Initial nursing
assessment; 3. Patient acuity
classification system; 4. Laboratory results report; 5. Doctor’s medication
order;
6. Fall risk assessment form;
7. Nursing activity sheet; 8. Surgical information
sheet; 9. Doctor’s progress
note; 10. Narrative nursing
notes

Data Sources by FeatureFeatures (example)
Type of data sources
A B C D E F G H I J
IV therapy ˅ ˅ ˅ ˅
Depressed, confusion, altered elimination ˅ ˅ ˅
Tube/drainage, restraints, bed rails ˅ ˅ ˅
Pain, anxiety, hyperthermia, ˅ ˅
Dizziness/vertigo ˅ ˅
Enema ˅ ˅
Age, sex ˅
Fall-risk score ˅
Drug (by types) ˅
Operation ˅
Hematocrit ˅
Diagnosis ˅
Walking aids, anorexia, fatigue, caregiver ˅
A. clinical observation sheet; B. initial nursing assessment; C. patient acuity classification system; D. laboratory results report; E. doctor’s medication order; F. fall risk assessment form; G. nursing activity sheet; H. surgical information sheet; I. doctor’s progress note; J. narrative nursing notes

Features in Different PresentationFeature Source Presentation ID 세부항목 ID 세세부항목 ID
우울 임상관찰기록 정신신체평가 21037 기분 21660 depression 30625
낙상사정도구 Symptomaticdepression
간호진술문 우울증 있음
우울해 함
어지러움/현기증 간호진술문 어지러움증 있음
어지러움증 증가함
어지러움증 호소함
어지럽고 식은땀이 난다고 호소함
일어서니 어지럽다 함
현기증 있음
Dizziness 있음
Dizziness 호소함
Vertigo 있음
Feature Source 표준코드 ATC코드 한글상품명
항고혈압제 복용 약품/투여정보 8806559015401 C02AC01 센트랄염산클로니딩주사액
8806559040212 C02CA04 카데리나정
Dizziness

Admission Discharge
“Stoppd inhalation of oxygen 2L by nasal cannula” in Nurses’ note
“Oxygen administration by nasal cannula” in Nursing activity sheet
“Oxygen therapy, method: nasal cannula, oxygen flow rate: 2L” in Clinical observation record
(occurrence of fall)
1/1 15:001/1 09:00 1/1 13:00
Example: oxygen therapy
Features with more than one data points

Feature Normalization
• Since the same feature can be extracted from more than one data source and the same feature is documented in many different ways (structured or unstructured) and more than once in a data source, we need to normalize the data.
• Principles used for feature normalization– Usability: used structured data over unstructured data– Currency: used data documented closer to the event
(case group: fall, control group: discharge) within allowed time frame
– Completeness: used a data source with higher recoding rate
– Granularity: used data documented in more detail.

Admission Discharge
Gender, route of admission, smoking..
Edema, weakness, pain..
(occurrence of patient safety event)
Surgery, diagnosis
Grouping Risk Factors by Data Extraction
Time① Documented once at
admission
② Documented once between admission and patient safety event
③ Documented more than once per day or per shift
Maximum data extraction allowance time

Patient No.Last time the PAIN
was recorded
Time of fall
occurrence. Time difference
1 Jan 1 Jan 2 2
2 Feb 15 Feb 15 1
3 Nov 10 Nov 12 3
4 May 7 May 8 2
5 Jun 22 Jun 22 1
6 Sep 3 Sep 4 2
7 Aug 27 Aug 29 3
Mean time difference = 2 days
If pain was recorded within 1 day before the onset of a pressure ulcer,
a patient has pain; otherwise, the patient does not have pain.
Maximum Data Extraction Time Allowed

Maximum data extraction time allowed by feature
CASE
CONTROL
event date
-1day-2day-3day-5day -4day-7day
-7day -3day -2day -1day
drainage
iv-therapy
heparin lock
acuity score
Foley cath.
restraints
mental status
pain
23 medicine
lab results
fall risk
score
-5day -4day
bed rails
guardianc-line
SurgeryDiagnosis
SurgeryDiagnosis
sex, age
history of diseases
admission route
functional disorder
(type)
dysuresia
assistant device
anorexia
sensory disorder
admission
admission
discharge
Fall discharge

P
Study subjects
Any pain documentation
in clinical observation
sheet?
Pain degree documented?
Pain?
Any painDocumentation
in nursing notes?
Clinical observation
sheet
Nursing Notes
Pain with degree
Pain without degree
Not documented
No pain
yes no
no
no
yes
yes
yes
yes
Pain degree documented?
no
no
Feature Normalization • Ex: Pain and degree of pain
documented within 24 hours before a fall event
Diffe
rent fo
rms
Pain?
yes
no

Statistical Analyses
• Descriptive statistics and visualization for the characteristics of case and control groups
• Univariate analyses (t-test/Mann-Whitney U test, one-way ANOVA/Kruskal-Wallis test, simple linear regression) to select significant features to be included in the prediction models

Fall Prediction Models
• Three prediction models were tested:
– A logistic regression model
– A Cox proportional hazard model,
– A decision tree model
• Training data set : Test data set = 7:3

Clinical Characteristics of Study Subjects
Fallers
(n=XXX cases)
Non-faller
(n=XXX cases) p-value
mean(±sd) or n(%) mean(±sd) or n(%)Age 62.9 (±14.7) 58.4 (±15.3) <.001
Sex M XXX (60.0) XXXX (53.7) .031
F XXX (40.0) XXXX (46.3)
Medical
Department
Neurology/Neurosurgery
XXX (47.7) XXXX (55.4) .007
Hematology/
OncologyXXX (52.3) XXXX (44.6)
LOS in hospital 23.0 (±19.3) 8.7 (±11.6) <.001
Time to fall from admission 10.9 (±12.9) -Fall-risk score (by Hendrich II) 6.4 (±2.6) 3.2 (±2.9) <.001

Time to fall from admission (n=XXX)
0
5
10
15
20
25
30
0 1 2 3 4 5 6 7 8 9 101112131415161718192021222324252729303435373839454648515962636572758183
Median = 7 daysMean = 10.9 daysIQR = 11(3.0-14.0) days
48.7% within 1 week after admission

0
5
10
15
20
25
30
35
0.05 0.1 0.15 0.2 0.25 0.3 0.35 0.4 0.45 0.5 0.55 0.6 0.65 0.7 0.75 0.8 0.85 0.9 0.95 1
Num
ber
of
fallers
Time to fall/LOS
On discharge date
Distribution of time to fall from admission
length of stayof fall patients (n=XXX)
Median LOS = 19 daysMean LOS = 23 daysIQR = 20.7(9.3-30.3) days

sex
age
Admission route
Administration of vasodilator
Administration of nitrates
Administration of diuretics
Administration of cardiac stimulant
Administration of antidepressant
Administration of benzodiazepine
Administration of antipsychotics
Mental status
depression
Sleep disorder
Dysuria
Operatrion_neurology
Operation_cardiology
Operation_musculoskeletal
• Fever
• Dizziness/vertigo
• Communication disorder
• Guardian
• Other drainage
• Heparin lock
• IV therapy
• Diabetes mellitus
• Musculoskeletal disease
• Cardiovascular disease
• Unspecified cancer
• Respiratory cancer
• Walking disorder
• Balance disorder
• Restricted activity
• Total fall risk score
• Patient acuity score
34 Significant Features Selected by Univariate Analyses

-1.000
-0.800
-0.600
-0.400
-0.200
0.000
0.200
0.400
0.600
0.800
1.000
낙상
위험
군_위
험군
보행
보조
기구
사용
보행
장애
여부 TIA
배뇨
장애
헤파
린락
보유
통증
침상
난간
관장
의식
상태
인지
/사고
장애
신경
계수
술여
부
운동
장애
-보행
제외
마약
성진
통제
투약
감각
저하
기타
항우
울제
(ssir, t
ca제
외)
기타
신경
계약
물투
약
활동
수준
제한
vaso
dila
tor
투약
기타
근골
격계
질환
a-lin
e 보
유
배변
장애
e-t
ube 보
유
항당
뇨제
투약
nsa
ids
투약
불안
기타
배액
관
항파
킨슨
제투
약
균형
장애
식욕
부진
피로
/허약
감
항히
스타
민제
투약
c-lin
e 보
유
레닌
안지
오텐
신투
약
뇌졸
중
호흡
기, 흉
곽내
암
과거
수면
장애
음주
여부
항응
고제
투약
Feature Profiling
fall non-fall average

Variables CoefficientOddsratio(OR)
95% CI(OR) z value Pr(>|z|)
Cardiac_stimulant 0.311 1.364 0.761-2.329 1.093 0.275
Antipsychotic drug 0.556 1.744 1.151-2.592 2.690 <0.01
Mentalstate_confused/drowsy
-1.355 0.258 0.157-0.418 -5.449 <0.001
Mentalstate_coma/semi coma
-16.345 0.000 - -0.049 0.961
Depression -1.092 0.336 0.221-0.500 -5.266 <0.001
Sleep disorder 0.452 1.572 1.033-2.331 2.185 0.029
Dysuresia 0.911 2.488 1.691-3.596 4.744 <0.001
Operation_neurology 0.782 2.185 1.433-3.269 3.723 <0.001
Operation_muscular 1.543 4.678 2.277-8.946 4.444 <0.001
Dizziness 0.473 1.605 1.180-2.170 3.045 <0.01
Guardian -1.836 0.159 0.115-0.220 -11.159 <0.001
Heparin_lock -0.409 0.664 0.489-0.906 -2.605 <0.01
IV_therapy 0.690 1.994 1.468-2.723 4.383 <0.001
Unspecified cancer 0.636 1.889 1.334-2.645 3.651 <0.001
Respiratory cancer 0.509 1.664 1.092-2.477 2.444 0.015
Walking disorder 0.923 2.516 1.461-4.167 3.464 <0.001
Restricted activity 0.435 1.545 1.097-2.170 2.499 0.012
Fall risk score 0.400 1.492 1.378-1.617 9.799 <0.001
Acuity score 0.036 1.036 1.015-1.058 3.336 <0.001
Result: Logistic Regression Analysis

Predicted
Observed
Fall No fall Total
Fall
No fall
Total
Sensitivity = 75.0%Specificity = 76.2%Positive predicted value = 5.25%Negative predicted value = 99.43%Accuracy =76.15%AUC = 0.836
Result: Logistic Regression

Result: Decision Tree

Predicted
Observed
Fall No fall Total
Fall
No fall
Total
Sensitivity = 78.6%Specificity = 76.6%Positive predicted value= 7.11%Negative predicted value = 99.37%Accuracy = 76.66%AUC = 0.839
Result: Decision Tree

K-M Survival Curve

Variables CoefficientHazard
ratio(HR)95% CI(HR) z value Pr(>|z|)
Age 0.013 1.013 1.004-1.023 2.904 0.004
Diuretics 0.402 1.494 1.060-2.107 2.290 0.022
Mentalstate_confused/drowsy
-1.073 0.342 0.220-0.531 -4.771 <0.001
Mental state_coma/semi coma
-17.870 0.000 - -0.013 0.990
Depression -0.845 0.429 0.297-0.620 -4.505 <0.001
sleep_ disorder 0.449 1.566 1.086-2.259 2.400 0.017
Dysuria 0.832 2.297 1.647-3.203 4.900 <0.001
Fever -0.926 0.396 0.220-0.715 -3.076 0.002
Dizziness 0.413 1.511 1.141-2.000 2.884 0.004
Guardian -2.030 0.131 0.098-0.175 -13.827 <0.001
Other drainage -0.403 0.668 0.459-0.972 -2.110 0.035
IV therapy 0.858 2.358 1.788-3.111 6.070 <0.001
Unspecified cancer 0.459 1.583 1.158-2.164 2.882 0.004
Walking disorder 1.414 4.111 2.603-6.494 6.061 <0.001
Fall risk score 0.288 1.334 1.245-1.430 8.145 <0.001
Acuity score 0.036 1.037 1.017-1.057 3.690 <0.001
Result: Cox Proportional Hazard Model

Predicted
Observed
Fall No fall Total
Fall
No fall
Total
Sensitivity =71.3%Specificity = 71.9%Positive predicted value = 4.27%Negative predicted value = 99.3%Accuracy =71.87 (%AUC = 0.798
Result: Cox Proportional Hazard Model
On the 7th day

Comparison of three prediction models with Hendrich II fall risk assessment tool
Logistic reg. Decision tree Cox-hazard reg.
Hendrich II
Sensitivity 75.0% 78.6% 71.3% 67.4%
Specificity 76.2% 76.6% 71.9% 65.1%
PPV 5.3% 7.1% 4.3% 3.8%
NPV 99.4% 99.4% 99.3% 99.0%
Accuracy 76.2% 76.7% 71.9% 65.2%
AUC 0.836 0.839 0.798 0.701

Pressure Ulcer

Study Subjects
• Case group:XXXpatients with pressure ulcer*
during hospital stay in neurology or hemato-oncology departments from Jan 1, 2015 to May 31, 2016
* “pressure ulcer” occurrences were extactedfrom pressure ulcer incident reports.
• Control group: XXXXX patients who did not have pressure ulcer during hospital stay in the same departments during the same period

Features
• Extraction: 76 features from 9 different data sources were extracted
• Normalization: Features were normalized based on completeness, currency (recent>old), type of data (structured>unstructured, and granularity (detailed>general)
• Selection: 42 features were selected using visual analytics (Tableau) and univariate analyses

Maximum Time Allowed for Data Collection
Admission Discharge-5day -3day -1day
2. No pressure ulcer group
1. Pressure ulcer group
Gender, age, smoking, route of admission…
Pain, friction and shear, E-tube…
Edema, weakness, ventilator..
Malnutrition, skin moisture, medication…
(occurrence of pressure ulcer)
1day before discharge
Surgery, diagnosis
The features are same as those of ‘pressure ulcer group’
AdmissionDischarge-5day -3day -1day

Test of Pressure Ulcer Risk Prediction Models
• Three different types of prediction models were tested: Logistic regression, Cox-hazard model, and Decision Tree
• Training data set : Test data set = 7:3
– Training data set: XXX pressure patients and XXXXX no pressure patients
– Test data set: XX pressure ulcer patients as case group and XXXX with no pressure ulcer as control group
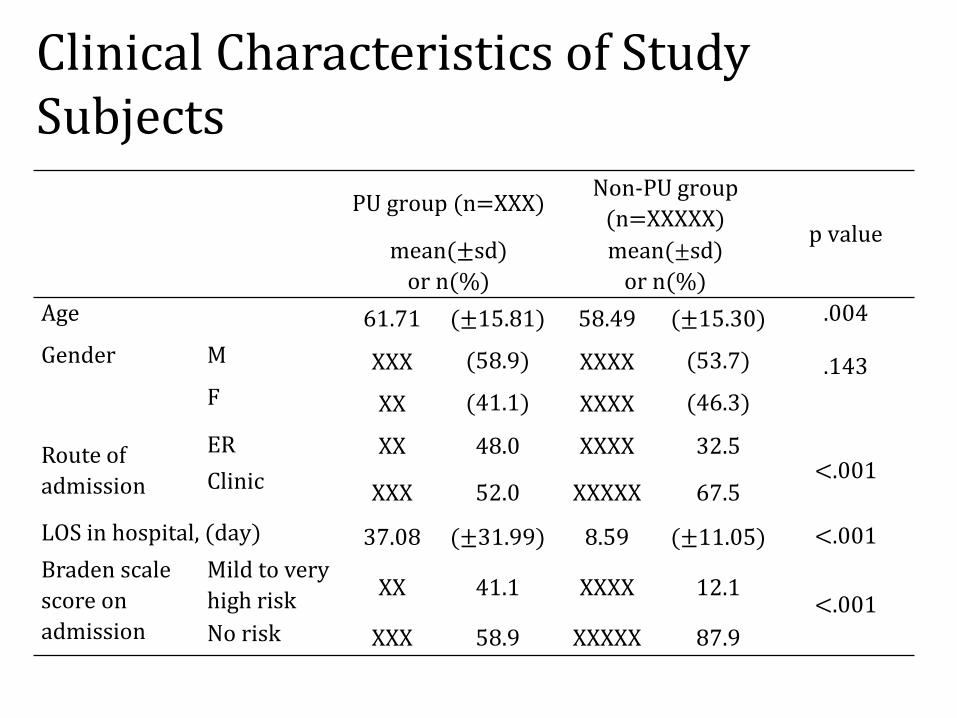
Clinical Characteristics of Study Subjects
PU group (n=XXX)Non-PU group
(n=XXXXX)p value
mean(± sd)
or n(%)
mean(± sd)
or n(%)
Age 61.71 (± 15.81) 58.49 (± 15.30) .004
Gender M XXX (58.9) XXXX (53.7) .143
F XX (41.1) XXXX (46.3)
Route of
admission
ER XX 48.0 XXXX 32.5<.001Clinic XXX 52.0 XXXXX 67.5
LOS in hospital, (day) 37.08 (± 31.99) 8.59 (± 11.05) <.001
Braden scale
score on
admission
Mild to very
high riskXX 41.1 XXXX 12.1
<.001No risk XXX 58.9 XXXXX 87.9

Distribution of Time to Pressure Ulcer
0
5
10
15
20
25
30
0 2 4 6 8 10 12 14 16 18 20 22 24 26 28 32 34 36 39 43 49 56 61 71 76 97
Time to Pressure Ulcer in Days
1/3 of pressure ulcers occur between 0-3 days in hospital

Rate of Pressure Ulcersby Department
Chest Cheek VertebralCoccyx
24%
11% 8% 8%
47%
17%
4%
Coccyx Hip Vertebral
Operating room
Wards & ICU
Wards(52%)
Operation room(34%)
ICU(14%)
Body side of Pressure Ulcers by Department
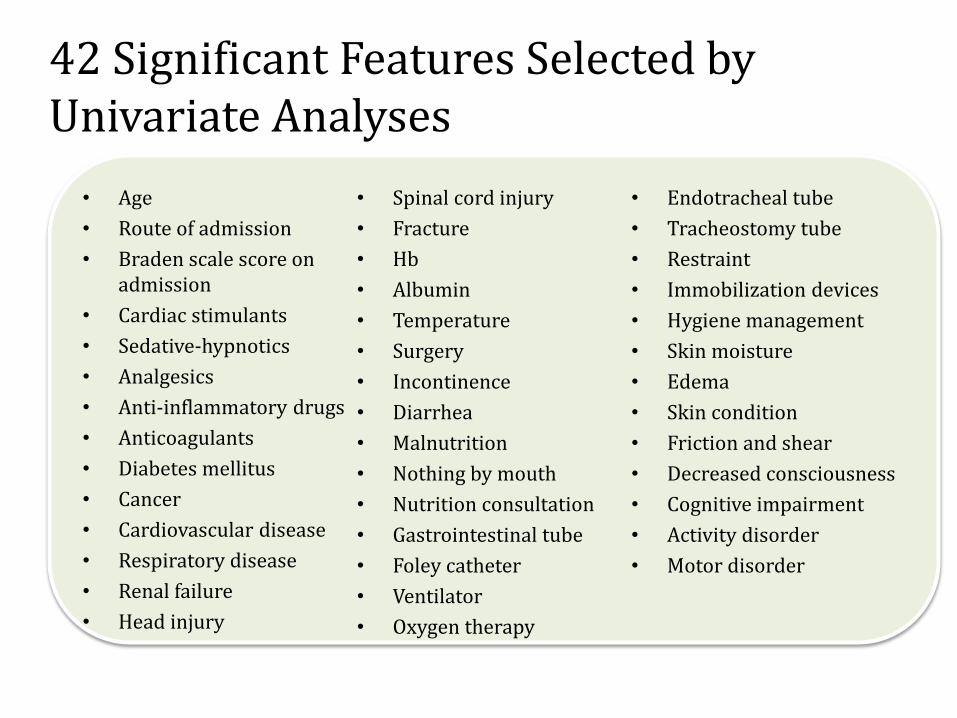
42 Significant Features Selected by Univariate Analyses
• Age
• Route of admission
• Braden scale score on admission
• Cardiac stimulants
• Sedative-hypnotics
• Analgesics
• Anti-inflammatory drugs
• Anticoagulants
• Diabetes mellitus
• Cancer
• Cardiovascular disease
• Respiratory disease
• Renal failure
• Head injury
• Spinal cord injury
• Fracture
• Hb
• Albumin
• Temperature
• Surgery
• Incontinence
• Diarrhea
• Malnutrition
• Nothing by mouth
• Nutrition consultation
• Gastrointestinal tube
• Foley catheter
• Ventilator
• Oxygen therapy
• Endotracheal tube
• Tracheostomy tube
• Restraint
• Immobilization devices
• Hygiene management
• Skin moisture
• Edema
• Skin condition
• Friction and shear
• Decreased consciousness
• Cognitive impairment
• Activity disorder
• Motor disorder

Comparison of Pressure Ulcer Predictability of Three Models
Indicator Logistic Reg. Decision TreeCox
Proportional Hazard
Sensitivity 0.901 0.855 0.881
Specificity 0.890 0.888 0.881
PositivePredictive Value
0.098 0.094 0.090
NegativePredictive Value
0.999 0.998 0.998
Youden’s index 0.791 0.743 0.742
AUC 0.968 0.900 0.951

Comparison of Pressure Ulcer Prediction Models
ᅳ Logistic regression model
ᅳ Cox proportional hazard regression model
ᅳ Decision tree modelᅳ Reference line
ROC curve
sensi
tivit
y
1- specificity

Unplanned Extubation

Study Subjects
• XXXX ICU patients with data on ‘time of endotracheal tube intubation’ and ‘time of endotracheal tube extubation’ between July 1, 2013 and June 30, 2016 (36 months)
• XX cases were categorized as an unplanned extubation by reviewing nursing narratives
Narrative Attribute Value Group
Endotracheal Tube was removed
Reason Self Case group
‘self’ or ‘unplanned’ in the narrative
Case group
Dr’s Order Control group
Obstruction
Refusal of patient

Characteristics of Study Subjects
Planned
(n=XXXX cases)
Unplanned
(n=XX cases) t or χ2 (p)
mean(±sd) or n(%) mean(±sd) or n(%)
Age 61.94 (±15.68) 68.58 (±15.01) -3.26(.001)
SexM XXXX (98.8) XX (1.2) .71(.398)
F XXXX (99.0) XX (1.0)
APACHE 26.16 (±9.52) 29.32 (±7.00) -3.07(.004)
Duration of intubation,
day3.29 (±24.50) 3.87 (±4.92) -0.18(.856)
LOS in ICU, day 6.53 (±12.13) 12.40 (±11.48) -3.73(<.001)
LOS in hospital, day 22.87 (±26.45) 31.30 (±23.67) -2.40(.017)

Feature Selection
• Step 1: 487 features were identified in the critical care flow sheet during 24 hours prior to unplanned extubation
• Step 2: Features with recording rate above 90% (to minimize missing rate) were selected 23 out of 487 features were selected
• Step 3: 23 features were grouped into ‘features with numbers of recording >3 (documented more than once per shift )’ and ‘features with numbers of recording ≤3’

Feature selection and data preparation
• Step 4: Data identification and data preparation, 3 different datasets of the features were prepared after univariate analyses. – Data set with value recorded at the nearest point of
time to the event for all features,– Data set with either nearest, maximum, minimum
or mean value of each feature which differentiate the case and control groups the most for the features recorded more than 3 times per day
– Data set with number of times each feature was recorded during 24 hrs for the features recorded more than 3 times per shift.
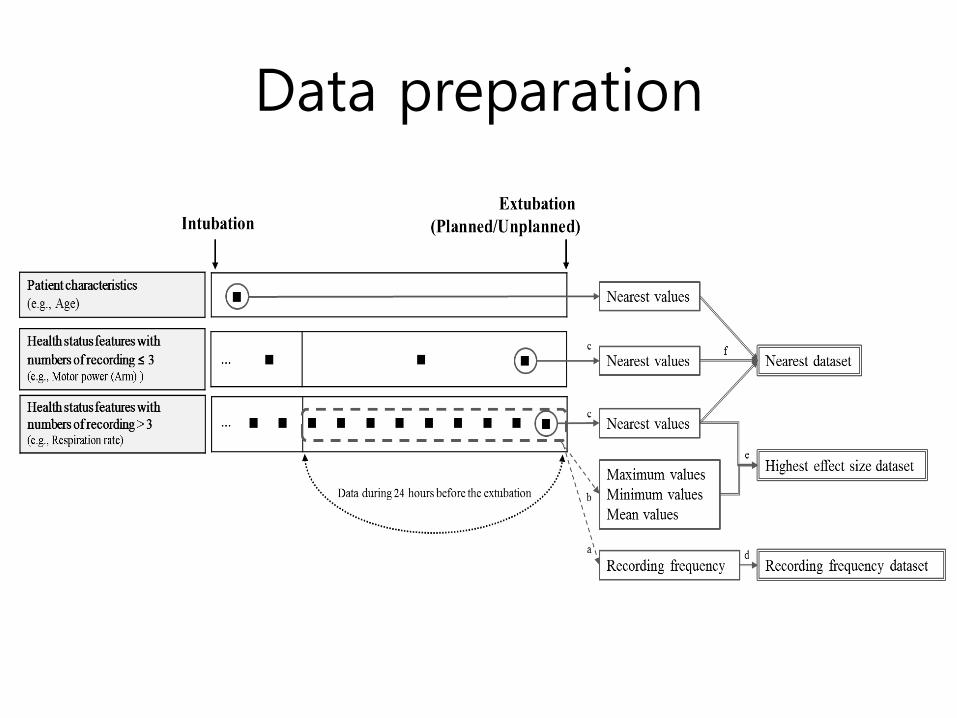
Data preparation

Nearest Maximum Mean MinimumRecording Frequency
Featureswithrecordingfrequency≤ 3
GCS (eye+motor) -8.56RASS -6.09Motor power (arm) -7.06Motor power (leg) -5.03Fio2 -0.53PEEP -1.65weight 2.61E-tube depth -2.397E-tube ID 0.8
Featureswithrecordingfrequency> 3
Systolic BP -1.990 0.144 -2.220 -3.008 1.87Mean BP -0.660 1.661 -1.214 -2.651 2.08Diastolic BP -0.340 1.357 -0.338 -1.552 1.37Pulse rate -5.160 -1.710 -4.878 -6.122 4.28Respiration rate -3.160 -0.313 -4.720 -6.236 1.27Body temperature -3.410 -2.330 -6.971 -3.030 3.72Minute volume -3.912 -0.881 -0.422 -0.56 -5.21Urine amount 3.010 2.300 2.525 1.522 -4.63SPO2 -0.556 -0.073 -0.348 -0.364 -1.61Peak pressure -2.750 -1.742 -2.631 -2.984 -1.82BST -1.060 0.293 1.543 3.101 -2.67Position change 4.204 -6.11Presence of restraint 0.283 -3.09Ventilator mode 2.699 -3.16
▶ Positive t value : Case < Control▶ Negative t value : Case > ControlUnivariate analysis

Recording
frequency
dataset
Nearest, Min,
Max or Mean
with
Highest effect
size
dataset
Nearest vaue
dataset
Recording
frequency
dataset
Model 1 Model 2 Model 3
Features withrecording frequency ≤ 3
Features withrecording frequency > 3
Nearest value
dataset
Nearest value
dataset

Comparison of Models
Model 1 Model 2 Model 3
AUC 0.82 0.88 0.90
Sensitivity 31.71 46.34 56.10
Specificity 94.13 91.40 92.74
Positive Predictive Value 6.74 6.86 9.54
Negative Predictive Value 99.04 99.20 99.36

Chemotherapy-induced Adverse Drug
Reactions

Study Subjects
- All Patients who received the four most prescribed chemotherapy regimens (FOLFOX, FOLFIRI, GP, and Paclitaxel) from Jan 1, 2015 to June 30, 2016
- Chemotherapy-induced ADRs were identified from Clinical observation sheet, Blue sheet, and Narrative nursing notes
- ADRs include hypersensitivity, stomatitis, peripheral neuropathy, constipation, diarrhea, hand-foot syndrome, nausea & vomiting and weakness & anorexia

Nausea & Vomiting
38%
Weakness & Anorexia
28%
Peripheral Neuropathy
11%
Diarrhea
8%
Stomatitis
5%
Constipation
4%Hand-foot syndrome
3%Hypersensitivity
3%
Chemotherapy-induced ADR

Regimen
FOLFIRI FOLFOX GP Paclitaxel
Nausea & Vomiting 44.1% 39.7% 25.9% 24.5%
Weakness & Anorexia 26.1% 25.9% 41.2% 35.8%
Peripheral Neuropathy 7.1% 12.0% 10.0% 17.4%
Diarrhea 10.0% 7.6% 6.5% 6.4%
Stomatitis 5.4% 4.0% 5.3% 6.0%
Constipation 3.2% 2.9% 7.1% 4.6%
Hand-foot syndrome 1.2% 4.9% 0.6% 1.1%
Hypersensitivity 2.9% 2.9% 3.5% 4.3%
Prevalence of Chemotherapy-induced ADRs by Regimen

Feature Selection
Literature review 64
Feature extraction & normalization
31
Feature selection using Chi-square
test
Logistic regression with
stepwise selection
Hypersensitivity
StomatitisPeripheral
neuropathyConstipation Diarrhea
Hand-foot syndrome
Nausea &Vomiting
Weakness &Anorexia
11 11 16 10 16 8 22 23
Hypersensitivity
StomatitisPeripheral
neuropathyConstipation Diarrhea
Hand-foot syndrome
Nausea &Vomiting
Weakness &Anorexia
5 7 8 4 13 5 19 12

Feature Extraction
Admission Discharge- 3 Day
Age, Sex
Chemo cycle, regimen, a history of nausea & vomiting, etc.
bone marrow depression, infection, etc.
Diagnosis: diabetes mellitus, heart disease, etc.
Chemotherapy starts
• Data were extracted from Clinical observation sheet, Blue sheet, Initial nursing assessment sheet, Narrative nursing records, Laboratory results reports, Medication orders and diagnosis sheets.

Comparison of Chemotherapy-induced ADRs Prediction Models
Algorithms IndicatorsHyper
sensitivityStomatitis
Peripheral neuropathy
Constipation DiarrheaHand-foot syndrome
Nausea &Vomiting
Weakness &Anorexia
DecisionTree
AUC 0.8004 0.6493 0.7033 0.7711 0.7505 0.7070 0.8752 0.7145
Accuracy 0.6030 0.9802 0.8630 0.8433 0.8127 0.3878 0.8087 0.7271
Sensitivity 0.8412 0.3800 0.3914 0.6800 0.6547 0.9090 0.7765 0.6310
Specificity 0.6007 0.8977 0.8798 0.8451 0.8166 0.3827 0.8129 0.7363
Logistic Regression
AUC 0.8009 0.6643 0.7278 0.6462 0.7161 0.7066 0.8472 0.6742
Accuracy 0.7495 0.6014 0.5853 0.5828 0.6662 0.6301 0.7481 0.6408
Sensitivity 0.7500 0.6176 0.7435 0.6111 0.6666 0.6315 0.7480 0.6402
Specificity 0.7495 0.6010 0.5790 0.5825 0.6661 0.6301 0.7480 0.6408
Neuralnetwork
AUC 0.9298 0.6618 0.6875 0.6632 0.6944 0.7609 0.8520 0.6916
Accuracy 0.5845 0.6462 0.5960 0.6262 0.6296 0.6974 0.7724 0.6550
Sensitivity 0.6500 0.6470 0.6025 0.6111 0.6250 0.6842 0.7716 0.6524
Specificity 0.5841 0.6461 0.5957 0.6263 0.6297 0.6974 0.7725 0.6551
• We developed the models using 5 fold-cross validation

What we have learned…..
• Usefulness of nursing note as data source for identification of patient safety events and extraction of features– This was possible because electronic nursing records system
was developed using standardized terminology and data models.
• Creative way of using EHR data – Multiple sources, multiple types of data, and multiple points
of time, – Not only data documented at the nearest point to the event,
but also maximum, minimum, or mean value of the features can be used.
• Usefulness of current patient safety event risk assessment tools. – Need to introduce different assessment tool

Next Step: Developing CDSS to Prevent Patient Safety Event
Patient Characteristics
Assessment by Healthcare Providers
Practice-based Evidence
Knowledgebase
Predictive Models for Patient Safety Events
Clinical Decision Support
Patient Outcomes