Use of different exhaled nitric oxide multiple flow rate...
32
1 Use of different exhaled nitric oxide multiple flow rate models in COPD. Kay Roy MRCP 1 , Zoº L Borrill MRCP 1 , Cerys Starkey BSc 1 ., Andrew. L. Hazel Ph.D 2 , Julie Morris MSc 3 , Jlrgen Vestbo MD 1,4 , Dave Singh MD 1 1 Medicines Evaluation Unit North West Lung Centre University Of Manchester Wythenshawe Hospital Southmoor Road Manchester M23 9QZ 2 Department of Mathematics, University of Manchester, Oxford Road, Manchester, M13 9PL, U.K. 3 Medical Statistics Wythenshawe Hospital Southmoor Road . Published on February 14, 2007 as doi: 10.1183/09031936.00149706 ERJ Express Copyright 2007 by the European Respiratory Society.
Transcript of Use of different exhaled nitric oxide multiple flow rate...

1
Use of different exhaled nitric oxide multiple flow rate models in COPD.
Kay Roy MRCP1, Zoë L Borrill MRCP1, Cerys Starkey BSc1., Andrew. L. Hazel Ph.D2,
Julie Morris MSc3, Jørgen Vestbo MD1,4, Dave Singh MD1
1Medicines Evaluation Unit
North West Lung Centre
University Of Manchester
Wythenshawe Hospital
Southmoor Road
Manchester
M23 9QZ
2Department of Mathematics,
University of Manchester,
Oxford Road,
Manchester,
M13 9PL,
U.K.
3Medical Statistics
Wythenshawe Hospital
Southmoor Road
. Published on February 14, 2007 as doi: 10.1183/09031936.00149706ERJ Express
Copyright 2007 by the European Respiratory Society.

2
Manchester
M23 9LT
4Department of Cardiology and Respiratory Medicine
Hvidovre Hospital
2650 Hvidovre
Denmark
Corresponding author and author to whom requests for reprints should be addressed;
K. Roy
Address as above
Email: [email protected]
Tel: +44 161 946 4071
Fax: +44 161 946 1459
Running Head: Modelling of nitric oxide in COPD

3
Abstract
Multiple flow rates FeNO data can be modelled to estimate NO airway wall concentration
(CawNO) and diffusing capacity (DawNO), alveolar concentration (CalvNO) and maximal flux
(J�awNO). FeNO at 10, 30, 50, 100 and 200ml/s from 50 COPD patients and 35 healthy controls
(smokers and non-smokers) modelled by five different methods was compared and the effect of
the number of flow rates was investigated. All methods showed that current smoking reduced
CawNO in COPD patients, with some methods showing that smoking reduced J�awNO. Smoking
did not affect CalvNO and DawNO. For CawNO, the methods gave similar results, but there was
variability between methods for J�awNO, CalvNO and DawNO. The median error by least squares
fitting between modelled and actual data was significantly lower for the non linear (1.96)
compared to mixed methods (3.31 and 3.62). Parameters calculated by the non-linear method
using five and four flow rates were significantly different; ratio (95% CI) of CawNO was 2.02
(1.45, 2.83). NO models give different results, although CawNO is relatively model independent.
Non-linear modelling has the least error, suggesting it is the best method. The number of flow
rates should be standardised
Key words; chronic obstructive pulmonary disease, nitric oxide, two compartment
modelling.
4
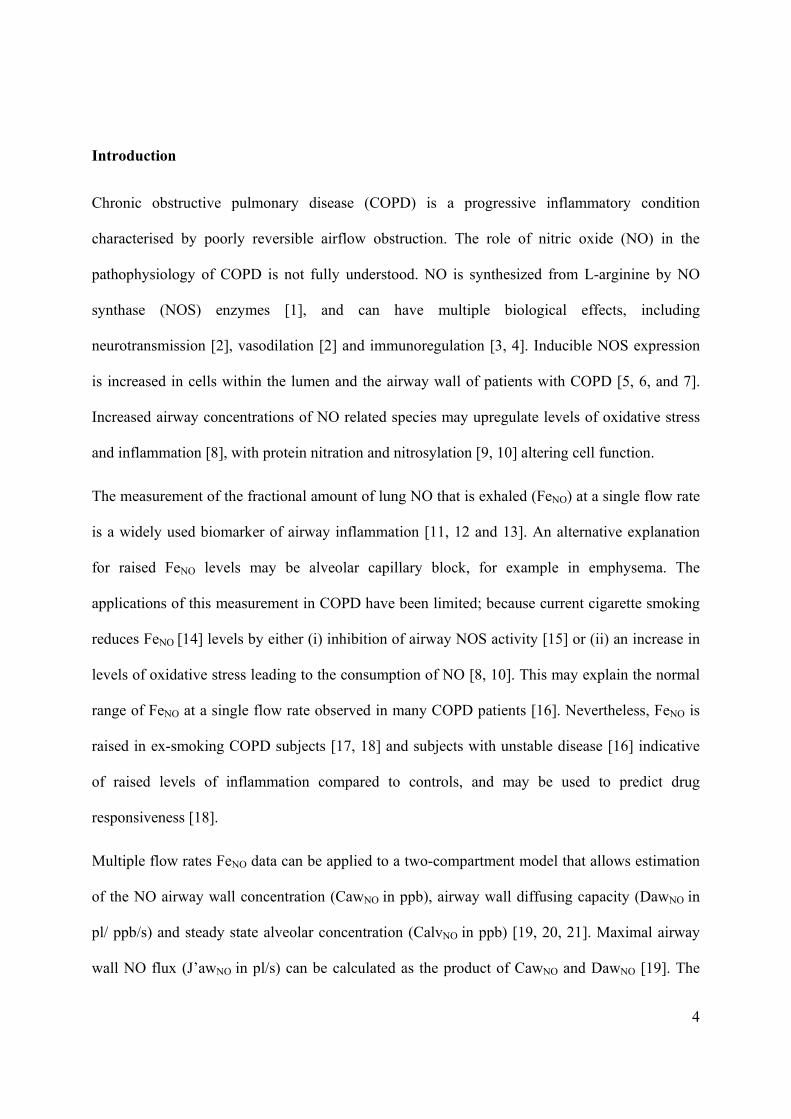
Introduction
Chronic obstructive pulmonary disease (COPD) is a progressive inflammatory condition
characterised by poorly reversible airflow obstruction. The role of nitric oxide (NO) in the
pathophysiology of COPD is not fully understood. NO is synthesized from L-arginine by NO
synthase (NOS) enzymes [1], and can have multiple biological effects, including
neurotransmission [2], vasodilation [2] and immunoregulation [3, 4]. Inducible NOS expression
is increased in cells within the lumen and the airway wall of patients with COPD [5, 6, and 7].
Increased airway concentrations of NO related species may upregulate levels of oxidative stress
and inflammation [8], with protein nitration and nitrosylation [9, 10] altering cell function.
The measurement of the fractional amount of lung NO that is exhaled (FeNO) at a single flow rate
is a widely used biomarker of airway inflammation [11, 12 and 13]. An alternative explanation
for raised FeNO levels may be alveolar capillary block, for example in emphysema. The
applications of this measurement in COPD have been limited; because current cigarette smoking
reduces FeNO [14] levels by either (i) inhibition of airway NOS activity [15] or (ii) an increase in
levels of oxidative stress leading to the consumption of NO [8, 10]. This may explain the normal
range of FeNO at a single flow rate observed in many COPD patients [16]. Nevertheless, FeNO is
raised in ex-smoking COPD subjects [17, 18] and subjects with unstable disease [16] indicative
of raised levels of inflammation compared to controls, and may be used to predict drug
responsiveness [18].
Multiple flow rates FeNO data can be applied to a two-compartment model that allows estimation
of the NO airway wall concentration (CawNO in ppb), airway wall diffusing capacity (DawNO in
pl/ ppb/s) and steady state alveolar concentration (CalvNO in ppb) [19, 20, 21]. Maximal airway
wall NO flux (J�awNO in pl/s) can be calculated as the product of CawNO and DawNO [19]. The

5
total NO flux (JawNO) is a different calculation that accounts for CalvNO as follows; JawNO =
DawNO (CawNO-CalvNO). It has been reported that this model is useful for assessing inflammation
in the lung periphery, as CalvNO is raised in patients with asthma [22] and COPD [23, 24], and
does not change with inhaled corticosteroid treatment [22, 24, 25]. Furthermore, it has been
reported that smoking reduces CawNO [26]. Alterations in DawNO have also been described and
this may be the cause of elevated FeNO levels in asthma regardless of the CawNO and CalvNO
levels [27].
Several different mathematical approaches that are based on the two-compartment model have
been applied to multiple flow rates FeNO data: (1) linear analysis estimating a limited number of
parameters; CalvNO and JawNO [20], or DawNO and J�awNO (and hence CawNO) [28] (2) non-linear
analysis [28] allowing estimation of all parameters and (3) a combination of a linear analysis to
calculate CalvNO followed by non-linear fitting to determine the other parameters [23, 24, 29].
These models all use different mathematical approaches and so may give different results. As far
as we are aware, these models have not been compared.
This paper reports multiple flow rates modelling using FeNO data from COPD patients and
controls. We hypothesized that the different two-compartment modelling approaches may
provide different results, and our primary aim was to compare the models. We also investigated
the effect of the number of flow rates on the derived parameters from each method.
Methods
Subjects

6
Fifty COPD patients (23 COPD smokers; COPD S and 27 COPD ex smokers; COPD EX)
diagnosed according to current guidelines [30] with relevant symptom history (chronic cough and
sputum production, dyspnoea and wheeze), a significant smoking history (> ten pack years) and
spirometric measurements of forced expiratory volume in 1 second (FEV1) < 80% and FEV1/
forced vital capacity FVC < 0.7 participated in this study. Patients were required to be able to
perform technically acceptable exhaled NO measurements at all the five flow rates used in this
study. A total of 77 COPD patients were recruited for this study, but 27 patients were excluded as
they were not able to perform acceptable exhaled NO measurements at all five flow rates. Two
healthy control groups (19 smokers (HS) and 16 non-smokers (HNS)) with no history of
respiratory disease and normal spirometry were also recruited. Healthy smokers were defined
based on normal lung function and a smoking history of more than ten pack years. The
demography of all participants is shown in Table 1. Only subjects who had negative skin prick
tests to three allergens (house dust mite, grass pollen and cat hair; ALK Abello; Denmark) were
included and patients with a clinical history of asthma or atopy were excluded. Exclusion criteria
were a respiratory tract infection or exacerbation of COPD in the preceding six weeks. Written
and informed consent was obtained and the local ethics committee approved the study.
Study Design
Subjects abstained from food and caffeine for two hours, smoking for six hours, and alcohol for
twelve hours prior to the measurement of FeNO using a Niox chemiluminescence on-line analyser
(Aerocrine, Solna, Sweden). The analyser was calibrated according to the manufacturer�s
instructions every 14 days. After inhaling NO free air to total lung capacity, subjects exhaled at a
constant flow rate against a resistor to collect the plateau NO concentration. Readings can only be

7
taken at five flow rates with the Niox machine as the manufacturer only provides resistors for the
following five flow rates; 10, 30, 50, 100 and 200 ml/sec. The actual flow rates achieved were
required to be within 10% of the target flow rate [31]. The exhalation times required were 20, 10,
10, 6 and 6 sec respectively at these flow rates as per manufacturers� guidelines. These standard
settings ensure that the total volume of air exhaled at each flow rate accounts for the exclusion of
dead space [31]. The manufacturer�s information about the Niox analyser states that the accuracy
of the FeNO measurement is ± 2.5 ppb of measured value <50 ppb and ± 5 % of measured value
>50 ppb, and the linearity is <2.5 ppb integral linearity. It is possible that these parameters differ
with the flow rates used, and this requires further study. Three acceptable readings were recorded
according to the ATS guidelines [31] at each of the five flow rates in one sitting. Recalibration
was not required after each change of resistors.
In a random subgroup of twelve COPD patients, within day variability of exhaled NO was
assessed by comparing measurements taken at 10am to 1pm on the same day, and between day
variability determined by comparing readings taken at 10am a week apart.
Estimation of NO model parameters
FeNO multiple flow rate data were applied to a basic two-compartment model developed to
distinguish between NO generated in the airways from that in the alveoli. The model is
represented by the equation A [19]; FeNO = CawNO + (CalvNO � CawNO) .exp (- DawNO/ V) with
unknown variables CawNO, CalvNO and DawNO, where V is the exhalation flow rate (ml/s).
J�awNO is the total maximum flux of NO from the airway wall to the lumen and is the product of
DawNO and CawNO. Multiplication of equation A by V leads to equation B; VNO = V.FeNO =
V.CawNO+V(CalvNO-CawNO).exp(-DawNO/V), where VNO is the elimination rate of NO from the
airways. At high flow rates, the argument of the exponential function is small and may be

8
approximated from exp. (DawNO/V) to 1-DawNO/V so equation B becomes equation C; VNO= V.
CalvNO - (CalvNO-CawNO).DawNO. The mathematical techniques are as described below.
1. Linear Analysis
(i). Linear method 1 (Tsoukias) [20]
VNO is plotted against flow rate at the higher flow rates and equation C is used to deduce that
CalvNO is the slope of the straight line where the y-intercept is (CawNO- CalvNO) DawNO, which
represents the total airway NO flux (JawNO), and only approximates to the maximum NO flux
(J�awNO) if CalvNO approaches zero.
(ii). Linear method 2 (Silkoff 2 flow) [28]
From the linear plot at low flow rates of VNO against FeNO represented by the equation; VNO =
J�awNO � DawNO/FeNO, DawNO is estimated from the slope and CawNO from the x-intercept.
2. Non linear analysis (Silkoff 9 flow) [28]
Equation A is used to determine all parameters using the Solver tool in excel. J�awNO is
calculated as the product of CawNO and DawNO.
3. Mixed Linear and non linear analysis
(i) Mixed Model 1 (Hogman) [23]
Linear method 1 is used to determine CalvNO from equation C. Data from a range of low to high
flows is then applied to equation A to estimate CawNO and DawNO by non-linear regression using
the solver tool in Excel. J�awNO is calculated as the product of CawNO and DawNO.
(ii) Mixed Model 2 (Pietropaoli) [29]

9
Equation C is divided by flow rate to give equation D; FeNO=CalvNO+(CawNO-CalvNO) DawNO/V.
From the plot at high flow rates of FeNO versus 1/flow rate, CalvNO is estimated from the y-
intercept. J�awNO and DawNO are determined using the solver tool in excel from the equation
FeNO = J�awNO/DawNO + (CalvNO- J�awNO/DawNO) exp.(-DawNO/V). CawNO is calculated from the
equation J�awNO=CawNO. DawNO.
Statistical Analysis
Natural log transformation was required to normalise all the model derived data except DawNO
which remained non parametric so geometric means and 95 % confidence intervals are presented
for CalvNO, CawNO, J�awNO and FeNO and medians and interquartile ranges for DawNO. ANOVA
followed by unpaired t tests with Welch correction as appropriate were used to compare
parametric data between groups and assess the effect of inhaled corticosteroids on FeNO and
model parameters. The non-parametric Kruskal Wallis test with the Dunn post test followed by
Mann Whitney test was applied in the case of DawNO. Repeated measures ANOVA followed by
the Bonferroni multiple comparisons tests were used to assess differences between the modelling
methods, and to evaluate the effect of using different numbers of flow rates for methods that
required more than two flow rates to calculate parameters (i.e. non-linear analysis and mixed
linear and non linear analyses). The non-parametric Kruskal Wallis test with the Dunn post test
followed by Wilcoxon matched pairs signed ranks test was applied in the case of DawNO.
Repeated measures ANOVA followed by the Bonferroni multiple comparisons tests were used to
compare the error of modelled data to actual data using techniques that required non-linear
modelling (i.e. non-linear analysis and mixed linear and non-linear analyses). The model
parameters were calculated by the non linear and mixed methods using four flow rates, by
10
excluding data from either the lowest (10ml/s) or the highest (200ml/s) flow rates. Four flow rate
data was compared to five flow rate using paired student�s t tests or the Wilcoxon matched pairs
signed ranks test for DawNO. The non-parametric spearman correlation was used to analyse the
relationship between FEV1 and NO. Within and between day variability of FeNO and model
parameters were analysed by assessing the differences between groups using paired students t-
test, except in the case of DawNO when the Wilcoxon paired test was applied P<0.05 was
considered statistically significant.
Results
COPD Patients Compared To Controls
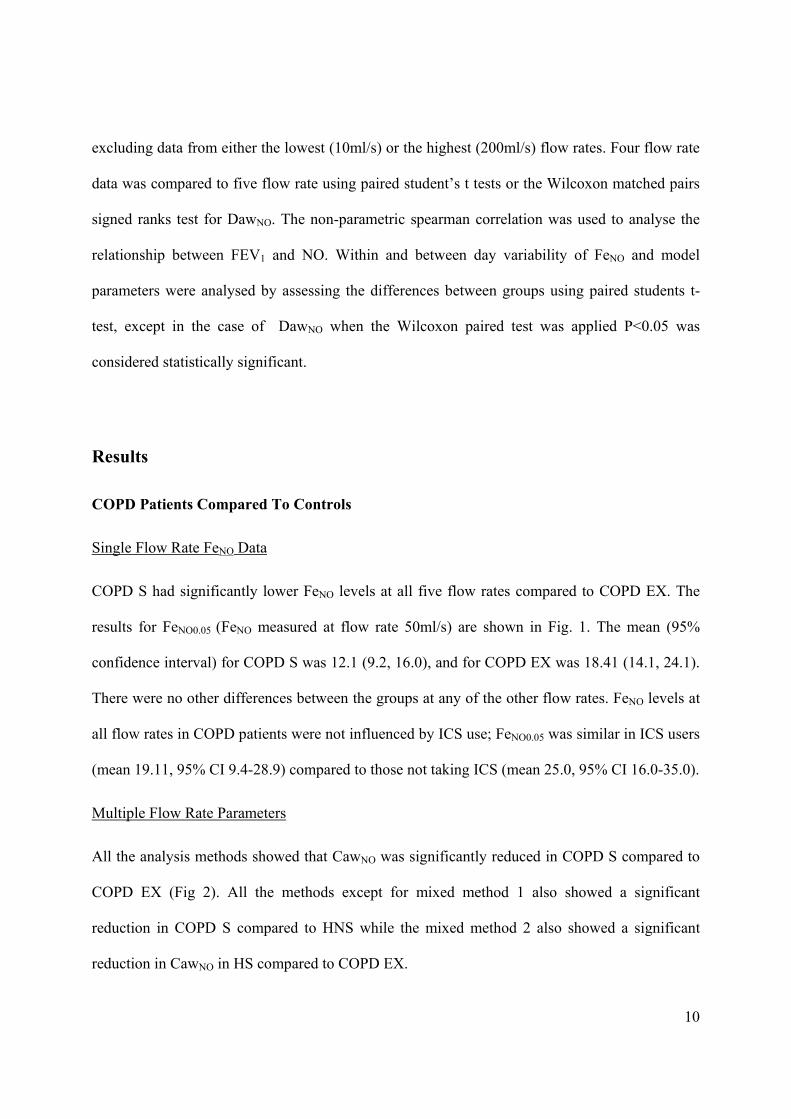
Single Flow Rate FeNO Data
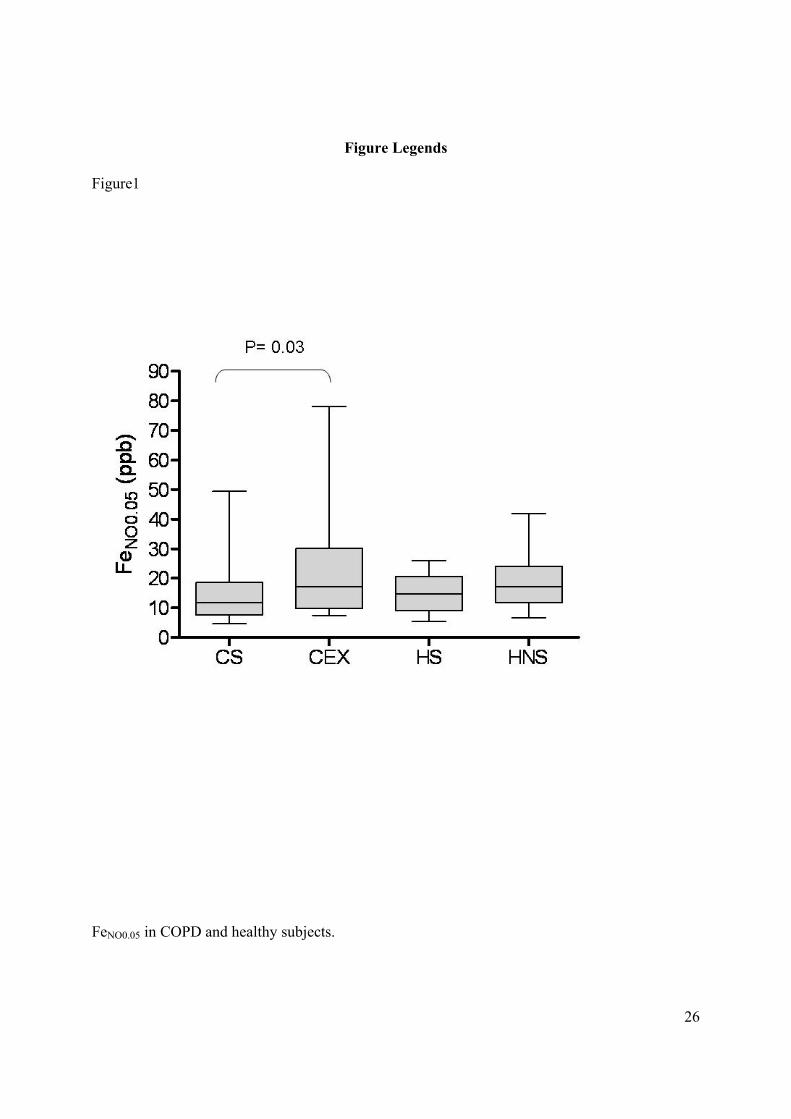
COPD S had significantly lower FeNO levels at all five flow rates compared to COPD EX. The
results for FeNO0.05 (FeNO measured at flow rate 50ml/s) are shown in Fig. 1. The mean (95%
confidence interval) for COPD S was 12.1 (9.2, 16.0), and for COPD EX was 18.41 (14.1, 24.1).
There were no other differences between the groups at any of the other flow rates. FeNO levels at
all flow rates in COPD patients were not influenced by ICS use; FeNO0.05 was similar in ICS users
(mean 19.11, 95% CI 9.4-28.9) compared to those not taking ICS (mean 25.0, 95% CI 16.0-35.0).
Multiple Flow Rate Parameters
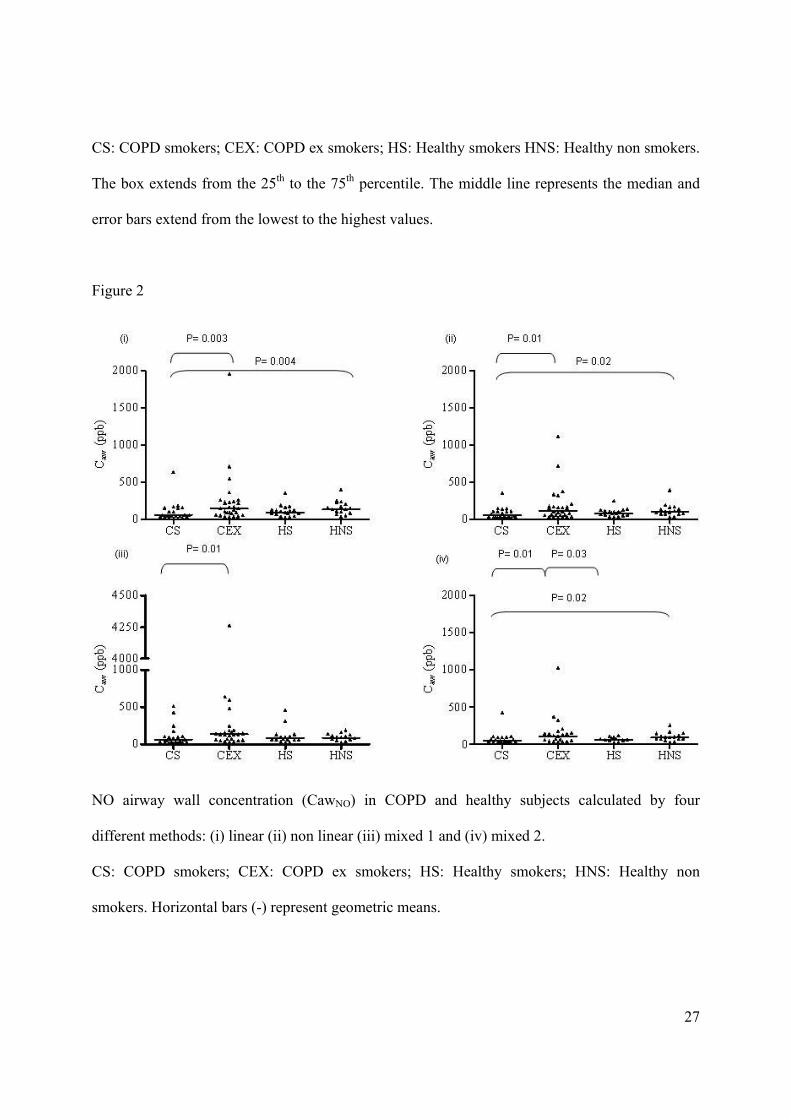
All the analysis methods showed that CawNO was significantly reduced in COPD S compared to
COPD EX (Fig 2). All the methods except for mixed method 1 also showed a significant
reduction in COPD S compared to HNS while the mixed method 2 also showed a significant
reduction in CawNO in HS compared to COPD EX.
11
There was evidence that cigarette smoking reduced J�awNO (fig 3); all the methods except mixed
method 1 showed that J�awNO in COPD S and HS was reduced compared to COPD EX. Mixed
method 1 showed that J�awNO was significantly lower in HS compared to HNS.
There were no differences between groups (p>0.05 for all comparisons) in CalvNO and DawNO
using all of the modelling methods (Table 2).
Model parameters calculated by all five methods were not influenced by ICS use.
Relationship between FEV1 and NO measurements
FEV1 was not related to (i) FeNO at all five flow rates (P >0.05 for all associations) or (ii) NO
model parameters (CawNO, CalvNO, DawNO and JawNO) derived from the five modelling methods
(P >0.05 for all associations) in COPD smokers or COPD ex smokers.
Differences between Modelling Methods
The data from COPD patients was used to compare the different modelling methods (see fig 4).
CalvNO (fig. 4a) was significantly different between all the methods used i.e. no two methods gave
the same result for this parameter. DawNO data was non-parametric so mean and 95% confidence
intervals could not be obtained for comparisons between methods. Non-parametric (Wilcoxon
matched pair test) comparisons showed significant differences between all the methods (p<0.05
for all comparisons). J�awNO (fig. 4b) was also different for the majority of between method
comparisons, while there was more agreement between methods for the measurement of
CawNO(fig. 4c), as the majority of methods gave similar results. Similar results for comparisons
between methods were obtained when using data from COPD patients and healthy subjects
combined (data not shown).
12
Error of Non-Linear Modelling Methods
The error between modelled and actual data using the least squares fitting technique for non-
linear regression was significantly lower for the non linear method compared to the mixed
methods which involved linear analysis prior to non linear regression (Fig.5). The mixed methods
produced a similar degree of error.
The Effect of Decreasing the Number of Flow Rates
Using non linear analysis, all the parameters calculated using five flow rates were significantly
different to those from the four highest or lowest flow rates (Table 3). The significant differences
between groups in CawNO and J�awNO observed with five flow rates (see Figs 2 and 3), were no
longer present when only four flow rates were used. Significant differences observed in CawNO
between groups, using five flow rate data becomes insignificant when only four flow rate data is
applied (data not shown).
For mixed method 1, all the parameters were altered by the number of flow rates applied except
for J�awNO which was similar when calculated from the five and four highest rather than the four
lowest flow rates. The number of flow rates used did not alter any parameters except CalvNO
when calculated using mixed method 2.
Reproducibility of FeNO and model derived parameters
The FeNO readings at all five flow rates were similar when repeated on the same day or a week
later (Table 4). There was no significant within or between day difference (p>0.05 for all
comparisons) for any of the flow rates, indicating satisfactory reproducibility. As would be
expected, there was also no significant within or between day variability (p>0.05 for all
comparisons) for the model derived parameters calculated from this data by all five methods
(data not shown).

13
Discussion
Our study set out to compare data from two-compartment NO models in COPD. Our main
findings were: (1) the non linear model [28] has the least error, so we propose that this should be
adopted in future COPD studies, although using more than one modeling technique would be a
sensible way to ensure the validity of results. (2) CalvNO data appears to be highly variable,
challenging current opinion regarding the potential applications of CalvNO measurements in
COPD [24, 33] (3) Data from five flow rates was more reliable than four flow rate data. These
findings need to be taken into account when comparing studies using different models and also
for future recommendations for guidelines on use of multiple flow NO modelling.
We assessed the degree of agreement between the different mathematical models, and found a
high degree of agreement for CawNO, but much less for all other parameters. In particular, CalvNO
results were extremely model dependent. There is no �gold standard� modelling method, so it is
not known which mathematical model actually provides the most clinically meaningful data. For
the three mathematical methods that estimate all the model parameters (i.e. those that use non-
linear modelling), we observed that mixed linear and non-linear modelling methods have more
error compared to pure non-linear modelling. Given the differences between the various models,
the method with the best fit to the actual data (i.e. pure non-linear modelling) may be regarded as
providing the most accurate results.
For mixed modelling methods, non linear fitting of data (for DawNO and CawNO or DawNO and
JawNO) is constrained by the assumption already made for CalvNO by the initial linear part of the
method. The increased error of mixed methods (compared to pure non-linear modelling) can be
explained by the degree of inaccuracy associated with initially estimating CalvNO, which is then
added to the error derived by non linear fitting based on this value of CalvNO. For linear models
14
only two of the three model parameters are predicted and the actual data coincides exactly with
the modelled data at the two flow rates used, hence the error could not be assessed. We have
confined our study to COPD, but similar studies should be performed in other disease states to
validate specific modelling methods.
The advantage of non linear and mixed modelling is that more parameters can be estimated
compared to linear modelling. A practical drawback is that a greater number of flows are
required, including those at the lower range which can be technically challenging for some
subjects. In the current study, only 50 patients out of 77 were able to perform readings at all five
flow rates, as they were unable to perform reliable readings at the lower flow rates (10 and / or
30ml/s). These readings are needed for modelling methods to accurately estimate CawNO and
DawNO.
The number of flow rates that should be used for multiple flow rate modelling has not been
standardised. There is some published evidence from a small sample set that non linear modelling
is dependent on the number of flow rates used [23]. For the methods that require data from
greater than two flow rates to perform modelling, we assessed the effect of using data from
different numbers of flow rates. The non linear method and mixed model 1 showed flow rate
dependency, as results from four and five flow rates were significantly different, and these
methods were most sensitive using five flow rates i.e. significant CawNO findings using five flow
rates became non-significant with four flow rates. In contrast, mixed model 2 was relatively flow
rate independent. This has practical implications for the use of the linear method and mixed
model 1, as the number of flow rates used should be standardised, with our data showing that five
flow rates are needed.

15
The flow rates used in the current study were limited by the resistors commercially available.
Previous studies have used flow rates greater than 200ml/s to improve the reliability of the
calculated parameters [23, 26]. The current study has proved that NO modelling results are
dependent on the number of flow rates used, and it is likely that the use of additional flow rates
above 200ml/s will also influence the modelled parameters.
Our FeNO0.05 data showing lower levels in COPD S compared to COPD EX is in agreement with
previous published data [16, 17]. Two-compartment NO modelling showed that this difference
was due to a decreased concentration of NO in the airway wall (CawNO) regardless of which
model was applied. There was also evidence that smoking reduced CawNO and J�awNO in healthy
smokers, although the exact pattern of differences between the four groups for both CawNO and
J�awNO varied with the models used. In contrast, smoking did not affect CalvNO and DawNO.
Our findings of a reduction in NO production in the airway wall of smokers, rather than the
alveolar region, is in agreement with previous data [23, 26]. It has been reported that CalvNO is
increased in COPD patients [23, 24], and is related to disease severity but is not influenced by
current smoking [24]. Our COPD patients did not have severe disease, so we were less able to
evaluate whether CalvNO was related to disease severity. However, our data shows that CalvNO is
an extremely model dependent parameter and so CalvNO results obtained from one model may be
less robust than CawNO results, which are less model dependent. Furthermore, the modelling
method used by Brindicci et al [24] apparently uses the linear 1 method to estimate J�awNO,
whereas this method actually estimates (CawNO- CalvNO) DawNO which is JawNO. This subtle but
important change to the accepted method probably alters subsequent non-linear calculations.
Given the evidence from the current study that smoking reduces airway wall NO production, it is
interesting to speculate on the mechanisms involved. The inhibition of NOS activity in the airway

16
wall epithelium [15] is a possibility. Airway arginases and the metabolism of asymmetric
dimethyl arginine, superoxides [8] and nitrosoglutathione [9, 10] may also be affected by
smoking by upregulation of NO metabolites. Alternative nitration pathways are also proposed
whereby nitrites are oxidised by myeloperoxidase or xanthine oxidase [10]. In smokers with
COPD, the level of airway wall NO may be further complicated by the effects of airway pH and
bacterial airway colonisation on nitrogen oxides [32]; reduced airway pH aids in the conversion
of nitrite to NO.
An important methodological point to raise is that the actual FeNO reading which is accepted from
the exhalation trace is dependent on whether the peak or plateau is used. This is particularly
important at higher flow rates, as these are essential for accurate estimation of CalvNO. However,
the procedure used in clinical practice is variable, depending on the NO analyser set up and
operator preference, and in the future it would be preferable to have some standardisation of this
procedure. Additionally, ATS guidelines recommend that the mean of three NO plateau
measurements that are within 10% are taken for a FeNO reading [31]. However, this may not be
practically feasible for some patients if the absolute readings are low, as seen at the higher flow
rates.
The advantages of NO modelling over single flow rate data is that the location of altered FeNO
production can be identified. We, in agreement with others, have shown that CalvNO [24, 33] and
DawNO [24, 26] are unaffected by smoking, and so may have potential for assessing inflammation
in COPD. In particular, CalvNO has been proposed as a measurement that could be indicative of
small airway inflammation [24, 33]. However, our data concerning the variation in CalvNO data
between models underscores the need for method harmonisation so that results from different
studies can be compared. There is also the possibility that NO modelling may be a more sensitive
way of detecting early signs of a COPD exacerbation [33]. Furthermore, as inflammation is

17
heterogeneously distributed in the COPD lung, NO modelling could be used for more accurate
location of inflammation [33], so enabling more specific targeting of treatments. These potential
applications of NO modelling techniques in the future will rely on well validated and robust
methodology, which the current paper set out to address. Axial diffusion is important in
accurately evaluating NO transport in the airways, and a three compartmental NO model has been
used to include this variable [34]. Our paper focused on comparisons of two compartment
models, but it would certainly be of interest for future work to similarly evaluate the three
compartment model in COPD.
This study can be used to make suggestions for standardizing NO multiple flow rate modelling:
(1) In the absence of a �gold standard� NO modelling method, we recommend that future studies
use more than one method to ensure the validity of the results. This would appear to be
particularly important for CalvNO. If estimation of all modelling parameters is needed (CawNO,
J�awNO, CalvNO and DawNO), then our results indicate that the non-linear method has the least
error, with the greatest fit to the actual data. (2) It appears that data from more flow rates is likely
to be more accurate, and certainly for the non-linear and mixed model 1 it seems that five flow
rates are needed. At present, NO modelling is more useful for research studies rather than clinical
practice. We hope that our recommendations for the harmonisation of NO modelling methods
will increase the value of this technique in airway inflammation research, enabling data from
different investigators to be directly compared.

18
References
1. Ricciardolo F L M, Sterk P J, Gaston B, Folkerts G. Nitric Oxide in Health and Disease of
the Respiratory System. Physiol Rev 2004; 84: 731-765.
2. Ricciardolo FLM. Multiple roles of nitric oxide in the airways. Thorax 2003; 58: 175- 182.
3. Coleman J W. Nitric oxide in immunity and inflammation. Int Immunopharmacol 2001:
1397- 1406.
4. Guzik T J, Korbut R, Adamek- Guzik T. Nitric oxide and Superoxide in inflammation and
immune regulation. J Physiol Pharmacol 2003; 54: 469- 487.
5. Maestrelli P, Paska C, Saetta M, Turato G, Nowicki Y, Monti S, Formichi B, Miniati M,
Fabbri LM. Decreased haem oxygenase -1 and increased inducible nitric oxide synthase in
the lung of severe COPD patients. Eur Respir J 2003; 21: 971-976.
6. Ichinose M, Sugiura H, Yamagata S, Koarai A, Shirato K. Increase in Reactive Nitrogen
Species Production in Chronic Obstructive Pulmonary Disease Airways. Am J Respir Crit
Care Med 2000; 162: 701-706
7. Ricciardolo FLM, Caramori G, Ito K, Capelli A, Brun P, Abatangelo G, Papi A, Chung KF,
Adcock I, Barnes PJ, Donner CF, Rossi A, Stefano A. Nitrosative stress in the bronchial
mucosa of severe chronic obstructive pulmonary disease. J Allergy Clin Immunol 2005;
116(5): 1028-1035.
8. Ricciardolo FLM, Stefano A, Sabatini F, Folkerts G. Reactive nitrogen species in the
respiratory tract. Eur J Pharmacol. 2006 Mar 8; 533(1-3):240-52.
9. Grisham MB, Heuil D J, Wink DA. Physiological chemistry of nitric oxide and its
metabolites: implications in inflammation. Am J Physiol 1999; 276: G315-G321
10. Van der Vliet A, Eiserich JP, Shigenaga MK, Cross CE. Reactive Nitrogen Species and
tyrosine nitration in the respiratory tract. Am J Respir Crit Care Med 1999; 160: 1-9.

19
11. Jatakanon A, Lim S, Kharitonov S A, Chung K F, Barnes P J. Correlation between exhaled
nitric oxide, sputum eosinophils and methacholine responsiveness in patients with mild
asthma. Thorax 1998; 53: 91-5.
12. Kharitonov S A, Donnelly L E, Montuschi P, Corradi M, Collins J V, Barnes P J. Dose
dependent onset and cessation of action of inhaled budesonide on exhaled nitric oxide and
symptoms in mild asthma. Thorax 2002; 57 (10): 889-96.
13. Ferreira IM, Hazari MS, Gutierrez C, Zamel N, Chapman KR. Exhaled nitric oxide and
hydrogen peroxide in patients with COPD; Effects of inhaled beclomethasone. Am J Respir
Crit Care Med 2001; 164: 1012-1015.
14. Kharitonov SA, Robbins RA, Yates D, Keatings V, Barnes PJ. Acute and chronic effects of
cigarette smoking on exhaled nitric oxide. Am J Respir Crit Care Med. 1995 Aug;
152(2):609-12.
15. Hoyt JC, Robbins RA, Habib M, Springall DR, Buttery LDK, Polak JM, Barnes PJ.
Cigarette smoke decreases inducible nitric oxide synthase in lung epithelial cells. Exp Lung
Res. 2003; 29:17-28.
16. Maziak W., Loukides S. Culpitt S, Sullivan P, Sergei A, Kharatinov A, Barnes PJ. Exhaled
Nitric Oxide in Chronic Obstructive Pulmonary Disease. Am J Respir Crit Care Med 1998;
157: 998- 1002.
17. Corradi M, Majori M, Cacciani C G, Consigli GF, de� Munari E, Pesci A. Increased exhaled
nitric oxide in patients with stable chronic obstructive pulmonary disease. Thorax 1999; 54:
572- 575.
18. Papi A, Romagnoli M, Baraldo S, Braccioni F, Guzzinati I, Saetta M, Ciaccia A, Fabbri
LM. Partial Reversibility of Airflow Limitation and Increased Exhaled NO and Sputum
20
Eosinophilia in Chronic Obstructive Pulmonary Disease. Am J Respir Crit Care Med 2000;
162; 1773- 1777.
19. George S.C., Hogman M, Permutt S, Silkoff P E. Modelling pulmonary nitric oxide
exchange. J Appl Physiol 2004; 96: 831- 839
20. Tsoukias N M, George S C. A two- compartment model of pulmonary nitric oxide exchange
dynamics. J Appl Physiol 1998; 85 (2): 653- 666.
21. Jorres R. A. Modelling the production of nitric oxide within human airways. Eur Respir J
2000; 16: 555- 560.
22. Berry M. ,Hargadon B, Morgan A, Shelley M, Richter J, Shaw D, Green R H, Brightling C,
Wardlaw A J, Pavord I D. Alveolar nitric oxide in adults with asthma: Evidence of distal
lung inflammation in refractory asthma. Eur Respir J2005: 25 (6); 986-991.
23. Hogman M, Holmkvist T, Wegener T, Emtner M, Andersson M, Hedenstrom H, Merilainen
P. Extended NO analysis applied to patients with COPD, allergic asthma and allergic
rhinitis. Resp Med 2002; 96: 24- 30.
24. Brindicci C, Ito K, Resta O, Pride N B, Barnes P J, Kharitonov S A. Exhaled nitric oxide
from lung periphery is increased in COPD. Eur Respir J 2005; 26: 52-59.
25. Lehtimaki L, Kankaanranta H, Saarelainen S, Turjanmaa V, Moilanen E. Inhaled
fluticasone reduces bronchial but not alveolar nitric oxide output in asthma. Eur Respir J
2001 18; 635-639.
26. Malinovschi A, Janson C, Holmkvist T, Norback D, Merilainen and Hogamn M. Effect of
smoking on exhaled nitric oxide. Eur Respir J 2006; 28: 339-345.
27. Shin H W, Rose-Gottron CM, Cooper DM, Newcomb RL, George SC. Airway Diffusing
capacity of nitric oxide and steroid therapy in asthma. J Appl Physiol 2004; 96: 65-75.

21
28. Silkoff P E, Sylvester J T, Zamel N, Permutt S. Airway nitric oxide diffusion in asthma.
Role in pulmonary function and bronchial responsiveness. Am J Respir Crit Care Med
2000: 161; 1218-1228.
29. Pietropaoli A P, Perillo I B, Torres A, Perkins P T, Frasier L M, Utell M J, Frampton M W,
Hyde R W. Simultaneous measurement of nitric oxide production by conducting and
alveolar airways of humans. J Appl. Physiol. 1999: 87(4); 1532-1542.
30. National collaborating centre for chronic conditions; chronic obstructive pulmonary disease.
National clinical guideline on management of COPD in adults in primary and secondary
care. Thorax 2004; 59: Suppl. 1, 1-232.
31. American Thoracic Society. Recommendations for standardised procedures for the offline
and online measurement of exhaled lower respiratory nitric oxide and nasal nitric oxide in
adults and children. Am J Respir Crit Care Med 2005; 160: 2104- 2117.
32. Weitzberg E, Lundburg J O N. Nonenzymatic nitric oxide production in humans. Nitric
Oxide: Biology and Chemistry 1998; 2 (1); 1-7.
33. Kharitonov SA, Barnes PJ. Exhaled biomarkers. Chest 2006 Nov; 130(5):1541-6.
34. Shin H W, Condorelli P, George SC. Examining axial diffusion of nitric oxide in the lungs
using heliox and breath hold. J Appl Physiol; 100: 623-630.

22
Table 1
Subject Demographics
Subject n ICS use Gender M/F
Age Smoking history
(pack years)
FEV1 (%
Predicted) COPD smokers
(COPD S) 23 6 15/8 60 (6) 42 (10) 64 (11)
COPD ex smokers (COPD EX)
27 18 17/10 65 (7) 49 (30) 58 (12)
Healthy Smokers (HS)
19 N/A 12/9 58 (7) 34 (16) 94 (9)
Healthy non smokers (HNS)
16 N/A 9/10 60 (11) N/A 113 (11)
Data expressed as mean (sd).

23
Table 2
(i) CalvNO and (ii) DawNO in COPD and healthy subjects calculated by different methods
(i) CalvNO Linear 1 Non linear Mixed 1 Mixed 2
COPDS 2.3 (1.7, 3.1) 3.0 (2.4, 3.8) 2.3 (1.7, 3.1) 2.7 (1.9, 3.7) COPDEX 2.8 (1.9, 4.1) 3.7 (2.7, 5.1) 2.8 (1.9, 4.1) 2.9 (2.1, 4.1)
HS 3.0 (2.2, 4.1) 3.6 (2.8, 4.6) 3.0 (2.2, 4.1) 1.8 (0.0, 4.2) HNS 2.4 (1.6, 3.5) 3.2 (2.6, 4.0) 2.4 (1.6, 3.5) 2.6 (1.8, 3.9)
(ii) DawNO
Linear 2 Non linear Mixed 1 Mixed 2 COPDS 7.4 (5.8- 11.8) 8.9 (6.8-14.8) 10.6 (7.6-18.8) 10.5 (5.6-21.1)
COPDEX 8.1 (5.3-10.3) 7.7 (1.7-13.5) 7.4 (2.6-13.9) 9.9 (9.1-11.1) HS 6.6 (5.7-8.8) 6.5 (3.5-8.1) 9.1 (9.1-11.5) 9.9 (6.0-14.7)
HNS 6.7 (5.1-8.6) 7.4 (4.5-10.3) 9.4 (8.3-11.2) 7.8 (6.7-8.3) COPD S: COPD smokers; COPD EX: COPD ex smokers; HS: Healthy smokers HNS: Healthy
non smokers. Data are presented as geometric means (95% confidence intervals) for CalvNO and
medians (interquartile ranges) for DawNO.

24
Table 3
Effect of number of flow rates on the derived NO model parameters: - Comparison of model
parameters calculated using the five or four highest or lowest flow rates by the non linear and
mixed methods.
5 v 4 highest flows 5 v 4 lowest flows Non linear
CawNO CalvNO DawNO J�awNO
2.02 (1.45, 2.83) ** 1.99 (1.43, 2.75) ** 19.55 *** 0.72 (0.58, 0.90) **
0.70 (0.61, 0.81) *** 0.86 (0.79, 0.92) *** -1.24 *** 1.10 (1.06, 1.14) ***
Mixed 1 CawNO CalvNO DawNO J�awNO
1.68 (1.34, 2.11) ** # -4.24 *** 0.91 (0.76, 1.08) NS
0.56 (0.38, 0.83) * 0.76 (0.61, 0.94) * -1.01 * 1,12 (1.03, 1.23) *
Mixed 2 CawNO CalvNO DawNO J�awNO
0.92 (0.72, 1.18) NS # 0.650 NS 1.27 (0.96, 1.68) NS
1.12 (0.89, 1.41) NS 0.68 (0.53, 0.88) * 0.38 NS 0.97 (0.86, 1.09) NS
* P<0.05; ** = P<0.001;*** = P<0.0001; NS= not significant
Data for CawNO, CalvNO and J�awNO presented as ratio of the 2 groups (95% confidence interval
of the ratio) Data for DawNO presented as median difference.
#; For the mixed methods, CalvNO is calculated using the highest flow rates; 200 and 100ml/s,
and hence is the same whether obtained using the 5 or the 4 highest flow rates

25
Table 4
Within and between day reproducibility of FeNO in COPD (N=12).
FeNO (ml/s) Week 1 (10am) Week 1 (1pm) Week 2 (10am) 10 47.6 (23.5 � 71.7) 49.8 (25.7-73.9) 50.6 (16.7-84.5)
30 21.5 (13.3-29.7) 21.1 (13.6-28.7) 23.6 (10.4-36.7)
50 17.3 (10.8-23.8) 16.1 (10.0-22.2) 18.5 (8.6- 28.3)
100 9.7 (6.3- 13.0) 9.8 (6.6-13.0) 10.8 (5.5-16.1)
200 6.5 (4.3-8.7) 6.5 (4.6-8.5) 7.0 (4.1-9.9)
Data are presented as geometric means (95% confidence intervals)
26
Figure Legends
Figure1
FeNO0.05 in COPD and healthy subjects.
27
CS: COPD smokers; CEX: COPD ex smokers; HS: Healthy smokers HNS: Healthy non smokers.
The box extends from the 25th to the 75th percentile. The middle line represents the median and
error bars extend from the lowest to the highest values.
Figure 2
NO airway wall concentration (CawNO) in COPD and healthy subjects calculated by four
different methods: (i) linear (ii) non linear (iii) mixed 1 and (iv) mixed 2.
CS: COPD smokers; CEX: COPD ex smokers; HS: Healthy smokers; HNS: Healthy non
smokers. Horizontal bars (-) represent geometric means.

28
Figure 3
Maximal NO flux (J�awNO) in COPD and healthy subjects calculated by 4 different methods: (i)
linear 2 (ii) non linear (iii) mixed 1 and (iv) mixed 2.
CS: COPD smokers; CEX: COPD ex smokers; HS: Healthy smokers; HNS: Healthy non
smokers. Horizontal bars (-) represent geometric means.
Figure 4

29

30
Differences in a) CalvNO, b) JawNO and c) CawNO between the NO modelling methods in COPD.
L1: Linear 1, L2: Linear 2, M1: Mixed 1, M2: Mixed 2 and NL: Non linear.
The middle horizontal bar (-) represents the ratio of the two groups and the upper and lower bars
represents the 95% confidence interval of the ratio.
Figure 5

31

32
Error between modelled data and actual data derived for NO model parameters: Comparison of
the mixed and full non linear methods.
M1: mixed method 1; M2: mixed method 2; NL: non linear method. Horizontal bars (-) represent
geometric means.