Use of Bayesian Network to Support Risk-Based Analysis...
12
* [email protected] Probabilistic Safety Assessment and Management PSAM 12, June 2014, Honolulu, Hawaii Use of Bayesian Network to Support Risk-Based Analysis of LNG Carrier Loading Operation Arthur Henrique de Andrade Melani a , Dennis Wilfredo Roldán Silva a , Gilberto Francisco Martha Souza a * a University of São Paulo, São Paulo, Brazil Abstract: This paper presents a methodology for risk analysis of LNG carriers operations aiming at defining the most critical pieces of equipments as for avoiding LNG leakage during loading and unloading operations. The pieces of equipment considered critical for loading and unloading operations are identified and the Cause-Consequence diagram is built. The probability of occurrence of each event listed in the diagram is calculated based on Bayesian network method. The consequences associated with those scenarios are estimated based on literature review. Based on the calculated risk profile some maintenance and operational recommendations are presented aiming at reducing the probability of occurrence of the critical failure scenarios. Keywords: LNG, Cause-Consequence diagram, Risk analysis, Bayesian networks. 1. INTRODUCTION The increasing worldwide demand for Liquefied Natural Gas (LNG) has corroborated its importance as a component of the world's supply of energy. Once the great consumers (concentrated in Asia, Europe and North America) of natural gas are not the great worldwide producers (concentrated in the Middle East, Africa and Central America) the need for transportation of that hydrocarbon has still increased [1]. Natural gas can be transported in its liquid form by large LNG carriers between liquefaction plants at exporting countries (where LNG is loaded into the tank ship) and regasification plants at importing countries (where LNG is unloaded from the tank ship). As well as any other industrial activity, the natural gas industry is not free from accidents, which can cause serious consequences to the integrity of people and properties. For this reason, it is necessary to develop studies to determine what are the possible causes and scenarios of these faults specifically in the area of LNG transportation [2]. Considering the high quantity of equipments involved in the LNG carriers loading and unloading operations and also the large volume of flammable liquid that is transferred during these proceedings, the use of risk analysis techniques available in the literature are recommended to avoid accidents during such procedures. Based on the Formal Safety Assessment (FSA) guidelines proposed for petroleum industry [3], this paper presents a risk-based method to analyze the failure scenarios and associated consequences that may happen during the cargo handling operation of a LNG carrier. The paper determines the possible leakage causes and classifies their consequences. The risk involved in loading and unloading operations is described considering the probability of occurrence of each failure mode and the consequences of the leakage based on a risk matrix method. Recommendations to avoid the occurrence of LNG leakage are discussed. 2. METHODOLOGY The method used for LNG carrier operation analysis is a risk-based approach based on Formal Safety Assessment (FSA) guidelines proposed for petroleum industry [3]. The first step is to identify and to select the pieces of equipment and components which are part of the loading and unloading system.
Transcript of Use of Bayesian Network to Support Risk-Based Analysis...
Probabilistic Safety Assessment and Management PSAM 12, June 2014, Honolulu, Hawaii
Use of Bayesian Network to Support Risk-Based Analysis of LNG Carrier Loading Operation
Arthur Henrique de Andrade Melani
a, Dennis Wilfredo Roldán Silva
a,
Gilberto Francisco Martha Souzaa*
a University of São Paulo, São Paulo, Brazil
Abstract: This paper presents a methodology for risk analysis of LNG carriers operations aiming at
defining the most critical pieces of equipments as for avoiding LNG leakage during loading and
unloading operations. The pieces of equipment considered critical for loading and unloading
operations are identified and the Cause-Consequence diagram is built. The probability of occurrence
of each event listed in the diagram is calculated based on Bayesian network method. The
consequences associated with those scenarios are estimated based on literature review. Based on the
calculated risk profile some maintenance and operational recommendations are presented aiming at
reducing the probability of occurrence of the critical failure scenarios.
Keywords: LNG, Cause-Consequence diagram, Risk analysis, Bayesian networks.
1. INTRODUCTION
The increasing worldwide demand for Liquefied Natural Gas (LNG) has corroborated its importance
as a component of the world's supply of energy. Once the great consumers (concentrated in Asia,
Europe and North America) of natural gas are not the great worldwide producers (concentrated in the
Middle East, Africa and Central America) the need for transportation of that hydrocarbon has still
increased [1].
Natural gas can be transported in its liquid form by large LNG carriers between liquefaction plants at
exporting countries (where LNG is loaded into the tank ship) and regasification plants at importing
countries (where LNG is unloaded from the tank ship).
As well as any other industrial activity, the natural gas industry is not free from accidents, which can
cause serious consequences to the integrity of people and properties. For this reason, it is necessary to
develop studies to determine what are the possible causes and scenarios of these faults specifically in
the area of LNG transportation [2].
Considering the high quantity of equipments involved in the LNG carriers loading and unloading
operations and also the large volume of flammable liquid that is transferred during these proceedings,
the use of risk analysis techniques available in the literature are recommended to avoid accidents
during such procedures.
Based on the Formal Safety Assessment (FSA) guidelines proposed for petroleum industry [3], this
paper presents a risk-based method to analyze the failure scenarios and associated consequences that
may happen during the cargo handling operation of a LNG carrier. The paper determines the possible
leakage causes and classifies their consequences. The risk involved in loading and unloading
operations is described considering the probability of occurrence of each failure mode and the
consequences of the leakage based on a risk matrix method. Recommendations to avoid the
occurrence of LNG leakage are discussed.
2. METHODOLOGY The method used for LNG carrier operation analysis is a risk-based approach based on Formal Safety
Assessment (FSA) guidelines proposed for petroleum industry [3]. The first step is to identify and to
select the pieces of equipment and components which are part of the loading and unloading system.

Probabilistic Safety Assessment and Management PSAM 12, June 2014, Honolulu, Hawaii
The functional tree is developed to explain the functional relation between the pieces of equipment
aiming at the reliable operation of the system.
The second step is called hazard identification, which applies the Preliminary Hazard Analysis, and is
used to identify the hazards associated with loading and unloading operations, related to the failure of
pieces of equipment. The Cause-Consequence Diagram is used to identify the failure scenarios
associated with a given hazard occurrence and the control and alarm systems used as barriers to avoid
failure propagation. The probability of each of the events listed in the cause-consequence diagram is
calculated based on Bayesian network method. That method is an alternative for the use of Fault Tree
Analysis to define the probability of occurrence of a specific event.
The third step is the development of the risk analysis in order to obtain a quantitative value of risk
which allows the classification of the risk associated with a given hazard as low, acceptable and
unacceptable, in accordance with a risk matrix. Finally, the recommendations to reduce the occurrence
of the events that may cause a given failure scenario can be proposed. In Figure 1 a flowchart is used
to illustrate each step of the proposed method.
Figure 1 - Flowchart of the Proposed Method
3. APPLICATION OF THE METHOD
The present study analyzes the loading and unloading operations of a Mark III LNG carrier with four
storage tanks and cargo capacity of 138,000 m3. The loading and unloading system is composed by
subsystems, as for example: pumping, storage, distribution, relief system and the manifold. The main
components used in the cargo handling system are shown in Fig 2.
During loading operation, LNG is loaded through the manifold and it is carried through two secondary
pipelines to the liquid header line, which distributes it to each tank. Loading is completed when all
tanks are loaded with 98,5% of its full capacity. After that, LNG is drained from the valves and
pipelines and sent to a cargo tank, avoiding the presence of methane in the inactive lines.
The LNG is unloaded with the use of one main cargo pump for each tank which is submerged inside
the respective tank. The main cargo pumps discharge the LNG to the main liquid header and then this
fluid is transferred to the terminal through the manifold connections. Each tank is not fully discharged
leaving a volume of LNG corresponding to a level of about 0,1m. On completion of discharge, the
loading arms and pipelines are purged and drained into one cargo tank and the loading arms are then
also disconnected
The loading and unloading system has a liquid header line that have two relief valves which function
is to transfer the LNG relief to the cargo tanks when the liquid pressure is higher than 10 bar (relief
valves set-up pressure). Usually, the pressure inside the pipelines is 1 bar. In the loading and
unloading piping system are installed relief valves to avoid the raise in liquid pressure.
The storage system consists of four insulated cargo tanks, separated from each other by transverse
cofferdams, and from the outer hull of the vessel by wing and double bottom ballast tanks. The
insulation covers the entire primary barrier which purpose is to maintain the cryogenic temperature
and to prevent the generation of the boil-off gas. According to [3], the LNG carriers have a secondary
barrier that is used to contain the LNG in the case of primary barrier failure and to avoid the contact of
the ship’s structure with the low temperatures of the cryogenic substance.

Probabilistic Safety Assessment and Management PSAM 12, June 2014, Honolulu, Hawaii
Figure 2 - LNG Circuit for Loading and Unloading Operations [14]
3.1. Functional Tree
The functional tree (Figure 3) is used to describe a system, determining its functions and the
contribution of each of its components to the system performance. The cargo handling system is
divided in five subsystems: pumping, storage, distribution, manifold and relief. Those subsystems are
divided in components each of one performing a specific function linked with subsystem main
function. A failure in a component at the bottom of the tree affects the performance of the subsystem
above it, causing a possible interruption in loading or unloading operations, including LNG leakage.
Figure 3 - Functional Tree of the Loading and Unloading System [14]

Probabilistic Safety Assessment and Management PSAM 12, June 2014, Honolulu, Hawaii
3.2. Preliminary Hazard Analysis
The Preliminary Hazard Analysis (PHA) is used to identify those accidental events that will be subject
to the further risk analysis. The PHA technique was chosen to be applied here because it can be used
in any period of the equipment lifecycle, including design and operation.
The present analysis studies the hazard LNG leakage during the loading and unloading operations. The
causes of occurrence, consequences and safeguards associated with that hazard are identified and
analyzed to develop the PHA table. This analysis is shown in the Table 1. The causes of LNG leakage
considered in the PHA associated with the valves are structural deficiency, external leakage (process
medium), and valve leakage in closed position. In the case of the cryogenic pumps the failure mode
considered in the analysis is fail to stop on demand. In pipelines the main failure modes are presence
of a through thickness crack, partial and total pipe cross section rupture.
3.3. Cause-Consequence Analysis
The Cause-Consequence Analysis is used to identify and evaluate the sequence of events that can
happen given a initiating event. The analysis aims at determining if the initiating event can induce an
accident or if the accident is avoided by the protection barriers of the system. In this paper, the
analysis begins with the failure of the components of the cargo handling system and is centered in the
occurrence of LNG leakage. Considering LNG leakage in the loading/unloading system, a series of
events can happen, as shown in the Cause-Consequence Diagram presented in Figure 4.
Figure 4 - Cause-Consequence Diagram
The safety barriers are designed to stop the loading/unloading operation and to avoid the continuous
LNG leakage. These barriers ideally should not fail because any failure can cause major consequences.
The first barrier is the Cargo Control Room, which remotely controls and monitors the cargo handling
operations. All major valves such as the manifold valves, also called ESD Manifold valves, and
individual tank loading and discharge valves, are remotely operated from the IAS, so that all normal
cargo operations can be carried out from the cargo control room.
The second barrier is the Gas Detection System, which detects the presence of gas, especially in
spaces where gas is not normally expected to be presented. Various sensors monitors both hazardous
and non-hazardous gas zones. If gas is detected, alarms are activated, indicating the occurrence of a
leakage. The entire cargo piping system and cargo tanks are considered gas hazardous zones.

Probabilistic Safety Assessment and Management PSAM 12, June 2014, Honolulu, Hawaii
The third barrier is the Emergency Shutdown System (ESD). During the loading and unloading
operations in case of LNG leakage, the emergency shutdown (ESD) system can be used to isolate the
leaking pipe section and to stop the primary pumps and to close the ESD valves to avoid a large liquid
spill. The ESD system is automatically activated in response to hazard detectors (gas and fire
detectors), process alarms (pressure loss in pipe) or an operator pushing an ESD button, as defined by
[4]. This system acts in response to a liquid release, interrupting the duration of the release and so
affecting the consequences associated with that leakage. In case of LNG leakage, the ESD system can
automatically isolate the cargo handling system or stop the process by shutting down the primary
pumps and/or closing the ship-side valves located in the manifold V100, V200, V300 showed in
Figure 2.
The possible scenarios for the LNG leakage are listed in the sequence, according to Figure 4 and
described in Table 1.
The first scenario is the failure in the cargo handling system but the IAS works not causing important
consequences once the ESD operated. In this case the failed line must be isolated, controlling the
leakage, and the operation must be stopped. The second scenario occurs when after the LNG leakage
the IAS does not detect the variation of the main process parameters like pressure, temperature, or
flow. If a variation of these parameters is not detected by the IAS the ship has a gas detection system
which works and consequently the ESD is activated, causing the stop of the loading or unloading
operation.
The third scenario takes place if no one of those safety systems activates the ESD. In the place where
leakage occurs a pool can be formed with a vapor cloud which concentration can be between the low
and upper flammability limit but in the absence of an ignition source the vapor disperse into the
atmosphere without causing effects to the ship or to the terminal. The downwind distance that
flammable vapors might reach is a function of the volume of LNG spilled, the rate of the spill, and the
weather conditions. The last scenario has the same sequence of the third scenario but the difference is
that the vapor cloud is ignited by an energy source from the ship or from the terminal. The result is an
ignition of the flammable vapor-air mixture in open areas and an ignition with explosion in close
areas. The flame will burn back to the vapor source possibly causing a pool fire, according to [5].
3.4. Bayesian Network
According to [6, 7], a Bayesian Network (BN) consists of a directed acyclic graph in which each node
is annotated with quantitative probability information. Each node corresponds to a random variable,
which may be discrete or continuous. A set of directed links or arrows connects pairs of nodes. If there
is an arrow from node X to node Y, X is said to be a parent of Y. To each node Y with parents X1, ...,
Xn, a conditional probability table P(Y|X1, ..., Xn) is attached, quantifying the effect of the parents on
the node.
BNs have become a widely used formalism for representing probabilistic systems and have been
applied in a variety of areas, especially in Artificial Intelligence. In dependability and risk analysis,
however, other techniques, like Fault Tree Analysis (FTA), are yet more employed for evaluations of
safety-critical systems. But the modelling flexibility of the BN formalism can accommodate various
kinds of statistical dependencies that cannot be included in the FTA, for example, obtaining a more
precise result [8].
In this paper, BNs are built to obtain the reliability of the barriers presented in the Cause-Consequence
Diagram. Although three barriers are described, only the BN from the ESD system (third barrier), is
shown (Figure 5). Databases [9] and [10] are used to define the reliability of the different
components of the barriers. Table 2 shows the calculated reliabilities of the barriers, for one
year of operation.

Probabilistic Safety Assessment and Management PSAM 12, June 2014, Honolulu, Hawaii
Table 1 - Preliminary Hazard Analysis N° Hazard Cause Consequence Safeguards
1
LN
G l
eak
age
Failure in the
connection of the
loading arms
with the ship’s
manifold.
Structural damage of the ship’s
structure due to the LNG
leakage. There is the possibility
of vapor cloud formation.
Stopping the loading or
unloading process. Activation
of the emergency system.
Drip tray is installed in the manifold areas in order
to collect any spillage and drains it overboard. The
ship has a monitoring system that monitors and
indicates which are the internal conditions of the
circuit of LNG and an alarm system that indicates
the occurrence of natural gas leakage allowing the
interruption of the transfer process.
2
Structural
deficiency in the
valves.
Structural damage of the ship’s
structure due to the LNG
leakage. There is the possibility
of vapor cloud formation.
Stopping the loading or
unloading process. Activation
of the emergency system.
The ship has a monitoring system that monitors and
indicates which are the internal conditions of the
loading and unloading system and an alarm system
that indicates the occurrence of natural gas leakage
allowing the interruption of the transfer process.
3
Valve leakage in
closed position
allowing that
LNG can
circulate in other
systems such as
the relief system,
the emergency
system or the
spray system.
Entry of LNG into the spray
system. Entry of LNG into the
relief system. Stopping LNG
transfer process.
There are valves to contain the LNG preventing the
flow of LNG to a line where it should not be as for
example the emergency pipelines or the pipes that
are used for the spray operation. The ship has a
monitoring system that monitors and indicates
which are the internal conditions of the loading and
unloading system and an alarm system that
indicates the occurrence of natural gas leakage
allowing the interruption of the transfer process.
4
Crack or rupture
in the liquid
header line, in the
secondary
pipelines or in
the relief
pipelines.
Damage in the ship's structure.
Possibility of vapor cloud
formation . Freezing in the
surrounding areas. Possibility of
entry of atmospheric air into the
LNG system and breaking the
inert environment. Stopping the
LNG transfer process.
The ship has an emergency system that stops the
loading and unloading process in case of a leakage.
The ship has a monitoring system that monitors and
indicates which are the internal conditions of the
loading and unloading system and an alarm system
that indicates the occurrence of natural gas leakage
allowing the interruption of the transfer process.
5
Crack or rupture
in the primary
cargo tanks.
Damage in the ship's structure.
Possibility of vapor cloud
formation. Freezing in the
surrounding areas. Possibility of
entry of atmospheric air into the
LNG system and breaking the
inert environment. Stopping the
LNG transfer process.
The ship has a monitoring system that monitors and
indicates which are the internal conditions of the
loading and unloading system and an alarm system
that indicates the occurrence of natural gas leakage
allowing the interruption of the transfer process.
There is a secondary tank that has the function of
containment the LNG in case of any leakage from
the primary tank. There is an emergency system that
stops the loading and unloading process.
6
Failure of the
alarm level inside
the LNG storage
tanks that will
cause the
overfilling of one
or more storage
tanks.
Stopping of the loading or
unloading transfer process.
Damage to the ship's structure.
Freezing in the surrounding
areas. Possibility of vapor cloud
formation.
There are three levels of alarms that paralyze the
cargo pumps. The ship has a monitoring system that
monitors and indicates which are the internal
conditions of the loading and unloading system and
an alarm system that indicates the occurrence of the
natural gas leakage and allow the suspension of the
transfer process.
7
Pressure increase
within the
loading and
unloading system
due to high
output discharge
pressure in the
cargo pumps.
Rupture or crack in the LNG
circuit due to high pressure
inside it. Stopping of the LNG
transfer process. Possibility of
vapor cloud formation.
The ship has a monitoring system that monitors and
indicates which are the internal conditions of the
loading and unloading system and an alarm system
that indicates the occurrence of the natural gas
leakage allow the suspension of the transfer process.

Probabilistic Safety Assessment and Management PSAM 12, June 2014, Honolulu, Hawaii
Figure 5 - Bayesian Network of the ESD System
Probabilistic Safety Assessment and Management PSAM 12, June 2014, Honolulu, Hawaii
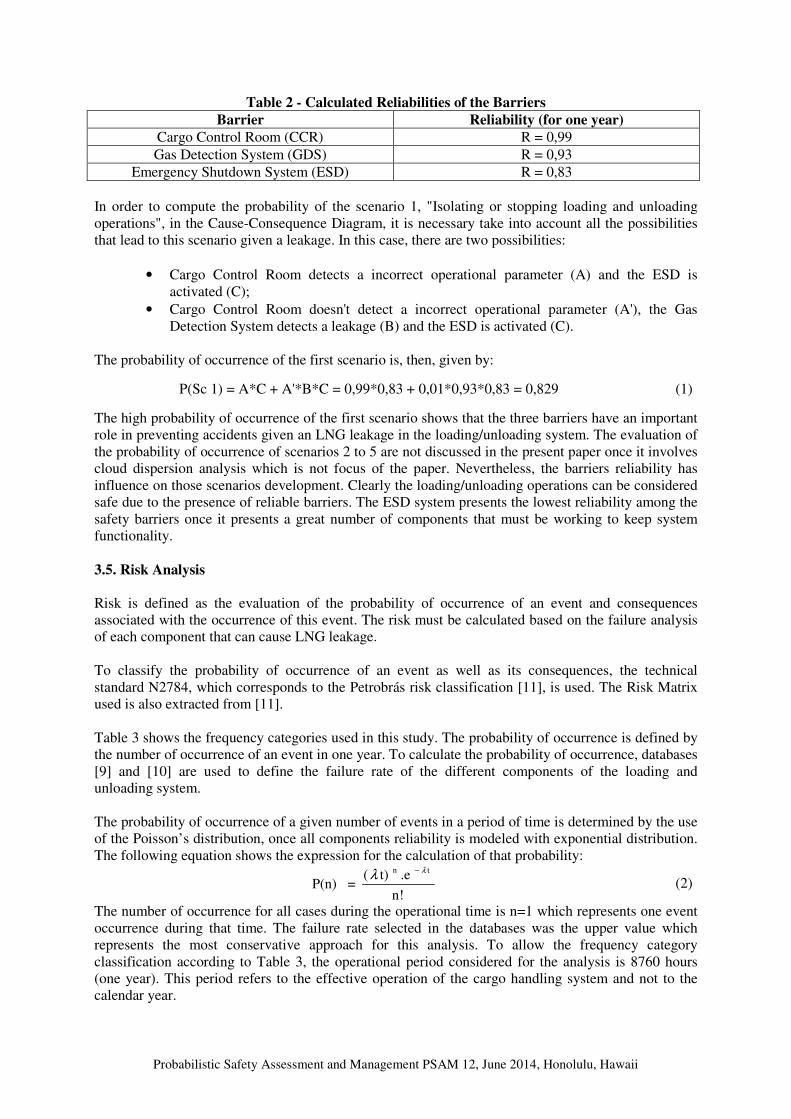
Table 2 - Calculated Reliabilities of the Barriers
Barrier Reliability (for one year)
Cargo Control Room (CCR) R = 0,99
Gas Detection System (GDS) R = 0,93
Emergency Shutdown System (ESD) R = 0,83
In order to compute the probability of the scenario 1, "Isolating or stopping loading and unloading
operations", in the Cause-Consequence Diagram, it is necessary take into account all the possibilities
that lead to this scenario given a leakage. In this case, there are two possibilities:
• Cargo Control Room detects a incorrect operational parameter (A) and the ESD is
activated (C);
• Cargo Control Room doesn't detect a incorrect operational parameter (A'), the Gas
Detection System detects a leakage (B) and the ESD is activated (C).
The probability of occurrence of the first scenario is, then, given by:
P(Sc 1) = A*C + A'*B*C = 0,99*0,83 + 0,01*0,93*0,83 = 0,829 (1)
The high probability of occurrence of the first scenario shows that the three barriers have an important
role in preventing accidents given an LNG leakage in the loading/unloading system. The evaluation of
the probability of occurrence of scenarios 2 to 5 are not discussed in the present paper once it involves
cloud dispersion analysis which is not focus of the paper. Nevertheless, the barriers reliability has
influence on those scenarios development. Clearly the loading/unloading operations can be considered
safe due to the presence of reliable barriers. The ESD system presents the lowest reliability among the
safety barriers once it presents a great number of components that must be working to keep system
functionality.
3.5. Risk Analysis
Risk is defined as the evaluation of the probability of occurrence of an event and consequences
associated with the occurrence of this event. The risk must be calculated based on the failure analysis
of each component that can cause LNG leakage.
To classify the probability of occurrence of an event as well as its consequences, the technical
standard N2784, which corresponds to the Petrobrás risk classification [11], is used. The Risk Matrix
used is also extracted from [11].
Table 3 shows the frequency categories used in this study. The probability of occurrence is defined by
the number of occurrence of an event in one year. To calculate the probability of occurrence, databases
[9] and [10] are used to define the failure rate of the different components of the loading and
unloading system.
The probability of occurrence of a given number of events in a period of time is determined by the use
of the Poisson’s distribution, once all components reliability is modeled with exponential distribution.
The following equation shows the expression for the calculation of that probability:
n!
.et)(=P(n)
tn λλ
−
(2)
The number of occurrence for all cases during the operational time is n=1 which represents one event
occurrence during that time. The failure rate selected in the databases was the upper value which
represents the most conservative approach for this analysis. To allow the frequency category
classification according to Table 3, the operational period considered for the analysis is 8760 hours
(one year). This period refers to the effective operation of the cargo handling system and not to the
calendar year.

Probabilistic Safety Assessment and Management PSAM 12, June 2014, Honolulu, Hawaii
Table 4 shows the consequence categories used in this study. The consequence is measured as the
impact that the LNG leakage can cause, such as injures of people (crew or third parts) or material
damages (in the LNG carriers or in the terminal). The environmental impact is not analyzed in this
paper.
Table 5 shows the frequency and consequence categories of certain components. The list of
components in Table 5 was extracted from the Preliminary Hazard Analysis (Table 1). The probability
of occurrence was calculated using the equation above.
Table 3 - Frequency Categories
Category Denomination Range
(occurrence/year) Description
A Extremely
remote
Less than 1 in 106
years
Conceptually possible but extremely unlikely to occur during the
lifetime of the facility. There is no reference to historical occurrence
B Remote
Between 1 in 104
years and 1 in 106
years
Not expected to occur during the lifetime of the facility, even though
this may have occurred somewhere in the world
C Less probable
Between 1 in 102
years and 1 in 104
years
Likely to occur once during the lifetime of the facility
D Probable Between 1 in a year
and 1 in 102 years Expected to occur a few times during the lifetime of the facility
E Frequent Over to 1 in a year Expected to occur many times during the lifetime of the facility
Table 4 - Consequence Categories Consequence
category
Description
Personal safety Safety of the facility
I Negligible
Do not cause injuries or deaths of employees or
third parts; and/or neighbour community; the
maximum consequences are cases of first aid or
minor medical treatment
No damage or minor damage to equipment or in
the facility
II Marginal Minor injuries in employees and/or in third parts
Slight damage in the equipments or in the
facility (damages are controllable and/or low-
cost repair)
III Critical
Minor lesions in third parts. Lesions of moderate
severity in employees, contractors and/or people
from outside the facility (remote probability of
death of employees and/or other people)
Severe damage in the equipment or in the
facilities
IV Catastrophic
Causes death or serious injuries to one or more
people (employees, contractors and/or third
parties)
Irreparable damage in the equipment or in the
facilities (repair is slow or impossible)
Having Tables 3, 4 and 5, it is now possible to analyse the risk of the loading/unloading system using
a Risk Matrix. According to [12], the risk matrix approach, combining the likelihood of occurrence of
an event and the consequence, defines risk as a pair located in a given matrix. Risk matrices have been
used extensively for screening of risks in many industries. The risk matrix used in the present study is
presented in Table 6, according to [11]. Risk increases in the direction of the upper-right side of the
matrix and the category changes from NC (non critical) through M(moderate) and C (critical).
For each event listed in Table 5 a risk analysis is performed considering the probability of failure and
the consequences of failure, according to the scenarios developed in the Cause-Consequence diagram.
In case of the failure mode in the pump corresponding to ‘fail to stop on demand’ and in case of
butterfly valves activated by the ESD failure mode ‘fail to close on demand’ the risk is classified as C
(Critical) once if those components fail, there can be a large leakage because the loading and
unloading operations are not interrupted by ESD.
On the other hand, the risk value associated with the majority of components is classified as M
(Moderate). In case of total rupture of the pipelines cross section or primary tank barrier failure, the
risk is considered M (moderate) once the probability category for those events is extremely remote

Probabilistic Safety Assessment and Management PSAM 12, June 2014, Honolulu, Hawaii
(according to Table 5), although the occurrence of those events can cause serious consequences due to
the enormous quantity of LNG leaked if the ESD system fails.
Table 5 - Probability of Occurrence and Consequence for Failures
Table 6 - Risk Matrix Consequence
Negligible Marginal Critical Catastrophic
I II III IV
Fre
qu
ency
Frequent E M M C C
Probable D NC M(2;3;4;8; 19;20;22;23; 24) C C (1;18)
Less Probable C NC M(5;6;7;9; 21) M C
Remote B NC NC(12;15) M M(13;14;16; 17)
Extremely remote A NC NC(11) NC M (10)
The failure of the tank primary barrier is not so critical because it has the secondary barrier which
function is to collect the LNG in case of primary barrier failure. Table 6 shows the risk of each one of
the failure modes presented on Table 5 (observing their numeration). The analysis indicates 3 failure
modes that are considered NC, the majority (19 failure modes) are considered M and finally 2 failure
modes correspond to Critical category which are number 1 and number 18 (‘fail to stop on demand’ of
the pump and ‘fail to close on demand’ of the butterfly valves activated by the ESD respectively).
Component Nº Failure Modes Failure Rate
[failure/hour]
P (n=1)
Probability
Probability
Category
Consequence
Category
Centrifugal pump 1 Fail to stop on demand 1.55E-06 0.01340243 D IV
Lift non-return
valve 2 All modes 1.46E-06 0.01263428 D II
Swing check valve 3 All modes 1.46E-06 0.01263428 D II
Globe valve
4 External leakage-Process medium 1.94E-06 0.01671740 D II
5 Structural deficiency 3.90E-07 0.00340677 C II
6 Valve leakage in close position 9.70E-07 0.00843012 C II
Butterfly valve
7 Structural deficiency 3.90E-07 0.00340677 C II
8 External leakage-Process medium 4.31E-06 0.03637678 D II
9 Valve leakage in close position 7.40E-07 0.00644423 C II
Cargo tank (primary
barrier)
10 Catastrophic 5.70E-12 0.00000005 A IV
11 Minor failure 1.14E-10 0.00000100 A II
Secondary and relief
pipelines (400 mm)
12 Crack of 4 mm in pipelines between
300 and 499 mm 9.13E-09 0.00008000 B II
13 Rupture 1/3 pipeline diameter in
pipelines between 300 and 499 mm 2.28E-09 0.00002000 B IV
14 Guillotine in pipelines between 300
and 499 mm 7.99E-10 0.00000700 B IV
Liquid header line
(600 mm)
15 Crack of 4 mm pipelines between
500 and 1000 mm 7.99E-09 0.00007000 B II
16 Rupture 1/3 pipeline diameter in
pipelines between 500 and 1000 mm 1.14E-09 0.00001000 B IV
17 Guillotine in pipelines between 500
and 1000 mm 4.56E-10 0.00000400 B IV
Butterfly valve
activated by the
ESD
18 Fail to close on demand 5.42E-05 0.29550184 D IV
19 Structural deficiency 5.16E-06 0.04322743 D II
20 External leakage-Process medium 6.47E-05 0.32155361 D II
Relief Valve
21 Structural deficiency 8.50E-07 0.00739505 C II
22 External leakage-Process medium 3.00E-06 0.02561267 D II
23 Valve leakage in close position 2.62E-06 0.02244309 D II
Manifold 24 All modes 2.27E-05 0.16283750 D II

Probabilistic Safety Assessment and Management PSAM 12, June 2014, Honolulu, Hawaii
3.6. Recommendations
The maintenance procedures and the operational recommendations can be used as contingency
measures aiming at reducing the probability of failures of the components listed in the Cause-
Consequence diagram.
The ESD system presents the lowest reliability among the safety barriers once it presents a great
number of components that must be working to keep system functionality. It is mainly constituted by
sensors that are considered electronic devices as for reliability analysis. The pieces of equipment, such
as valves, that are controlled by ESD also have actuators that are usually hydraulic powered. As for
reliability analysis the duration of the useful life of electronic components is very long and the failure
rate is considered constant. The maintenance activities associated with sensors are typically corrective
aiming at restoring the functionality of the device after the loss of function or performance. The
hydraulic actuators reliability can be modeled as aging components with monotonically increasing
failure rate during operational life. For those components preventive inspection and maintenance can
reduce reliability deterioration. To check the sensors and actuators operational condition, at the
beginning of loading/unloading operation, the ESD system is tested, including the actuation of valves
and cargo pumps of LNG carrier and terminal. Also, after the cool down operation, the valves are
actuated in order to verify any detrimental effect of the cargo low temperature on the valves
performance. Nevertheless, due to its random failure nature, the sensors can fail during
loading/unloading operations, without presenting previous performance deterioration. Those failures
can affect ESD system reliability as proposed in the failure scenario presented in the cause-
consequence diagram.
For the valves controlled by ESD the maintenance recommendations are preventive inspection and
time based substitution of components subjected to wear. A periodically tested and repaired
component can have its failure rate modeled as constant, provided that the maintenance activities
cause no deterioration of the valve. Nevertheless, there is still a chance that a valve can fail during
loading/unloading operations.
For structural components such as piping system and cargo tank primary barrier the Linear Elastic
Fracture Mechanics concepts can be used to calculate the number of load cycles to cause the
propagation of a crack until it becomes a through thickness crack, causing LNG leakage [13]. The
crack propagation in pipelines is associated with the cyclic loads induced by temperature change
during cooling down operations. In the primary barrier the main load is the weight of the cargo.
Structural inspection during ship life and pressure test of piping system before loading/unloading
operations will reduce the probability of structural failure. Special care must be taken during the
execution or repair welds aiming at not introducing more defects in the structural part.
4. CONCLUSIONS
The proposed method of risk analysis allows understanding the events that cause the LNG leakage and
the consequences of those events during cargo handling operations. The method helps to determine the
critical components, which failures lead to a high level risk.
The use of Bayesian Networks to help the quantitative analysis of the Cause-Consequence Diagram
proved to be efficient. BNs are very appropriate to represent complex dependencies between
components. Unlikely FTA, however, BN does not allow an easy study of the system just by analyzing
its configuration, been necessary to know the Conditional Probability Table from each node.
Although the paper identified some failure scenarios that could cause critical consequences in case of
LNG leakage, it also stressed the safety measures adopted by LNG transportation industry to prevent
an accident. The sophisticated safety systems include gas detection and low temperature monitoring,
heat and fire detection and cargo-related emergency shutdown devices. All processes involved in LNG
handling are certified by classification societies to ensure international standard of safety.

Probabilistic Safety Assessment and Management PSAM 12, June 2014, Honolulu, Hawaii
Nevertheless, the paper also shows the possibility of improving operational safety based on developing
a reliability database specific for equipment used in LNG carriers and terminals. That database would
support precise reliability estimate that would improve risk analysis and design of this type of ship. It
would also support the improvement of maintenance procedures developed for this type of ships.
Acknowledgements
The authors thank for the financial support of Financiadora de Estudos e Projetos (FINEP) and
Conselho Nacional de Desenvolvimento Científico e Tecnológico (CNPq).
References
[1] G. F. M. Souza, E. M. P. Hidalgo, D. W. R. Silva, M. R. Martins. "Probabilistic Risk Analysis of
a LNG Carrier Loading Pipeline", Proceedings of the 31st International Conference on Ocean,
Offshore and Arctic Engineering, OMAE 2012, Rio de Janeiro, Brazil.
[2] E. M. P. Hidalgo, D. W. R. Silva, G. F. M. Souza. "Application of Markov Chain to Determine
the Electric Energy Supply System Reliability for the Cargo Control System of LNG Carriers",
Proceedings of the 32nd
International Conference on Ocean, Offshore and Arctic Engineering, OMAE
2013, Nantes, France.
[3] International Maritime Organization. "Formal Safety Assessment (FSA) - Liquefied Natural Gas
(LNG) Carriers. Detail of the Formal Safety Assessment". MSC 83/INF 3, IMO 2007.
[4] S. R. Cheng, B. Lin, B. M. Hsu, M. H. Shu. “Fault-tree analysis for liquefied natural gas
terminal emergency shutdown system”, International Journal of Expert Systems with Applications,
Vol 36, pp. 11918 – 11924, 2009.
[5] American Bureau of Shipping. “Consequence Assessment Method for Incidents Involving
Releases from Liquefied Natural Gas Carriers”, Rep# GEMS 1288209, Federal Energy Regulatory
Commission, ABS 2004.
[6] S. Russell, P. Norvig. "Artificial Intelligence: A Modern Approach", Third Edition, Prentice
Hall, 2010, New Jersey.
[7] F. V. Jensen, T. D. Nielsen. "Bayesian Networks and Decision Graphs", Springer Science, 2007,
New York.
[8] A. Bobbio, L. Portinale, M. Minichino, E. Ciancamerla. "Improving the Analysis of Dependable
Systems by Mapping Fault Trees Into Bayesian Networks", Reliability Engineering and System Safety,
Vol 71, pp. 249-260, 2001.
[9] DNV- Det Norske Veritas. “OREDA – Offshore Reliability Data Handbook”, 4th Edition, 2002,
Norway.
[10] HSE - Health and Safety Executive. “Failure Rate and Event Data for use within Land Use
Planning Risk Assessments 2012,” Available at http://www.hse.gov.uk/landuseplanning/failure-
rates.pdf. Accessed in 2014, Jan, 20th.
[11] Petrobrás. "N2784 - Confiabilidade e Análise de Riscos", 2005, Rio de Janeiro.
[12] E. Skramstad, S. U. Musaeus, S. Melbo. “Use of Risk Analysis for Emergency Planning of LNG
Carriers”, Available at http://www.ivt.ntnu.no/ept/fag/tep4215/innhold/LNG%20Conferences/2000/
Data/Papers/Skramstad.pdf . Accessed in 2014, Jan, 20th.
[13] J.J. Wilson. “An Introduction to the Marine Transportation of Bulk LNG and the Design of LNG
Carriers”, International Journal of Cryogenics, Vol 14, pp 115-120, 1974.
[14] G. F. M. Souza, D. W. R. Silva “Risk-Based Analysis of LNG Carriers Loading and Unloading
Operations” Proceedings of the 22th International Offshore and Polar Engineering Conference, ISOPE
2005, Rhodes, Greece.