
Use of a Probabilistic Neural Network to Assign ...
15
Use of a Probabilistic Neural Network to Assign Engineering Student Attrition Risk Factor Cindi Mason, Janet Twomey Ph.D., & Lawrence Whitman Ph.D. Wichita State University [Keywords: Retention, Probabilistic Neural Network, Attrition] 1. Abstract The increased focus on student recruitment and retention has led to various studies on correlation between student attributes and attrition. The purpose of this study was to improve the ability to identify students at risk of attrition by utilizing a probabilistic neural network (PNN) as a non-linear prediction model. This model was built using two cohorts of students at Wichita State University for training and testing. Student attributes serve as the inputs to the neural network, and the output is an attrition risk factor based on the combination of input traits. Although the initial goal of the study was to utilize only those student features that are available at freshman enrollment, the results demonstrate that incoming student demographics and past grades alone are not a strong enough indicator of risk of attrition. The analysis offers insight into the characteristics most influential on student retention, which further solidifies the important role of the first year experience in engineering education. 2. Introduction Engineering student retention has become a topic of increased interest due in part to the fact that, on average, about 40% of students who begin a degree in engineering do not follow through to completion 1 . In fact, depending upon institution, this percentage of engineering student attrition could be as high as 60 - 70% 1, 2 . Although Wichita State University (WSU) does not fall into this extreme category, a 2009 study of the 2001 freshman class showed that over 56% of the students beginning in the WSU College of Engineering (CoE) had either left the CoE or dropped out altogether 3 . The increased demand for engineers highlights the problem of student attrition and increases the importance of recruiting engineering students and retaining those students once they begin the engineering program. The goal of this study, therefore, is to identify students at high risk of attrition in order to properly guide and appropriately intervene. In order to achieve this goal, the objective of this study was to identify the student attributes which have a significant effect on retention and build a probabilistic neural network to assign an attrition risk-factor to students based on those attributes. 2.1 Background 2.1.1 Student Retention Numerous studies have been conducted in an effort to find patterns in attrition and the correlation between student traits and retention. Some of those traits have had consistent correlation with retention, while others have had varying results depending upon the study. For
Transcript of Use of a Probabilistic Neural Network to Assign ...

Use of a Probabilistic Neural Network to
Assign Engineering Student Attrition Risk Factor
Cindi Mason, Janet Twomey Ph.D., & Lawrence Whitman Ph.D.
Wichita State University
[Keywords: Retention, Probabilistic Neural Network, Attrition]
1. Abstract
The increased focus on student recruitment and retention has led to various studies on
correlation between student attributes and attrition. The purpose of this study was to improve the
ability to identify students at risk of attrition by utilizing a probabilistic neural network (PNN) as
a non-linear prediction model. This model was built using two cohorts of students at Wichita
State University for training and testing. Student attributes serve as the inputs to the neural
network, and the output is an attrition risk factor based on the combination of input traits.
Although the initial goal of the study was to utilize only those student features that are available
at freshman enrollment, the results demonstrate that incoming student demographics and past
grades alone are not a strong enough indicator of risk of attrition. The analysis offers insight into
the characteristics most influential on student retention, which further solidifies the important
role of the first year experience in engineering education.
2. Introduction
Engineering student retention has become a topic of increased interest due in part to the
fact that, on average, about 40% of students who begin a degree in engineering do not follow
through to completion1. In fact, depending upon institution, this percentage of engineering
student attrition could be as high as 60 - 70%1, 2
. Although Wichita State University (WSU) does
not fall into this extreme category, a 2009 study of the 2001 freshman class showed that over
56% of the students beginning in the WSU College of Engineering (CoE) had either left the CoE
or dropped out altogether3. The increased demand for engineers highlights the problem of
student attrition and increases the importance of recruiting engineering students and retaining
those students once they begin the engineering program. The goal of this study, therefore, is to
identify students at high risk of attrition in order to properly guide and appropriately intervene.
In order to achieve this goal, the objective of this study was to identify the student attributes
which have a significant effect on retention and build a probabilistic neural network to assign an
attrition risk-factor to students based on those attributes.
2.1 Background
2.1.1 Student Retention
Numerous studies have been conducted in an effort to find patterns in attrition and the
correlation between student traits and retention. Some of those traits have had consistent
correlation with retention, while others have had varying results depending upon the study. For
2
Proceedings of the 2013 Midwest Section Conference of the American Society for Engineering Education
example, gender has been a long-standing feature of study; some studies have indicated that
females are at higher risk for attrition4, 8
, while other studies have argued that female probability
for retention is as high as, if not higher, than male probability for retention2, 9
. Ethnicity is
another example that has a varying relationship with persistence depending upon the study1, 4, 5
.
Of less controversial impact on student retention are factors like ACT scores4, 5
, high school
GPA4, and freshman year GPA
5. Specific to engineering students are factors such as freshman
math course, final grade in that course6, and if the student’s major is in a specific field of
engineering or general engineering2. Some internal and less-tangible factors affecting student
persistence include self-efficacy1, intrinsic motivation
4, 5, and academic and social integration
2, 4,
5. Due to the availability and accessibility of student data, this study only focuses on the student
attributes that can be pulled from WSU’s central student database.
2.1.2 Probabilistic Neural Networks
Probabilistic neural networks (PNNs) are one of many types of artificial neural networks.
Its primary distinguishing quality is that it approaches Bayes’ optimal classification10
. It is
usually faster to train than a multi-layer perceptron, but larger and slower to run because the first
hidden layer has one neuron for each training pattern10
. PNNs are capable of generating accurate
probability classifications and are fairly tolerant of outliers or noisy data10
.
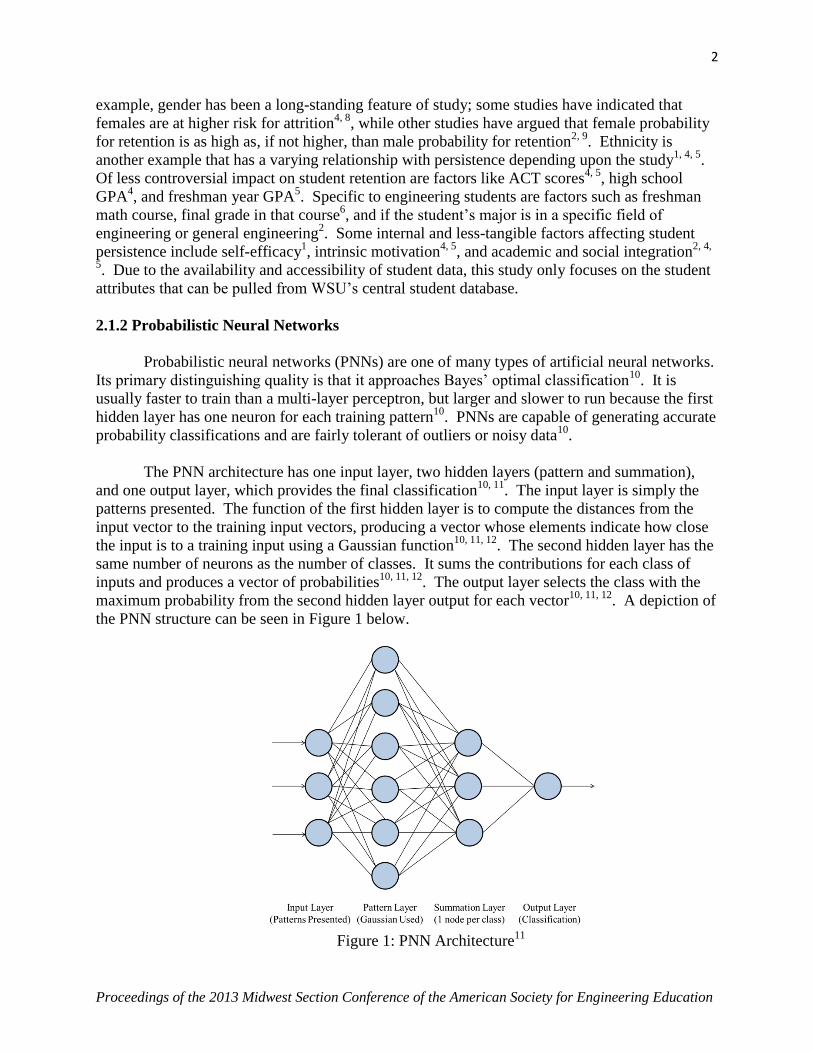
The PNN architecture has one input layer, two hidden layers (pattern and summation),
and one output layer, which provides the final classification10, 11
. The input layer is simply the
patterns presented. The function of the first hidden layer is to compute the distances from the
input vector to the training input vectors, producing a vector whose elements indicate how close
the input is to a training input using a Gaussian function10, 11, 12
. The second hidden layer has the
same number of neurons as the number of classes. It sums the contributions for each class of
inputs and produces a vector of probabilities10, 11, 12
. The output layer selects the class with the
maximum probability from the second hidden layer output for each vector10, 11, 12
. A depiction of
the PNN structure can be seen in Figure 1 below.
Figure 1: PNN Architecture
11

3
Proceedings of the 2013 Midwest Section Conference of the American Society for Engineering Education
The work of training a PNN is determining the optimal σ value, which represents the
sphere of influence or the spread of the radial basis function10
. If σ is too large, the model will
not provide a good representation of the function, but if σ is too small, the model will over-fit the
data10
.
The probabilistic neural network was selected for this study because of its tolerance for
outliers and its probabilistic classification output, which can be translated into an attrition risk
factor.
2.2 Organization of Paper
Unlike other studies which have focused on the cause-effect of individual student
attributes to retention1-9
, this study focuses on the combination of student attributes and their
effect on student retention by use of a probabilistic neural network. Based on the combination of
attributes as an input to the PNN, the resulting output is subtracted from 1 resulting in an attrition
risk factor, which can be used to identify students at high risk of attrition. The description of this
study and corresponding results are discussed in this paper. Section 3 discusses the methods
used including an explanation of what data was collected and why, the analysis of the data, and
the assumptions and limitations of the data collection and analysis. Results of the analysis are
described in Section 4 and further discussed and interpreted in Section 5. Section 6 discusses the
limitations of the study, and Section 7 provides a summary of the study and final conclusions.
3. Methods
3.1 Data Collection
Based on the student traits related to retention as discussed in Section 2.1 and the
availability and accessibility of student information, data was collected for students in the WSU
College of Engineering. Two cohorts of first semester freshman engineering students were
selected for review. The fall 2001 freshman class was chosen as the first cohort of students
because an in-depth study of 2001 students was completed in 2009 providing the final
percentages of those students who completed their engineering degree, switched to an outside
major, or dropped out. The current study may offer greater detail to the 2009 study and possibly
offer insight for further study. To include more recent data, the fall of 2011 freshman class was
selected as the second cohort.
Table 1 on the following page shows the student attributes that were collected,
referencing the studies that have shown a relationship with attrition, and listing the input
conversions used for the PNN model. An input specific to WSU and this study was also added
to determine the effect of taking the Engineering 101 freshman course.
This study specifically drew upon the information available by query from the school’s
database and did not utilize student surveys or any other cross-referencing data requiring person
identifiable information. For this reason student characteristics were limited to those available in
the database.

4
Proceedings of the 2013 Midwest Section Conference of the American Society for Engineering Education
Table 1: Attributes and Corresponding PNN Input Values
3.2 Data Preparation and PNN Model
To ensure validity of the model, all cases with incomplete data were excluded. In other
words, only students with known values for each variable were used for this project; if the
student did not have an ACT score on record, for example, that student was excluded from the
study. This reduced the 2001 cohort from 252 data sets to 125 data sets and reduced the 2011
cohort from 230 data sets to 145 data sets. The two cohorts were merged together and put in
Attribute Input Conversion
0 = Female
1 = Male
Freshman GPA5 No conversion
ACT Math Score4, 5 No conversion
ACT Verbal Score 4 No conversion
High School GPA4 No conversion
0 = Non-White
1 = White
0 = General Engineering
1 = Specific Engineering
0 = Did not take Engr 101
1 = Did take Engr 101
0 = Remedial English required
1 = Remedial English not required
0 = Remedial Math required
1 = Remedial Math not required
0 = No Math
1 = Math 111: Algebra
2 = Math 112: Pre-Calculus
3 = Math 123: Trigonometry
4 = Math 144: Business Calculus
5 = Math 242: Calculus 1
6 = Math 243: Calculus 2
7 = Math 243H: Calculus 2 Honors
8 = Math 344: Calculus 3
0 = No Math
1 = F
2 = D
3 = C
4 = B
5 = A
Age1 No conversion
Freshman math course6
Freshman math grade6
Gender1, 4, 8
Ethnicity1, 4, 5
General Engineering vs Specific Engineering2
Did or did not take Engineering 101 freshman year
Remedial English required13
Remedial Math required13
5
Proceedings of the 2013 Midwest Section Conference of the American Society for Engineering Education
random order, resulting in a total of 270 student data sets. The first 135 students of the randomly
ordered list were used for network training, and the remaining 135 students were used for
network testing using artificial neural network software NeuralWare®.
The PNN utilizes first semester freshman information to predict second semester
enrollment. For the model, each student represents a vector, and each attribute is an input
variable (See Table 1 for variable information). The binary output for network training is
whether or not the student was enrolled in the WSU CoE the following fall semester (1 =
enrolled, 0 = not enrolled). The model formulation was selected for the following reasons: (1)
Most attrition occurs within the first year5, 7
; (2) A one-year window provides ability to evaluate
current data; and (3) It reduces the probability of complex scenarios (e.g. students transferring
into or out of the college, varying graduation times, etc. which may be difficult to identify and
capture). For the test data, the output will provide a probability for the student staying or leaving
by the beginning of their second year, which offers greater insight than the dichotomous output
of the training data, providing a risk factor for each student. The closer the output is to 1, the
higher the probability the student will stay. To test the accuracy, a probability less than or equal
to 0.5 would indicate the student left; a probability greater than 0.5 would indicate the student
stayed. Subtracting that outcome from 1 gives the “attrition risk factor”.
4. Results
Since the purpose of predicting student risk of attrition is to intervene prior to the student
leaving and studies show that the majority of students who leave do so within the first year5, 7
,
only those attributes which are available at freshman enrollment were initially considered for this
study. The attributes considered for the first trial of the probabilistic neural network are as
follows: gender, high school GPA, ACT Math Score, ACT Verbal Score, ethnicity, declared
major, and whether or not remedial English was required (None of the students in the sample
data required remedial Math). However, through various adjustments of parameters, the highest
prediction accuracy achieved for a model using these attributes was 65% (sample results shown
in Appendix N).
In order to increase the prediction accuracy, a second model was developed to include all
attributes gathered for the study as listed in Section 3.1. This increased the prediction accuracy
from 65% to 75% (sample results shown in Appendix O). In order to determine which factors
were driving input/output predictions using all training and testing data, individual scatter
diagrams and box plots were created for the attributes with continuous values, and bar graphs
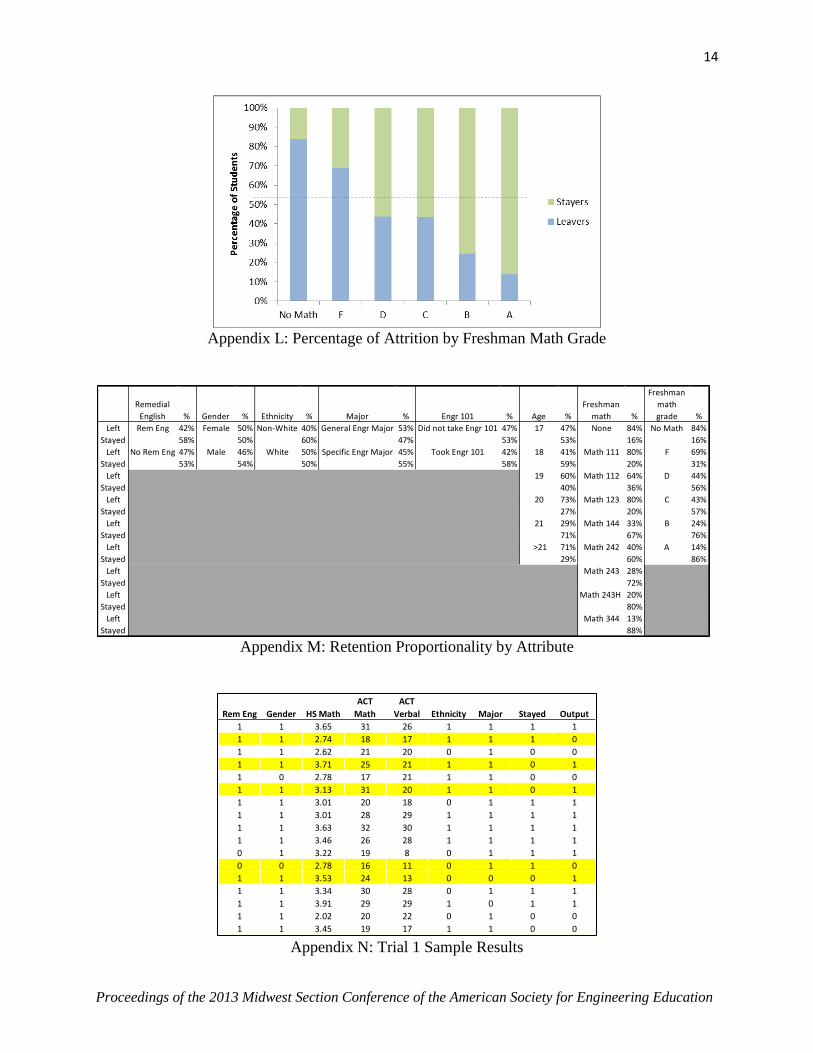
were created for the attributes with binary or interval values (See Appendices A through M). As
can be seen in Appendices A through M, the attributes with highest correlation to attrition are
Freshman GPA, Freshman Math Course, and Freshman Math Grade. Given this finding, a third
model was developed.
The third model included only Freshman GPA, Freshman Math Course, and Freshman
Math Grade as the input variables. With this reduction in variables, the prediction accuracy was
not reduced; the model still achieved 75% prediction accuracy (sample results shown in
Appendix P). The parameters used to achieve the highest prediction accuracy were a 0.25 radius
of influence, 0.5 sigma scale, and 0.5 sigma exponent.
6
Proceedings of the 2013 Midwest Section Conference of the American Society for Engineering Education
5. Discussion
Although the first trial did not produce a high accuracy rate, it offered important insight:
Incoming freshmen previous grades and demographic information alone is not indicative of
student persistence. Achieving an additional 10% accuracy by adding the characteristics
pertaining to the freshman year offers further evidence that the first year plays an important role
in students’ ultimate decision to stay with or leave engineering. As can be seen in Appendix M,
freshman grades and math class show the highest relative importance. Using these factors alone
as inputs to the PNN provides a 75.9% accuracy of predicting student attrition.
These findings demonstrate the importance of the math course(s) taken freshman year
and grades received. Given this insight, great focus should be placed on these variables. For
example, tutoring and course assistance programs should be well-publicized and discussed in
advisement sessions and classrooms. Faculty of the math courses should be made aware of the
importance their role and their course plays in student persistence. The use of surveys or
questionnaires could also gain further understanding as to why these variables play such an
important role and what improvements or adjustments can be made to increase retention.
6. Limitations of Study
One limitation to this study is that it only considers retention into the third semester.
Although most attrition occurs between the first and second year, it does not account for all
attrition. Additionally, the coding of variables could have limited the accuracy of the prediction.
The fact that the highest achievable predication accuracy was 75% suggests that higher
accuracy could be achieved given additional student attributes. Although less tangible factors
such as intrinsic motivation and self-efficacy may be reflected in data such as high school GPA,
they are likely some of the highest drivers in ultimate student retention but are not specifically
collected in this study. A recommendation for future study would be to utilize questionnaires or
surveys to gather information pertaining to self-efficacy, intrinsic motivation, sense of
community, and other less tangible factors for retention, along with an ultimate reason for
leaving for those students who do not stay in engineering. Prediction accuracy may also be
improved with a larger number of students for training the PNN, which is another opportunity for
further study.
This study also only considered three distinct sets of attributes for separate trials based on
data available and logical conclusions drawn iteratively from each model. Other attribute
combinations may affect prediction accuracy.
7. Summary and Conclusions
This paper discussed engineering student retention and the factors that have been shown
to attribute to attrition. Utilizing these attributes which were available in the WSU database, a
probabilistic neural network was developed to provide an attrition risk factor for students with
given characteristics. The initial trial utilized only those characteristics available at freshman
enrollment in an effort to identify a risk factor as soon as the student enters the College of

7
Proceedings of the 2013 Midwest Section Conference of the American Society for Engineering Education
Engineering. However, that model only offered a prediction accuracy of 65%. By adding the
attributes related to freshman performance, the prediction accuracy increased to 75%, and the
driving factors achieving the prediction correlation were found to be freshman math course,
freshman math grade, and freshman GPA.
From this study, it can be concluded that past grades and demographic information of
incoming freshmen is not a high enough indication of student retention and that freshman
experience is critical in the decision to stay with or leave engineering, specifically the math
course taken and grades received the first year. This is an indication that focus should be placed
on these results in terms of advisement, mentoring, raising student awareness of tutoring
programs, and faculty awareness at the least or possibly faculty training.
8. Bibliography
1. Litzler, E. & Young, J., “Understanding the Risk of Attrition in Undergraduate Engineering: Results from the
Project to Assess Climate in Engineering,” Journal of Engineering Education, April 2012, Vol. 101, No. 2, pp.
319–345.
2. Hartman, H. & Hartman, M., “Leaving Engineering: Lessons from Rowan University’s College of
Engineering,” Journal of Engineering Education, Jan 2006, Vol. 95, No. 1, pp. 49-61.
3. Chaparro, B. & Gilmore, C., "Persistence in WSU Engineering,” February 19, 2009 Presentation by WSU
Department of Psychology.
4. Min, Y., Zhang, G., Long, R., Anderson, T. & Ohland, M., “Nonparametric Survival Analysis of the Loss Rate
of Undergraduate Engineering Students,” Journal of Engineering Education, 2011, Vol. 100, No. 2, pp. 349–
373.
5. Moller-Wong, C. & Eide, A., “An Engineering Student Retention Study,” Journal of Engineering Education,
1997, Vol. 86, No. 1, pp. 7 –15.
6. Tyson, W., “Modeling Engineering Degree Attainment Using High School and College Physics and Calculus
Coursetaking and Achievement,” Journal of Engineering Education, October 2011, Vol. 100, No. 4, pp. 760-
777.
7. Besterfield-Sacre, M., Atman, C., & Shuman, L., “Characteristics of Freshman Engineering Students: Models
for Determining Student Attrition in Engineering,” Journal of Engineering Education, April 1997, Vol. 86, No.
2, pp. 139-149.
8. Felder, R., Felder, G., Mauney, M., Hamrin, C., & Dietz, E., “A longitudinal study of engineering student
performance and retention III. Gender differences in student performance and attitudes,” Journal of
Engineering Education, 1995, Vol. 84, No. 2, pp. 151–163.
9. Cosentino De Cohen, C. & Deterding, N., “Widening the Net: National Estimates of Gender Disparities in
Engineering,” Journal of Engineering Education, July 2009, Vol. 98, No. 3, pp. 211-226.
10. “Probabilistic and General Regression Neural Networks”. DTREG. Web. April 7, 2013.
http://www.dtreg.com/pnn.htm
11. “An Introduction to Probabilistic Networks”. University of Manitoba. Cheung, v. & Cannons, K. (2002).
www.psi.toronto.edu/~vincent/research/presentations/PNN.
12. “Probabilistic Neural Networks”. MathWorks®. March 24, 2013.
httpt://www.mathworks.com/help/nnet/ug/probabilistic-neural-networks.html
13. Herzog, S., “Estimating Student Retention and Degree-Completion Time:
Decision Trees and Neural Networks Vis-à-vis Regression," New Directions for Institutional Research, 2006,
Vol. 131, No. 1, pp. 17–33.

8
Proceedings of the 2013 Midwest Section Conference of the American Society for Engineering Education
9. Biographic Information
Cindi Mason received her Bachelor of Science degree in Industrial Engineering from Wichita State
University and her Master of Business Administration degree from Kansas Wesleyan University. She has 10 years
of cumulative experience in the aircraft industry as a supervisor and industrial engineer and is currently working on
her Ph.D. in Industrial Engineering at Wichita State University.
Janet M. Twomey is a Professor of Industrial and Manufacturing Engineering at Wichita State University.
She received B.S., M.S., and Ph.D. degrees in Industrial Engineering from the University of Pittsburgh. Her
research interests include intelligent computational methods and technology for environmental sustainability.
Lawrence E. Whitman is the Associate Dean for the College of Engineering and Professor of Industrial and
Manufacturing Engineering at Wichita State University. He received B.S. and M.S. degrees from Oklahoma State
University. His Ph.D. from the University of Texas, Arlington, is in industrial engineering. Previously, he spent 10
years in the aerospace industry. His research interests are in enterprise engineering, engineering education, and lean
manufacturing.

9
Proceedings of the 2013 Midwest Section Conference of the American Society for Engineering Education
10. Appendix
Appendix A: Scatter Diagram of High School GPA
Appendix B: Box Plot of High School GPA

10
Proceedings of the 2013 Midwest Section Conference of the American Society for Engineering Education
Appendix C: Scatter Diagram of Freshman GPA
Appendix D: Box Plot of Freshman GPA

11
Proceedings of the 2013 Midwest Section Conference of the American Society for Engineering Education
Appendix E: Scatter Diagram of Math ACT Score
Appendix F: Box Plot of ACT Math Scores

12
Proceedings of the 2013 Midwest Section Conference of the American Society for Engineering Education
Appendix G: Scatter Diagram of Verbal ACT Score
Appendix H: Box Plot of ACT Verbal Scores
Appendix I: Retention Proportionality of Binary Student Attributes
0%
20%
40%
60%
80%
100%
Pe
rce
nta
ge o
f St
ud
en
ts
Leavers
Stayers

13
Proceedings of the 2013 Midwest Section Conference of the American Society for Engineering Education
Appendix J: Percentage of Attrition by Student Age at Enrollment
Appendix K: Percentage of Attrition by Freshman Math Course
14
Proceedings of the 2013 Midwest Section Conference of the American Society for Engineering Education
Appendix L: Percentage of Attrition by Freshman Math Grade
Appendix M: Retention Proportionality by Attribute
Appendix N: Trial 1 Sample Results
Remedial
English % Gender % Ethnicity % Major % Engr 101 % Age %
Freshman
math %
Freshman
math
grade %
Left Rem Eng 42% Female 50% Non-White 40% General Engr Major 53% Did not take Engr 101 47% 17 47% None 84% No Math 84%
Stayed 58% 50% 60% 47% 53% 53% 16% 16%
Left No Rem Eng 47% Male 46% White 50% Specific Engr Major 45% Took Engr 101 42% 18 41% Math 111 80% F 69%
Stayed 53% 54% 50% 55% 58% 59% 20% 31%
Left 19 60% Math 112 64% D 44%
Stayed 40% 36% 56%
Left 20 73% Math 123 80% C 43%
Stayed 27% 20% 57%
Left 21 29% Math 144 33% B 24%
Stayed 71% 67% 76%
Left >21 71% Math 242 40% A 14%
Stayed 29% 60% 86%
Left Math 243 28%
Stayed 72%
Left Math 243H 20%
Stayed 80%
Left Math 344 13%
Stayed 88%
Rem Eng Gender HS Math
ACT
Math
ACT
Verbal Ethnicity Major Stayed Output
1 1 3.65 31 26 1 1 1 1
1 1 2.74 18 17 1 1 1 0
1 1 2.62 21 20 0 1 0 0
1 1 3.71 25 21 1 1 0 1
1 0 2.78 17 21 1 1 0 0
1 1 3.13 31 20 1 1 0 1
1 1 3.01 20 18 0 1 1 1
1 1 3.01 28 29 1 1 1 1
1 1 3.63 32 30 1 1 1 1
1 1 3.46 26 28 1 1 1 1
0 1 3.22 19 8 0 1 1 1
0 0 2.78 16 11 0 1 1 0
1 1 3.53 24 13 0 0 0 1
1 1 3.34 30 28 0 1 1 1
1 1 3.91 29 29 1 0 1 1
1 1 2.02 20 22 0 1 0 0
1 1 3.45 19 17 1 1 0 0
15
Proceedings of the 2013 Midwest Section Conference of the American Society for Engineering Education
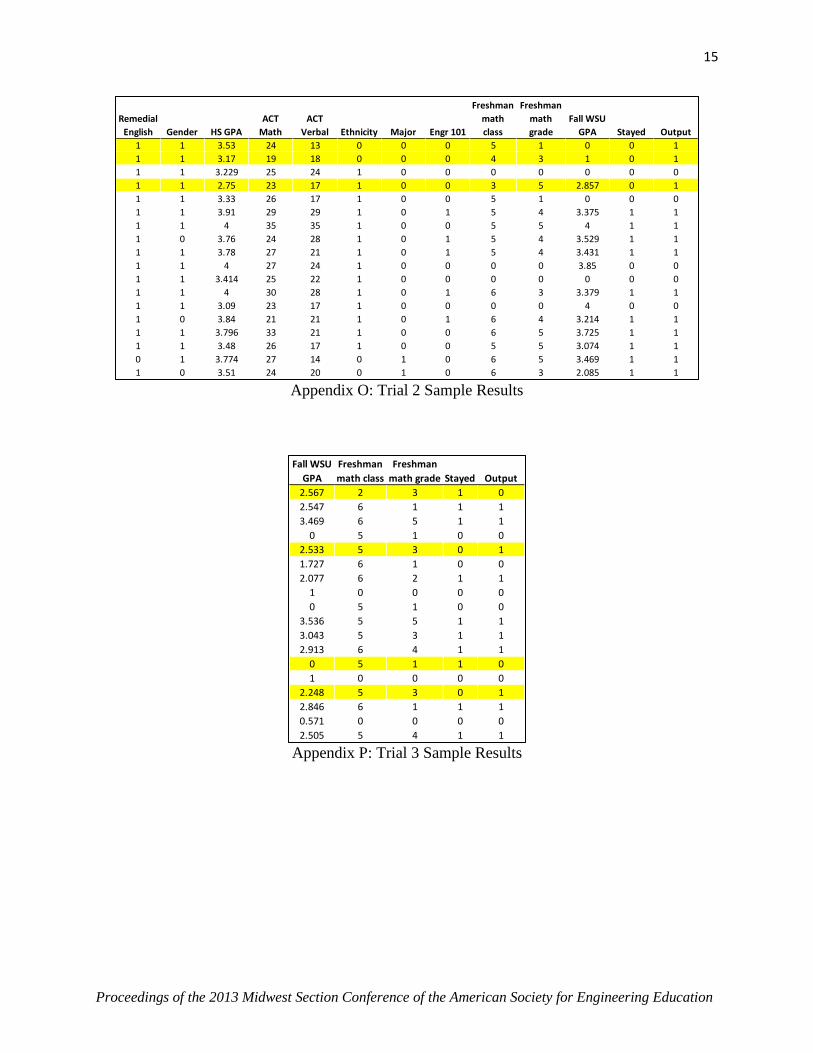
Appendix O: Trial 2 Sample Results
Appendix P: Trial 3 Sample Results
Remedial
English Gender HS GPA
ACT
Math
ACT
Verbal Ethnicity Major Engr 101
Freshman
math
class
Freshman
math
grade
Fall WSU
GPA Stayed Output
1 1 3.53 24 13 0 0 0 5 1 0 0 1
1 1 3.17 19 18 0 0 0 4 3 1 0 1
1 1 3.229 25 24 1 0 0 0 0 0 0 0
1 1 2.75 23 17 1 0 0 3 5 2.857 0 1
1 1 3.33 26 17 1 0 0 5 1 0 0 0
1 1 3.91 29 29 1 0 1 5 4 3.375 1 1
1 1 4 35 35 1 0 0 5 5 4 1 1
1 0 3.76 24 28 1 0 1 5 4 3.529 1 1
1 1 3.78 27 21 1 0 1 5 4 3.431 1 1
1 1 4 27 24 1 0 0 0 0 3.85 0 0
1 1 3.414 25 22 1 0 0 0 0 0 0 0
1 1 4 30 28 1 0 1 6 3 3.379 1 1
1 1 3.09 23 17 1 0 0 0 0 4 0 0
1 0 3.84 21 21 1 0 1 6 4 3.214 1 1
1 1 3.796 33 21 1 0 0 6 5 3.725 1 1
1 1 3.48 26 17 1 0 0 5 5 3.074 1 1
0 1 3.774 27 14 0 1 0 6 5 3.469 1 1
1 0 3.51 24 20 0 1 0 6 3 2.085 1 1
Fall WSU
GPA
Freshman
math class
Freshman
math grade Stayed Output
2.567 2 3 1 0
2.547 6 1 1 1
3.469 6 5 1 1
0 5 1 0 0
2.533 5 3 0 1
1.727 6 1 0 0
2.077 6 2 1 1
1 0 0 0 0
0 5 1 0 0
3.536 5 5 1 1
3.043 5 3 1 1
2.913 6 4 1 1
0 5 1 1 0
1 0 0 0 0
2.248 5 3 0 1
2.846 6 1 1 1
0.571 0 0 0 0
2.505 5 4 1 1