
USDA - USGS · USDA Sutter and Colusa Counties ... –GIS Ready, No additional ... Automated Crop...
65
USDA Sutter and Colusa Counties 2014 NAIP Acquired July 2014 Glenn R. Bethel USDA Remote Sensing Advisor May 5, 2015
Transcript of USDA - USGS · USDA Sutter and Colusa Counties ... –GIS Ready, No additional ... Automated Crop...

USDA
Sutter and Colusa Counties 2014 NAIP Acquired July 2014
Glenn R. Bethel USDA Remote Sensing Advisor
May 5, 2015

11 USDA Agencies 28,000 ArcGIS users
11 + USDA Agencies use imagery

Afternoon Orbit A-Train
AVHRR
MODIS spatial resolution: 250m, 500m, 1000m
10 – 20 km swath spatial resolution: .5 - 1m
Commercial High Resolution Systems
spatial resolution: 1100m
2300 km swath
2700 km swath
USDA Vegetation Monitoring Satellites
2250 km swath
Proba-V
spatial resolution: 100 to 350 m
Spot 5/6 spatial resolution: 5m, 20m 60 km swath
Landsat spatial resolution: 15m, 30m
Relative Ground Swath
DMC-2, Deimos-1
spatial resolution: 22 m
183 km swath
VIIRS
3000 km swath spatial resolution: 375m, 750m
600 km swath
Morning Orbit
AWiFS spatial resolution: 56 m
737 km swath
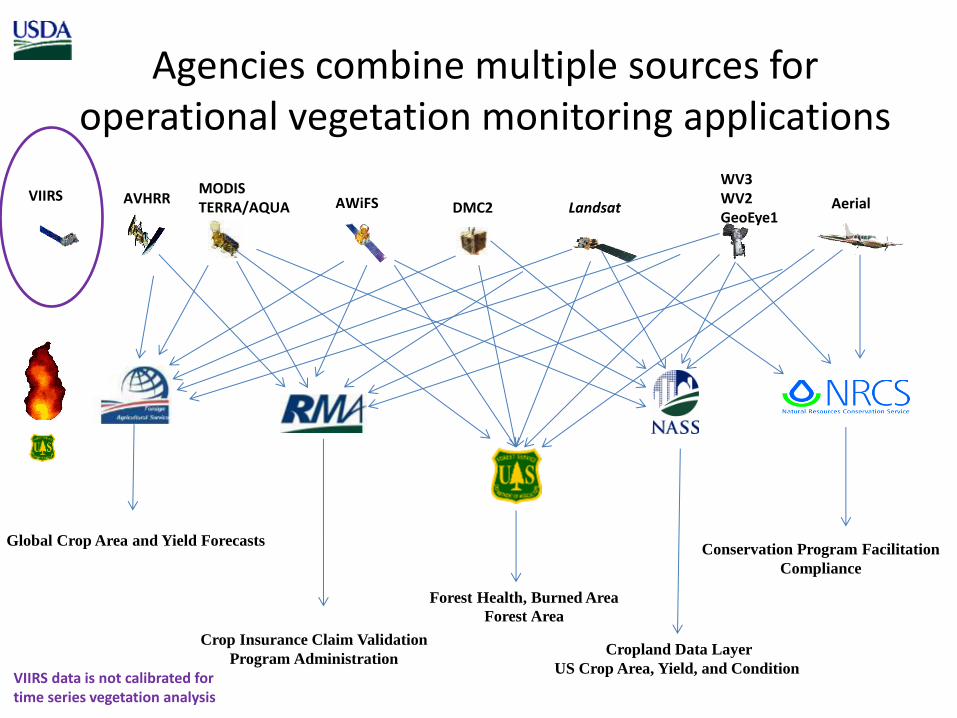
Agencies combine multiple sources for operational vegetation monitoring applications
AVHRR AWiFS Landsat MODIS TERRA/AQUA
WV3 WV2 GeoEye1
DMC2 Aerial VIIRS
Global Crop Area and Yield Forecasts
Crop Insurance Claim Validation
Program Administration
Cropland Data Layer
US Crop Area, Yield, and Condition
Conservation Program Facilitation
Compliance
Forest Health, Burned Area
Forest Area
VIIRS data is not calibrated for time series vegetation analysis
Overarching Needs for Operational Use • Redundant and Reliable Data Streams
– Since users can not depend on any satellite being in operation next month, multiple satellite sensors are processed. (GOES, MODIS, Landsat, AVHRR…) • We are using these satellites to create operational products for operational needs.
– Agencies use foreign and commercial satellites to augment the US earth observation portfolio
• Timely – Minimize the time from acquisition to fully processed. – One hour to maximum of 72 hours.
• Time Series – Imagery Day to day, … Month to Month Year to Year, current conditions
related to analog year – Image derived products (NDVI)
• Imagery Ready to Use – Calibrated / Cross Calibrated between sensors
• VIIRS time series is not calibrated. NASA will start calibration soon.
– GIS Ready, No additional processing required – Ortho-Corrected for pixel level change detection

2008 – 2014 National Cropland Data Layers
Note: 7 years of national annual coverage
2014 CDL released February 5, 2015
National Agricultural Statistics Service

Multi Source Time Series Imagery for Growing Season(s)
Landsat-8 OLI and TIRS DMC Deimos-1 and UK-2
Field level Crop Reporting Ancillary Data
Elevation, Imperiousness, Forest Canopy, NLCD …
MODIS NDVI
Cropland Data Layers
http://nassgeodata.gmu.edu/CropScape/
One Chance Every 16 Days One or more Every 15 Days Two Chances Every Day
Processing
Need more than one observation every 16 days to map ag.

8
4 1
1
1 1
2
4
2
2
1
3
4
3
4
4
2
4
3
3
4
4
3
5 1
1
2
4
3 2
3 4
1
1
1 1
2
1
1
1
1
1
CDL 2014 Production: Each State Classified 1-5 times per year
# of CDLs scheduled
2
2

April
May
June
July
August with farm
data
Final CDL
Need multi-temporal for accurate classifications
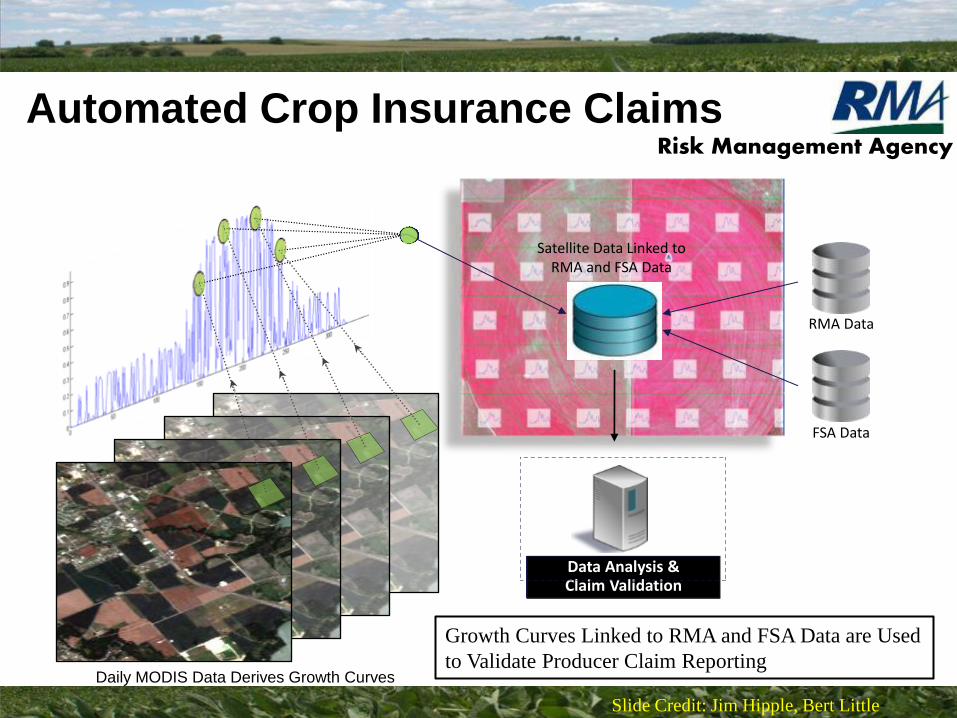
Automated Crop Insurance Claims
Data Analysis & Claim Validation
RMA Data
FSA Data
Satellite Data Linked to RMA and FSA Data
Growth Curves Linked to RMA and FSA Data are Used
to Validate Producer Claim Reporting Daily MODIS Data Derives Growth Curves
Slide Credit: Jim Hipple, Bert Little
Risk Management Agency

• Field/Pixel Level Annual Growth Curve and Weather Data Graph
• Only Available for Large Fields with Multiple MODIS Grid Cells
• Weather Data and Growth Curve Aggregated to Field Level • NDVI, TMAX, TMIN, Daily Precipitation, Max Radar Reflectivity, and RMA Dates
Growth Curve & Weather Data
Slide Credit: Jim Hipple, Bert Little

RMA and NASS are downloading all CONUS Landsat
• Processing
– Crop Type
– Indicators of crop type, area, yield, and production
• Need Time series with many observations over growing season
– One Landsat (16-day repeat) can result in long periods without observations due to clouds
• Need Continuity and spectral improvements

Operational use of Multiple Sources of
Time Series Remotely Sensed Data for
Global Agriculture Monitoring
By the USDA Foreign Agricultural
Service
Mission: To produce the most objective and accurate
assessment of global agricultural production and
conditions affecting food security in the world.
Agricultural Service
Foreign

Price
Discovery
Food Supply Information for Price Discovery Creation of the Official USDA Numbers for Global Commodities
U.S. Crop
Production
(NASS)
Foreign
Crop
Production
(FAS)
SUPPLY
Monthly Reports
Interagency
Commodity
Estimates
Committees
World Agricultural
Supply and Demand
Estimates
(WASDE)
U.S. Demand
(ERS,FSA,
AMS)
Foreign
Demand
(FAS, ERS)
DEMAND
“Lock-up” Remote Sensing inputs to Global Supply Numbers
Commodity Markets

May 14, 2015
USDA/FAS/OGA
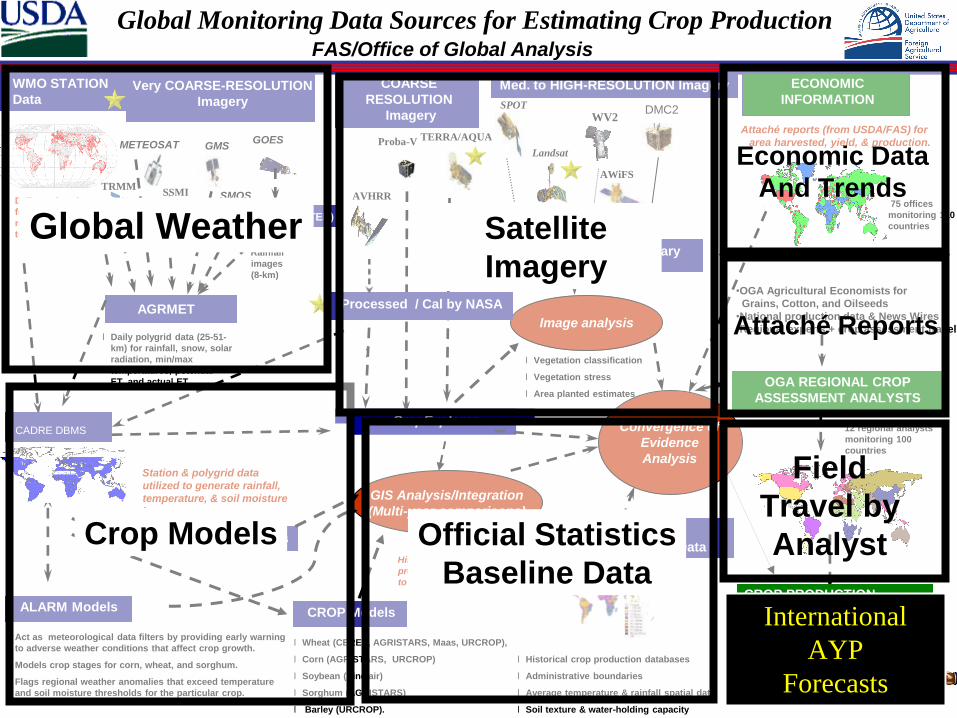
FAS Data Sources &
Strategic Intelligence from Satellites •FAS Field Travel
•Official Country Reports
•News Wire Services
•FAS Attaché Reports
(http://www.fas.usda.gov/)
•Weather Data (stations & satellites)
•Crop models (stations & satellites)
•Vegetation Data (satellites)
•Coarse-resolution & temporal coverage
NOAA-AVHRR (8-km)
SPOT-VEG (1-km)
MODIS (250-meters)
Medium-resolution satellites
Landsat-8 (30-meters)
High resolution satellites
WV2, WV3, Geoeye1…. Limited use
Crop Production Estimates Released Each Month •World Agricultural Supply & Demand Estimates (WASDE)
•World Agricultural Production (WAP) Circular
•Production & Supply Database (PSD Online)
12 Regional Analysts
GIS Analysis/Integration
(Multi-year comparisons)
l Daily polygrid data (25-51-
km) for rainfall, snow, solar
radiation, min/max
temperatures, potential
ET, and actual ET
AGRMET
FAS/Office of Global Analysis
Very COARSE-RESOLUTION
Imagery
OGA REGIONAL CROP
ASSESSMENT ANALYSTS
BASELINE
REFERENCE Data
l Historical crop production databases
l Administrative boundaries
l Average temperature & rainfall spatial data
l Soil texture & water-holding capacity
CROP PRODUCTION
ESTIMATES
l Production estimates
l “Lockup” with USDA’s World Outlook
Board
l USDA official production estimates
released on the second week of each
month
l Daily station data
for rainfall, &
min/max
temperatures
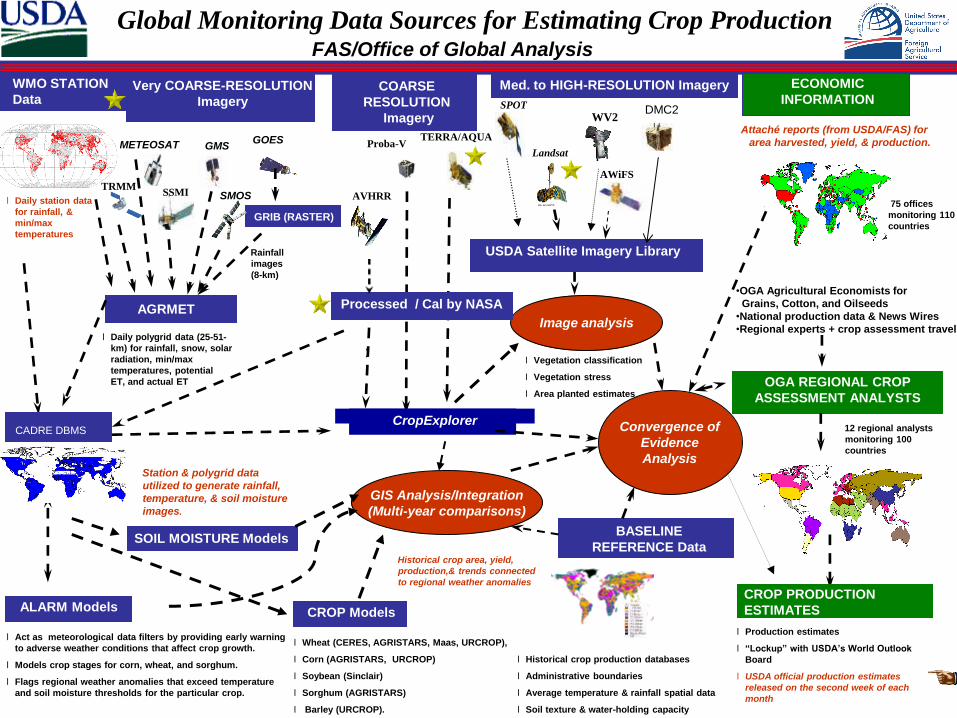
USDA Satellite Imagery Library
l Vegetation classification
l Vegetation stress
l Area planted estimates
Historical crop area, yield,
production,& trends connected
to regional weather anomalies
WMO STATION
Data
75 offices
monitoring 110
countries
Attaché reports (from USDA/FAS) for
area harvested, yield, & production.
ECONOMIC
INFORMATION
12 regional analysts
monitoring 100
countries
AVHRR
GOES METEOSAT
Global Monitoring Data Sources for Estimating Crop Production
Station & polygrid data
utilized to generate rainfall,
temperature, & soil moisture
images.
Med. to HIGH-RESOLUTION Imagery
GRIB (RASTER)
Convergence of
Evidence
Analysis
CropExplorer
Image analysis
CROP Models
l Wheat (CERES, AGRISTARS, Maas, URCROP),
l Corn (AGRISTARS, URCROP)
l Soybean (Sinclair)
l Sorghum (AGRISTARS)
l Barley (URCROP).
ALARM Models
l Act as meteorological data filters by providing early warning
to adverse weather conditions that affect crop growth.
l Models crop stages for corn, wheat, and sorghum.
l Flags regional weather anomalies that exceed temperature
and soil moisture thresholds for the particular crop.
SOIL MOISTURE Models
COARSE
RESOLUTION
Imagery
)
Rainfall
images
(8-km)
AWiFS
GMS Landsat
SPOT
TERRA/AQUA Proba-V
SSMI
•OGA Agricultural Economists for
Grains, Cotton, and Oilseeds
•National production data & News Wires
•Regional experts + crop assessment travel
WV2 DMC2
Processed / Cal by NASA
CADRE DBMS
TRMM SMOS
GIS Analysis/Integration
(Multi-year comparisons)
l Daily polygrid data (25-51-
km) for rainfall, snow, solar
radiation, min/max
temperatures, potential
ET, and actual ET
AGRMET
FAS/Office of Global Analysis
Very COARSE-RESOLUTION
Imagery
OGA REGIONAL CROP
ASSESSMENT ANALYSTS
BASELINE
REFERENCE Data
l Historical crop production databases
l Administrative boundaries
l Average temperature & rainfall spatial data
l Soil texture & water-holding capacity
CROP PRODUCTION
ESTIMATES
l Production estimates
l “Lockup” with USDA’s World Outlook
Board
l USDA official production estimates
released on the second week of each
month
l Daily station data
for rainfall, &
min/max
temperatures
USDA Satellite Imagery Library
l Vegetation classification
l Vegetation stress
l Area planted estimates
Historical crop area, yield,
production,& trends connected
to regional weather anomalies
WMO STATION
Data
75 offices
monitoring 110
countries
Attaché reports (from USDA/FAS) for
area harvested, yield, & production.
ECONOMIC
INFORMATION
12 regional analysts
monitoring 100
countries
AVHRR
GOES METEOSAT
Global Monitoring Data Sources for Estimating Crop Production
Station & polygrid data
utilized to generate rainfall,
temperature, & soil moisture
images.
Med. to HIGH-RESOLUTION Imagery
GRIB (RASTER)
Convergence of
Evidence
Analysis
CropExplorer
Image analysis
CROP Models
l Wheat (CERES, AGRISTARS, Maas, URCROP),
l Corn (AGRISTARS, URCROP)
l Soybean (Sinclair)
l Sorghum (AGRISTARS)
l Barley (URCROP).
ALARM Models
l Act as meteorological data filters by providing early warning
to adverse weather conditions that affect crop growth.
l Models crop stages for corn, wheat, and sorghum.
l Flags regional weather anomalies that exceed temperature
and soil moisture thresholds for the particular crop.
SOIL MOISTURE Models
COARSE
RESOLUTION
Imagery
)
Rainfall
images
(8-km)
AWiFS
GMS Landsat
SPOT
TERRA/AQUA Proba-V
SSMI
•OGA Agricultural Economists for
Grains, Cotton, and Oilseeds
•National production data & News Wires
•Regional experts + crop assessment travel
WV2 DMC2
Processed / Cal by NASA
CADRE DBMS
TRMM SMOS
Global Weather
Crop Models
Satellite
Imagery
Official Statistics
Baseline Data
Economic Data
And Trends
Attaché Reports
Field
Travel by
Analyst
International
AYP
Forecasts

IMAGERY (OPERATIONAL: RELIES ON MULTIPLE SOURCES)
Imagery is obtained from Multiple Sensors, Space Agencies, and Private
Sector.
NASA
NOAA
USGS
ESA
ISRO
JAXA
CNES
AIRBUS Defense & Space
DMC: UK Space, Elecnor
DigitalGlobe via NGA
Ideally, all imagery processed before analysis:
GIS Ready (Ready to be incorporated into analysis)
• Ortho Rectified
• Calibrated / Cross Calibrated
Low Latency
• 4-6 hours Ideal
• 1 – 3 days acceptable with More than 5 days, Not Acceptable
May 14, 2015
USDA/FAS/OGA

USDA/FAS/OGA
Global Agriculture Monitoring (GLAM)
Basic Core Components
(Area * Yield = Production)
Crop Area (16-days overpass)
Landsat (30-m)
DMC (22-m)
AWiFS (56-m)
Specific Crop Area Estimates
Crop Yield (daily AM/PM overpass)
MODIS-NDVI (250-m)
(2000-present)
Relative Yield Estimates

Foreign Agricultural Service Office of Global Analysis
IPA Division
Thailand: Difference in Sown Dry Season Rice Area (2014 vs 2015)
Modis NDVI (10-year Anomaly)
Modis NDVI (10-year Anomaly) Modis Difference (2014 – 2015)
Jan 16, 2014 Jan 16, 2015
Rice landcover was created from 30m Landsat from 2010 MODIS NDVI Anomaly alerts the analyst to problem areas. The government of Thailand restricted irrigation supplies to farmers resulting in the decline in cultivated rice area and production.
Slide Credit: Michael Shean USDA/FAS

Foreign Agricultural Service Office of Global Analysis IPA Division
Source: USGS EarthExplorer; Landsat 8
Feb 5, 2015 Feb 2, 2014
Thailand: North Central Plains Region - Chainat Province Landsat Imagery Comparison FAS used Landsat Imagery to quantify unplanted rice area.
http://pecad.fas.usda.gov/highlights/2015/02/Thailand/index.htm
Slide Credit: Michael Shean USDA/FAS

Crop Explorer Public Interface to time series weather and vegetation condition data sets
over major crop regions, Updates every 1 to 10-days
Maps and time-series charts for:
● Weather Data (AWFA, WMO, CMORPH, MPA, and NEXRAD)
• Dekadal (10-day) precipitation & temperatures compared to climate normals
● Soil Moisture & Crop Models
• Modified Palmer two-layer soil moisture
• Behind firewall: Crop calendars for wheat, corn, & sorghum and corn hazard/alarm model.
● Vegetation Indices (polar-orbiting satellites)
• GAC (8-km) (behind firewall)
• SPOT-VEG (1-km)
• MODIS (250-m)
• Daily MODIS
• Aqua and Terra (250-m)
• Lake/Reservoir Heights
• TOPOX/Poseidon,Jason-1, Jason-2
• GFO
• ERS, ENVISAT
USDA/FAS/OGA

MODIS provides rapid views of agricultural regions.
• Two satellites (aqua & terra); three resolutions (250m, 500m, & 1,000m); two formats (jpg & geoTiff); three band combinations (true color; 7,2,1; and NDVI).
• GIS Ready Images are available ~ six hours after acquisition.
• http://www.pecad.fas.usda.gov/cropexplorer/modis_summary/
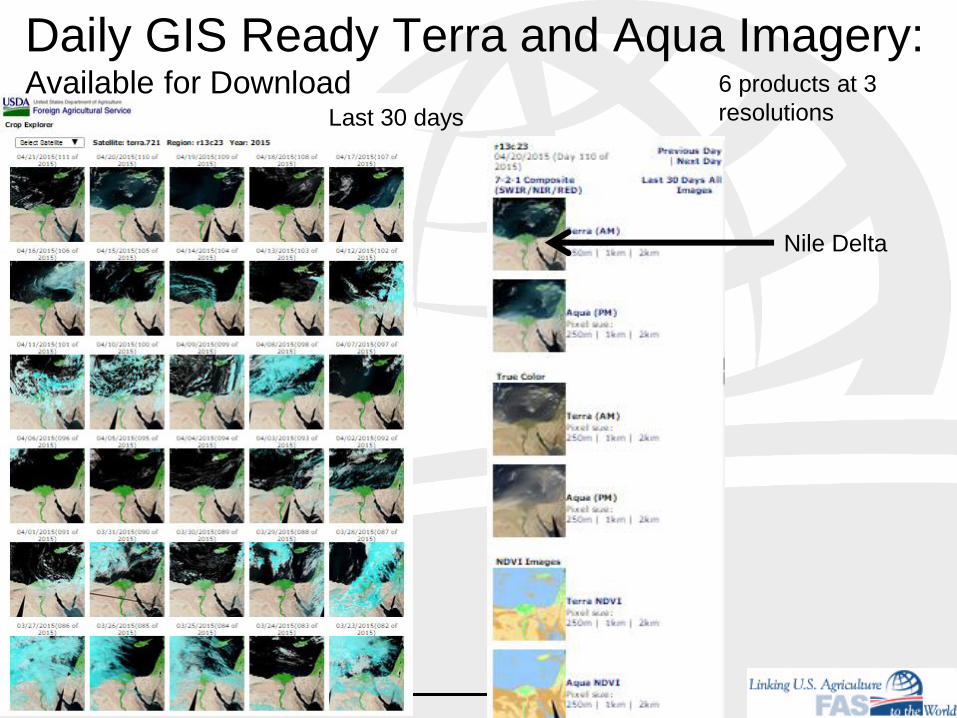
Daily GIS Ready Terra and Aqua Imagery: Available for Download
Last 30 days
6 products at 3
resolutions
Nile Delta

Download: True Color, 7-2-1, or NDVI Terra or Aqua
Terra 3/24/2015 250 meters, 1km and 2km
04/07/2015
Size of Landsat Image
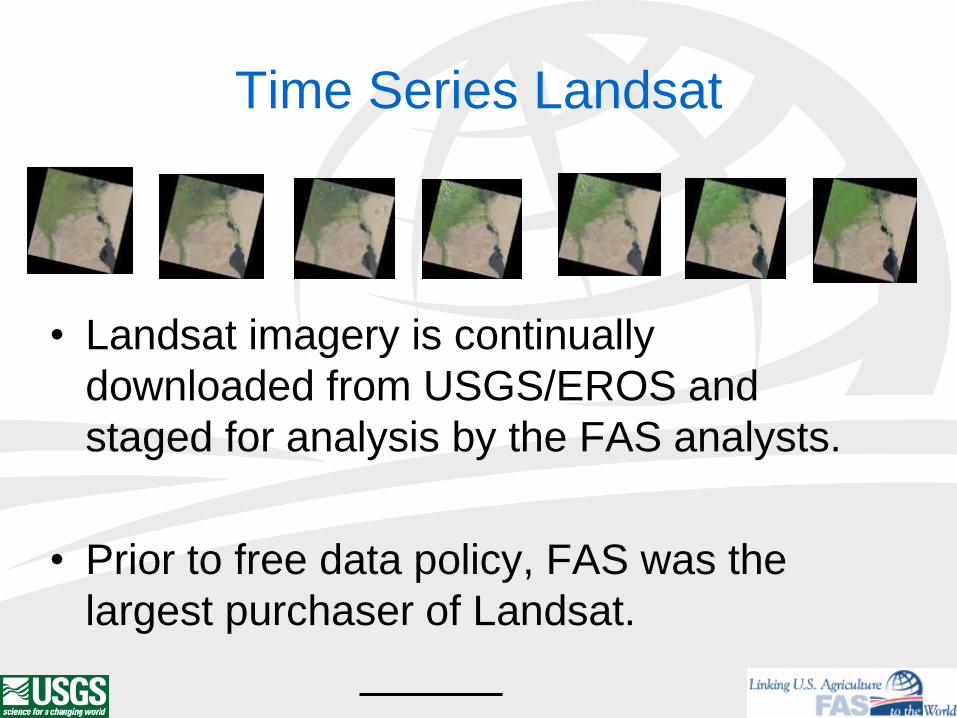
Time Series Landsat
• Landsat imagery is continually
downloaded from USGS/EROS and
staged for analysis by the FAS analysts.
• Prior to free data policy, FAS was the
largest purchaser of Landsat.

Time Series Landsat Path / Rows
downloaded from USGS
May 14, 2015
USDA/FAS/OGA
GDA calibrates Landsat imagery to the surface reflectance,
prepares it for mosaicking and on-line, real time analysis, masking,
times series drilling, mapping, and download.
JACIE Session #5 (B)

Bayji, Iraq
Landsat 8, April 18, 2015
May 14, 2015
USDA/FAS/OGA

Using MODIS Time Series for Context Landsat Image
April 10 April 14 April 17 April 18
April 29 April 26
April 19 April 20 April 23 April 24
May 3 May 1

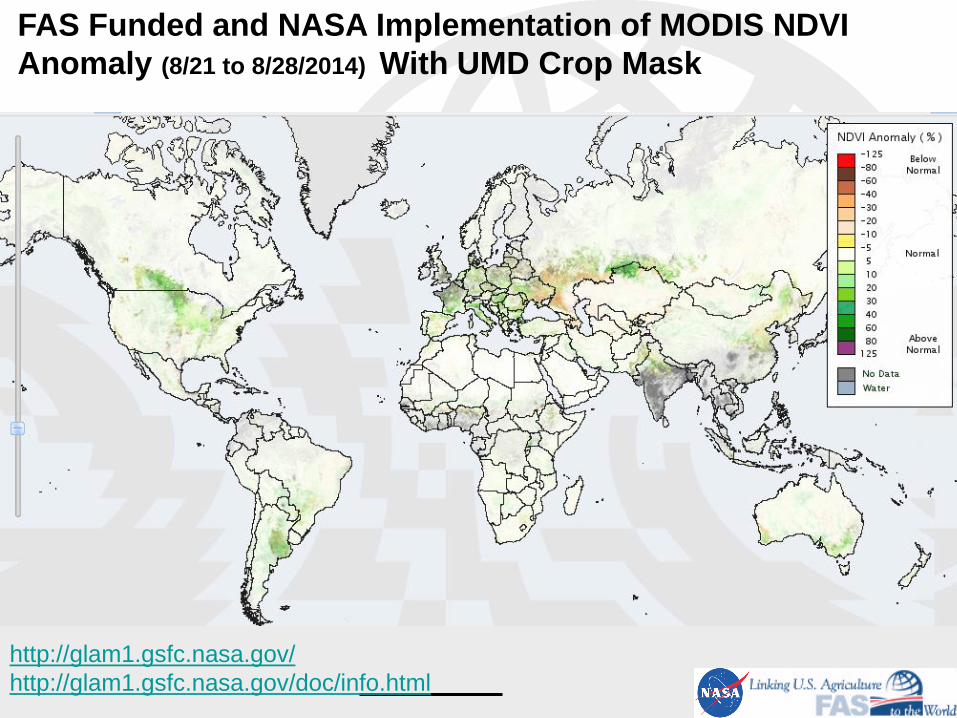
http://glam1.gsfc.nasa.gov/
http://glam1.gsfc.nasa.gov/doc/info.html
FAS Funded and NASA Implementation of MODIS NDVI
Anomaly (8/21 to 8/28/2014) Updated Every 8 days.
http://glam1.gsfc.nasa.gov/
http://glam1.gsfc.nasa.gov/doc/info.html
FAS Funded and NASA Implementation of MODIS NDVI
Anomaly (8/21 to 8/28/2014) With UMD Crop Mask

May 14, 2015
USDA/FAS/OGA
Time series NDVI analysis:
• Compare current year to
2003-2011 mean and
analog years.
• Apply mask to limit analysis
to crops
Fresno, CA
How do current conditions relate to Normal?
http://glam1.gsfc.nasa.gov/

planting establishment harvest
United States Department of Agriculture Foreign Agricultural Service Office of Global Analysis
IRAQ 15/16 Winter Grains Vegetation Index
Slide Credit: Dr. Bill Baker, USDA/FAS

National Agriculture Imagery Program
• Leaf-on 1 meter or ½ meter orthoimagery program
• 4 bands
• NAIP is a key geospatial investment
– FSA farm based information and Compliance

NAIP Contract History
35
$0
$5,000,000
$10,000,000
$15,000,000
$20,000,000
$25,000,000
$30,000,000
$35,000,000
2003 2004 2005 2006 2007 2008 2009 2010 2011 2012 2013
$9.5M
$20.1M
$23.8M
$29.0M
$9.0M
$14.3M
$29.9M $30.2M
$16.5M $16.7M
$14.5M
PARTNER
FSA
3-year IDIQ 5-year IDIQ current
Funding: From $9 Million to $30.2 Million

25 States
$15,214,000

2015 Contract
25 states, 31 flying seasons

½ Meter Acquisition for Wyoming • Funds for ½ meter buy up included a
consortium of BLM, FS, and 15 of the 23 county governments.
• Half Meter Product Specifications
– Ground sample distance: 0.5 meter
– Acquisition pixel resolution: 0.3-0.55 meter
– Horizontal accuracy: 6-meter to ground
– Image formats: DOQQ GeoTIFF and Compressed County Mosaic (CCM) MrSID Generation 3
– Compression ratio for CCM: 60:1 (1-m NAIP has a 15:1 ratio)
Quality Tradeoffs with Timely Delivery
• The Early Access Web Services (EAWS) are Esri® Restful 4 band image service which contains pre- production NAIP imagery.
• Each of the three contactors will create services for the states that they are acquiring. – https://naip.nwgeo.com/arcgis/services
– https://eaws.photoscience.com/arcgis/services
– https://gissvr.surdex.net/arcgis/services

Early Access Web Services (EAWS) Horizontal Accuracy
• The stated horizontal accuracy of the EAWS imagery is 10 meters to true ground.
• In most instances, the imagery is accurate to within a few meters of true ground.
• Horizontal accuracy needs should be strongly considered before proceeding to work with the EAWS.
• The EAWS is available within 5 days after the start of each state’s NAIP acquisition season.

EAWS Color Quality
The color quality specifications for EAWS imagery are not the same as production NAIP. • Color processing of EAWS imagery is minimal to speed up posting
to web services. • The imagery is a true representation of ground and atmospheric
conditions at the time of collection. • Production level NAIP has been color corrected and tonally
balanced.

Horizontal Accuracy
– The stated horizontal accuracy of the EAWS imagery is 10 meters to true ground for minimally preprocessed orthoimagery.
– In most instances, the imagery is accurate to within a few meters of true ground.
– Depending upon the use case, horizontal accuracy needs should be considered before proceeding on work using EAWS.
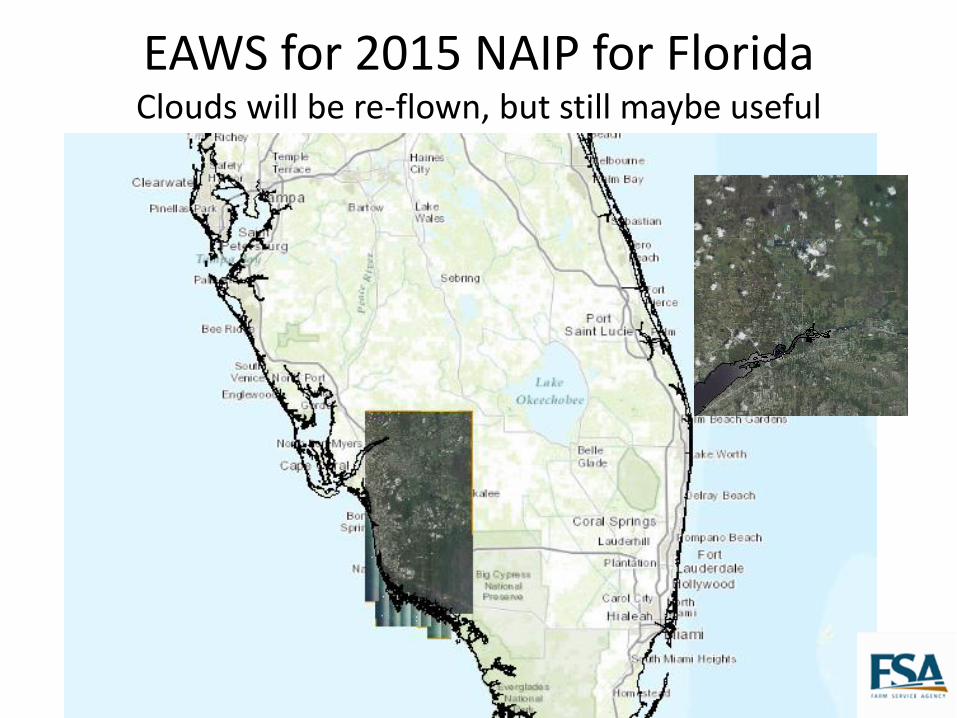
EAWS for 2015 NAIP for Florida Clouds will be re-flown, but still maybe useful
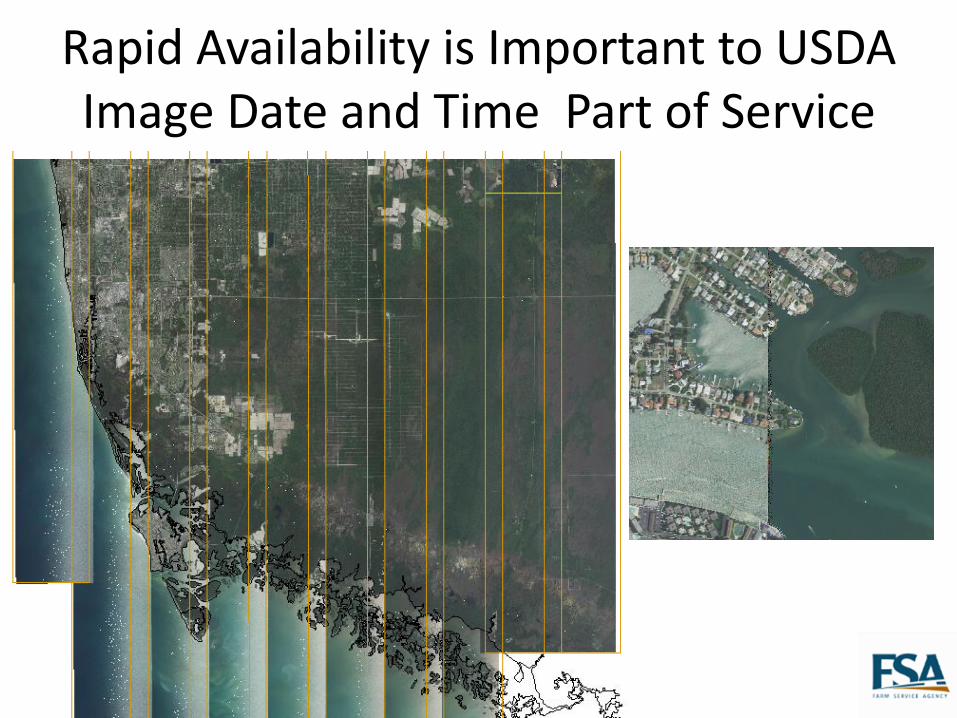
Rapid Availability is Important to USDA Image Date and Time Part of Service
National Resources Inventory
A statistical survey of land use and
natural resource conditions and
trends on U.S. non-Federal lands.
http://www.nrcs.usda.gov/wps/portal/nrcs/main/national/technical/nr
a/nri/

71,183 Points to be flown in 2015 (Annual Environmental Assessment
Program)

NRCS continues to acquire aerial film for the National Resources Inventory and Stewardship Lands Monitoring Film is about 60% of the cost of digital for these programs. Film is scanned for analysis. 9” x 9” GSD ~ 1 foot NRI Photo 2015, Film Negatives 2015 Maybe last year that film is available

15,421 Easements to be Flown in 2015 ( Annual Compliance
Program)

Purpose: Acquire base imagery for Hawaii and US Territories in the Pacific Basin
1 meter or better
Aerial (4-band, WV2 / Digital Globe, Pléiades / Airbus)
Enterprise Premium License:
Allows for non-commercial use
Use in Public Web Mapping Services
Partnership: USDA-NRCS, USDA FS, and NOAA
NRCS has taken the lead to create image bases for Pacific Basin
Alamagan, CNMI 2012
DG-WV2
Anatahan, CNMI 2012
DG-WV2
Guguan, CNMI
2013
DG-WV2
Farallon de Medinilla, CNMI
2011
DG-WV2
Agrijan,
CNMI 2013
DG-WV2
Guam 2013
High Resolution
Aerial and High
Resolution
Satellite/Astrium-
Pleiades
Namorik Atoll, Marshall Islands
World Heritage Site
2012, DG-WV2

Agencies combine multiple sources for operational vegetation monitoring applications
AVHRR AWiFS Landsat MODIS TERRA/AQUA
WV3 WV2 GeoEye1
DMC2 Aerial VIIRS
Global Crop Area and Yield Forecasts
Crop Insurance Claim Validation
Program Administration
Cropland Data Layer
US Crop Area, Yield, and Condition
Conservation Program Facilitation
Compliance
Forest Health, Burned Area
Forest Area
VIIRS data is not calibrated for time series vegetation analysis
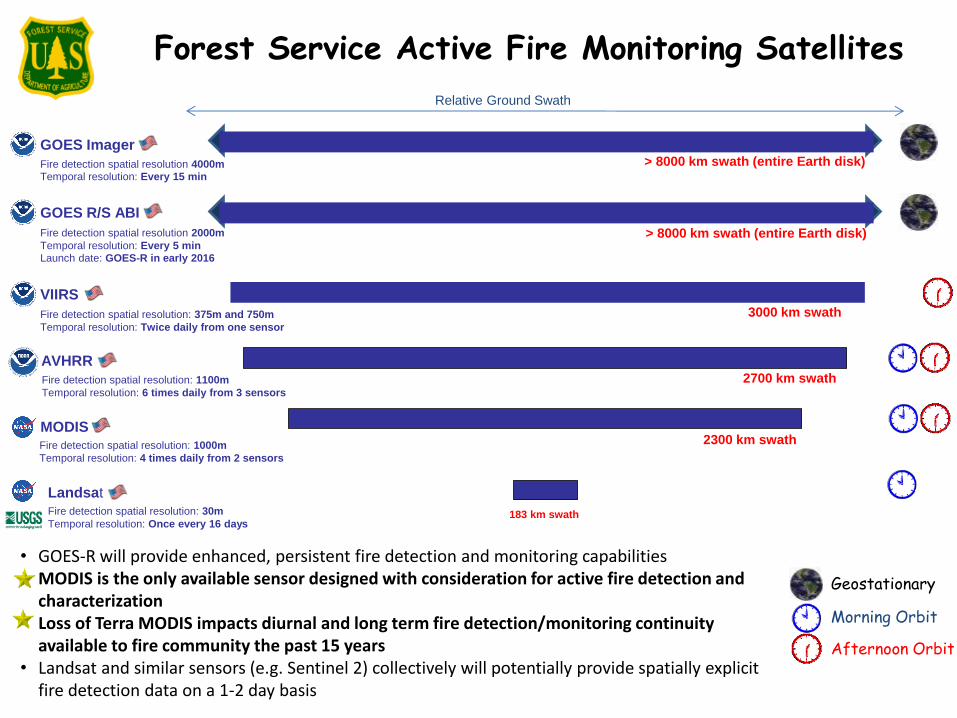
Forest Service Active Fire Monitoring Satellites
Relative Ground Swath
AVHRR
Fire detection spatial resolution: 1100m
Temporal resolution: 6 times daily from 3 sensors
2700 km swath
Landsat Fire detection spatial resolution: 30m
Temporal resolution: Once every 16 days 183 km swath
VIIRS 3000 km swath Fire detection spatial resolution: 375m and 750m
Temporal resolution: Twice daily from one sensor
MODIS Fire detection spatial resolution: 1000m
Temporal resolution: 4 times daily from 2 sensors
2300 km swath
> 8000 km swath (entire Earth disk)
GOES Imager Fire detection spatial resolution 4000m Temporal resolution: Every 15 min
> 8000 km swath (entire Earth disk)
GOES R/S ABI
Fire detection spatial resolution 2000m
Temporal resolution: Every 5 min Launch date: GOES-R in early 2016
Afternoon Orbit
Morning Orbit
Geostationary
• GOES-R will provide enhanced, persistent fire detection and monitoring capabilities • MODIS is the only available sensor designed with consideration for active fire detection and
characterization • Loss of Terra MODIS impacts diurnal and long term fire detection/monitoring continuity
available to fire community the past 15 years • Landsat and similar sensors (e.g. Sentinel 2) collectively will potentially provide spatially explicit
fire detection data on a 1-2 day basis

F I A
April 2015
The Nation’s
Forest Census
Copyright DigitalGlobe Inc. NextView License
Nepal Earthquake

Fasidega Temple (UNESCO World Heritage Site)
Temple
Tents
Copyright DigitalGlobe Inc. NextView License


UNESCO World Heritage Dharahara Tower in Kathmandu
Animation Imagery
@Airbus Defense and Space

Imagery Acquired Post-Earthquake for Damage Assessments
Public Domain
• Landsat 8
• EO 1 - ASTER
• ISS Planet Labs
• ASTER
Licensed
• WorldView 1, 2, & 3
• SPOT
• Sentinel-1 – Products
• Pleiades
• GeoEye
• Radarsat-2
• COSMO – US government only
DigitalGlobe agreed to provide their data as public domain for a limited time for this event.

WorldView1 Acquired April 28, 2015 Large Area Collection (185 km wide)

Links and Backup Slides
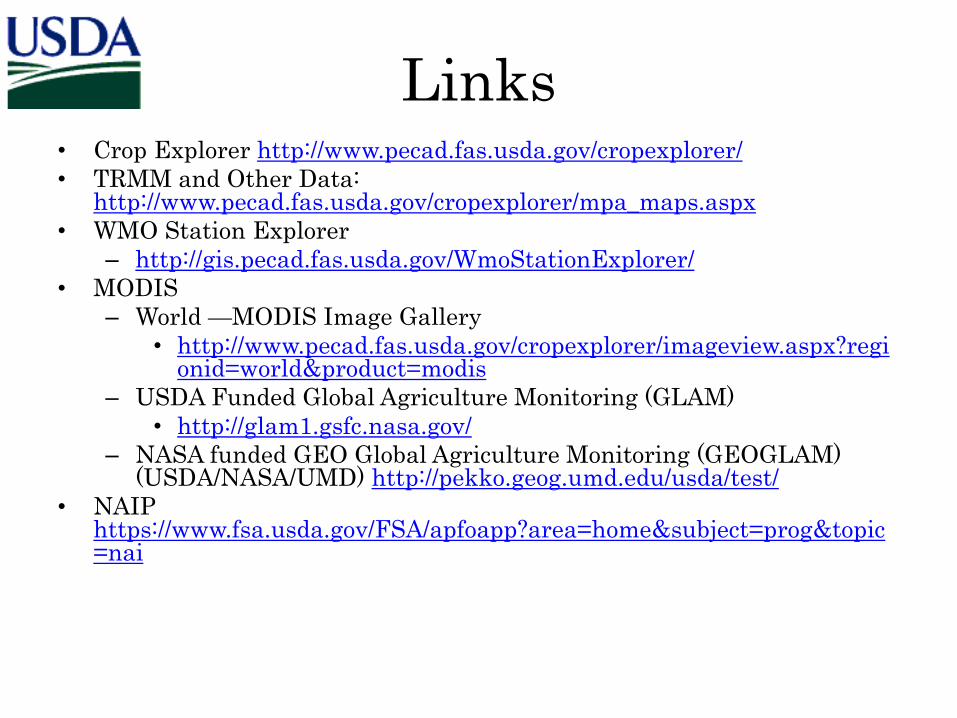
Links • Crop Explorer http://www.pecad.fas.usda.gov/cropexplorer/
• TRMM and Other Data: http://www.pecad.fas.usda.gov/cropexplorer/mpa_maps.aspx
• WMO Station Explorer
– http://gis.pecad.fas.usda.gov/WmoStationExplorer/
• MODIS
– World —MODIS Image Gallery
• http://www.pecad.fas.usda.gov/cropexplorer/imageview.aspx?regionid=world&product=modis
– USDA Funded Global Agriculture Monitoring (GLAM)
• http://glam1.gsfc.nasa.gov/
– NASA funded GEO Global Agriculture Monitoring (GEOGLAM) (USDA/NASA/UMD) http://pekko.geog.umd.edu/usda/test/
• NAIP https://www.fsa.usda.gov/FSA/apfoapp?area=home&subject=prog&topic=nai
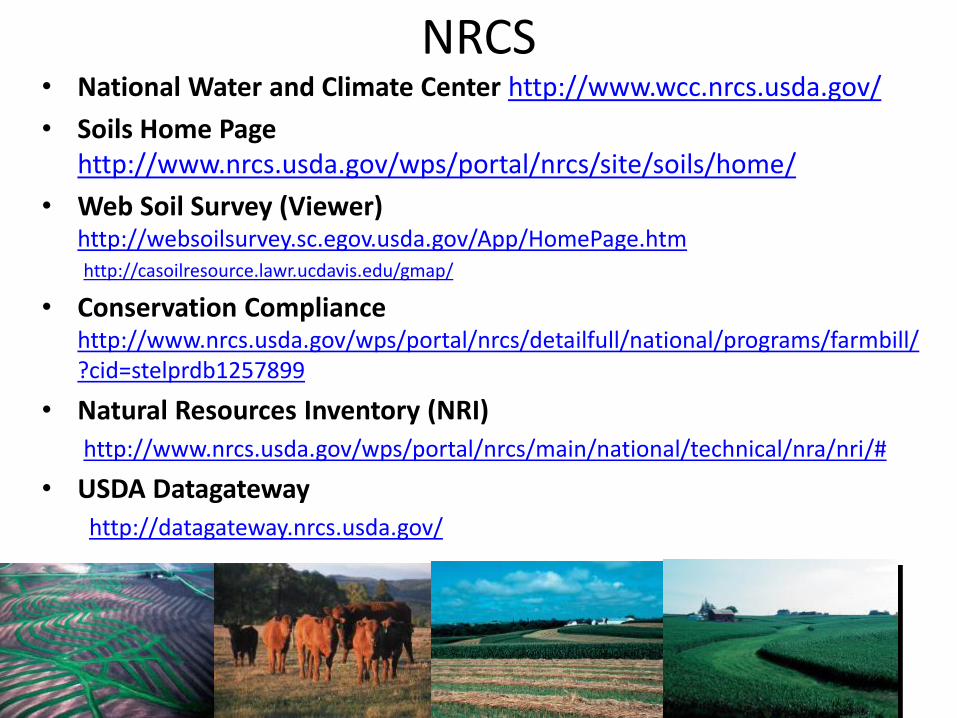
NRCS • National Water and Climate Center http://www.wcc.nrcs.usda.gov/
• Soils Home Page http://www.nrcs.usda.gov/wps/portal/nrcs/site/soils/home/
• Web Soil Survey (Viewer) http://websoilsurvey.sc.egov.usda.gov/App/HomePage.htm http://casoilresource.lawr.ucdavis.edu/gmap/
• Conservation Compliance http://www.nrcs.usda.gov/wps/portal/nrcs/detailfull/national/programs/farmbill/?cid=stelprdb1257899
• Natural Resources Inventory (NRI)
http://www.nrcs.usda.gov/wps/portal/nrcs/main/national/technical/nra/nri/#
• USDA Datagateway
http://datagateway.nrcs.usda.gov/

USDA Commodity Market Reports
World Agricultural Outlook Board (WAOB)
• WASDE: http://usda.gov/oce/commodity/wasde/
• About the WASDE: http://usda.gov/oce/commodity/wasde/prepared.htm
Foreign Agricultural Service (FAS)
• World Agricultural Production (WAP) http://www.fas.usda.gov/wap/current/
• Production, Supply, and Distribution http://apps.fas.usda.gov/psdonline/
Economic Research Service (ERS)
• Outlook: http://www.ers.usda.gov/topics/farm-economy/commodity-outlook/usda-outlook-process
• Weekly Weather and Crop Bulletin http://usda.mannlib.cornell.edu/MannUsda/viewDocumentInfo.do?documentID=1186
NASS
• Crop Progress http://usda.mannlib.cornell.edu/MannUsda/viewDocumentInfo.do?documentID=1048

Forest Service
• Forest Inventory and Analysis (FIA) Program
– http://www.fia.fs.fed.us/
• ForWarn (Forest Health Viewer) – http://forwarn.forestthreats.org/
• Active Fire Mapping – http://activefiremaps.fs.fed.us/
• Burned Area Emergency Response (BAER)
– http://www.fs.fed.us/eng/rsac/baer/
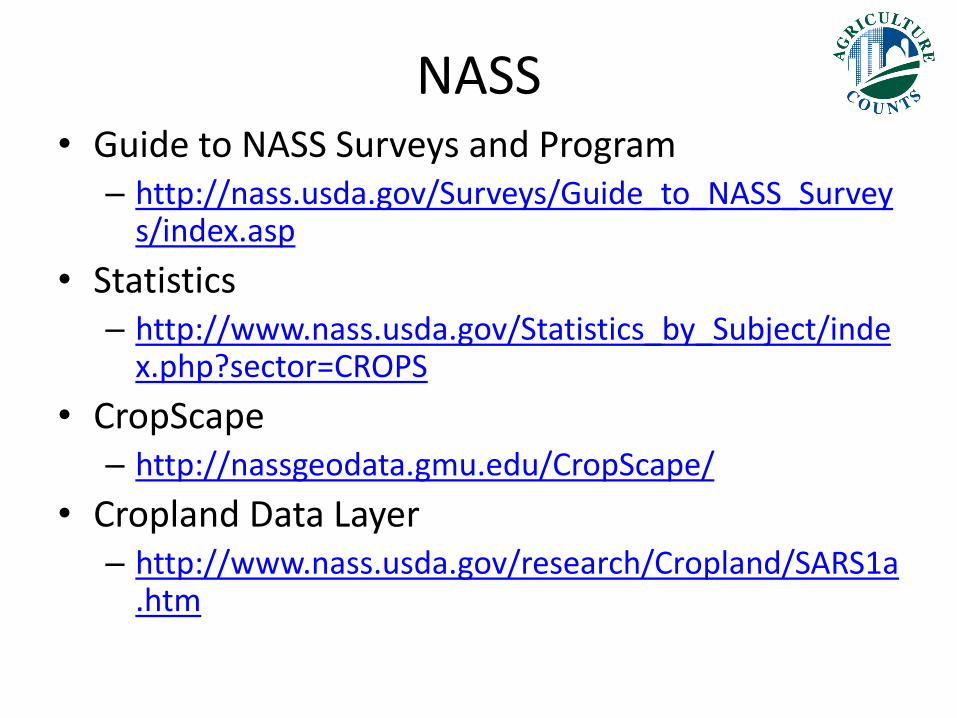
NASS • Guide to NASS Surveys and Program
– http://nass.usda.gov/Surveys/Guide_to_NASS_Surveys/index.asp
• Statistics – http://www.nass.usda.gov/Statistics_by_Subject/inde
x.php?sector=CROPS
• CropScape – http://nassgeodata.gmu.edu/CropScape/
• Cropland Data Layer – http://www.nass.usda.gov/research/Cropland/SARS1a
.htm

Backup