USAID Office of Food for Peace Dale Skoric Title II Food Aid Programming
33
USAID Office of Food for Peace Dale Skoric Title II Food Aid Programming
description
USAID Office of Food for Peace Dale Skoric Title II Food Aid Programming. The Big Picture. - PowerPoint PPT Presentation
Transcript of USAID Office of Food for Peace Dale Skoric Title II Food Aid Programming

USAID Office of Food for Peace
Dale Skoric
Title II Food Aid Programming

The Big Picture
• Food crisis: With over 1 billion people worldwide (one-sixth of the world population) suffering from hunger, over 30 cases of food-related unrest having erupted around the world since 2008, 25,000 children dying daily from malnutrition, 2 billion people currently suffering from micro-nutrient deficiencies, local food prices in most developing countries being too expensive for hundreds of millions of people, disputes over depleting land resources, the food crisis will continue to threaten lives and livelihoods worldwide.
• Urbanization: With an urban population that will double in Asia and increase by 150% in Africa between now and 2050, urbanization will create massive social inequities and risks as well as tangible health problems, malnutrition rates, unemployment, and income deficits, which represent an almost permanent threat to the security of billions.
• Due to population growth alone, the absolute number of people at risk in emergencies is projected to increase. These challenges will call for the humanitarian system to help more people in more places (but, most likely, with fewer resources given the financial shortfall).

The Big Picture The Big Picture
• The number of people displaced from conflict or violence has increased from 17.4 million in 1997 to 27.5 million in 2010, and displacements are increasingly prolonged.
• The impacts of climate change and other extreme weather events, combined with the growth of densely populated urban centers in areas vulnerable to natural disasters, are increasing the risk of large-scale displacement, damage and death due to natural disasters.
• These trends are reflected in the United Nations World Food Program Appeal funding requirements, which have increased steadily over the last decade, from just under $1 billion in 2000 to $6.8 billion in 2010.

IDP Trends

Natural Disasters Trends

Office of Food for PeaceOffice of Food for Peace
Source: United Nations Humanitarian Appeal, Consolidated Appeal Process, 2011

Office of Food for PeaceOffice of Food for Peace
Source: United Nations Humanitarian Appeal, Consolidated Appeal Process, 2011

U.S. Food Assistance - General Outline
Title I: Trade & Development Assistance USDA
Title II: Emergency & Develop. Assistance USAID
Title III: Food For Development USAID
Title V: Farmer to Farmer USAID
Section 416(b): Surplus Donations USDA
Emerson Trust: Emergencies USAID/USDA
Food for Progress USDA
McGovern-Dole Global Food for Education USDA
Office of Food for PeaceOffice of Food for Peace
8

USAID ORGANIZATIONAL CHARTUSAID ORGANIZATIONAL CHART
Office of Food for PeaceOffice of Food for Peace
9

Food For Peace’s Operating Environment
U.S. Shipping (cargo preference)
AgribusinessProcessors
Bag producers USDA PVOs
World FoodProgram
Host GovernmentsTitle II Food Aid
Beneficiaries
CongressOMB
StateDepartment
Office of Food for PeaceOffice of Food for Peace

Office of Food for PeaceOffice of Food for Peace
Legislative Context: Reliance on Agriculture Appropriations
Note: Does not include MARAD reimbursements, carry over funds, and deobligations from prior year agreements.*House proposed FY2012 Budget level.

Title II average cost/metric ton (delivered)
Office of Food for PeaceOffice of Food for Peace

To Date
Office of Food for PeaceOffice of Food for Peace

CHOOSING A RESPONSE:
• Is food aid the right response?• Who are the right people to be assisted?• What are the right commodities for these people?• How much is the right amount of commodity?• What are the right programs for the vulnerable?• How soon are the commodities needed and for how
long? (right time)
Office of Food for PeaceOffice of Food for Peace
14

Availability
Access
Utilization
Vulnerability
Production
Markets
Policies
Markets
Care Practices
PricesPolicies
Stocks
Climate Land
Imports
Health Care
Sanitation
Water
Production
Income
Wages
Prices
AidEntitlements
Expenditure
Economic
ConflictClimate
Office of Food for PeaceOffice of Food for Peace
15

Food for Peace
Emergencies Non-Emergencies
• Response to rapid onset and/or complex emergencies
• Selected post-emergency stabilization activities
• Address immediate food needs of populations at risk
• Response to chronic food insecurity
• Maternal and child health• Environmental stabilization• Sustainable agriculture• Risk mitigation and asset
building
Office of Food for PeaceOffice of Food for Peace
16

EMERGENCY FOOD AID: RESPONSEWhen food insecurity is an issue and food commodities are
the most effective, appropriate response
An emergency food aid process is initiated if…• identified need for food, and• beyond capacity of local authorities to respond, and either• verification that a humanitarian need exists for food aid, or• there is a UN emergency appeal, or• there is a U.S. Embassy disaster declaration
Examples: • Natural Disasters • Complex Emergencies – Prolonged civil strife• Post-Emergency Stabilization
Examples: • Natural Disasters • Complex Emergencies – Prolonged civil strife• Post-Emergency Stabilization
Office of Food for PeaceOffice of Food for Peace
17

Constant assessment of the severity of food (in)security
Increasing severity
Office of Food for PeaceOffice of Food for Peace

Office of Food for PeaceOffice of Food for Peace
Most likely food security outcomes (July – September 2011)Horn of Africa
Source: FEWSNET

2010/11 rainfall compared to historical totals since 1950/51 in select pastoral areas of Kenya and Ethiopia
Source: FEWSNET
Office of Food for PeaceOffice of Food for Peace
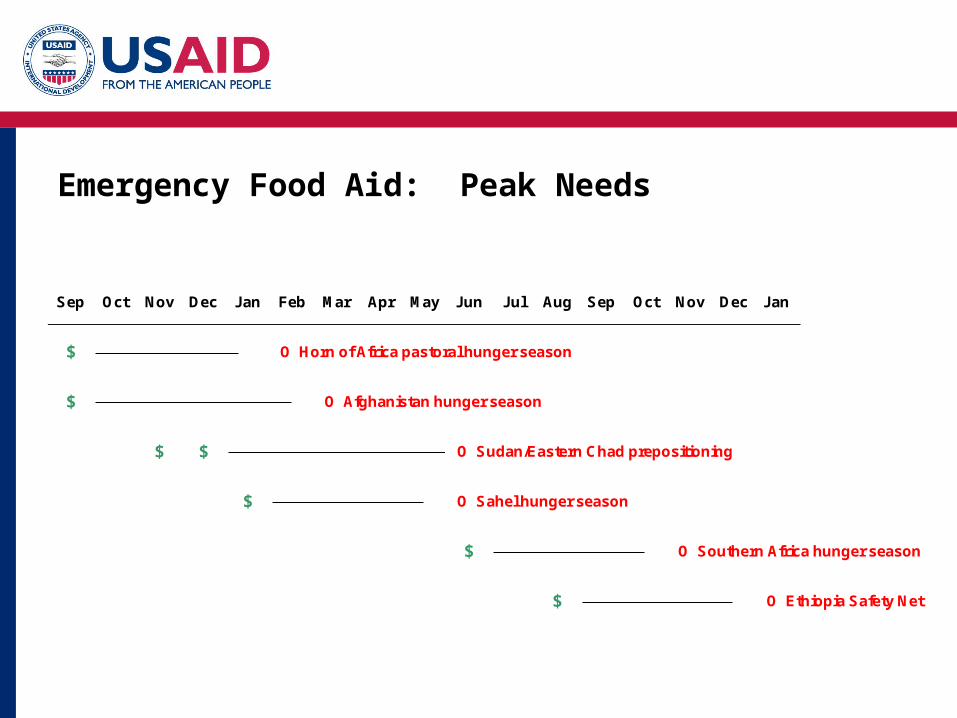
Emergency Food Aid: Peak Needs
Sep Oct Nov Dec Jan Feb Mar Apr May Jun Jul Aug Sep Oct Nov Dec Jan
$ O Horn of Africa pastoral hunger season
$ O Afghanistan hunger season
$ $ O Sudan/Eastern Chad prepositioning
$ O Sahel hunger season
$ O Southern Africa hunger season
$ O Ethiopia Safety Net


Office of Food for PeaceOffice of Food for Peace

Title II Emergency Food Aid
Overview
• Over $1.5 billion in FY 2010
• Prioritized based on magnitude, severity of needs
Country/Region
FY10 (USD mil)
Ethiopia $389.5
Sudan $275.7
Haiti $140.7
Kenya $102
Chad $98.2
Pakistan $96.8
Congo $85.7
Zimbabwe $79.5
Afghanistan $42.6
Niger $48.7
Top Ten Emergency Recipient Countries
Office of Food for PeaceOffice of Food for Peace

CURRENT TITLE II NON-EMRGENCY FOOD AID STRATEGIC COUNTRY APPROACH
Selection criteria using weighted average of three food security indicators:
% of children stunted
% of population living under $1.25 per day
% of population undernourished
Current Focus Countries
Afghanistan Bangladesh
Burkina Faso Burundi
Chad DRC
Ethiopia Guatemala
Haiti Liberia
Madagascar Malawi
Mali Mauritania
Mozambique Niger
Senegal Sierra Leone
Sudan Uganda Zambia
In FY10, 16 awardees implemented 42 programs in 21 countries, benefitting 7.9 million people.
In FY10, development programs used approximately 500,000 MT of food assistance, valued at more than $400 million.

NON-EMERGENCY FOOD AID: GUIDING QUESTIONS
• Does the needs assessment reveal chronic food insecurity?
• Is Title II food aid the appropriate tool for addressing the identified problem?
• What does the situational analysis reveal about the capacities and resources for the affected country, USAID Mission, potential partners or other donors?
• Does the Bellmon Analysis indicate sufficient storage and that food aid will not cause a disincentive for local production or marketing?
Office of Food for PeaceOffice of Food for Peace
26
For new Title II multi-year development programs, FFP works with Missions to put together Food Security Country Frameworks and/or Country Specific Guidance.
This includes a detailed assessment to see where Title II resources should be best placed to meet mission objectives.
Desire is to have Title II multi-year development programs be “Mission owned” and integrated with other mission programs. All Title II multi-year developent applications should then fit within the broader guidance of the food security framework for any given country.
27

TYPES OF NON-EMERGENCY FOOD AID: ACTIVITY TYPES
Food and monetization proceeds support integratedcommunity-based programs with activities in:
• Maternal/child health and nutrition, with a focus on prevention of malnutrition during the 1000 day window of opportunity
• Agricultural development/Natural resource management
• Water/sanitation• Microfinance• HIV prevention, care and support

PROGRAM IMPACT EXAMPLES
• Haiti: Stunting prevalence showed a 16 percentage point reduction compared to control areas
• Bangladesh: Child stunting was reduced by 30% and checkups during pregnancy increased from 13% to 84%
• DRC: 16 kilometers of irrigation canal and 27 kilometers of feeder road repaired, allowing an increase from one to three crop cycles per year. Agriculture co-operative members increased their median annual incomes by 42%
• Sierra Leone: Farmer yields increased by 77% for cassava, 66% for lowland rice, 65% for vegetable production
• Ethiopia: Average household asset values increased 20%, food self-sufficiency increased 29%
• FFP MCHN Development Programs: Show an average 2.4 percentage point reduction per year in chronic malnutrition in young children
Impact examples for Title II Development Programs that use a combination of monetization and direct distributions.

Overview
• Over $401 million in FY 2010
Title II Non- Emergency Food Aid
Top Ten Non-Emergency Recipient
Countries
Country/Region
FY10 (USD mil)
Ethiopia $62.2
Bangladesh $42
Haiti $36.5
Sudan $30.3
Uganda $25
Guatemala $25
Mozambique $19.6
Malawi $18
Madagascar $17.1
Congo $15.6
Office of Food for PeaceOffice of Food for Peace

Food Aid Logistics – Key Issues
• Port capacity• Import requirements• Transport routes
– Road– Rail– River– Air
• Cost effectiveness• Warehousing
– Locations– Cost– Monitoring
• Security
Office of Food for PeaceOffice of Food for Peace
31

FFP ACTIONS IN PROGRESS TO IMPROVE IMPACT
• An independent, meta-analysis looking at evidence of program impact across 32 countries between 2006 and 2010.
• An evidence based research study but Tufts University to determine program graduation options and effective exit strategies.
• An IFPRI impact evaluation of large-scale, under-two, malnutrition prevention programs to evaluate cost-effectiveness and ration sizes.
• Inclusion of the 1,000 days approach for all nutrition interventions in all Title II programs.
• Revision of monetization manual to guide partners on best practices and procedures for completing monetizations.
• EFSP Program (local and regional procurement, cash and vouchers).
• Availability of new food aid products with improved nutritional quality in FY11/12.

We Will DeliverWe Will Deliver