USAID Kenya Business Development Services Program (Kenya …pdf.usaid.gov/pdf_docs/PNADT843.pdf ·...
58
USAID Kenya Business Development Services Program (Kenya BDS) Contract No. 623-C-00-02-00105-00 Deloitte Touche Tohmatsu Emerging Markets, Ltd. BASELINE SURVEY REPORT Lake Victoria Fish Subsector February 2004 Prepared by: Henry Oloo Oketch Joseph Muia Richard Munguti
Transcript of USAID Kenya Business Development Services Program (Kenya …pdf.usaid.gov/pdf_docs/PNADT843.pdf ·...

USAID Kenya Business Development Services Program (Kenya BDS)
Contract No. 623-C-00-02-00105-00
Deloitte Touche Tohmatsu Emerging Markets, Ltd.
BASELINE SURVEY REPORT Lake Victoria Fish Subsector
February 2004
Prepared by: Henry Oloo Oketch
Joseph Muia Richard Munguti

Contents
Abbreviations .................................................................................................................................................. 3
Executive summary ......................................................................................................................................... 4
I. Introduction............................................................................................................................................ 6
1.1 Introduction ............................................................................................................................................ 6
1.2 Purpose and objectives ........................................................................................................................... 7
II. Sampling and data collection ................................................................................................................. 8
2.1 Definition of terms and concepts............................................................................................................ 8
2.2 Brief subsector’s highlights .................................................................................................................. 10 Roles of different MSEs .......................................................................................................................... 10 Quasi commercial and non-commercial service providers ..................................................................... 11 Location of MSEs ................................................................................................................................... 12
2.2 Sampling .............................................................................................................................................. 12
2.3 Units of analysis and selection ............................................................................................................. 14
2.4 Data type and collection ....................................................................................................................... 14
III. Survey results....................................................................................................................................... 15
3.1 Sample characteristics .......................................................................................................................... 15
3.2 Number of MSEs at sampled sites ....................................................................................................... 16
3.3 MSEs accessing business services ....................................................................................................... 16 Savings mobilisation ............................................................................................................................... 17 Product assembly and market linkage services ....................................................................................... 17 Quality assurance services ...................................................................................................................... 18 Material input supply .............................................................................................................................. 18 Business Management services ............................................................................................................... 19 Market information services ................................................................................................................... 19 New product development services ........................................................................................................ 20
3.4 MSEs with direct access to commercial markets ................................................................................. 21 Nile Perch ............................................................................................................................................... 21 Tilapia ..................................................................................................................................................... 21 Dagaa ...................................................................................................................................................... 22
3.5 Total number of service providers........................................................................................................ 22
IV. Baseline MSE numbers ........................................................................................................................ 26
4.1 Estimation method ............................................................................................................................... 26 Total MSEs ............................................................................................................................................. 26 MSEs accessing commercial business services ...................................................................................... 26 MSEs with direct links to the commercial market .................................................................................. 26 Total number of business service providers ............................................................................................ 26
4.2 Total number of MSEs ......................................................................................................................... 27
4.3 Total number of MSEs currently accessing business services ............................................................. 29
4.4 Total number of MSEs currently with direct access to commercial markets ....................................... 30
4.5 Total number of business service providers ......................................................................................... 30
V. Annexes ............................................................................................................................................... 31

2
Face to face interview guide—Annex 1 ........................................................................................................ 32
Focus group discussions guide—Annex 3..................................................................................................... 33
Key Informants discussion guide—Annex 4 ................................................................................................. 34
Focus group discussions summary —Annex 5 .............................................................................................. 35
Key Informant Interviews—Annex 6 ............................................................................................................ 51 D. Nyaloka – a Tilapia retailer at the market ..................................................................................... 52
Contacts/addresses business service providers—Annex 6 ............................................................................ 54
Field itinerary December 2003—Annex 7 .................................................................................................... 57

3
Abbreviations BDS Business Development Services
BMU Beach Management Unit
DoF Department of Fisheries
ECOVIC East African Community Organisation for Management of Lake Victoria Resources
EPC Export Promotion Council
FSA Financial Services Association
IFPs Industrial fish processors
ILO International Labour Organisation
LVEMP Lake Victoria Environmental Management Project
LVFO Lake Victoria Fisheries Organisation
NGOs Non-government Organisations
MSEs Micro- and Small-scale Enterprises
MFIs Microfinance Institutions
UNDP United Nations Development Programme
UNIFEM United Nations International Fund for Women
USAID United States Agency for International Development
WIFIP Women in the fishing industry project

4
Executive summary
This report presents the results of a baseline survey commissioned by Kenya Business Development Services (BDS) programme, a five-year programme funded by USAID/Kenya and concerned with “increasing micro-enterprise (MSE) growth through improved business service delivery”.
The programme pursues its objectives by identifying market inefficiencies along the supply chain of high potential subsectors and facilitating the delivery of appropriate business development services at commercially competitive terms. The programme seeks to increase rural household incomes in selected sub sectors; increase outreach and sustainability of BDS activities and; encourage and support a better skilled and more competitive MSEs sector.
The Lake Victoria fish subsector is one of the three high potential subsectors targeted by Kenya BDS and this report provides a benchmark against which USAID/Kenya and the beneficiary Kenya government could measure results and impact of the programme.
The specific objectives of the survey were to account for the total number of MSEs involved in the distribution and marketing chain of the subsector, specifically to develop a methodology and estimate the total number of MSEs in the Lake Victoria fish subsector. And also, to estimate the number of MSEs currently accessing commercial business services and the total number of business service providers currently operating in the subsector.
A three-person survey team headed by Henry Oloo Oketch of Maarifa Consultants collected data for the survey starting on 9th December after a week of design and field preparation. Nineteen landing sites were randomly selected for enumeration out of possible 306 sites registered by the Department of Fisheries, Ministry of Fisheries and Livestock Development.
A total random sample of 142 respondents was interviewed at the landing sites using an open-ended questionnaire. In addition to the individual interviews, 19 focus group discussions (FGDs) were held where 129 staff of the Department of Fisheries, members of Beach Management Units (MBUs), and fishermen co-operatives participated. In Nairobi, one of the big fish markets countrywide, eight key informant interviews were held with fish wholesalers at the Gikomba and City markets.
In the context of this survey, an MSE is defined as any commercial activity in the production, distribution, and marketing of fish products, provided that such a venture does not employ more than 50 workers. Secondly, a business service refers to any technical support service purchased at market price that helps an enterprise to add value to the original inputs. Lastly, the programme defines a business service provider
An MSE is considered as “accessing” a business service if it is a party in any transaction-based relationship, either for fee or available as part and parcel (embedded) of a commercial arrangement.
as any entity or individual that provides a business service commercially.
A detailed analysis of the various types of business services in the subsector can be found in a parallel survey, also commissioned by Kenya BDS at the same with this baseline survey.
The total number of MSEs in the subsector was determined at two points in the distribution and marketing chain. At the landing sites, the total number of MSEs in the subsector was determined by: • First, multiplying the average number of MSEs at landing sites of the same size to the total
number of such sites in the register. • Then, the estimated numbers for sites of all sizes are aggregated to get the total subsector-
wide population of MSEs at the landing sites.

5
At the second point of estimation, the observed wholesaler to retailer ratio at distant regional towns and cities is multiplied by the subsector-wide number of wholesalers and artisanal processors. The final number of MSEs are then determined by adding the total MSEs at the landing sites to the numbers of estimated at this second point of estimation.
Once the subsector-wide population of MSEs is determined, the number accessing different business services is obtained by the sample percentages accessing such services to the total population of MSEs
Accordingly, the estimated total number of MSEs involved in the distribution and marketing chain of the subsector is 383,930. The table below shows a summary of the major survey findings.
The table above shows that nearly 82 per cent of the MSEs are involved in the distribution and retail of fish and fish products. The next largest MSEs in the subsector, representing nearly 13 per cent of the enterprises, are at the production end of the chain, comprising boat owner-managers and fishing crew.
The baseline survey shows significant gender differences in the participation of men and women in the subsector. While men own 94 per cent of the boats, women dominate the distribution chain, owning about 70 per cent of the retail businesses, which gives the women high stakes in any developments in the sector, including the Kenya BDS programme.
In terms of access to business services and commercial markets, the survey reveals that less than 10 per cent of these MSEs have access to commercial business services, while only 6.4 per cent have direct access to commercial markets.
At the moment, local grassroots organisations, such as fishermen co-operatives and self-help groups, are some of the most common service providers in mobilisation and investment of financial resources. Like with the subsector analysis conducted in October/November 2003, this survey finds lack of financial services to be a major constraint to the MSEs.
In product assembly and linkage to markets, IFPs are the more common providers. Supply contracts are rare even with IFPs that currently lead in providing this type of business service.
Access to market information, new technology and business management services too are very limited. Most of the MSEs have organised themselves in co-operatives and self-help groups to address some of these constraints. Without the support of NGOs and public sector organisations like the department of fisheries, MSEs in this subsector could be without these basic services.
20 January 2004 Henry Oloo Oketch, Survey Team Leader
Summary of findings Number Total MSEs in the sub-sector 383,930 Total number of MSEs in distribution and marketing end of chain 312,984 Total number of MSEs at production end of chain 65,890 Total number of MSEs accessing commercial business services 13,054 Total number of MSE producers linked with commercial market 4,217 Total number of commercial business service providers 21

6
I. Introduction
1.1 Introduction
Kenya occupies about six per cent (or 2880 sq. Kms) of the total surface area of Lake Victoria, the base to the country’s lake Victoria fish subsector.
Lake Victoria currently has approximately 250 indigenous fish species, a decline from earlier estimates of up 600 indigenous species and another time 350 species (Greenwood, 1981). The three major and commercially important species of fish in the lake include the Nile perch, Dagaa, and Tilapia. These three species of fish constitute approximately 58%, 30%, and 10% of the total fish landed from Lake Victoria.
Fishing and related economic activities along Lake Victoria present Kenya with good opportunities for growth and employment creation. The fish subsector is one in which the bulk of production, distribution, and marketing activities are organised through micro and small-scale economic units (MSEs)—these being the very units where the most of new jobs have been created in the country in two decades.
According to the register of vessels operating on the Kenyan side of the lake, there are nearly 40,000 people working in the subsector as fishing crewmembers. In addition, there are about 46 co-operative societies for the fisher folk, though many are inactive.
According to the Lake Victoria fishing subsector analysis conducted by Kenya BDS (Business Development Services) in October/November 2003, about half a million people are employed in the subsector, majority micro and small-scale units. The lake produces around 180,000 metric tons of fish annually with a domestic market value of nearly Kshs 7 billion1
The five-year Kenya BDS project seeks to (1) increase the number of MSEs accessing business support services and (2) ensure that non-financial services are delivered cost effectively. The following are the specific interests of the program:
. Of this amount, up to Kshs 6.9 billion is earned by the micro and small-scale enterprises. The potential for growth and additional job creation in the subsector is greater if certain structural constraints specific to the subsector could be removed, hence the decision by Kenya BDS, a USAID/Kenya-funded project to target the subsector as one of three subsectors singled out for support.
• Strengthening the capacity of commercial business service providers in the selected subsectors and program target areas.
• Creating and increasing awareness of the potential benefits of business services among targeted MSEs.
• Providing assistance towards the development of efficient and commercially viable business service markets.
• Conducting initial subsector analyses to identify critical gaps and constraints, as well as overt and latent economic opportunities.
• Encouraging and strengthening backward and forward linkages
The Kenya BDS programme is most concerned about “increasing micro-enterprise growth through improved business service delivery”. It seeks to increase MSE’s access to
1 The 2003 Kenya economic Survey reports that Lake Victoria contributes up to 90% of the total volume of fish landed in the country since 1998.

7
commercial business services in selected high growth sub sectors, such as the tree fruits and fish subsectors. During its five-year term, the programme is expected to contribute to: • Increased rural household incomes • Increased sales in selected sub sectors • Increased outreach and sustainability of BDS activities offered by multiple providers to large
numbers of micro-enterprise clients • A better skilled and more competitive MSEs sector
To achieve the desired results, the programme (1) identifies market inefficiencies along the supply chain of high potential subsectors and (2) facilitates the delivery of appropriate business development services at commercially competitive terms.
This baseline survey is a critical component of the programme’s performance monitoring process and strategy. It provides the client—USAID/Kenya, the Kenya government, and the Contractor with a reference from where to measure and report on results against agreed targets and operational plans.
1.2 Purpose and objectives
Besides developing a tested approach to estimating MSEs and business service providers in the Lake Victoria fish subsector, the survey carried out in December 2003 provides estimates of the following specific numbers as desired by the programme: • Total MSEs in the Lake Victoria fish subsector; • Total MSEs currently accessing commercial business services which encompasses:
− Savings mobilisation − Product assembly, grading, and linking to market − Quality assurance (or services focused and concerned with achieving and maintaining
high health and hygiene standards − Material input supply − Business management training − Market research and information services − New products and technology
• Total number of business service providers currently operating in Kenya in BDS program
target areas; and • Total number of MSE producers linked with the commercial market.

8
II. Sampling and data collection
The design of this survey and fieldwork was influenced by existing literature on the subsector, especially the subsector analysis that was conducted by Kenya BDS in October/November 2003. The survey’s four objectives listed below dictated the sampling strategy and type of data collected: • Total number of MSEs in the Lake Victoria fish subsector; • Total number of MSEs currently accessing commercial business services; • Total number of business service providers currently operating in Kenya in the programme’s
target areas; and • Total number of MSEs linked with the commercial market.
2.1 Definition of terms and concepts
In the context of this survey, an MSE is defined as any commercial activity that contributes directly towards the production, distribution, and marketing of fish products, provided that the total number of employees in such a venture does not exceed 50. Secondly, business services
• Savings mobilisation
refer to any of the following range of services purchased at market price (or full-cost recovery basis):
• Product assembly and market linkage services • Quality assurance services • Material input supply services • Business management training • Market information services • New product development services
Each type of the business service is described in detail in Table 1 below.

9
Table 1—Business services definition by Kenya BDS
Source: Kenya BDS, selected business services for fish subsector
The programme defines a business service provider
An MSEs is considered as “accessing” a business service if it is a party in any transaction-based relationship, either for fee or available as part and parcel (embedded) of a commercial arrangement.
as any entity or individual that provides a business service commercially. Business service providers supply any service that directly or indirectly supports the production, distribution, and marketing of a particular product or groups of related products.
A detailed analysis of the various types of business services in the subsector has been carried out in a parallel survey, also commissioned by Kenya BDS at the same with this baseline survey. Hence, the following section presents only a very brief description of the different
Business service Description Savings mobilisation Includes mechanisms for mobilising and challenging savings into more
productive investments. Also any service, including the provision of information, organisation of awareness campaigns, and actual training and mobilisation of people/communities deriving a livelihood from fish to improve their financial resource management. Any service that links such people/communities with financial institutions to facilitate financial resource management is also relevant.
Product assembly and market linkage services
Any service that brings together or leads to the mobilisation and organisations of fishermen into more efficient units to better link up with buyers at the landing sites. Such service targets the mobilisation and strengthening of the fisher folk into strong organisations for collective actions in landing site development, management, and effective marketing linkages. It could include mobilisation, formation, and training of new fisher folks groups/associations; strengthening of existing groups; and backward and forward linkages of fisher folk groups to large buyers.
Quality assurance services Services include all activities related to delivery of improved quality fish to the market. It includes training of fisher folk on fishing methods and techniques that ensure quality fish; training on after-catch handling and hygiene; quality issues in processing and export; and technological issues particularly in boat design and structures for quality assurance (particularly with regard to ice preservation).
Material input supply Services are concerned with delivering essential inputs in the subsector, such as supplying wooden boats, boat engines, pressure lamps, fishing gear, ice for preserving fish, and storage space at the landing sites.
Business management training
Services that seek to address the business management knowledge and entrepreneurship skills of the MSEs in the subsector, including proper financial management, record keeping, marketing, customer relations, and planning for desired results.
Market information services This service seeks to address bad decision-making among the fisher folk and other MSEs in the subsector due to lack of timely and adequate information about the market and competition. Important information includes market prices, availability of customers, quantities of fish available, inputs, etc. Services could include information bureaus, publications, hosting of websites with relevant information, and supply of Information technology and communication infrastructure.
New product development This service seeks to discover and promote or develop new products that can be produced from fish (Nile Perch skin products, fish bladder applications, etc) and new or different ways to process fish/fish products (new varieties of smoked fish, breaded and chilled fish for export, etc). By their very nature, such services invariably add value to fish products
10
functions and service providers. The information presented in Section 2.1 helps put into perspective the context of the estimated MSEs numbers in Sections 3 and 4.
2.2 Brief subsector’s highlights
According to the lake Victoria fish subsector analysis carried out by Kenya BDS in October/November 2003, MSEs and various types of business service providers in the sub-sector include: • Input suppliers • Boat and fishing gear owners • Fishermen/fishing crew • Wholesalers/middlemen and retailers/fishmongers • Fish processors – industrial and artisanal • Industrial Fish Processors (IFPs) and Exporters • IFP agents • Ice manufacturers • Lake and land transport service providers • Fish co-operatives and associations • Beach Management Units • Department of fisheries • Kenya Marine Fisheries and Research Institute • Government support institutions– health; security (provincial administration, local
government, etc); • Environment conservation (ministry of lands and environment). • NGOs and bilateral/multilateral development organisations such as Export Promotion
Council (EPC) and Lake Victoria Fisheries Organisation (LVFO), etc.
Roles of different MSEs
A. Input supply
The main inputs in the subsector are labour, wooden boats, boat engines, pressure lamps, fishing gear, ice for preserving fresh fish/fish products, and storage space at the landing sites. At the marketing level the main inputs are refrigerated trucks/other modes of transport, packaging materials, and ice for preservation, etc.
Input suppliers support the subsector by importing and/or making, repairing, or selling the necessary equipment, hence providing crucial link in the chain of distribution within the subsector.
B. Fishing
At the centre of all activities in the subsector is the act of going into the lake and catching fish. Boat owners and fishermen perform this activity.
C. Lake transport
Transport is needed to move the fish from the water to the landing sites, a role increasingly important as competition push the fishermen further offshore to seek better catches.
D. Assembling and grading
Landing sites provide the meeting point for MSEs involved in fishing with MSEs involved in the marketing and distribution of landed fish. It is mainly at the landing sites where

11
the landed fish is assembled, weighed, and graded. Many cash transactions are settled at the landing sites. The marketing and distribution function begins at the sites.
Wholesalers buy and sell in large quantities and supply both retailers and wholesalers at distant regional towns and cities. Retailers, popularly known as fishmongers, buy and sell in small quantities. Retailers at the landing sites sell mostly to final consumers living close to the landing sites and nearby markets and urban centres.
IFPs and fishmeal processing firms operate at some of the landing sites buying directly from the fishermen or through agents.
E. Road transport
Once landed, public transport or specially hired trucks transport the fish to nearby markets, urban centres, and towns. Bicycles are also frequently used. Big buyers often use their own transport.
F. Artisanal processors
They are labour-intensive and well linked (backwards and forwards). Processing is commonly in the form of filleting and freezing or chilling, smoking, frying and sun drying for preservation purposes given that fish is highly perishable.
G. Industrial Processors
They provide the necessary storage, packaging, and labelling and expand the scope of the market both locally and internationally leading to growth and expansion of the sub-sector.
H. Exporters
They include the Industrial Fish Processors (IFPs) who provide credit, nets and fishing gear to fishermen through their agents; building of Bandas, storage facilities and even Jetties at landing sites to leverage the emerging competitive market; processing of Nile Perch for export.
The industrial fish processors act as the central point for all Nile perch destined for export and have a link to a large number of traders and fishermen through their purchasing agents.
Quasi commercial and non-commercial service providers
In addition to the MSEs, there are non-profit public sector organisations and development agencies that also perform crucial functions in the subsector. These include:
A. Beach Management Units (BMUs)
BMUs play a critical role in ensuring the sustainability of fish resources and appropriate beach management among others. They are independent of Government and thus have no legal authority but are considered efficient by MSEs throughout the landing sites.
B. Fishermen/fishermen groups and associations
MSEs form own self-help groups and co-operatives to provide a wide range of essential services that the market has failed to provide-from equipment, banking facilities, to organising markets.
C. Government institutions, NGOs and support institutions
They provide technical assistance like licensing, and the overall management of fishing in Lake Victoria. The Department of fisheries is particularly charged with this role. The Kenya

12
Bureau of Standards also plays a crucial role in monitoring and quality assurance of fish (products).
The Public Health Department issues certificates and supervises/monitors fish handling to ensure proper health standards and hygiene is maintained.
Environment conservation officers from the Ministry of lands and Environment conduct regular surveillance of the sub-sector’s immediate surrounding for any form of pollution and address it appropriately.
NGOs also offer some advice and education on modern fishing methods and technology.
Location of MSEs
Most of the above institutions and actors are based along the lake basin and bordering towns. Most of the activities occur at the landing sites where transactions are completed daily.
Input suppliers and IFPs are most active in Kisumu and neighbouring regional towns like Busia and Migori. Some processors and exporters are however found in Nairobi and Mombasa.
2.2 Sampling
A multistage sampling technique was used to identify respondents. Landing sites were treated as the sampling units as they bring together all the MSEs involved in producing, distributing, and marketing the fish and fish products from the lake. The following logic and assumptions were made in selecting the survey sites:
A. It was assumed that the bigger a landing site is (as measured by the number of vessels using site), the more diverse and dense the network of players that operate at site. Conversely, the fewer the vessels using a site as their operating base, the less diverse and simpler is the network. The size of a landing site is hence an important variable in influencing the presence and relationships that develop at a given site. This logic and assumption was observed in the field, with sites having less than 20 vessels characteristically hosting fewer MSEs—mostly retail MSEs. Details of these findings are discussed in Section 3.
B. It was further assumed that a landing site evolves from the interlay of several factors, the main of which are natural factors along the lake. For instance, the spot where a site grows must be accessible by both land and water, and should be free from any hidden obstacles in the water that could damage vessels. These spots are likely to be well protected from strong winds and waves. Secondly, the spot is likely to be nearby a road, railway, or air transport network so that the players can easily access the market for their fish, inputs, technology, transportation, or a market. Bigger landing sites are likely to develop from spots along the lake that has superior natural factors and better communication infrastructure. Again, this assumption was observed in the field and the arguments illustrated by landing sites like Gul min Ougo in Bondo and Muhondo in Busia. The Muhondo landing site, for instance, is not easily accessible and the fish landed here has to be transported to Marenga B (the closest site) on bicycles for distribution and marketing. There is no any other type of MSEs at the Muhondo landing site except the boats, fishing crew, and those providing transport by way of Bicycles. In contrast, Marenga B that has better infrastructure and more superior physical beach features attracts a wider range of MSEs. These include IFPs, wholesalers, artisanal fish processors, etc.
C. The last factor in the development of landing sites is the potential catch in the waters beyond the spots. Assuming that technology remains constant, if the fishing waters beyond a spot have a high potential for catch, it is likely to attract more vessels, and consequently a more diverse and dense cluster of subsector players. However, where technology is very advanced, the distance from the spot to the fishing waters where potential catch is good stops being a critical factor while access to good communication infrastructure and markets becomes most important in influencing the development of a landing site. This logic and argument was also

13
observed and illustrated in the field. Both the Remba and Ringiti landing sites in Suba, for instance, had the largest number of boats in the sample, and both are located in separate islands. With the exception of Luanda Kotieno, these two landing sites had the highest number of IFPs.
Table 2 below presents a summary of the 306 registered landing sites used as the sampling frame. Because landing sites are of different sizes, the sampling frame was first clustered into four arbitrary sizes as follows: sites handling from five to 20 vessels daily in the first category. The second category were sites handling between 21 to 50 boats daily, while the third group were the sites handling between 51 to 99 vessels. The last category was the sites handling more than 99 vessels daily.
Table 2: Size distribution of landing sites
Source: Department of Fisheries
Of the sampled landing sites, the smallest had six vessels and the biggest 410. Table 2 shows that Suba, Bondo, and Busia districts have well-developed clusters. Indeed, on the basis of catch and available facilities (as documented in the October 2003 subsector analysis report), only three of the 11 key landing sites in the lake region are located outside the three districts. Kisumu City is another important cluster—partly on the basis of catch measured in metric tons but more so because it has the highest concentration of players in the subsector. The Lakeside City is home to most of the input suppliers, processing factories, and distribution and marketing agents in the subsector. These are the clusters where the survey was carried out.
Suba district cluster
In Suba with 100 landing sites and 3,267 vessels, only two landing sites were hosting more than 99 vessels, so both sites were enumerated. For sites in other size categories, one each was enumerated after being selected randomly from the relevant lots.
Bondo district cluster
In Bondo, with 73 landing sites and 3,646 vessels, nine were hosting more than 99 vessels each. Two of these sites were randomly selected and enumerated. For sites within the other size categories, one each was randomly selected and enumerated.
Busia district cluster
In Busia, with 19 landing sites and 1,067 vessels, only one was hosting more than 99 vessels and two 20 or fewer vessels each. All the three sites were enumerated. For sites in the other two size categories, one each was randomly selected and enumerated.
Kisumu district cluster
Finally, in Kisumu, with 33 landing sites and 1,147 vessels, all the two sites each with more than 99 were enumerated. For the other remaining sites, one site from each category was randomly selected and enumerated, but one was later dropped because the Department of
Sites per District/Vessels 5-20 21-50 51-99 Above 99 Total Homa Bay 2 4 0 0 6 Nyando 2 4 1 0 7 Busia 2 8 8 1 19 Migori 4 14 8 3 29 Kisumu 13 13 5 2 33 Rachuonyo 11 22 6 0 39 Bondo 21 27 16 9 73 Suba 38 43 17 2 100 Total 91 125 61 17 306

14
Fisheries had closed it due to health reasons. Table 3 shows the number of sites enumerated by key subsector clusters.
Table 3: Sampled survey sites
2.3 Units of analysis and selection
For the purpose of this survey, the unit of analysis is any MSE involved in the subsector. These MSEs were selected randomly for face-to-face interviews and focus group discussions provided they were within the randomly selected site. A total of 142 interviews were held, of which 33 were with MSEs providing business services and 109 directly involved in the production, distribution, and marketing of the fish products. In addition to the face-to-face interviews, 19 focus group discussions were held where a total of 129 people concerned with the organisation and operations of landing sites participated.
2.4 Data type and collection
Although the subsector brings together different classes of MSEs and business service providers, the key pieces of information collected were the following: • Type of business in which respondent is involved, the relationship between the respondent
and the business, the number of enterprises in which the respondent is involved, the year when the enterprise was established, and the total number of workers at each enterprise.
• For each MSEs in which the respondent is involved, the typical products or services for the business, the typical customers for each product, exactly where the typical customers come from, and what they do with the products/services purchased from the enterprise.
• For each of the MSEs in which the respondent is involved, whether it has any contract(s) to supply big customers and, if yes, the name(s) and address(es) of the customer(s).
• Whether the respondent is aware of each of the business services targeted by Kenya BDS and, if yes, the specific service that the enterprise in which the respondent is involved has used.
• The name and address of any business service provider ever used by the enterprise, in which the respondent is involved, whether the service was paid for, the amount and views on the quality of the service; in addition to those found in smaller sites.
The survey Team Leader (Mr. Henry Oloo Oketch of Maarifa Consultants Ltd) and two Research Assistants (Richard Munguti and Joseph Mayoli) collected the data listed above through an open-ended questionnaire administered to the respondents at the landing sites (see Annex 1). Similar information was collected through focus group discussions involving members of Beach Management Units, fishermen co-operatives, and the Department of Fisheries officers using an interview guide (see Annex 2). Additional information was obtained through Key Informant interviews with wholesalers at distant regional towns and cities (see Annex 3). These interviews provided the basic data used in estimating the number of MSEs at the subsector level.
On many occasions, the survey team joined the parallel survey team members to also interview important business service providers (see Annex 4).
Sites by size category 5-20 21-50 51-99 Above 99 % Total Busia 2 1 1 1 26.3 Kisumu 1 1 1 2 15.2 Bondo 1 1 1 2 6.8 Suba 1 1 1 2 5.0 Total 5 4 4 7 6.5

15
III. Survey results
This section contains the main findings of the survey according to the baseline survey objectives. It also contains information on the sample profile of MSEs and service providers, and especially the typical numbers at landing sites of different sizes.
3.1 Sample characteristics
A total of 142 respondents were interviewed during the survey. Of this number, 109 were product-related MSEs while 33 were MSEs providing services to the product-related MSEs. About 82.6 per cent of the people interviewed were the owner/managers of the enumerated MSEs. Besides the MSEs and service providers, a total of 129 people directly involved in managing landing sites participated in 19 focus group discussions.
About 48.6 of the MSEs analysed for the baseline survey were boat owners, a third (31.2%) fishermen, and the rest are involved in distribution. The survey found significant gender differences in participation in the sector, with males dominating boat ownership (92 per cent against eight per cent by females). In marketing and distribution, females dominate, owning 68.2 per cent of the enterprises against about a third (31.8%) by males. The MSEs are relatively mature: of the 107 respondents providing information about the age of their MSEs, 64 (or nearly two thirds) are at least six years old. Less than eight per cent of the MSEs are one year old.
Multi-ownership of enterprises in the sample was common, with nearly 40 per cent of the boat owners having more than one vessel. The respondents commonly own between two to five boats. From the focus group discussions, it is evident that size indeed matters in terms of the number and cluster of MSEs to be found at a landing site. The smaller landing sites hosting up to 20 vessels seem to have the following classes of MSEs: • Input suppliers • Boat owners • Fishing crew • Transport service providers (some using bicycles) • Retail-level fish mongers • Net menders/boat repairers
The total number of MSEs at such small landing sites averages 110 per site. At landing sites hosting between 21 and 50 vessels, typical MSEs are similar to the smaller sites, but the players are more diverse. Among the four landing sites within this size category, the average total number of MSEs per site is 557. Information gathered through the focus group discussion shows that landing sites hosting between 51 and 99 vessels are significantly different from the first two categories, both in the number and type of MSEs. In the six landing sites enumerated, the following MSEs are typical: • Boat owners • Fishing crew • Occasional suppliers of fishing gear • Occasional seasonal suppliers of ice • Occasional formal fish processors/agents of fish processors • Occasional formal transport provider(s) • Wholesale and retail-level fish mongers • Artisanal fish processors (smoking, no filleting) • Net menders/boat repairers

16
The average total number of MSEs at landing sites of between 51 to 99 boats is 541. Lastly, in sites with vessels exceeding 99, MSEs are more diverse and the number higher. Typically, a site in this size category hosts an average of 1,231 enterprises. At these sites, it is common to find fish filleting MSEs, cold room services, and other types of business services.
3.2 Number of MSEs at sampled sites
A total of 12,695 MSEs were identified at the sampled 19 landing sites. The total estimated population of people living within and adjacent to the enumerated sites was 112,000. These are the people that derive a livelihood almost entirely from fish and related products. Table 4 shows the distribution of MSEs in the sample by type.
Table 4—Number and type of MSEs at sampled sites
Source: survey data
The table shows that most of the sampled MSEs at the landing sites are directly involved in the fishing itself.
3.3 MSEs accessing business services
Awareness and access to business services in the sample is limited. As shown in Table 5 below, relatively few of the MSEs in the sample have used the services. Fewer still are accessing commercial business services, with most of the services available being supplied by NGOs and public sector organisations. In quality assurance services that includes all activities related to the delivery of improved quality fish to the market less than 10 per cent of the MSEs in the sample are aware of organisations that provide such services while only 4.6 per cent have accessed them.
Table 5—Awareness and use of business services in sampled MSEs
Source: survey data
2 In the area of input supply services, the Kenya BDS has distinguished services relating to the supply of inputs such as fishing gear and other essential hardware. In this first instance, the constraint concerns affordability and availability closely by the landing sites. In the second instance, regarding the supply of Ice for preserving fish, the constraint concerns awareness and availability. In our analysis, awareness, and availability of fishing gear and other related hardware is hence ignored.
MSE type Number (%) Fish processing (firms) 8 (0.1) Distribution and marketing (wholesalers) 533 (4.2) Service MSEs (material input supplier, net/boat repair, transport, and ice, etc) 594 (4.7) Fish processing (artisanal) 251 (2.0) Boats 2,173 (17.1) Distribution and marketing (retailers/fishmongers) 2,188 (17.2) Fishing crew 7,189 (56.6) Total 12,695 (100)
Business service % Aware of service (average)
% Ever used service
% Paying for service
Savings mobilization 35.8 21.1 5.5 Product assembly and market linkage 24.8 17.4 9.2 Quality assurance services 7.3 4.6 0.0 Material input supply2 21.1 2.8 0.0 Business management services 16.1 12.8 3.7 Market information services 22.4 13.8 2.8 New products and technology services 5.1 4.6 2.8 Average awareness/usage 18.9 11.0 3.4

17
Similarly, in the area of market information, slightly more than two-thirds (64%) of the sample do not know of any provider except the Department of Fisheries nearest to their landing site. Yet another 28 per cent know only of their fisherman’s co-operative, self-help group, and the beach management unit.
Lack of knowledge of business services in product assembly and market linkage is also more widespread, with slightly more than 75 per cent of the sample not aware of any organisation providing this service in their area.
At the subsector level, 19.4 per cent of the sample are aware of different business services, but only 11 per cent have accessed the services. Among those accessing services, only 3.4 per cent have paid for the services. The table also shows that as high as 97.2 per cent of the sample do not know of any organisation that is providing services in new products and technology.
Savings mobilisation
Access to savings mobilisation services is also limited among the sampled MSEs. About 36 per cent of the sample were aware of a service provider in savings mobilisation. Of this number, 21.1 per cent have accessed such services.
Among the service providers mentioned by the sample, co-operatives and self help groups were the most common, mentioned 48 per cent and 39 per cent of the time, respectively. Also mentioned were NGOs (9.3% of the time), and private sector organisations (11% of the time).
WEDCO, K-REP, and village banks were the three private sector organisations mentioned by six of the respondents. This implies that only 5.5 per cent of the sample are accessing savings mobilisations services commercially as defined by Kenya BDS.
Table 6—Awareness of service providers in savings mobilisation
Source: Survey data
Product assembly and market linkage services
As critical as product assembly and market linkage services is, more than 80 per cent of the sample do not know where to get such services or their potential in improving the value of their products. Between two-thirds to nearly 89% of the sample, as shown in Table 7 below, either does not have access or are ignorant of the potential value of product assembly and market linkage services.
Do you know of any organisation that offers the following services? Yes (%)
No (%) Usage (%)
Informs people about the benefits and need to save, as well as the available opportunities to save
46.8 53.2
Educates and encourages people to save regularly 45.0 55.0 Educates and encourage the people to form ROSCAs, merry-go-round, FSA, village banks, etc.
43.1 56.9
Organises people into groups to save or set up their own financial institutions to access credit and other financial services
29.4 70.6
Accepts deposits and provides other financial services 29.4 70.6 Links people in the community with financial institutions, etc. 21.1 78.9 Average 35.8 64.2 21.1
18
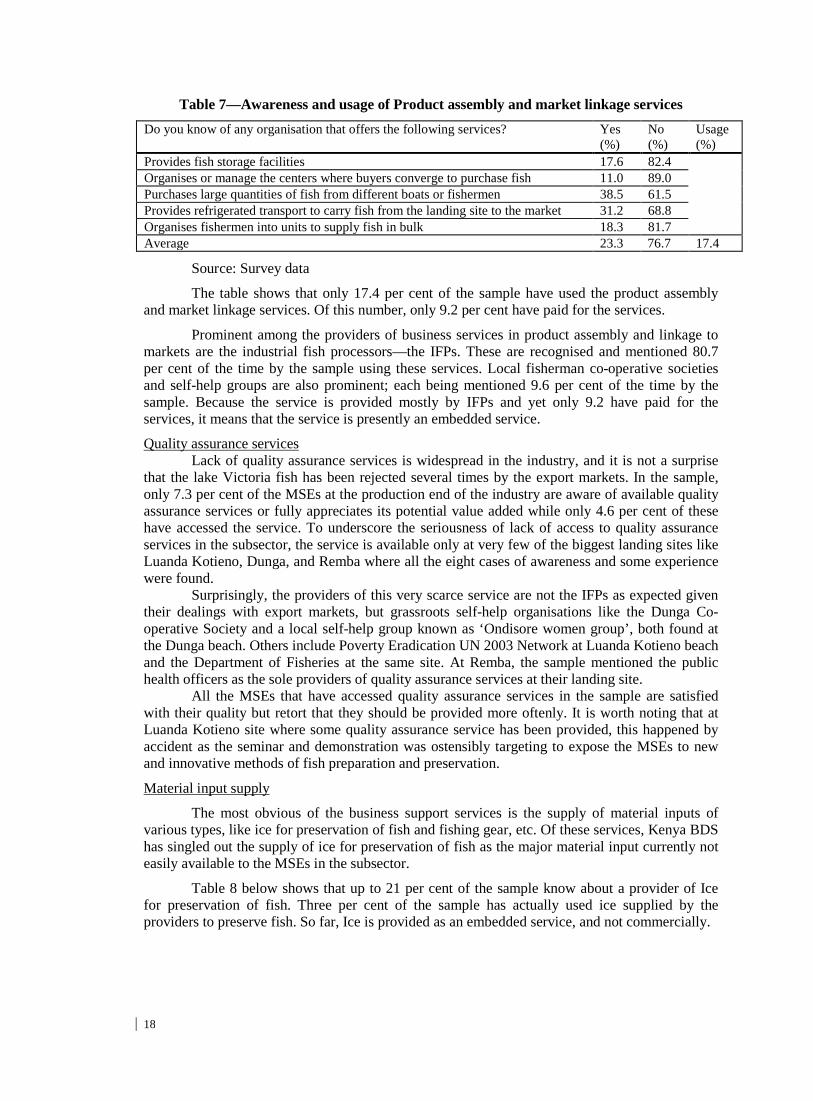
Table 7—Awareness and usage of Product assembly and market linkage services
Source: Survey data
The table shows that only 17.4 per cent of the sample have used the product assembly and market linkage services. Of this number, only 9.2 per cent have paid for the services.
Prominent among the providers of business services in product assembly and linkage to markets are the industrial fish processors—the IFPs. These are recognised and mentioned 80.7 per cent of the time by the sample using these services. Local fisherman co-operative societies and self-help groups are also prominent; each being mentioned 9.6 per cent of the time by the sample. Because the service is provided mostly by IFPs and yet only 9.2 have paid for the services, it means that the service is presently an embedded service.
Quality assurance services Lack of quality assurance services is widespread in the industry, and it is not a surprise that the lake Victoria fish has been rejected several times by the export markets. In the sample, only 7.3 per cent of the MSEs at the production end of the industry are aware of available quality assurance services or fully appreciates its potential value added while only 4.6 per cent of these have accessed the service. To underscore the seriousness of lack of access to quality assurance services in the subsector, the service is available only at very few of the biggest landing sites like Luanda Kotieno, Dunga, and Remba where all the eight cases of awareness and some experience were found. Surprisingly, the providers of this very scarce service are not the IFPs as expected given their dealings with export markets, but grassroots self-help organisations like the Dunga Co-operative Society and a local self-help group known as ‘Ondisore women group’, both found at the Dunga beach. Others include Poverty Eradication UN 2003 Network at Luanda Kotieno beach and the Department of Fisheries at the same site. At Remba, the sample mentioned the public health officers as the sole providers of quality assurance services at their landing site. All the MSEs that have accessed quality assurance services in the sample are satisfied with their quality but retort that they should be provided more oftenly. It is worth noting that at Luanda Kotieno site where some quality assurance service has been provided, this happened by accident as the seminar and demonstration was ostensibly targeting to expose the MSEs to new and innovative methods of fish preparation and preservation.
Material input supply
The most obvious of the business support services is the supply of material inputs of various types, like ice for preservation of fish and fishing gear, etc. Of these services, Kenya BDS has singled out the supply of ice for preservation of fish as the major material input currently not easily available to the MSEs in the subsector.
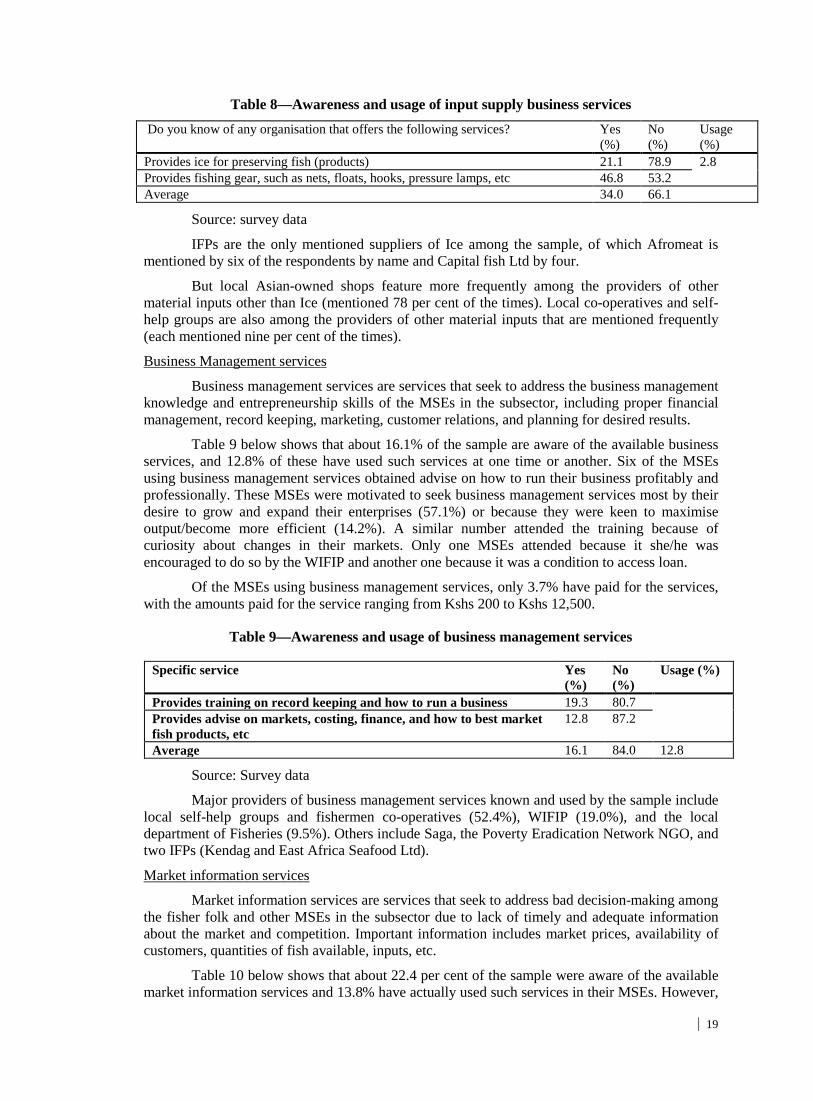
Table 8 below shows that up to 21 per cent of the sample know about a provider of Ice for preservation of fish. Three per cent of the sample has actually used ice supplied by the providers to preserve fish. So far, Ice is provided as an embedded service, and not commercially.
Do you know of any organisation that offers the following services? Yes (%)
No (%)
Usage (%)
Provides fish storage facilities 17.6 82.4 Organises or manage the centers where buyers converge to purchase fish 11.0 89.0 Purchases large quantities of fish from different boats or fishermen 38.5 61.5 Provides refrigerated transport to carry fish from the landing site to the market 31.2 68.8 Organises fishermen into units to supply fish in bulk 18.3 81.7 Average 23.3 76.7 17.4
19
Table 8—Awareness and usage of input supply business services
Source: survey data
IFPs are the only mentioned suppliers of Ice among the sample, of which Afromeat is mentioned by six of the respondents by name and Capital fish Ltd by four.
But local Asian-owned shops feature more frequently among the providers of other material inputs other than Ice (mentioned 78 per cent of the times). Local co-operatives and self-help groups are also among the providers of other material inputs that are mentioned frequently (each mentioned nine per cent of the times).
Business Management services
Business management services are services that seek to address the business management knowledge and entrepreneurship skills of the MSEs in the subsector, including proper financial management, record keeping, marketing, customer relations, and planning for desired results.
Table 9 below shows that about 16.1% of the sample are aware of the available business services, and 12.8% of these have used such services at one time or another. Six of the MSEs using business management services obtained advise on how to run their business profitably and professionally. These MSEs were motivated to seek business management services most by their desire to grow and expand their enterprises (57.1%) or because they were keen to maximise output/become more efficient (14.2%). A similar number attended the training because of curiosity about changes in their markets. Only one MSEs attended because it she/he was encouraged to do so by the WIFIP and another one because it was a condition to access loan.
Of the MSEs using business management services, only 3.7% have paid for the services, with the amounts paid for the service ranging from Kshs 200 to Kshs 12,500.
Table 9—Awareness and usage of business management services
Source: Survey data
Major providers of business management services known and used by the sample include local self-help groups and fishermen co-operatives (52.4%), WIFIP (19.0%), and the local department of Fisheries (9.5%). Others include Saga, the Poverty Eradication Network NGO, and two IFPs (Kendag and East Africa Seafood Ltd).
Market information services
Market information services are services that seek to address bad decision-making among the fisher folk and other MSEs in the subsector due to lack of timely and adequate information about the market and competition. Important information includes market prices, availability of customers, quantities of fish available, inputs, etc.
Table 10 below shows that about 22.4 per cent of the sample were aware of the available market information services and 13.8% have actually used such services in their MSEs. However,
Do you know of any organisation that offers the following services? Yes (%)
No (%)
Usage (%)
Provides ice for preserving fish (products) 21.1 78.9 2.8 Provides fishing gear, such as nets, floats, hooks, pressure lamps, etc 46.8 53.2 Average 34.0 66.1
Specific service Yes (%)
No (%)
Usage (%)
Provides training on record keeping and how to run a business 19.3 80.7 Provides advise on markets, costing, finance, and how to best market fish products, etc
12.8 87.2
Average 16.1 84.0 12.8
20
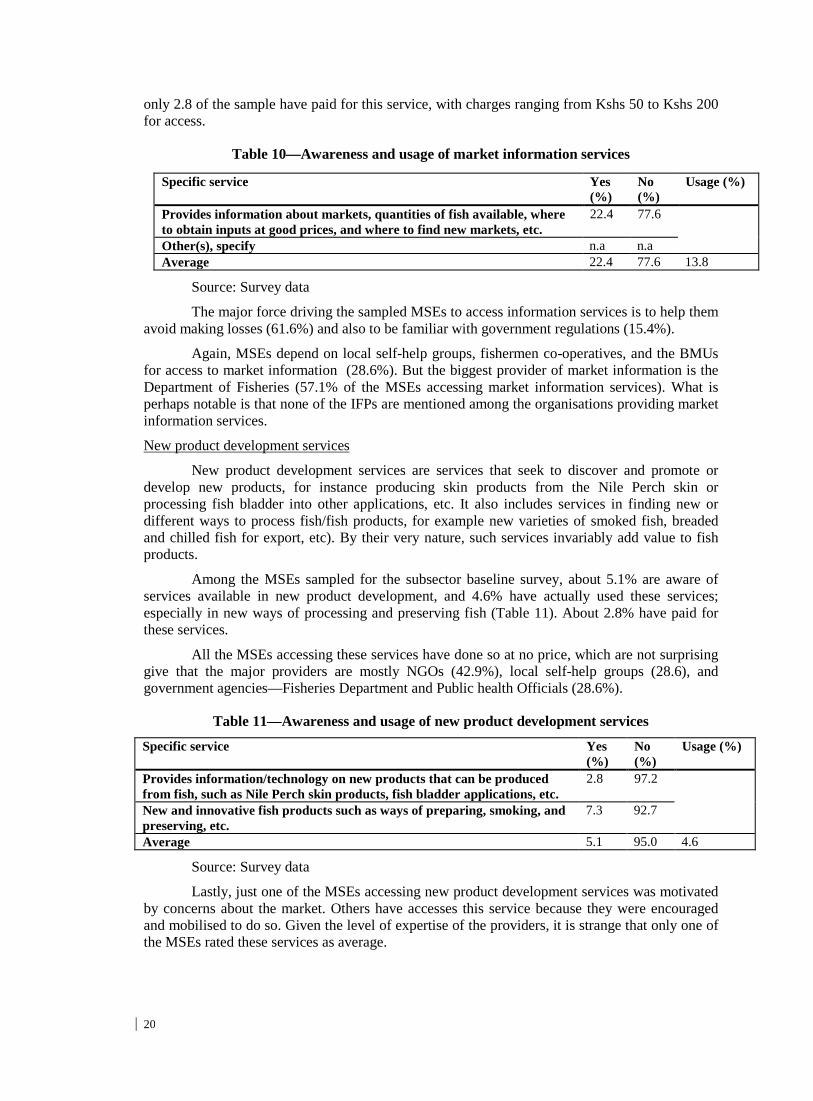
only 2.8 of the sample have paid for this service, with charges ranging from Kshs 50 to Kshs 200 for access.
Table 10—Awareness and usage of market information services
Source: Survey data
The major force driving the sampled MSEs to access information services is to help them avoid making losses (61.6%) and also to be familiar with government regulations (15.4%).
Again, MSEs depend on local self-help groups, fishermen co-operatives, and the BMUs for access to market information (28.6%). But the biggest provider of market information is the Department of Fisheries (57.1% of the MSEs accessing market information services). What is perhaps notable is that none of the IFPs are mentioned among the organisations providing market information services.
New product development services
New product development services are services that seek to discover and promote or develop new products, for instance producing skin products from the Nile Perch skin or processing fish bladder into other applications, etc. It also includes services in finding new or different ways to process fish/fish products, for example new varieties of smoked fish, breaded and chilled fish for export, etc). By their very nature, such services invariably add value to fish products.
Among the MSEs sampled for the subsector baseline survey, about 5.1% are aware of services available in new product development, and 4.6% have actually used these services; especially in new ways of processing and preserving fish (Table 11). About 2.8% have paid for these services.
All the MSEs accessing these services have done so at no price, which are not surprising give that the major providers are mostly NGOs (42.9%), local self-help groups (28.6), and government agencies—Fisheries Department and Public health Officials (28.6%).
Table 11—Awareness and usage of new product development services
Source: Survey data
Lastly, just one of the MSEs accessing new product development services was motivated by concerns about the market. Others have accesses this service because they were encouraged and mobilised to do so. Given the level of expertise of the providers, it is strange that only one of the MSEs rated these services as average.
Specific service Yes (%)
No (%)
Usage (%)
Provides information about markets, quantities of fish available, where to obtain inputs at good prices, and where to find new markets, etc.
22.4 77.6
Other(s), specify n.a n.a Average 22.4 77.6 13.8
Specific service Yes (%)
No (%)
Usage (%)
Provides information/technology on new products that can be produced from fish, such as Nile Perch skin products, fish bladder applications, etc.
2.8 97.2
New and innovative fish products such as ways of preparing, smoking, and preserving, etc.
7.3 92.7
Average 5.1 95.0 4.6

21
3.4 MSEs with direct access to commercial markets
Table 12 below shows that most of the MSEs at the production end of the sample (66.7%) are involved in Nile Perch, followed by those in Tilapia (40.2%) and Dagaa (31%). This is in contrast to the relationship established in the subsector analysis conducted by Kenya BDS in October/November 2003, but is explained by the fact that the MSEs involved in Nile Perch also tend to land Tilapia regardless of the landing site. It would seem that the type of hooks and nets used in catching the Nile perch are also effective in catching the Tilapia, or perhaps that the two fishes tend to inhabit similar ecology.
Table 12—MSEs with direct links to commercial markets by type of fish
Source: Survey data
Nile Perch
Nile Perch is demanded by at least four different types of customers, including those who buy the fish directly from the fishermen for consumption at home (mentioned 39.5% of the times). Local hotels are mentioned 5.9% of the times and those who buy in order to process or retail the fish are collectively mentioned 49.2 per cent of the times.
Majority of the middlemen/women (wholesalers) dealing in Nile Perch live within the landing sites or in the nearby local communities, but some are based at the following regional towns: • Kisumu • Nairobi • Mombasa • Nakuru • Eldoret • Kericho • Kakamega • Busia
These towns are therefore key to the estimation of the total number of MSEs operating beyond the landing sites. For the MSEs that sell to wholesalers at the landing sites, the largest number (38.2%) is based in Kisumu town, followed by those based in Nairobi (19.1%), Homa Bay (15.7%), and Mbita (15.7%).
Based on eight interviews with the middlemen/women based in Gikomba and City markets (Annex 2), each deals with an average of 50 retail customers/fishmongers daily, compared to the sample daily average of 28 at the landing sites.
As diverse as the Nile Perch customers are, supply contracts with big commercial buyers are rare. Of the MSEs that supply the fish directly or indirectly to big buyers with potential for backward and forward linkages—as defined by Kenya BDS—only 12 per cent have contracts, notably with W. E. Tilley, E. A. Sea Foods, and Capital Fish Ltd. Even so, 20.7 per cent of the MSEs have contracts with middlemen and agents buying the fish for IFPs.
Tilapia
All the MSEs dealing in Tilapia sell some of their landed fish to final consumers at the landing sites and nearby local markets/towns. But most of the fish is sold to retail and wholesale
Fish type %of MSEs at the production end %with contract
Dagaa 31.0 0 Tilapia 40.2 0 Nile Perch 66.7 6.4

22
MSEs based in distant regional towns and cities (43%). The ratio of wholesale to retail MSEs among the MSEs involved in the fish at the landing sites is 1:25.
In addition to the retail and wholesale MSEs, 40 per cent of the MSEs dealing in Tilapia also sell directly or indirectly to IFPs, though none has a supply contract, hence no direct access to the commercial market. However, one MSE in the sample has a contract to supply a local Hotel with the fish. Similarly, seven (28%) of the MSEs that supply Tilapia to wholesalers have supply contracts (five with individual traders and two with their local co-operative).
With the exception of the wholesale MSEs based in Nairobi and Mombasa, there are a number operating at the landing sites/communities and the following regional towns: • Kisumu • Nakuru • Kakamega • Kericho • Mumias
Majority (40 per cent) of IFPs dealing in Tilapia in the sample is based in Kisumu, Nairobi (23.3%), Homa Bay (16.7%), and Mbita (6.7%).
Dagaa
Like in the case of Tilapia, wholesale MSEs play a significant role in the distribution and marketing of Dagaa, accounting for 44.3 per cent of the total sales in the sample. A lot of the Dagaa is also consumed locally, with slightly more than a third (34.6%) of the MSEs selling to the local households for consumption or retail. About 11.5% and 9.8% of the MSEs involved in Dagaa also sell directly to local hotels and fishmeal food processors. The ratio of wholesale to retail MSEs involved in Dagaa at the landing sites is 1:63.
In addition to those based in Nairobi and Mombasa, there are wholesale MSEs involved in Dagaa that are based in the following regional towns: • Kisumu • Nakuru • Eldoret • Kitale • Kakamega • Kericho
In contrast, the fishmeal food processors involved in Dagaa are based largely in Kisumu (mentioned 54.5% of the time), Nairobi (18.2%), and Nakuru, Kakamega, and Homa Bay (each mentioned 9.1% of the time).
Significantly, however, none of the MSEs in the sample involved in Dagaa has any direct access to commercial markets. Even so, 6.4% of these MSEs have contracts with the middlemen.
3.5 Total number of service providers
By the definition of a business service provider of Kenya BDS, the total number of such providers as listed by the sample is 21. The 21 providers include eight IFPs, three animals feeds processors, five materials input suppliers, and five MFIs (Table 13).
The list of providers identified by Kenya BDS during the October/November 2003 subsector analysis also identifies 21 service providers (see addresses Annex 5). Similarly, the same number of service providers can be identified from the relevant entries of such organisations listed in the current national and regional Telephone and Postal Box directories.

23
Table 13—Number of commercial business service providers mentioned by sample
Source: Survey data
The following discussion highlights the areas where different service providers are prominent.
As presented in Table 14 in the following page, local fishermen co-operative societies, MSEs’ own self-help groups, IFPs, and Asian-owned shops dealing in all types of fishing gear were the most widely mentioned business service providers. Table 14 below shows the number of providers mentioned in the interviews by type of service provided and legal status.
A more detailed assessment of the table reveals that local level grassroots organisations are presently some of the most common service providers (mentioned nearly a third of the time), followed by public sector, non-profit organisations (mentioned 14.4% of the times). Non-governmental organisations are also active in providing business services to the subsector (mentioned 10% of the time).
In the area of savings mobilisation services, local co-operatives and self-help groups are the most common providers (mentioned 56% of the time) followed by NGOs (18.7%), and private sector microfinance institutions (1.7%).
Finally, in quality assurance, the leading providers are local co-operatives, self-help groups, and two of the Government agencies (Department of Fisheries and Public Health office). The IFPs are hardly mentioned yet they could play a significant role in providing quality assurance services to the MSEs.
Provider/service Firms MFIs 5 IFPs 8 Fishmeal/animal feeds processors 3 Material input suppliers 5 Total 21
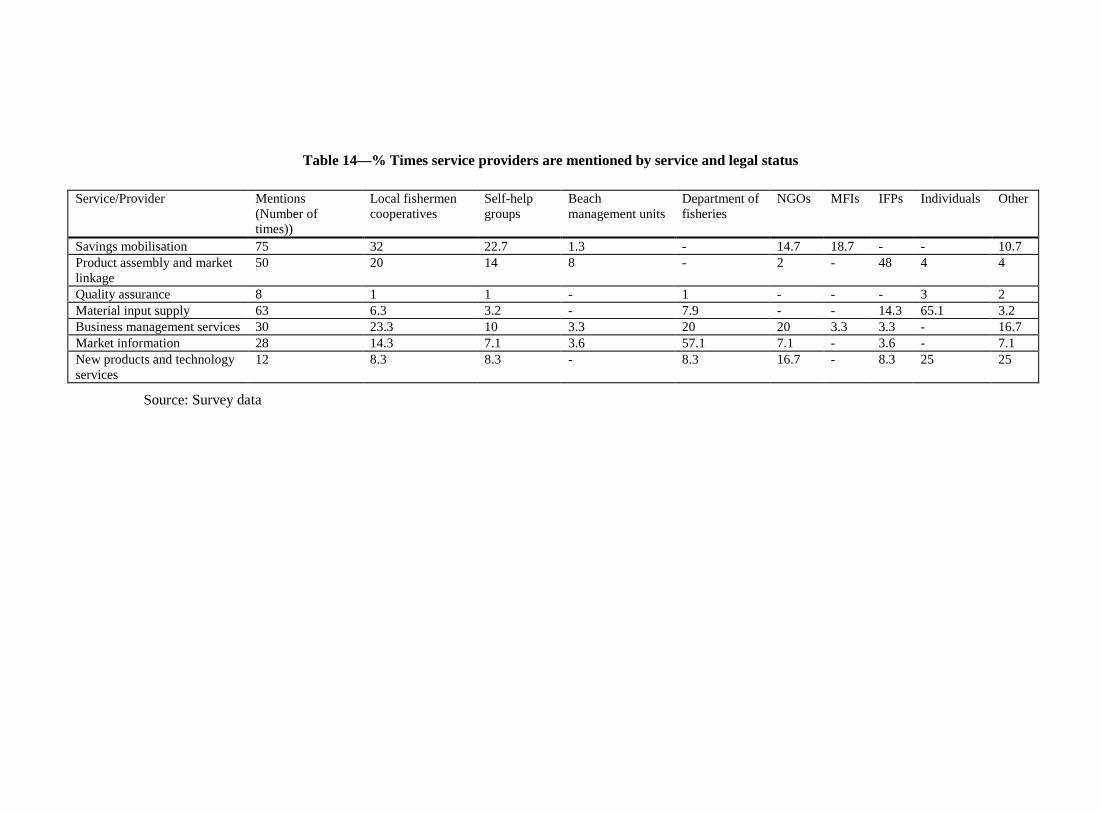
Table 14—% Times service providers are mentioned by service and legal status
Source: Survey data
Service/Provider Mentions (Number of times))
Local fishermen cooperatives
Self-help groups
Beach management units
Department of fisheries
NGOs MFIs IFPs Individuals Other
Savings mobilisation 75 32 22.7 1.3 - 14.7 18.7 - - 10.7 Product assembly and market linkage
50 20 14 8 - 2 - 48 4 4
Quality assurance 8 1 1 - 1 - - - 3 2 Material input supply 63 6.3 3.2 - 7.9 - - 14.3 65.1 3.2 Business management services 30 23.3 10 3.3 20 20 3.3 3.3 - 16.7 Market information 28 14.3 7.1 3.6 57.1 7.1 - 3.6 - 7.1 New products and technology services
12 8.3 8.3 - 8.3 16.7 - 8.3 25 25

In product assembly, grading, and linkage to the market, IFPs are the more common service providers (mentioned 48% of the time). Local fishermen co-operatives and self-help groups are also active (mentioned 34% of the time) in providing this line of service to the MSEs.
In the area of material input supply, the dominant providers are Asian- owned private sector businesses (mentioned slightly more than two-thirds of the time by the sample. IFPs are also active; being mentioned 14.3% of the time by the sample). Other significant players include the Department of Fisheries (mentioned nearly eight per cent of the time) and again the local fishermen co-operatives and self-help groups (mentioned 9.5% of the time by the sample). These last two categories of service providers also play a significant role in business management services and market research and information.
The most mentioned providers in business management services are the local fishermen co-operatives and self-help groups (mentioned slightly more than a third of the time). The Department of Fisheries is the other type of service provider that matches the contribution of local grassroots organisations, being mentioned 20 per cent of the time by the sample among the service providers in this area.
In market information, the major provider to the entire subsector is the Department of Fisheries, which is mentioned the most number of times by the sample (59.3%). Individual service providers are notable in providing ideas and technology for new products to the subsector.

26
IV. Baseline MSE numbers
This section presents the estimated baseline numbers of the MSEs in the Lake Victoria fishing subsector. The estimates are based on sample characteristics and numbers. The section is organised around the survey objectives.
4.1 Estimation method
The procedure followed in estimating the numbers required by Kenya BDS to monitor changes in access to business services and direct link of the subsector’s MSEs to the commercial market is discussed in the following pages:
Total MSEs
The total number of MSEs in the subsector is estimated by aggregating and computing average sample MSEs at two critical points along the supply, distribution, and marketing chain. The first point of estimation is at the landing site, while the second is at the point where wholesaler/artisanal fish processors deal with retailers mostly at regional towns and cities.
At the first point of estimation, the resulting averages of MSEs from the sampled sites are applied to the number of landing sites in each site size category to find the total estimated MSEs for each site size category. The totals for each site size category are finally added together to get total estimated MSEs at the landing sites.
The second point of estimation is based on the logic that wholesalers/artisanal fish processors based at the landing sites finally sell their fish products to retailers based in distant regional towns and cities. The estimation procedure rests on the observed ratio of wholesalers/artisanal fish processors to retailers at major distant regional towns and cities where they finally offload their fish to retailers. The average factor is then applied to the estimated wholesale/artisanal MSEs at the landing site to obtain the aggregate MSEs at the second point of estimation.
MSEs accessing commercial business services
The total number of MSEs currently accessing commercial business services is also estimated by aggregating and computing average percentage usage by the MSEs at every level along the supply, distribution, and marketing chain. Secondly, the resulting average percentage currently accessing services is applied to the total number of MSEs in the subsector to get the subsector-wide number of MSEs accessing different services.
MSEs with direct links to the commercial market
This number, too, is determined in the same way as the number currently accessing business services, as discussed above.
Total number of business service providers
This number is obtained from the individual interviews with the MSEs in the subsector, the October/November 2003 subsector analysis, and listings currently found in the national and regional Telephone and Postal Box directories. Additional information has been obtained from the 19 focus group discussions held with the Department of Fisheries and landing site management units. The final estimates also consider the findings of a parallel business services assessment survey also commissioned by Kenya BDS at the same time as this baseline survey.

27
4.2 Total number of MSEs
As discussed in section 4.1 above, the total number of MSEs at the landing sites is arrived at by applying the typical number of MSEs at landing sites of different sizes to the total number of sites of similar size. This procedure translates into an estimated population of 103,930 MSEs at the landing sites (Table 15).

Table 15—Estimated number of MSEs at the landing site point
Site size category
0-20 boats 21-50 boats 51-99 boats >99 boats MSEs by type
Total sites within category 91 125 61 17
Mean number of boats 15 25 70 227
Estimated number of service MSEs 1,001 1,875 1,220 952 5,048
Total estimated MSEs 103,930
Estimated number of boats 1,365 3,125 4,270 3,859 12,619 Mean number of fishing crew 73 123 254 707 Estimated number of crew members 6,643 15,375 15,494 12,019 49,531 Mean number of IFPs agents 0 1 1 2 IFPs agents 0 125 61 34 220 Mean number of retail MSEs 12 173 86 173 Estimated number of retail MSEs 1,092 21,625 5,246 2,941 30,904 Mean number of wholesalers 1 1 8 68 Estimated number of wholesalers 91 125 488 1,156 1,860 Mean number of artisanal fish processors 2 21 10 19 Estimated number of artisanal processors 182 2,625 610 323 3,740 Mean number of service MSEs 11 15 20 56

In addition to the number of MSEs found immediately at the landing sites, there are retail level MSEs at distant regional towns and cities that also buy fish from the wholesale/artisanal fish processors and then offload their stock to other retailers. The procedure to estimate the number of MSEs at this second level of distribution is applying the wholesaler to retailer ratio (distribution factor) observed at the distant regional towns and cities to the total number of wholesalers and service MSEs (Table 16) at the landing sites. The distribution factor at the landing sites and nearby markets/urban centres is typically lower, averaging one wholesaler for every 28 retailers, compared to distant towns where the ratio averages 1:50 (see interviews with wholesales in Nairobi’s Gikomba and City markets, Annex 2).
Table 16—Second level estimation of retail MSEs using observed Wholesaler to Retailer distribution factor
This additional number of MSEs increases the total estimated MSEs in the subsector to 383,930. This number is close to the estimated number of MSEs reported in earlier surveys, which variously approximate 500,0003
Table 17—Total MSEs in the subsector by type
for the entire fishing industry in the country. Table 17 shows the total number of MSEs at the two estimation points by type:
4.3 Total number of MSEs currently accessing business services
On the basis of the estimated MSEs and sample profile discussed elsewhere in this report, the number of MSEs accessing commercial business services is approximately 13,054 MSEs (Table 18).
3 This approximation includes all MSEs and medium to large-scale businesses countrywide. It also includes all workers engaged in the businesses. 4 The estimate for wholesalers does not change, since the same MSEs counted at the landing site are largely the same wholesale/artisanal MSEs operating at the distant regional towns and cities. 5 See notes in notes 4 and 5 above.
Total estimated Wholesale and artisanal fish processors
Average wholesaler to retailer distribution factor at distant towns/cities
Total estimated MSEs at regional towns and cities
5,600 50 280,000
MSE type Landing site
Distant towns/cities
Total
Estimated number of boats 12,619 - 12,619 Estimated number of crew members 49,531 - 49,531 Estimated number of retail MSEs 30,904 280,000 310,904 Estimated number of wholesalers4
1,860 1,860 1,860 Estimated number of IFP agents 220 - 220 Estimated number of artisanal5
3,740 processors 3,740 3,740 Estimated number of service MSEs 5,048 - 5,048 Total estimated MSEs 103,930 280,000 383,930

30
Table 18—MSEs accessing commercial business services
MSEs in the sector are more knowledgeable about organisations that provide or the potential value that access product assembly and linkage to markets services could add to their products than about any other business service.
4.4 Total number of MSEs currently with direct access to commercial markets
Going by Kenya BDS definition of direct access to markets, none of the sampled MSEs involved in Tilapia and Dagaa fish have real direct access to commercial markets. The only MSEs with real direct access to commercial markets are 6.4 per cent of the MSEs dealing in the Nile Perch. Hence, approximately 4,217 of the MSEs in the subsector have direct link to commercial markets.
Table 19—Total estimated number of MSEs with direct links to commercial markets by type of fish
4.5 Total number of business service providers
The total number of commercial business service providers in the subsector is 21, as reported in section 3.5 above. This number is not an estimate but actual number of known providers. But, as discussed in section 3.5, this number excludes NGOs, government departments, bilateral/multilateral development organisations, and numerous fishermen co-operatives and self-help groups formed by the MSEs themselves that currently provide critically needed but subsidised business services to the subsector.
6 This percentage refers to MSEs accessing ice for preservation of fish and excludes access to other material input supply such as fishing gear where the two most important concepts are affordability and convenience of availability close to the landing sites. With regard to access to Ice, none of the few MSEs reporting access have paid for these services, which is currently provided as an embedded service exclusively by the IFPs and their agents. Secondly, with regard to fishing gear and other essential inputs, all the providers are located in Kisumu and MSEs complain of distance and costs of the inputs. The only exceptions were the MSEs located in landing sites nearby Kisumu city. 7 This table excludes any contracts with individuals, hotels, or agents, since none of these middlemen have the potential for forward and backward linkages. On the basis of this fact, the 28% of MSEs involved in Tilapia with contracts with individual traders (five) and local co-operative (two) are excluded. Similarly, the 6.4% of the MSEs in Dagaa with contracts with wholesalers are excluded; so are the nearly 21% of MSEs dealing in Nile Perch with contracts with IFP agents and other middlemen. 8 See Foot note 7 above.
Business service % Paying Estimated number Savings mobilization 5.5 21,116 Product assembly and market linkage 9.2 35,322 Quality assurance services 0.0 0 Material input supply6 0.0 0 Business management services 3.7 14,205 Market information 2.8 10,750 New products and technology services 2.8 10,750 Average awareness/usage 3.4 13,054
% With contracts
Estimated number
Total estimated MSEs at production end of chain 65,890 Dagaa 0.07 0 Tilapia 0.08 0 Nile Perch 6.4 4,217

31
V. Annexes

32
Face to face interview guide—Annex 1

33
Focus group discussions guide—Annex 3

34
Key Informants discussion guide—Annex 4
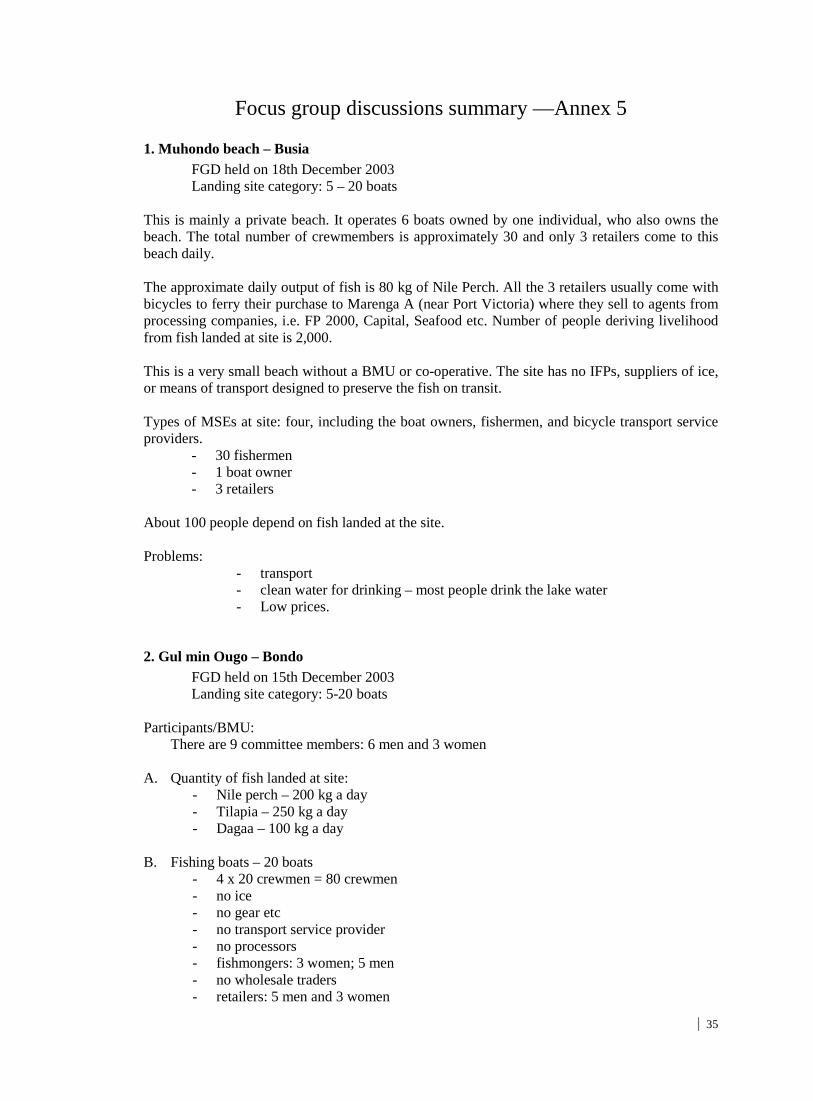
35
Focus group discussions summary —Annex 5
1. Muhondo beach – Busia FGD held on 18th December 2003 Landing site category: 5 – 20 boats
This is mainly a private beach. It operates 6 boats owned by one individual, who also owns the beach. The total number of crewmembers is approximately 30 and only 3 retailers come to this beach daily. The approximate daily output of fish is 80 kg of Nile Perch. All the 3 retailers usually come with bicycles to ferry their purchase to Marenga A (near Port Victoria) where they sell to agents from processing companies, i.e. FP 2000, Capital, Seafood etc. Number of people deriving livelihood from fish landed at site is 2,000. This is a very small beach without a BMU or co-operative. The site has no IFPs, suppliers of ice, or means of transport designed to preserve the fish on transit. Types of MSEs at site: four, including the boat owners, fishermen, and bicycle transport service providers.
- 30 fishermen - 1 boat owner - 3 retailers
About 100 people depend on fish landed at the site. Problems:
- transport - clean water for drinking – most people drink the lake water - Low prices.
2. Gul min Ougo – Bondo FGD held on 15th December 2003 Landing site category: 5-20 boats
Participants/BMU:
There are 9 committee members: 6 men and 3 women A. Quantity of fish landed at site:
- Nile perch – 200 kg a day - Tilapia – 250 kg a day - Dagaa – 100 kg a day
B. Fishing boats – 20 boats
- 4 x 20 crewmen = 80 crewmen - no ice - no gear etc - no transport service provider - no processors - fishmongers: 3 women; 5 men - no wholesale traders - retailers: 5 men and 3 women

36
- no smoking; no filleting - 2 net menders - 2 boat repairers
C. The number of people depending on fish landed at site is 2,000. D. Three out of 9 members access diverse business services. E. No contract.
3. Nduru beach management unit – Kisumu FGD held on 10th December 2003 Landing site category: 21-50
Participants:
− Samwel Omoro – Chairman − Juma Wilson – Secretary − Domnic Ondiek – Treasurer
BMU:
8 Committee members: 6 men; 2 women One beach recorder – Mr. Daniel Okeyo (Tel. 0721721032) Total is 13 i.e. 11 men and 2 women.
A. Fish and fish related MSEs in Nduru beach
Up to five different types of MSEs operate at the landing site, including boat owners, fishermen, fishmongers, retailers/fishmongers, fish net menders, and boat repair The total number of kg of fish passing through this beach unit is about 500 kg a day i.e. 15 tons a month
B. Fishing boats
- About 26 boats land here daily - About 78 crewmen averagely in all 26 boats - No supplier of ice - No suppliers of fishing gears - No transport providers - No fish processors - No fish wholesalers - Retailers are 300 - No smoking, filleting or any other operation - About 10 men do the mending of nets - About 5 men do repair of the boats
C. The total number of MSE that depend on the fish landed on this beach is 2,000. D. Six of the MSE in this place currently access the different types of business services. E. The MSEs have no supply contracts with big customers

37
4. Kaswanga beach – Suba FGD held on 12th December 2003 Landing site category: 21-50
Participants/BMU: − Chairman - Philip Okoth − V. Chairman - Zephania Owuor − Secretary - George Odinya − Ass. Secretary - Wilson Ochieng − Treasurer - Daniel Ochieng Ouma − Price Controller - Antony Ouma Ochola − Ass. Price Controller - Helen Awino − Beach recorder - George Ochieng
Committee – 5 men and 2 women A. Output of Nile Perch is 300 kg per day, i.e. 9 tons a month. B. 18 fishing boats land here daily. Up to six different types of MSEs operate at the landing site
(including fish smoking MSEs): - fishing crew members are 18 x 6 = 108 crewmembers - no suppliers of ice - no suppliers of fishing gears ( nets, hooks etc) - no transport providers except bicycles - fishmongers: 15 women; 12 men - no fish processors - no wholesale fish traders - there are only retailers as above: 15 women; and 12 men - there are only 5 smoking and frying MSEs; no filleting - net menders are 20 men and one woman - 4 boat repairers
C. The estimate of the total number of MSEs depending on fish landed here is 3000 people. D. Only 2 out of 18 members of Kaswanga BMU access different types of business services. E. There are no supply contracts with big customers (fish processors/exporters). 5. Goye beach – Bondo
FGD held on 16 December 2003 Landing site category: 21–50
Participants/BMU:
9 committee members: 5 men and 4 women A. Total number of Nile perch per day = 2 tons
Total number of Tilapia per day = half a ton B. There are 24 boats landing each day. There are up to six different types of MSEs operating at
the site: - crewmen = 24 x 7 = 168 crewmen - no suppliers of ice

38
- no suppliers of fishing gear - no transport service provider - fishmongers: 15 men and 30 women - 2 IFP agents - wholesalers – 2 suppliers - retailers as above - smoking 41 smokers; no filleting - fish net menders - 4 men - Boat repairers - 10 men.
C. About 9,000 people depend on fish and fish products landed on this beach. D. 6 members of BMU access other business services. E. No contract of supply by processors/exporters, etc. Problems:
- There is need for security arrangements along the Victoria beaches - There is need to restore the beach scan that was stopped. - The fishermen desire price control through a state corporation.
6. Openji beach – Busia FGD held on 18th December 2003 Landing site category: 21-50
Participants/BMU Officials:
- Sebastian Jumah – Chairman - Girison Wanjla – V. Chairman - Dancun Wanyama – Secretary - Dinar Wanjala – Treasure - Bonface Ombere – member - Jackline Ojiambo – member - Dismas Apiyo - member - Lucas Odinga – member.
A. Nile perch – 700 kg per day
Tilapia – 500 kg per day Dagaa - 0
B. Landing boats approximately 75. Up to six different types of MSEs operate at the site,
namely: - fishing crew approximately 225 - no supplier of fishing gear - no transport service provider - fishmongers: 10 women; 25 men - no processors - wholesalers are 5 - no smokers; no filleting - 4 fishnet menders - 3 boat repairers
C. About 5,000 people depend on fish landed here.

39
D. MSEs have no contracts with big customers. Problems:
- No security in the lake and landing beach.
7. Nanga beach management unit - Kisumu FGD held on 10 December 2003 Landing site category: 51-100
48 fishing boats land here daily Participants/BMU:
- 12 committee members of the Nanga BMU: 10 men; 2 women There are up 10 different types of MSEs at the landing site, notably those supplying ice, fishing gear, transport providers, artisanal fish processors/smoking:
- 4 shop owners who are men - 3 boat repairers who are men - 3 tailors: 2 women and 1 man - 4 cloth hawkers: one is a man and 3 women - 10 women sugarcane and vegetable hawkers
A. Fish and fish products:
- Nile perch – 150 Kgs a day - Tilapia – 300 Kgs a day - Dagaa – 1000 Kgs a day
B. MSEs at the landing site:
- there are 56 boats operating in a day giving total number of crewmen to be 56 x 3 = 168 men
- about 2 seasonal suppliers of ice - about 4 suppliers of fishing gear (nets, hooks etc) - at least one provider of transport - about 20 fishmongers - no fish processor - one fish wholesaler - about 50 fish retailers - about 3 fish smokers - no filleting - about 3 fish net menders - about 3 boat repairers
C. Total estimate is 3,000 people. D. About 15 of this MSE currently access different types of business other than fish subsector
and their total turnover is Kshs. 11 000 a month. E. There are no supply contracts with the big customers. F. There is also a branch of Kaloka Fishermen Co-operative Society operating within Nanga
Beach with a total membership of 28(20 men and 8 women) from Nanga.

40
8. Kiumba beach – Suba FGD held on 12 December 2003 Landing site category: 51-100
Participants/BMU:
− Chairman - *Died − V. Chairman - Samwel Odira (Ag chairman) − Secretary - Wilson Ogot − Ass. Secretary - Mark Siso − Treasurer - Eliud Okeyo
Committee members - 3 men; 3 women A. Fish and fish related products at the site include:
- Nile perch – one ton a day - Tilapia – 300 kg a day - Dagaa – 500 kg a day
B. Fishing boats at site are 64 daily: up to seven different types of MSEs operating at site daily,
namely: - fishing crewmembers are 64 x 5 = 320 crewmen - no suppliers of ice directly - no suppliers of fishing gear - 17 bicycle transport providers - fishmongers: 10 men; 20 women - three IFPs - no wholesale fish traders - fish retailers as above: 10 men and 20 women - there are three MSEs smoking fish but no filleting - fishnet menders are 15 men - boat repairers are 6 men
C. The estimates of the number of people that depend on fish landed here are 3,000 people. D. Out of 11 members, 6 MSEs accesses the different types of business services. E. This MSE has no supply contracts with big customers. F. The population has grown and continues to grow and there is great need for loan accessibility
for small business. G. There is great need for security arrangement along Lake Victoria to ensure safe fishing
atmosphere.
9. Nyagina beach (Mbita point) – Suba FGD held on 14 December 2003 Landing site category: 51-100
Located just at the causeway between Mbita town and Rusinga Island Participants/BMU:

41
− Maxwell Jaoko − Polycap Ochieng − Edwin Odhiambo − Alfred Oluoch − Maxwell Bhibi − Odera Otieno − Samwel Olela − Fredrick Okuku − Barack Ochieng
A. Output: 1. Nile perch – 2 tonnes daily 2. Tilapia – 750 kg daily 3. Dagaa – 4 tonnes daily
B. MSEs operating at site daily:
- 168 boats - Each boat has 4 crewmembers. Therefore total number of fishermen is about 672 - No ice manufacturers - Fish gear suppliers mostly retail shops around Mbita and Homa Bay towns. - Net menders are about 200; though most fishermen double as net menders. - Transport vehicles fitted with ice cubes from various processors, mostly:
1. WETT – Nairobi 2. Capital Fish – Homa Bay 3. Peche – Kisumu 4. Kendag – Kisumu 5. Medus – Migori 6. FP 2000 – Kisumu
- 80 fish smokers - Boat builders – 20 - Estimated entire population depending on the fish landed at site is 4,000. - 6 IFPs agents
Prices - Nile perch – Kshs. 50 – 60 per kg - Tilapia – Kshs. 50 – 80 per piece - Dagaa – Kshs. 200 per one bucket.
10. Liunda beach – Bondo FGD held on 15 December 2003 Landing site category: 51-100
Participants/BMU: There are 13 committee members: 11 men and 2 women A. Fish landed at site:
- Nile perch – 7 tons per month - Tilapia – 6 tons per month - Dagaa – 30 tons per month

42
B. Fishing boats - there are 60 boats operating at site - 180 crewmembers for the 60 boats - no ice suppliers - there are no transport service providers - two fish processors - 3 wholesale fish traders: George Obiero, Benta Yala, and Okoth Opiti) - 35 retailers; 20 women and 15 men - five MSEs smoking fish; no filleting - 10 fishnet menders - 5 boat repairers
C. The total number of people depending on fish landed at site is 10 000 people. D. 12 out of 13 members of BMU access the different types of business and services. E. There is no supply contract with big customers, processors, or exporter (on first come, first
served). Problems:
- There is need for security arrangement/tightening along the beaches in lake Victoria.
- Arrangement for storage facilities needed.
- There are a lot of financial constraints and funding arrangements are
desperately needed.
- Marketing and new technology methods should be increased including education and communication.
11. Bumbe beach – Busia FGD held on 17th December 2003 Landing site category: 51-100
Participants/BMU:
− Isaac Oundo – Chairman − Sylvanus Mukanga – Vice Chairman − Benson Okumu – Secretary − Fredrick Ogengo – Treasurer − Jason Omojo – member − Japheth Indako – member − Laban Luande – member − Sylvester Ngodo – member − Salome Ajiambo – member
A. Fish landed at site:
- Nile perch average 1½ tons in a day - Tilapia average 300 kg in a day - Dagaa average 2 tons a day
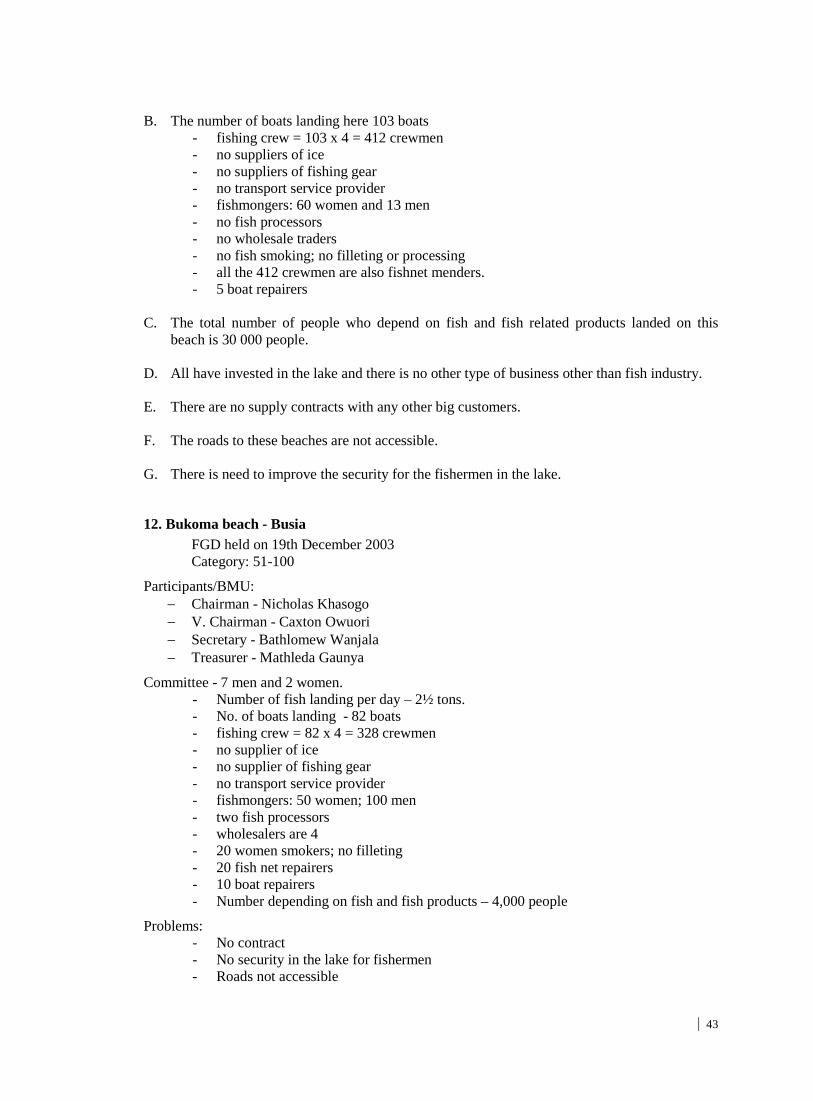
43
B. The number of boats landing here 103 boats
- fishing crew = 103 x 4 = 412 crewmen - no suppliers of ice - no suppliers of fishing gear - no transport service provider - fishmongers: 60 women and 13 men - no fish processors - no wholesale traders - no fish smoking; no filleting or processing - all the 412 crewmen are also fishnet menders. - 5 boat repairers
C. The total number of people who depend on fish and fish related products landed on this
beach is 30 000 people. D. All have invested in the lake and there is no other type of business other than fish industry. E. There are no supply contracts with any other big customers. F. The roads to these beaches are not accessible. G. There is need to improve the security for the fishermen in the lake.
12. Bukoma beach - Busia FGD held on 19th December 2003 Category: 51-100
Participants/BMU: − Chairman - Nicholas Khasogo − V. Chairman - Caxton Owuori − Secretary - Bathlomew Wanjala − Treasurer - Mathleda Gaunya
Committee - 7 men and 2 women. - Number of fish landing per day – 2½ tons. - No. of boats landing - 82 boats - fishing crew = 82 x 4 = 328 crewmen - no supplier of ice - no supplier of fishing gear - no transport service provider - fishmongers: 50 women; 100 men - two fish processors - wholesalers are 4 - 20 women smokers; no filleting - 20 fish net repairers - 10 boat repairers - Number depending on fish and fish products – 4,000 people
Problems: - No contract - No security in the lake for fishermen - Roads not accessible
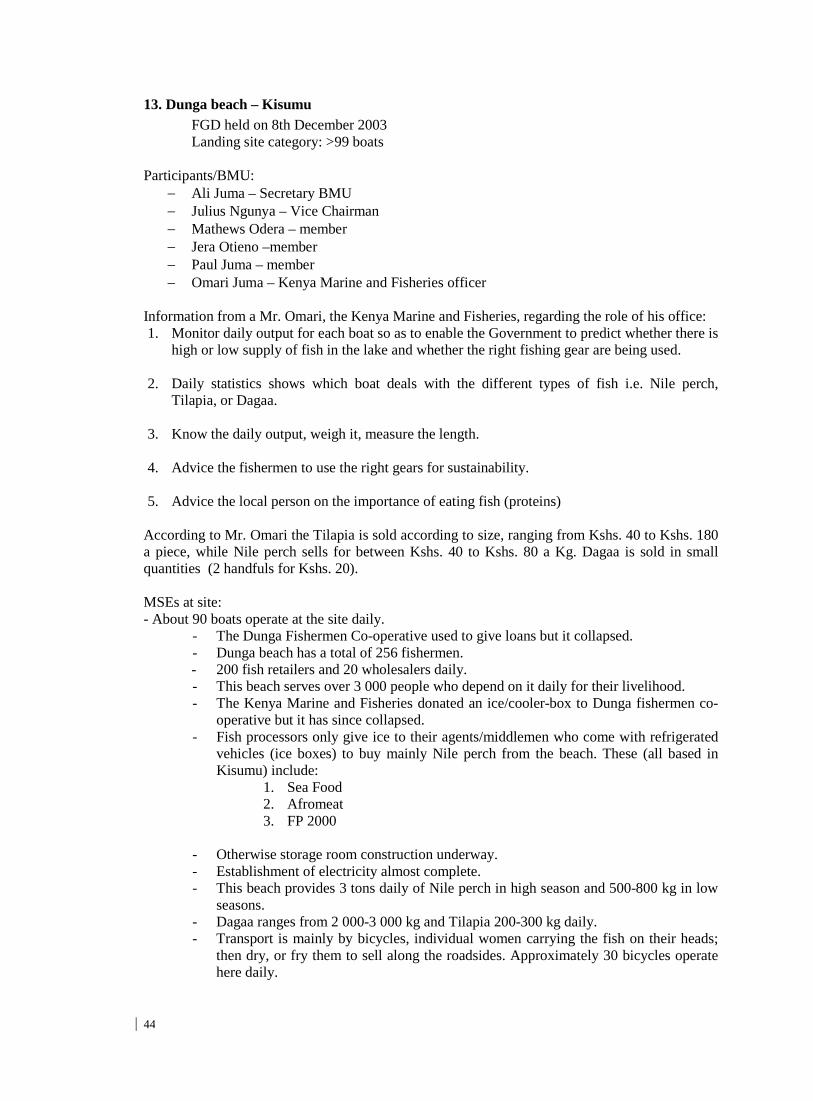
44
13. Dunga beach – Kisumu FGD held on 8th December 2003 Landing site category: >99 boats
Participants/BMU:
− Ali Juma – Secretary BMU − Julius Ngunya – Vice Chairman − Mathews Odera – member − Jera Otieno –member − Paul Juma – member − Omari Juma – Kenya Marine and Fisheries officer
Information from a Mr. Omari, the Kenya Marine and Fisheries, regarding the role of his office: 1. Monitor daily output for each boat so as to enable the Government to predict whether there is
high or low supply of fish in the lake and whether the right fishing gear are being used. 2. Daily statistics shows which boat deals with the different types of fish i.e. Nile perch,
Tilapia, or Dagaa. 3. Know the daily output, weigh it, measure the length.
4. Advice the fishermen to use the right gears for sustainability.
5. Advice the local person on the importance of eating fish (proteins)
According to Mr. Omari the Tilapia is sold according to size, ranging from Kshs. 40 to Kshs. 180 a piece, while Nile perch sells for between Kshs. 40 to Kshs. 80 a Kg. Dagaa is sold in small quantities (2 handfuls for Kshs. 20). MSEs at site: - About 90 boats operate at the site daily.
- The Dunga Fishermen Co-operative used to give loans but it collapsed. - Dunga beach has a total of 256 fishermen. - 200 fish retailers and 20 wholesalers daily. - This beach serves over 3 000 people who depend on it daily for their livelihood. - The Kenya Marine and Fisheries donated an ice/cooler-box to Dunga fishermen co-
operative but it has since collapsed. - Fish processors only give ice to their agents/middlemen who come with refrigerated
vehicles (ice boxes) to buy mainly Nile perch from the beach. These (all based in Kisumu) include:
1. Sea Food 2. Afromeat 3. FP 2000
- Otherwise storage room construction underway. - Establishment of electricity almost complete. - This beach provides 3 tons daily of Nile perch in high season and 500-800 kg in low
seasons. - Dagaa ranges from 2 000-3 000 kg and Tilapia 200-300 kg daily. - Transport is mainly by bicycles, individual women carrying the fish on their heads;
then dry, or fry them to sell along the roadsides. Approximately 30 bicycles operate here daily.

45
- No fishing gear suppliers, but the fishermen buy from Asian shops in Kisumu town, e.g. the Kavirondo Fish nets.
- No smoking done at the landing beach area - Filleting done locally by the local retailers mostly for visitors or tourists at the kiosks
around. - Fishing crew double as fishnet menders - Boat makers and repairers < 5 (estimated number - 4). - A Co-operative society structure established though not effectively functioning. - No big supply contracts with big customers (fish processors). - Most BMU officials illiterate and drug abuse on the rise. - Bad politics (local tribes) damaging the cohesion of the fishing industry.
14. Nyamware beach – Kisumu FGD held on 9 December 2003 Landing site category: >99 boats
Nyamware beach is located in a swampy area and served by a canal (Ahero canal) connecting it to the lake. Transport is a problem because of the swampy state hence only accessible by a boat or Boda boda (bicycles). Participants/BMU:
− Anditi Maurice – Chairman − G Omondi – Secretary − Joshua Odipo – Treasurer − Walter Ochieng – member − Ngunya Otieno – member − Odera Paul- member − Michael Omondi – member − Paul Odhiambo – member − Alfred Ayumba – member. MSEs at site:
- The total number of fishmongers is estimated to be 475 people. - Nyamware has a total of 171 boats operating in the beach daily. - The beach does not have any access to processors of fish though sometimes they get
agents who come to buy fish then take to some Indian factories in Kisumu city. The marketing channel is as follows: (1) Fisherman (2) Broker (3) Commission agent (local) (4) IFPs/Wholesaler’s agents (5) Processors. MSEs at landing site:
- 475 retailers and 125 wholesalers daily. - Bicycles are the only mode of transport from the beach to the main road stage, which
they charge Kshs. 50 per trip or customer. The bicycles that operate here daily are around 20.
- Being inaccessible there is no supply of ice. - Fishnets and fishing gear are all bought from Kisumu (Indian shops), like the
Kavirondo Fishnets. - The estimated number of the fishing crew, boat owners, transport service providers
and wholesalers/retailers (buyers) operating in this beach daily 1,075 people; and the estimated population depending on the beach is over 4 000 people.

46
- The lake Victoria Co-operative Union has been offering advice on the sustainability of fish through usage of right fishing gears especially nets.
- 4 MSEs smoking fish - Boat makers have a problem with getting wood for it comes Uganda hence no
constant supply. - A boat costs around Kshs. 10,000 (smallest) and to get all the tools and materials to
qualify to be a well-established fisherman it costs around Kshs. 70,000. The beach produces 500 kg of Tilapia and 5,000 kg of Nile perch daily. The following societies operate in the beach: 1. Nyamware Co-operative Society, P.O. Box 21 Rabuor. 2. Nyamware Fishermen Youth Group, P.O. Box 21 Rabuor. 3. Nyamware Fisherfolk Women Group. This last group buys all the fish (Nile perch) then they
sell to other traders/retailers from Kisumu and its environs.
15. Honge beach – Bondo FGD held on 16 December 2003 Landing site category: >99 boats
Participants/BMU:
− Joyce Fwete – Chairperson + women group − Phoebe Lando − Sylvia Akello Mien − Milicent Aluoch − Monicca Akinyi Okuku − Esther Achieng − Pamella Anyango − Serah Atieno − Annah Atieno − Annah Atieno Odimo – Secretary Nyaugenya group. − Julia Nakhabeka Ndegwa − Jane Atieno − George Ochieng Otieno − Maurice Odhiambo − Clement Odero Samayu – BMU member − George Amoth − Pamella Okumu – Secretary ‘riwruok e teko’ women group − Sylvanus Fwete.
Types of MSEs operating at site:
- Honge has 60 registered boats - Average crewmembers are 300 - The number of people deriving livelihood or depending on the beach are around 3000
people Production varies from high to low season i.e.
a. Dagaa: during the high season each boat can catch up to 20 troughs and only 8 troughs during the low season. Each trough of Dagaa weighs 8 kg when dried, which means the 60

47
boats can produce 9.6 tons a day during the high season and only 1.44 tons per day during the low season.
b. Nile perch is fished using 10 boats giving 70 kg each day during high season and 20 kg
when low. Therefore the daily production is 700 kg and 200 kg in the high and low seasons respectively.
c. Tilapia: 40 boats engage in Tilapia each managing 50 pieces resulting to a daily catch of
2000 pieces each selling at Kshs. 40.
- 100 fish retailers and 20 wholesalers deal directly with the fisherman daily. The wholesalers in turn sell to other 360 middlemen along the distribution and marketing chain.
- Two fish processors - No ice suppliers - They have 20 Boda bodas transporting fish daily. - Suppliers of fishing gear are not based in the beach hence most boat owners
and fishermen travel to Usenge, Bondo, and Kisumu fishing gear shops. - Honge has 10 fish smokers mainly women. - They have 4 boat builders/repairers. - None of the MSEs in this beach has any contracts to supply fish.
16. Luanda Kotieno beach – Bondo FGD held on 14 December 2003 Landing site category: >99 boats
Participants/BMU:
− Beatrice Otieno – Chairlady − Everlyne Awuor – Secretary − Elijah Kunga odek – Treasurer − Tabitha Odhiambo – member − Diana Odhiambo – member − Caroline Awino – member − Annet Atieno − Rose Abonyo − Stephen Otieno − Beatrice Achieng.
320 boats operate in this beach daily.
- Fishermen and boat owners are 1 060 - Net makers and repairers are 20 - Boat builders are 12 - Sail (‘tanga’) makers are 10 - 7 Ice suppliers (NB: this ice is only given to agents by their companies but not to
fishermen), as follows: 1. Afromeat 2. Sea Food 3. F.P. 2000 4. Kendag/Medus 5. Capital Fish 6. Peche 7. WETT – Nairobi

48
- The beach is only served with private transport, i.e. most people use Matatus to transport their fish from the beach to other markets like Kisumu and Nairobi.
- The processors that operate here regularly are 4. - 400 fish retailers and 300 wholesalers - 50 people involved in smoking. - Total number of MSEs is 4,000.
Production per day:
1. Tilapia – 300 pieces each 3 kg = 900 kg. 2. Nile Perch – 1 ton. 3. Dagaa – 20 sacks each 80 kg = 1 600 kg.
- MSEs with contracts 8 people. - The Banda (Luanda Kotieno) supplies Nile Perch to Seafood of Kisumu.
17. Ringiti beach – Suba FGD held on 13 December 2003 Landing site category: >99 boats
Participants/BMU:
− Samson Omollo – Chairman Banda committee − Isaiah Omondi – Chairman BMU − Joshua Akunga – Secretary − Charles Mukulu – member − Elidah Akinyi – retailer − Henry Kabundo − Alfred Okwach − Jonah Jaluanda − Samwel Otieno
- The population deriving a livelihood from the fish landed at site is about 6,000 to
7,000. - Number of boats operating are 410 - Wholesalers – 10 - 30 Retailers; 20 women and 10 men - 6 processors through agents - 20 boat repairers - 20 net menders - No ice manufacturers - Fish gear – Kisumu - Output: - 25 tonnes of Nile Perch in high season and 4 tonnes in low season - Transport: - agents to processors - 5 boat owners have individual transport arrangements - Has a functional BMU and Co-operative society.
18. Remba beach – Suba FGD held on 13 December 2003

49
Landing site category: >99 boats Participants/BMU:
− Samwel Odero Musungu Siongo − Kaatende Godfrey − Charles Odira − Cyprine Atieno – grader − Cyprine Achieng George − Serah Anyango David − Zaina Karenge − Oketch − David Odhiambo − Nicholas Odhiambo
- Remba is a cosmopolitan island mainly settled by Kenyans, Ugandans, and
Tanzanians. - Total number of operating boats estimated at 300. - 1,200 fishing crewmembers - About 5 processing companies involved in the fish industry through their local
agents; - Total number of entire fisherfolk is about 5,000. - Ice agents from processors supply ice storage to their customers respectively. - Fishing gear mostly got from Kavirondo Fish Nets in Kisumu; Uganda and Tanzania - No ice plants. - 20 motorboats for transport across the islands. - Sango Farewell Women Group, one of the organisations locally established by
women… “to lift up their economic standards, families, and business”. - 12 boat repairers - 4 boat builders - 20 wholesalers - 30 retailers
Output of fish at landing site:
- Nile perch – 20 tonnes daily - No Dagaa or Tilapia species.
19. Marenga (omena) beach - Busia
FGD held on 18 December 2003 Landing site category: >99 boats
This beach is located in Marenga, next to Port Victoria landing site. It is widely known as the “Omena” beach, the local name of Dagaa, due to its high production of this fish. Even traders from Uganda land in this beach to sell their Omena. Participants/BMU: The BMU has 11 members in its committee: 8 men and 4 women
− Chairman - Mr Christian Wanyama − V. Chairman - Raphael Musoma − Secretary - Japheth Olumbe

50
− Treasurer - Lucas Were Other Members: men-8; women –4
10 sacks of Omena daily in low season; 100 sacks in high season (a sack is approximately 80 Kgs) MSEs at site:
- Boats : 120 (registered) boats land daily and the estimated number of fishermen is 600 (120 x 5) crewmen
- no ice supplier because Dagaa doesn’t need ice but to be sun-dried
- no fishing gear providers
- transport service providers: 20 bicycles (Boda boda) operate in this beach daily
- Retailers and wholesalers from the local community are 200. They buy Dagaa from the fishermen then dry it and resell to other wholesalers and retailers who come from as far as Nairobi, Kisumu and Busia. There are 20 such big wholesalers.
- No fish processors come to this beach but go to Marenga A, which deals with Nile perch and Tilapia.
- No net menders; at least each crewmember has the technical know-how to mend or make his nets.
- No MSEs smoking/filleting or frying fish
- 10 boat repairers/builders
- About 10 000 people depend on Omena from this beach for a living.
- No MSEs with contracts with any company or institution but they deal with day to day retailers and traders who come to the beach to buy Dagaa everyday.
Main problems faced: − Lack of security in the lake – constant harassment of fishermen by Ugandan police. − Roads are inaccessible − Price control problem – unpredictable prices that keep on changing − Lack of a well-established market where fishermen can have say in the determination of
prices.

51
Key Informant Interviews—Annex 6
KII held on 12 January 2004 City Fish Market - Nairobi
Key Informant – Mrs. Susan Oduor (tel. 020 334070) 1. Do you know the number of fish wholesalers operating at this market?
- There are about 10 wholesalers dealing with fish at the City market (5 women & 5 men).
2. What is the typical number of retailers that buy fish from you daily? - A wholesaler who has a shop for retailing can handle about 10 retailers on a daily basis’
per each of the three items. - A wholesaler who has no retail shops can handle 30 for Tilapia and another 20 or 30 for
Nile perch plus 30 for Dagaa. - Total number of retailers can then be 50-60 per day operations per wholesaler for Tilapia
and Nile perch plus another 30 Dagaa retailers per wholesaler gives a total of 900 retailers (i.e. 60x10 + 30x10)
- Women retailers are more than men, i.e. ¾ of the 900 are women.
3. Where do your retail clients from within the city? - they mainly come from Dandora, Nairobi West, Town centre (mostly hotels/kiosks), - The entire city centre community and its environs; - Serves whites, Asians, Africans/Negroes, all classes of people.
4. What do your retail customers do with the fish that they buy from you daily? - Most customers buy for final consumption - The retailers buy in large quantities and sell in smaller quantities; they do filleting and
frying. Their customers come from the city centre and environs. - The wholesalers sell in large quantities and also in small quantities for those who double
as retailers. 5. Where do you typically get your own supply of fish?
- suppliers mostly individuals; - commission agents from processors or factories; - Companies such as WET – not applicable always.
6. Who are your main suppliers of fish? - IFPs - Commission agents – agents mostly from processors or individual suppliers with their
own companies (they’ve established themselves)
7. What is the typical quantity of fish that your retail customers buy daily? - High season: one ton each supplier; low season: ¼ ton each supplier on daily basis. - Each wholesaler deals with 2-3 supplier hence 10 wholesalers can handle 30 suppliers in
the City market for all three types of fish.
8. What is the average daily quantity of fish that you purchase from your suppliers daily? - About 30 tons during high season 9. Where are the most active fish markets found within the city?
- sell to the entire City community and its environs - Mostly high and middle class customers.
Note: there is also an association of wholesalers at the City market.

52
KII held on 12 January 2004
Gikomba Fish Market - Nairobi Key Informants: A. Otieno – a committee member of the market 1. Number of wholesalers within market – 50 2. How many retailers buy daily – 2500 3. The customers come from within and around the city: Nairobi city estates and small markets
such as Korogocho, Kenyatta, Kibera, and Kariobangi. Around 15-20 customers per day. 4. They get the fish from Kisumu and Tanzania; mainly Tilapia. 5. They buy the fish from agents based in Kisumu. The wholesalers after buying the fish pack
them into big containers with ice blocks and transport to Nairobi (Gikomba) to sell to the retailers when fresh.
6. Gikomba mainly deals with Dagaa and Tilapia while City market is mainly for Nile perch 7. The retailers within the market usually process the fish by filleting and deep frying then sell
to other retailers from Nairobi estates or sell to small hotels inside the market.
B. Tom – Secretary, Gikomba market
1. About 40-50 big wholesalers in the market 2. Number of retailers buying daily – 3000; he serves around 25-30 retailers daily. 3. Customers come from within the city especially Gikomba and other city estates – mainly
low and middle class. 4. Buy fish (Tilapia) from agents. They have their own agents spread all over Lake Victoria
who supply them with fish. 5. There are about 80 fish retailers within the market. 6. They get the fish mainly from lake Victoria, Kisumu, Mbita and Tanzania. 7. Major active fish market within the city is Gikomba. Other markets include City market and
Kenyatta market. 8. After buying from the wholesalers, the retailers do filleting and deep frying then sells to
final consumers in their respective destinations. According to the secretary a wholesaler is not supposed to do retailing such as selling to final consumer but only deals with the various retailers whom they sell to when fresh (right from the large iced basket). Deep-frying and filleting is only done by the retailers but not the wholesalers.
D. Nyaloka – a Tilapia retailer at the market
1. She gets her fish right from Kisumu where she has her own agents who buy the fish then package them under her name then loads into lorries that offer transport. She then collects on arrival at Gikomba market after which she pays the agent through posta or bank.
2. After buying the fish, Nyaloka displays them for sale in a small table at the market. She has one worker, a young man who removes the scales and does the actual filleting after which they fry the fish so as to sell slowly. Before frying the fish has to be washed clean.
3. Most of her customers come from the city estates, within the market and small hotels. C. Mama Akinyi –

53
1. wholesaler 2. About 2 000 retailers buy from her daily. 3. Customers come from within the market and Nairobi City estates. 4. The customers wash the fish, do filleting, and fry then sell to final consumers. 5. She has an agent who buys the fish from Kisumu markets then sends to her. 6. Number of fish retailers – about 80 retailers in Gikomba. 7. The major active fish markets in the city – Kenyatta, Kibera, and Korogocho. 8. Number of wholesalers in the market – between 40-50 wholesalers.
D. Mary Odhiambo – a retailer at the market. Mainly deals with Dagaa.
1. Most of her customers come from within the city estates mainly final consumers. 2. She estimates the number of retailers in the market to be around 75. 3. She says she has her own boat which is operated by her son who sends the catch (Dagaa) to
her. In case of shortage, her son buys from other fishermen right from the boat then sundries them before sending to her.
4. She sells the fish in different quantities depending on the customer needs- the smallest quantity being a tin of Kshs. 10/=
5. Some of her customers sell along the city roadsides and estates such as Kariakor, Pumwani, Muthura and Mlango-Kubwa estates.
E. Mama Atieno – another retailer at the market.
1. She only buy fish from wholesalers at the market (buys from the lorry). 2. She mainly buys Dagaa, and some mud fish, which comes from Lake Magadi. 3. Rejects from Dagaa are packed in small polythene bags and sold as chicken and animal
feeds. 4. Her customers include passers-by within the market and surrounding Nairobi estates.

54
Contacts/addresses business service providers—Annex 6
Industrial Fish Processors/Exporters Peche Foods P.O. Box 1064 KISUMU Tel: 057 – 21523 Fax: 057 – 21524 F. P. 2000 Limited P. O. Box 9083 KISUMU Tel: 0721 – 322094 Fax: 057 – 23421 East African Seafood KISUMU Afromeat Limited KISUMU W. E. Tilly P.O. Box 11830 Nairobi, Kenya Alpha Fine Food Ltd P.O. Box 10271, 00100 G. P. O Email: Fax: 020 530335, 534486 Tel: 020 533916, 531952 Kenya Fish Processors and Export Association Ltd Tel: 440858 Peche Foods P.O. Box 1064 Kisumu Fax: 057 21524 Tel: 057 21523, 22845, 40782/3 Lake Victoria Fish Limited Tel: 571142, NAIROBI Victoria Nile Perch Makasembo Road Tel: 057 23458 KISUMU Kendag Fax: 057 21258 Tel: 057, 21258, 545579, 3743128 Mbuta Ltd Nkrumah Road Kisumu Tel: 057 31023 Modern Fishing Industries Fax: 057 21351 Tel: 057 21202, 21365 Email: [email protected] KISUMU Capital Fish Ltd P.o. Box 607 HOMABAY Tel: 059 22139, 22228, 22300 Email: [email protected]

55
Capital Fish (K) Ltd 48148 / 48215 Kandag Ltd 862193 / 861321 Nbr Kenya Cold Storage (1964) 743128 Nbr Moderm Fishing Industries 79988 / 799889 Samaki Industries (Nbr) Ltd 565712 Samaki & Tikey Ltd 215640 Quantity Tackle Exporters 0733-601918 / 630356 [email protected] Perfect Food Supplies Ltd 334070 Meat Bazaar Ltd 226031 Nbr Gad Foods 602835 Fly Factory P.O. Box 66141 522798 KISUMU Monasa Nets (Kenya) Ltd P.O. Box 9473 057 43323/4 [email protected] Webuya Wholesalers Odera Street 057 41794 / 42496 [email protected] Western Fishing Flies Ltd 056 20861 Kakamega Western Nets & Chemicals Oginga Odinga Road 057 – 44667 Fish & Meat (K) Ltd Makasembo Road P.O. Box 1712 KISUMU Fax: 057 23520 Tel: 05742416, 43686 Jessa Trading Co. Ltd Oginga Odinga Road P.O. Box 644 Kisumu Fax: 057 42308 Tel: 057 23466, 42308 Email: [email protected]

56
Fishmeal/Animal-feed Processors Bondo Fishmeal Industries BONDO Tel: 0733 806662/ 0733 621348 FB Limited KISUMU United Millers KISUMU Input Suppliers Webuye Wholesalers (Fishing Gear/Ice blocks P.O. Box 359 KISUMU Tel/Fax: 057-42496 Victoria Ice Manufacturers P.O. Box 879 KISUMU Tel: 0722 8972260/ 0733 7091133 Nile Perch Fisheries Ltd Hughes Bld. 8th Floor Tel: 227985, 336298, 213686, 767989 NAIROBI Kenya Fishmeal Ltd P.O. Box 40738 NAIROBI Telefax: 020 534114 Kavirondo Fishnets Ltd Odera St. P.O. Box 237, KISUMU Email: [email protected] Fax: 057 23089 Tel: 057 21988, 22779, 42549 Lakeside Fishing Flies Ltd KIE Nkrumah Road P.O. Box 712 Kisumu Fax: 057 23544 Tel:057 23544, 444942 Regional Manager K-Rep Development Agency KISUMU SAGA Thrift & Enterprise Program Ltd Sifa Hse. Ground floor KISUMU Tel: 0733-837628

57
Field itinerary December 2003—Annex 7
1
The 2003 Kenya economic Survey reports that, since 1998, Lake Victoria contributes up to 90% of the total volume of fish landed in the country.
1
Action Aid, Colleges, Ministry of health, Scouts, and Catholic Centre
Date Activity Location Sun, 7/12 Travel Nairobi to Kisumu Mon, 8/12 Interviews Dunga Beach Tue, 9/12 Interviews Nyamware Beach Wed, 10/12 Interviews Nanga; Nduru Beach Thur, 11/12 Travel Kisumu to Suba, Mbita Fri, 12/12 Interviews Kaswanga; Kiumba Beach Sat, 13/12 Interviews Remba; Ringiti Beach Sun, 14/12 Interviews/Travel Nyagina; Suba to Bondo Mon, 15/12 Interviews Luanda Kotieno Tue, 16/12 Interviews Liunda; Gul min Ougo Beach Wed, 17/12 Interviews Goye; Honge Beach Thur, 18/12 Travel/Interviews Bondo to Busia; Openji Beach Fri, 19/12 Interviews Bumbe; Marenga B Sat, 20/12 Interviews Muhondo; Bukoma Beach Sun, 21/12 Travel Busia to Nairobi