Usage of the Penn State Forage Separator for evaluating ...
29
Usage of the Penn State Forage Separator for evaluating particle size of TMRs by Ashley Rene Garcia Dairy Science Department College of Agriculture, Food, and Environmental Sciences California Polytechnic State University San Luis Obispo 2009
Transcript of Usage of the Penn State Forage Separator for evaluating ...

Usage of the Penn State Forage Separator for
evaluating particle size of TMRs
by
Ashley Rene Garcia
Dairy Science Department
College of Agriculture, Food, and Environmental Sciences
California Polytechnic State University
San Luis Obispo
2009

ACKNOWLEDGEMENT
The author of this project would like to take the time to express her sincere
appreciation to Dr. Stan Henderson for his commitment to help, suggestion of the
problem, invaluable guidance, and overall support in making this research project
possible. The thank you is also extended to the Dairy Science faculty for their
enthusiasm, cooperation, and technical assistance. The author is also very
appreciative and grateful to her parents for their amazing support and faith in her
pursuing her dream and goals. She is also indebted to the Cal Polytechnic State
University department of Dairy Science for the opportunity to pursue a bachelor’s
degree.
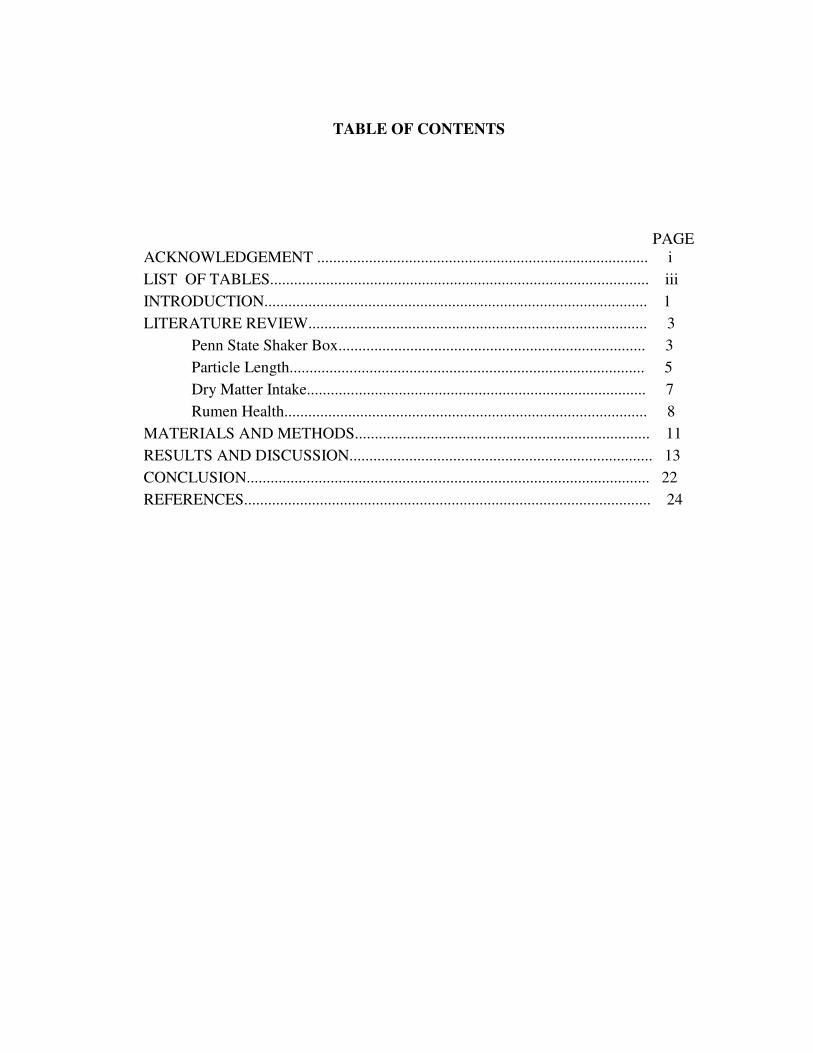
TABLE OF CONTENTS
PAGE
ACKNOWLEDGEMENT ................................................................................... i
LIST OF TABLES............................................................................................... iii
INTRODUCTION................................................................................................ 1
LITERATURE REVIEW..................................................................................... 3
Penn State Shaker Box............................................................................. 3
Particle Length......................................................................................... 5
Dry Matter Intake..................................................................................... 7
Rumen Health........................................................................................... 8
MATERIALS AND METHODS.......................................................................... 11
RESULTS AND DISCUSSION............................................................................ 13
CONCLUSION..................................................................................................... 22
REFERENCES...................................................................................................... 24

LIST OF TABLES
TABLE PAGE
1. Forage and TMR particle size recommendations................................... 4
2. Holstein Sample 1 Results...................................................................... 13
3. Holstein Sample 2 Results...................................................................... 14
4. Holstein Sample 3 Results...................................................................... 15
5. Holstein Sample from middle of manger results.................................... 16
6. Jersey sample 1 results........................................................................... 17
7. Jersey sample 2 results........................................................................... 18
8. Jersey sample 3 results........................................................................... 19
9. Jersey sample from middle of manger results........................................ 20

INTRODUCTION
Nutrition accounts for 58% of the cost of production on the dairies (6). Feed
prices have increased significantly while milk prices have plummeted. Even though
cows are typically fed in groups, cows have individual daily nutrient requirments;
whether she is lactating or is in the dry period. Along with this dairymen need to find
ways to keep the dairies in business and survive in such hard economical times.
There are many problems dairies can face due to poor feeding and nutrition
management. One of these is poor feedbunk management, including problems like
not mixing feed properly, including particle size and variety. Particle size has many
effects on the cow, and adequate forage particle length is necessary for proper rumen
function. Acidosis, laminitis, and subacute rumen acidosis have become prevalent
problems for commercial dairies (4). With this said, there is the need to make sure
that no feed is wasted and the cows are not sorting their total mixed rations to get the
full production of milk during each lactation, as well as maintaining proper rumen
function. Dairymen are also having a hard time measuring particle size. Proper
particle size distribution of feeds is an important part of ration formulation.
Management of forage particle size starts with harvesting forages at the proper stage
of maturity. Chopping the crop at the right length helps to achieve the desired particle
length in a TMR. Measuring particle length of the forages is only a portion of the
solution. Analyzing the TMR particle size is the main goal in measuring the

distribution of feed and forage particles that the cows are truly consuming. The Penn
State Forage Particle Separator is a simple and effective “on farm” way to quantify
chopping results. TMRs only work as well as the mixer does. In addition to analyzing
forage and particle size, the particle separator can help monitor feed bunk sorting and
can help in trouble shooting feeding, metabolic, or production problems on the dairy.
There are either 3 or 4 boxes that have consecutively smaller sieves that the forages.
TMRs are shaken, with smaller particles being dropped through to smaller sieves. The
feeds remaining on top of each sieve and in the bottom pan are then compared against
the total volume of the original sample. The main objective of the shaker box is to
maximize the amount on the middle sieve at about 45-65% of the total material.
Measuring the TMRs remaining in the bunk is key to evaluate sorting (3). This should
be done several times throughout the day. The particle distribution size should not
differ more than 3-5% from the original TMR. In this project, by using the Penn State
shaker box, it can help determine what the cows on the dairy are actually consuming,
if the particle sizes are adequate for rumen function, how to improve forage and TMR
mixes for the herd, and improve management of overall nutrition.

LITERATURE REVIEW
Penn State Shaker Box
Development of Penn State Shaker Box
The Penn State forage particle Separator has become a very useful tool that
quantitatively determines the particle size of forages and total mixed rations. Proper
particle size distribution of feeds is an important part of ration formulation and
nutrition management on dairies. Until recently it has been very difficult to measure
the particle size on dairies (3). The Penn State forage particle size separator box
consists of three or four boxes that are stacked on top of one another. The top box
retains particles of feed or forage that are greater than three forth’s of an inch. The
middle box retains particles between five sixteenths and three forth’s of an inch. The
bottom box has a solid bottom and retains particles under five sixteenths of an inch.
The American Society of Agricultural Engineers’ (ASAE) for particle size analysis
and distribution has been available for many years (3). This method of analysis is an
intensive laboratory procedure that is impractical for farm use. The objective of
developing the Penn State forage particle separator was to mimic the complex lab
method, but with a simpler, on-farm method (3).
Using the Penn State Shaker Box
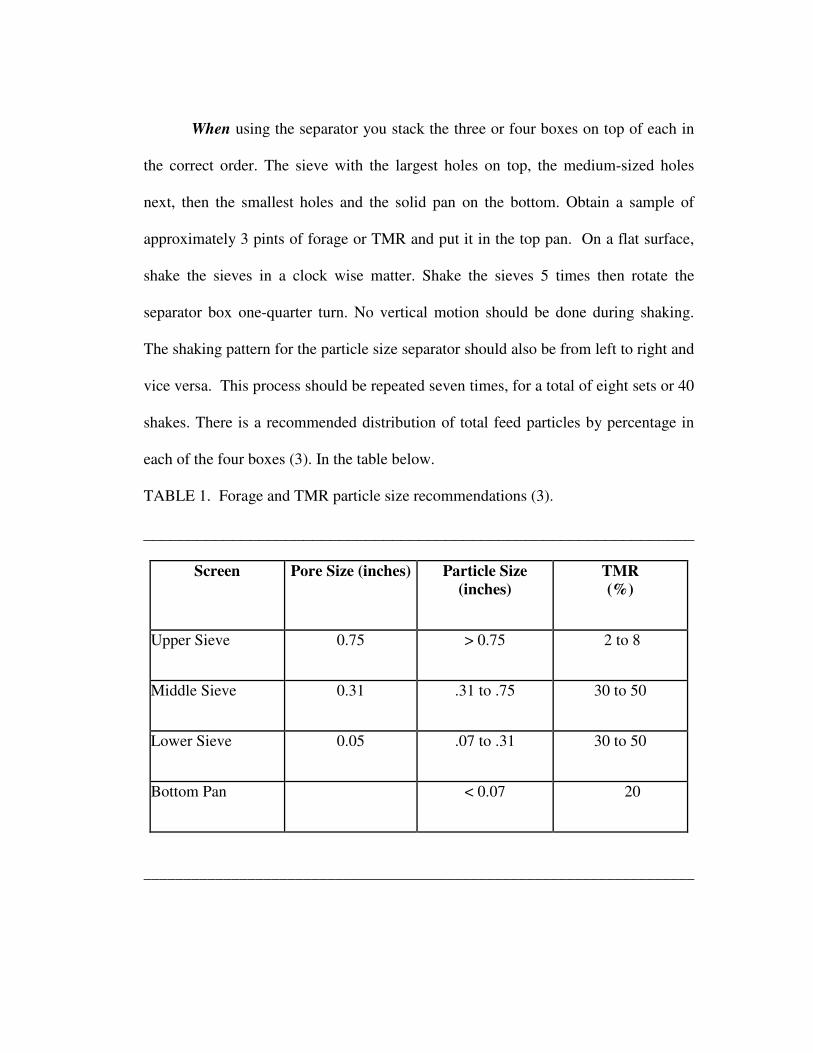
When using the separator you stack the three or four boxes on top of each in
the correct order. The sieve with the largest holes on top, the medium-sized holes
next, then the smallest holes and the solid pan on the bottom. Obtain a sample of
approximately 3 pints of forage or TMR and put it in the top pan. On a flat surface,
shake the sieves in a clock wise matter. Shake the sieves 5 times then rotate the
separator box one-quarter turn. No vertical motion should be done during shaking.
The shaking pattern for the particle size separator should also be from left to right and
vice versa. This process should be repeated seven times, for a total of eight sets or 40
shakes. There is a recommended distribution of total feed particles by percentage in
each of the four boxes (3). In the table below.
TABLE 1. Forage and TMR particle size recommendations (3).
______________________________________________________________
Screen Pore Size (inches) Particle Size
(inches)
TMR
(%)
Upper Sieve 0.75 > 0.75 2 to 8
Middle Sieve 0.31 .31 to .75 30 to 50
Lower Sieve 0.05 .07 to .31 30 to 50
Bottom Pan < 0.07 �20
_____________________________________________________________________

Particle Length
Importance of Particle Length
Dairy cows require adequate particle size to maintain a healthy functional
rumen. Reduced particle size has been shown to decrease the time spent chewing,
therefore cause a trend toward decreased rumen pH. Particle size has become very
hard to ensure because most commercial dairy rations contain high levels of
concentrate and high quality silages that are often finely chopped (4). Feed particles
that are too long are more likely to cause sorting in the ration and this destroys the
diet making it different from the originally formulated one. Management of forage
particle size starts with harvesting forages at the right stage of maturity (3). When
chopping the crop at the proper length it produces forages that can be utilized to get
the desired particle length in a TMR. Measuring the particle length of individual
forages is recommended for achieving the proper TMR particle size. Evaluating the
TMR helps to identify the distribution of feed and forage particles that the cow is
actually consuming. Distribution equipment and mixing can reduce particle size of
feeds and forages.
Effects of Fiber Length
Diets are highly fermentable in the rumen and aid to maximize milk
production (3). Even so these high fermentable diets can also lead to many metabolic
disorders. Subacute ruminal acidosis, displaced abomasums, milk fat depression, dry
matter intake, and fiber digestion depression, are all disorders that can occur due to

poor particle size (3). Dietary fiber is critical in preventing these disorders. Effective
fiber intake can affect chewing and saliva secretion. Fiber in long feed particles
greater than one centimeter promotes chewing and saliva secretion (3). More chewing
and saliva help neutralize the acids produced during ruminal digestion of feeds.
Saliva acts as a buffer in the rumen to elevate the pH. The fiber that promotes
chewing is physically effective (5).
Dry Matter Intake
Importance of TMR
Feeding a total mixed ration ideally results in rumen bacteria encountering the
same mixture of ingredients and nutrients that aids the cow’s rumen throughout the
day. Consistency also helps improve rumen fermentation (5). Cows need to consume
adequate amounts of long forages or fiber in their TMR so they can regurgitate the
feed, chew their cud, and secrete saliva. Saliva helps buffer the rumen environment so
that bacteria can efficiently digest forages. TMRs may also result in better intake by
the cow and improve her milk production, health, and reproductive performance (3).
Any minor inconsistencies and improperly followed guidelines of using the TMR can
also then decrease milk production and increase health problems. When feeding a
TMR it’s important to monitor the amount of TMR consumed. Monitor dry matter or
moisture content of forages and other wet byproducts being fed, amount of each feed
in a TMR batch, particle size of the TMR being feed, and consistency of the particle
size of the TMR being mixed, delivered, and left in the feed bunk (3).
Importance of Fiber Intake
Cows require sufficient neutral detergent fiber (NDF) in their diets to maintain
rumen function and to maximize milk yield (5). Dairy rations should generally
contain at least 25% NDF. A large portion of dietary NDF should come from forages.
Digestibility of NDF is an important part of forage quality because forage NDF varies
in its degradability in the rumen (4).
Rumen Health
Rumen pH
Rumen pH fluctuates within a 24-hour period and is not constant. However,
the rumen environment contains microbial populations that interact optimally within a
pH range of 6.1 to 7.2 (2). Cows that are high producing fed high concentrate diets at
greater than 45% of the ration generally have a ruminal pH that ranges from 6.6
before morning feeding to 5.3 or 5.0 during the intensive rumen fermentation phases
and an average pH is usually 6.0-6.1 (2).

Displaced Abomasum
Displaced abomasum is a condition in which the abomasum becomes enlarged
with fluid and/ or gas. The enlargement can be on the left or right and dorsally within
the abdominal cavity. Right displacement ( RDA) is usually accompanied by torsion
which prevents digest passage and makes a critical condition which will require
treatment immediately (6). The Left displacement (LDA) is usually associated with
gas accumulation. The most common form in the USA is LDA. More than 79% of
LDA are diagnosed within one month postpartum (6). The transition period is the
major risk period in the etiology of LDA (6). Nutrition has been implicated as a major
risk factor in the etiology of LDA. Feeding and management practices will be
important for prevention. Lead feeding; which is the practice of increasing
concentrates during the last two to three weeks prior to parturition has been a
common practice on commercial dairies. Limiting evidence has been that this practice
reduces postpartum disorders. As a part of management the feed bunk is another risk
factor for LDA through feed consumption and actual nutrient densities of the
consumed ration (6). Competition and insufficient bunk space may also limit feed
intake. Low feed intake may lower ruminal fill providing a migration to the
abomasum. Since LDA are at a greater risk during the early postpartum period due to
physiologic and metabolic changes in the transition cow it is recommended that the
concentrates should be fed at least three to four times daily (6).

Subacute ruminal acidosis (SARA)
Subacute ruminal acidosis has become a more common and economically
important problem for dairy cattle (2). Clinical signs can be overlooked easily.
Clinical signs include decreased dry matter intake, laminitis, rumenitis, liver
abscesses, and pulmonary bacterial emboli. SARA usually is characterized by
continuous depressed rumen pH between 5.2 and 5.6 (2). This is another disorder that
can be caused by cheap/ poor quality feed; large intake of rapidly fermentable
carbohydrates that result in accumulation of organic acids in the rumen. Four types of
cattle are at risk of developing SARA: transition cows, high DMI cows, and those that
are subject to a high degree of variability in their ration, meal patterns, and poorly
formulated diets. The ideal ration should be formulated to perform in the rumen and
is balanced between physically effective fiber and rumen fermentable carbohydrates
which results in salivary flow and microbial volatile fatty acids. Increasing the forage
amount in a ration also may increase rumination (2). Once again nutrition and feed
bunk management affect rumen health. Free stall overcrowding, poor bedding, and
even excessive parlor holding time may have an effect on feeding patterns and animal
behavior. The diagnosis of SARA in a herd or group is by obtaining the measurement
of the ruminal pH (2). There are many ways available for the collection of ruminal
fluid for analysis. It is also important when collecting a sample, that it is collected
from the same region of the rumen at each time due to various ruminal pH at different
locations of the rumen (2).

Materials and Methods
In this project separate TMR samples were collected from the Jersey and
Holstein herds at the dairy. These collections were used for the data and to be
evaluated based on particle size. Three groups of samples were collected to evaluate
the possible difference between Holstein and Jersey herd. These samples were
evaluated using the Penn State forage particle separator. The sample was collected
from the middle of the manger.
A second group of three samples were collected from the beginning, middle,
and end of the manger. The results of the beginning, middle, and end of the feeding
were collected in handfuls. For each container, five handfuls of TMR was collected.
These samples were then placed one sample at a time in the top box of the shaker.
The four plastic separator boxes were stacked on top of each other in the following
order: sieve with the largest holes on top, the medium-sized holes next (middle sieve),
then the smallest holes (bottom sieve), and the solid pan on the bottom. The shaker
box was placed on a flat surface. Shaking the boxes in one direction five times then
rotate the separator box one-quarter turn was the next step. This process was repeated
seven times for a grand total of eight sets (40 shakes), rotating the separator after each
set of five shakes. These procedures were done as recommended by the guidelines of
the Penn State Shaker box (3). After one complete set, the sample was then weighed
and recorded. There were a total of twenty samples recorded. Nine collections of
samples for the Jersey and Holstein herd had a beginning, middle, and end of the
manger recorded. The sample collected and recorded from the middle of the manger
for the Jersey and Holstein herd were done by students as a class assignment. This
sample was chosen based on consistency relative to the other samples collected from
the beginning, middle, and end.
RESULTS AND DISCUSSION
TMR meeting Penn State Guidelines
The following table shows the results for the first sample taken from the
Holstein TMR of the beginning, middle, and end.
TABLE 2. Holstein Sample 1 Results.
______________________________________________________________

Holstein
Sample
1
Beginning
(wt, %)
Middle
(wt, %)
End
(wt, %)
Upper Sieve 4.25 oz. 23% 4.25 oz. 26% 4.125 oz. 21%
Middle Sieve 5.125 oz. 28% 4 oz. 24% 5.25 oz. 27%
Lower Sieve 6.25 oz. 34% 5.375 oz. 33% 6.25 oz. 32%
Bottom Pan 2.75 oz. 15% 2.875 oz. 17% 4 oz. 20%
Total for weight
(oz)
18.375 100% 16.5 100% 19.625 100%
_____________________________________________________________________
The upper sieve exceeds the 2-8% Penn State TMR guidelines. It is evident that the
upper sieve has too much particles. The middle sieve ranges from 24-28% which is
just below the 30-50% recommendations. The lower sieve is within the 30-50%
recommended range. The lower sieve stayed within the lower end of the
recommendation and is adequate. In the bottom pan the three sample collection were
less than 20%.
The following table shows the result for the second sample taken from the
Holstein TMR.
TABLE 3. Holstein Sample 2 Results.
______________________________________________________________

Holstein
Sample
2
Beginning
(wt, %)
Middle
(wt, %)
End
(wt, %)
Upper Sieve 3.625 oz. 21% 4.25 oz. 22% 2.875 19%
Middle Sieve 5.125 oz. 30% 5 oz. 26% 4.125 oz. 27%
Lower Sieve 5.875 oz. 34% 6.375 oz. 33% 5.125 oz. 34%
Bottom Pan 2.5 oz. 15% 3.5 oz. 19% 3.125 oz. 20%
Total for weight
(oz)
17.125 100% 19.125 100% 15.25 100%
_____________________________________________________________________
The upper sieve samples collected are above the 2-8% recommendations. All are
above 19%. The middle sieve collections are close to the minimum recommendations
of 30-50%. Only the beginning sample of the middle sieve meets the
recommendations while the middle and end are about 3% below the minimum. All
samples in the lower sieve meet the 30-50% guidelines. The samples in the lower
sieve have been consistent in the first two samples.
In this table below it shows the results for the third and final collection of the
beginning, middle, and end in the Holstein TMR.
TABLE 4. Holstein Sample 3 Results.
______________________________________________________________

Holstein
Sample
3
Beginning
(wt, %)
Middle
(wt, %)
End
(wt, %)
Upper Sieve 4.375 oz. 22% 4.25 oz. 22% 3.875 22%
Middle Sieve 5.625 oz. 28% 5.5 oz. 28% 4.875 oz. 27%
Lower Sieve 6.875 oz. 34% 6.25 oz. 32% 6 oz. 32%
Bottom Pan 3.25 oz. 16% 3.5 oz. 18% 3.5 oz. 19%
Total for weight
(oz)
20.125 100% 19.5 100% 18.25 100%
_____________________________________________________________________
The top sieve samples were all above the 2-8 % recommendations. The end sample
was the lowest, being 19 %. In the middle sieve samples only the beginning met the
30-50 % recommendations at 30 %. The middle and end were below the minimum.
The lower sieve samples were all above 30 % and met the requirements. The bottom
pan samples were all below 20 % and met the recommendations.
In this table below it shows the results collected from the middle of the
manger.
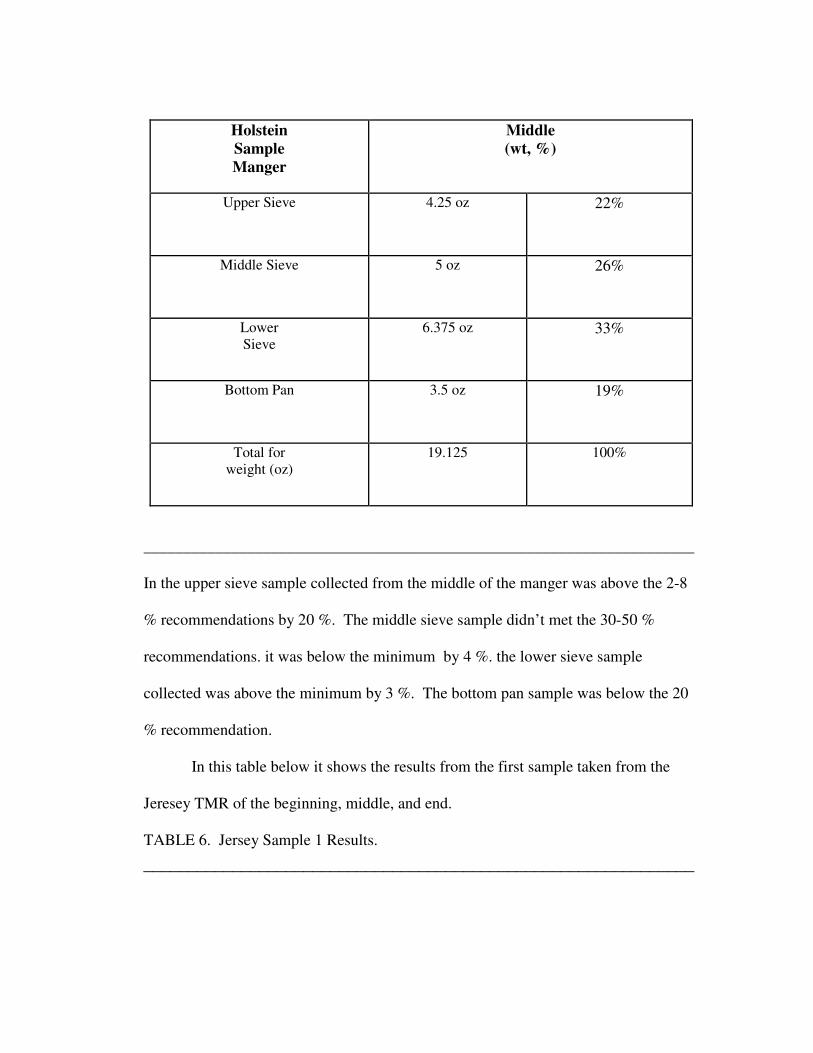
TABLE 5. Holstein Sample from Middle of Manger Results.
______________________________________________________________
Holstein
Sample
Manger
Middle
(wt, %)
Upper Sieve 4.25 oz
22%
Middle Sieve 5 oz
26%
Lower
Sieve
6.375 oz
33%
Bottom Pan 3.5 oz
19%
Total for
weight (oz)
19.125 100%
_____________________________________________________________________
In the upper sieve sample collected from the middle of the manger was above the 2-8
% recommendations by 20 %. The middle sieve sample didn’t met the 30-50 %
recommendations. it was below the minimum by 4 %. the lower sieve sample
collected was above the minimum by 3 %. The bottom pan sample was below the 20
% recommendation.
In this table below it shows the results from the first sample taken from the
Jeresey TMR of the beginning, middle, and end.
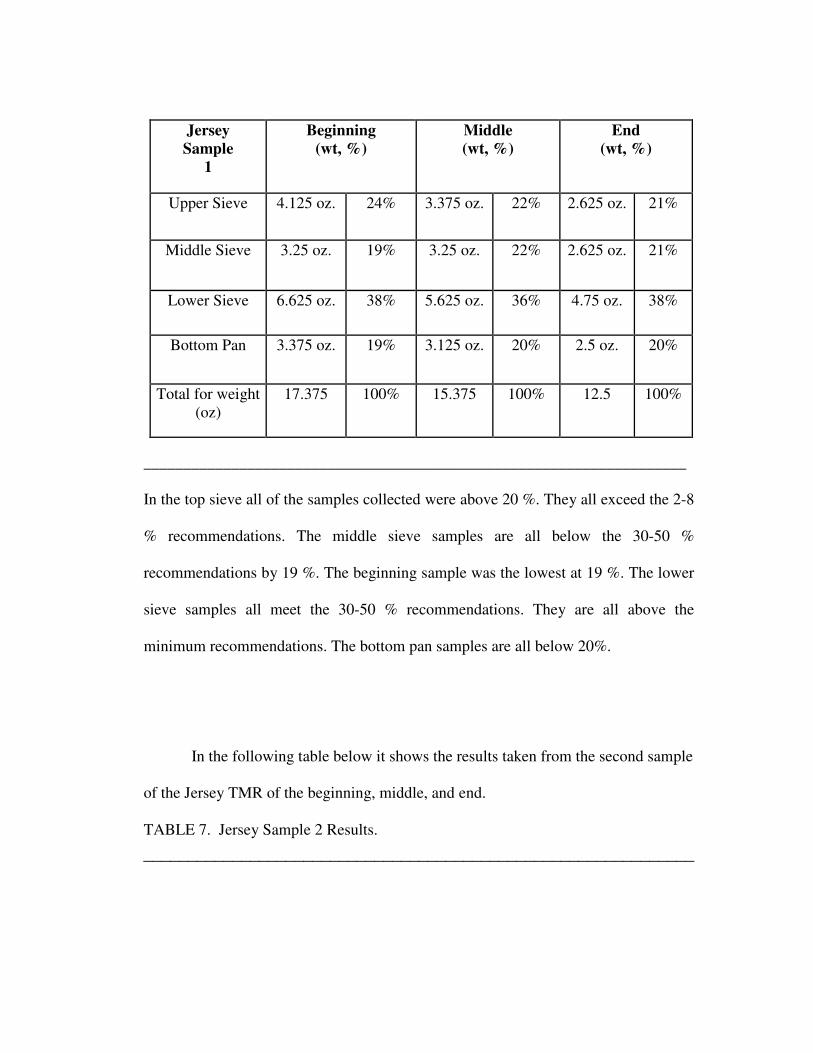
TABLE 6. Jersey Sample 1 Results.
______________________________________________________________
Jersey
Sample
1
Beginning
(wt, %)
Middle
(wt, %)
End
(wt, %)
Upper Sieve 4.125 oz. 24% 3.375 oz. 22% 2.625 oz. 21%
Middle Sieve 3.25 oz. 19% 3.25 oz. 22% 2.625 oz. 21%
Lower Sieve 6.625 oz. 38% 5.625 oz. 36% 4.75 oz. 38%
Bottom Pan 3.375 oz. 19% 3.125 oz. 20% 2.5 oz. 20%
Total for weight
(oz)
17.375 100% 15.375 100% 12.5 100%
____________________________________________________________________
In the top sieve all of the samples collected were above 20 %. They all exceed the 2-8
% recommendations. The middle sieve samples are all below the 30-50 %
recommendations by 19 %. The beginning sample was the lowest at 19 %. The lower
sieve samples all meet the 30-50 % recommendations. They are all above the
minimum recommendations. The bottom pan samples are all below 20%.
In the following table below it shows the results taken from the second sample
of the Jersey TMR of the beginning, middle, and end.
TABLE 7. Jersey Sample 2 Results.
______________________________________________________________

Jersey
Sample
2
Beginning
(wt, %)
Middle
(wt, %)
End
(wt, %)
Upper Sieve 3.875 oz. 22% 3.5 oz. 23% 3.75 oz. 21%
Middle Sieve 3.5 oz. 20% 3.125 oz. 21% 3.875 oz. 22%
Lower Sieve 6.625 oz. 37% 5.5 oz. 36% 6.5 oz. 36%
Bottom Pan 3.75 oz. 21% 3 oz. 20% 3.75 oz. 21%
Total for weight
(oz)
17.75 100% 15.125 100% 17.875 100%
_____________________________________________________________________
In the upper sieve all of the sample exceed the 2-8 % recommendations. All are above
20 % and are excessive. The middle sieve samples do not meet the 30-50%
recommendations. They are all below the minimum by atleast 8% . The lower sieve
samples are all above the minimum recommendations of 30%. Only the middle
bottom pan sample meets the recommendations. The beginning and end samples
exceed the recommendatoins by 1 %.
In the table below it show the results from the third and final sample of the
beginning, middle, and end collections of the Jersey TMR.
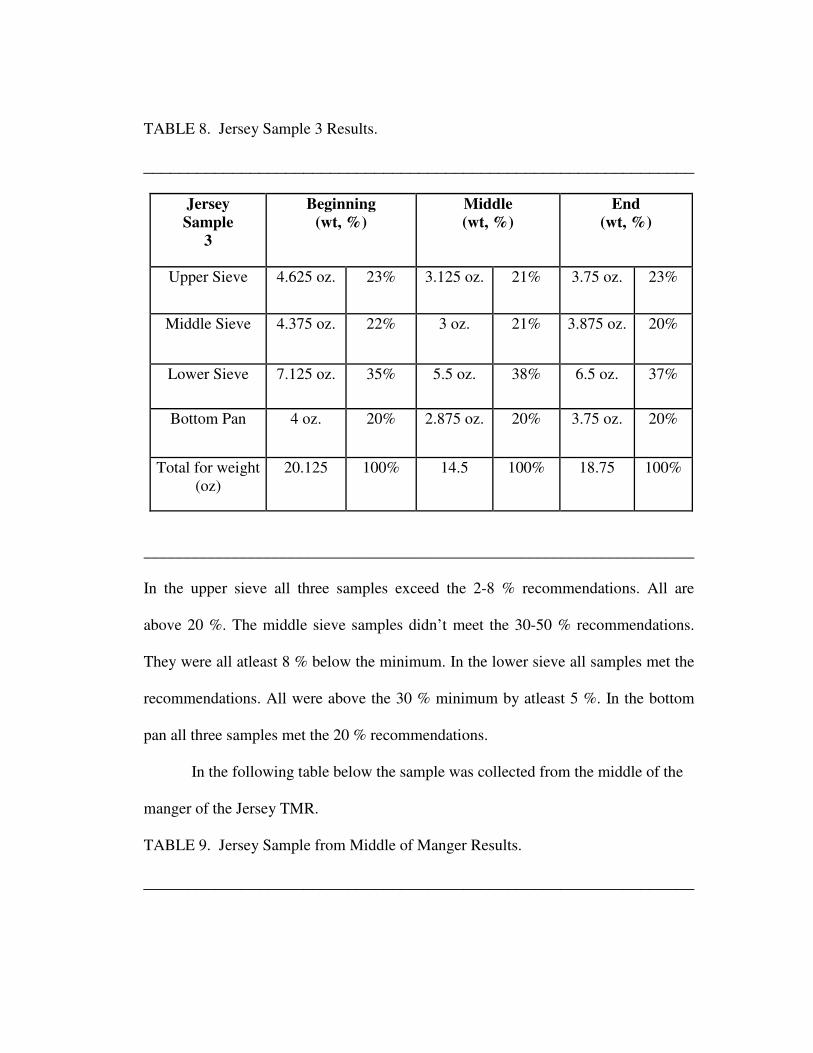
TABLE 8. Jersey Sample 3 Results.
______________________________________________________________
Jersey
Sample
3
Beginning
(wt, %)
Middle
(wt, %)
End
(wt, %)
Upper Sieve 4.625 oz. 23% 3.125 oz. 21% 3.75 oz. 23%
Middle Sieve 4.375 oz. 22% 3 oz. 21% 3.875 oz. 20%
Lower Sieve 7.125 oz. 35% 5.5 oz. 38% 6.5 oz. 37%
Bottom Pan 4 oz. 20% 2.875 oz. 20% 3.75 oz. 20%
Total for weight
(oz)
20.125 100% 14.5 100% 18.75 100%
_____________________________________________________________________
In the upper sieve all three samples exceed the 2-8 % recommendations. All are
above 20 %. The middle sieve samples didn’t meet the 30-50 % recommendations.
They were all atleast 8 % below the minimum. In the lower sieve all samples met the
recommendations. All were above the 30 % minimum by atleast 5 %. In the bottom
pan all three samples met the 20 % recommendations.
In the following table below the sample was collected from the middle of the
manger of the Jersey TMR.
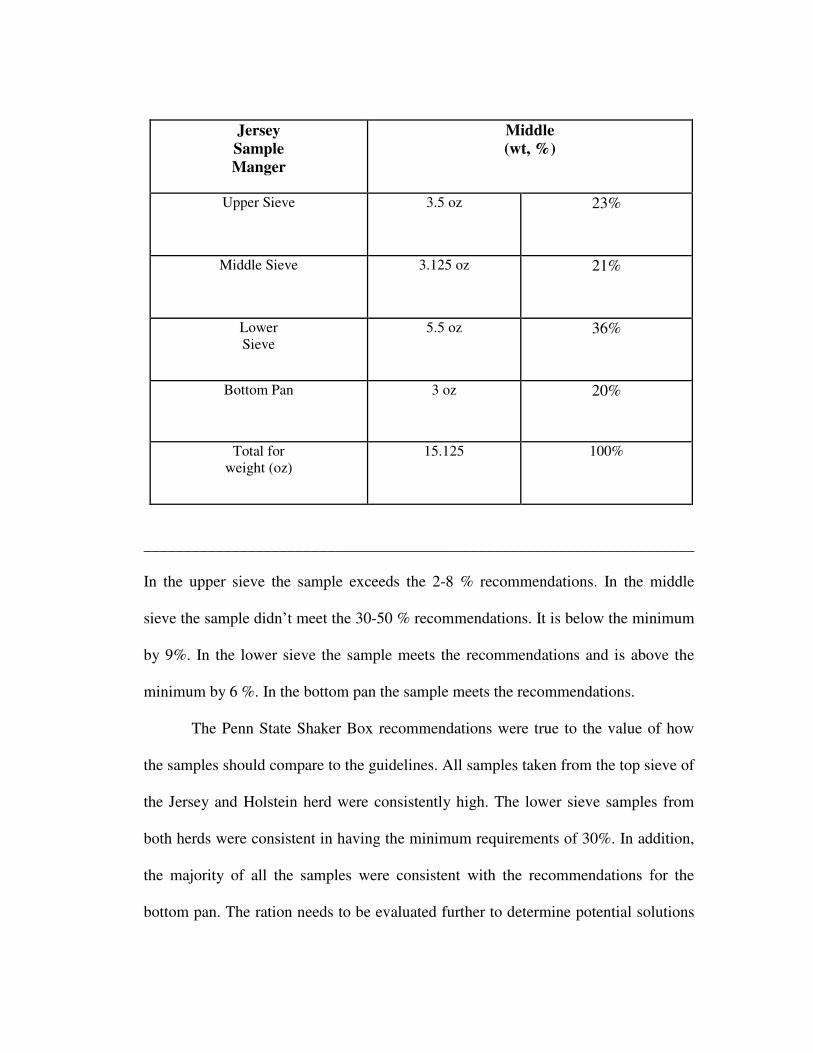
TABLE 9. Jersey Sample from Middle of Manger Results.
______________________________________________________________
Jersey
Sample
Manger
Middle
(wt, %)
Upper Sieve 3.5 oz
23%
Middle Sieve 3.125 oz
21%
Lower
Sieve
5.5 oz
36%
Bottom Pan 3 oz
20%
Total for
weight (oz)
15.125 100%
_____________________________________________________________________
In the upper sieve the sample exceeds the 2-8 % recommendations. In the middle
sieve the sample didn’t meet the 30-50 % recommendations. It is below the minimum
by 9%. In the lower sieve the sample meets the recommendations and is above the
minimum by 6 %. In the bottom pan the sample meets the recommendations.
The Penn State Shaker Box recommendations were true to the value of how
the samples should compare to the guidelines. All samples taken from the top sieve of
the Jersey and Holstein herd were consistently high. The lower sieve samples from
both herds were consistent in having the minimum requirements of 30%. In addition,
the majority of all the samples were consistent with the recommendations for the
bottom pan. The ration needs to be evaluated further to determine potential solutions
to reduce the amount of feed in the top sieve. Possible solutions are: 1) The ration
needs to be adjusted. 2) The feed mixer needs to cut the larger particles finer. 3)
Forages such as forage silage need to be more finely cut at harvest.
CONCLUSION
Particle size has many effects on the cow. Adequate forage particle length is
necessary for proper rumen function. Dairymen are also having a hard time
measuring particle size. Proper particle size distribution of feeds is an important part
of ration formulation. Management of forage particle size starts with harvesting
forages at the proper stage of maturity. Chopping the crop at the right length helps to
achieve the desired particle length in a TMR. Measuring particle length of the forages
is only a portion of the solution. Analyzing the TMR particle size is the main goal in
measuring the distribution of feed and forage particles that the cows are truly
consuming.
The Penn State Shaker box aids dairymen in allowing them to see if their
rations from the manger are consistent throughout each feeding. Making sure the
rations are consistent is very important and can help resolve issues due to nutrition.
The results from the samples collected, were all relatively consistent within the
groups of the Jersey and Holstein herd. The lower sieves along with the bottom pan
were within the Penn State Shaker box recommendations. The top sieve was
consistent in all samples recorded. They exceeded the 2-8% recommendations. The
middle sieve fluctuated in some samples, while a significant portion of them were
below the 30-50% recommendations. With these results, the TMR can be looked over
and changes to the ration can be made to get the right amount of particles in each
sieve to meet the recommendations. Even though the Jersey and Holstein herds were
compared it is evident that both of the formulated rations have too much particles in
the top sieve. The rations for both herds need to be evaluated further to determine
potential solutions to reduce the amount of feed on the top sieve. Possible solutions
are: 1) The ration needs to be adjusted. 2) The feed mixer needs to cut the larger
particles finer. 3) Crops that are used for forage silage need to be more finely cut at
harvest.
The Penn State Forage Particle Separator is a simple and effective “on farm”
way to quantify chopping results. In addition to analyzing forage and particle size the
particle separator can help monitor feed bunk sorting and can help in trouble shooting
feeding, metabolic, or production problems on the dairy. This project is a great way to
show how using the Penn State shaker box can help determine what cows are actually
consuming, if the particle sizes are adequate for rumen function, how to improve
forage and TMR intake for the herd, and improve management of overall nutrition.
REFERENCES

1. Beauchemin, K. A. 2002. Subject: applying nutritional management to rumen
health. http://dasweb.psu.edu. Accessed October 18, 2009.
2. Garrett,E. F., M.N. Pereira, K.V. Nordlund, L.E. Armentano, W. J. Godger,
and G. R. Oetzel. 1999. Diagnostic methods for the detection of subacute
ruminal acidosis in dairy cows. J. Dairy Science. 82:6 1170-1178.
3. Heinrichs, A. J. and P. Kononoff. 2002. Subject: the new Penn state shaker
box. http://das.psu.edu/dairy/dairy-nutrition/pdf-dairy-nutrition/evaluating-
particle-size-of-forages.pdf. Accessed October 15, 2009.
4. Heinrichs, A. J., D. R. Buckmaster, and B. P. Lammers. 1999. Processing,
mixing, and particle size reduction of forages for dairy cattle. J. Animal
Science. 77: 1 180-186.
5. Keunen, J. E., J.C. Plaizier, L. Kyriazakis, T.F. Duffield, T.M. Widowski, M.I.
Lindinger, and B.W. McBride. 2002. Effects of a subacute ruminal acidosis
model on the diet selection of dairy cows. J. Dairy Science. 85:12 3304-3313.
6. Kononoff, P. J., A. J. Heinrichs. 2003. The effect of corn, silage particle, and
cottonseed hulls on cows in early lactation. J. Dairy Science. 86: 2438-2451.
7. Kononoff, P. J., A. J. Heinrichs, and D. R. Buckmaster. 2003. Modification of
the Penn State Forage and Total Mixed Ration Particle Separator and the
Effects of Moisture Content on its Measurements. J. Dairy Science. 86: 1858-
1863.
8. Krause, K.M., D.K. Combs, K.A. Beauchemin. 2002. Effects of forage particle
size and grain fermentability in mid lactation cows. J. Dairy Science. 85: 8
1947-1957.
9. Maekawa, M., K. A. Beauchemin, and D. A. Christensen. 2002. Effect of
Concentrate Level and Feeding Management on Chewing Activities, Saliva
Production, and Ruminal pH of Lactating Cows. J. Dairy Science. 85: 5 1165-
1175.
10. Yang, W. Z., K. A. Beauchemin, and L. M. Rode. 2001. Effects of Grain
Processing, Forage to Concentration Ratio, and Forage Particle Size on Rumen
pH and Digestion by Dairy Cows. J. Dairy Science. 84:10 2203-2216.