USACHPPM REPORT NO. 12-MA-05SBA-08A INJURY … · usachppm report no. 12-ma-05sba-08a injury...
86
USACHPPM REPORT NO. 12-MA-05SBA-08A INJURY REDUCTION EFFECTIVENESS OF PRESCRIBING RUNNING SHOES BASED ON FOOT SHAPE IN AIR FORCE BASIC MILTARY TRAINING U.S. Army Center for Health Promotion and Preventive Medicine Aberdeen Proving Ground, MD Approved for public release; distribution is unlimited
Transcript of USACHPPM REPORT NO. 12-MA-05SBA-08A INJURY … · usachppm report no. 12-ma-05sba-08a injury...

USACHPPM REPORT NO. 12-MA-05SBA-08A
INJURY REDUCTION EFFECTIVENESS
OF PRESCRIBING RUNNING SHOES BASED ON FOOT SHAPE
IN AIR FORCE BASIC MILTARY TRAINING
U.S. Army Center for Health Promotion and Preventive Medicine Aberdeen Proving Ground, MD
Approved for public release; distribution is unlimited

REPORT DOCUMENTATION PAGE
Form Approved OMB No. 0704-0188
The public reporting burden for this collection of information is estimated to average 1 hour per response, including the time for reviewing instructions, searching existing data sources, gathering and maintaining the data needed, and completing and reviewing the collection of information. Send comments regarding this burden estimate or any other aspect of this collection of information, including suggestions for reducing the burden, to Department of Defense, Washington Headquarters Services, Directorate for Information Operations and Reports (0704-0188), 1215 Jefferson Davis Highway, Suite 1204, Arlington, VA 22202-4302. Respondents should be aware that notwithstanding any other provision of law, no person shall be subject to any penalty for failing to comply with a collection of information if it does not display a currently valid OMB control number. PLEASE DO NOT RETURN YOUR FORM TO THE ABOVE ADDRESS. 1. REPORT DATE (DD-MM-YYYY)
AUGUST 2008 2. REPORT TYPE
FINAL 3. DATES COVERED (From – To)
APRIL 2007–JULY2007 5a. CONTRACT NUMBER 5b. GRANT NUMBER
4. TITLE AND SUBTITLE Injury Reduction Effectiveness of Prescribing Running Shoes Based on Foot Shape in Air Force Basic Military Training
5c. PROGRAM ELEMENT NUMBER 5d. PROJECT NUMBER 5e. TASK NUMBER
6. AUTHOR(S) Joseph J Knapik, Lorie C Brosch, Margaret Venuto, David I Swedler, Steven H Bullock, Lorraine S Gaines, Ryan J Murphy, Sara E Canada, Edward L Hoedebecke, Steven K Tobler, Juste Tchandja, Bruce H Jones
5f. WORK UNIT NUMBER
7. PERFORMING ORGANIZATION NAME(S) AND ADDRESS(ES) 37th Medical Group, Lackland Air Force Base, TX US Army Center for Health Promotion and Preventive Medicine, Aberdeen Proving Ground MD
8. PERFORMING ORGANIZATION REPORT NUMBER
12-MA-05SBA-08A
10. SPONSOR/MONITOR’S ACRONYM(S)
DSOC, MTTF 9. SPONSORING/MONITORING AGENCY NAME(S) AND ADDRESS(ES)
Defense Safety Oversight Council, Military Training Task Force, Pentagon, Washington DC
11. SPONSOR/MONITOR’S REPORT NUMBER(S)
12. DISTRIBUTION/AVAILABILITY STATEMENT
Approved for public release; distribution is unlimited 13. SUPPLEMENTARY NOTES 14. ABSTRACT In response to a request from the Military Training Task Force of the Defense Safety Oversight Council, this study examined whether prescribing running shoes based on the shape of the plantar surface influenced injury risk in Air Force Basic Military Training (BMT). After foot examinations, BMT recruits in an experimental group (E, n=1,042 men, 375 women) were prescribed motion control, stability, or cushioned shoes for plantar shapes indicative of low, medium, or high arches, respectively. A control group (C, n=913 men, 346 women) received a stability shoe regardless of plantar shape. Injuries during BMT were determined from outpatient visits provided by the Army Medical Surveillance Activity (now the Armed Forces Health Surveillance Center). Other known injury risk factors (e.g., fitness, smoking) were obtained from a questionnaire, existing databases or BMT units. Multivariate Cox regression controlling for other risk factors showed little difference between the E and C groups among men (hazard ratio(E/C)=1.11, 95% confidence interval=0.89–1.38) or women (hazard ratio(E/C)=1.14, 95% confidence interval = 0.85–1.55). This prospective study demonstrated that prescribing shoes on the basis of the shape of the plantar foot surface had little influence on injury risk in BMT even after control of other injury risk factors. 15. SUBJECT TERMS: Physical fitness, physical activity, height, weight, body mass index age, arch height, smoking, education, race, marital status, prior injuries, menstrual history, pregnancy, birth control, push-ups, sit-ups, 1.5 mile run. 16. SECURITY CLASSIFICATION OF: UNCLASSIFIED
19a. NAME OF RESONSIBLE PERSON
Dr. Joseph Knapik a. REPORT
Unclassified b. ABSTRACT
Unclassified c. THIS PAGE
Unclassified
17. LIMITATION OF ABSTRACT
18. NUMBER OF PAGES
19b. TELEPHONE NUMBER (include area code)
410-436-1328 Standard Form 298 (Rev.8/98) Prescribed by ANSI Std. Z39.18

DEPARTMENT OF THE ARMY US ARMY CENTER FOR HEALTH PROMOTION AND PREVENTIVE MEDICINE
5158 BLACKHAWK ROAD ABERDEEN PROVING GROUND MD 21010-5403
MCHB-TS-DI
Readiness thru Health
EXECUTIVE SUMMARY USACHPPM REPORT NO. 12-MA-05SBA-08A
INJURY REDUCTION EFFECTIVENESS OF PRESCRIBING RUNNING SHOES BASED ON FOOT SHAPE IN AIR FORCE BASIC MILTARY TRAINING
1. INTRODUCTION AND PURPOSE. a. In 2003, the Secretary of Defense directed the Department of Defense to reduce preventable mishaps or injuries by 50%. The Under Secretary of Defense for Personnel and Readiness responded by establishing the Defense Safety Oversight Council (DSOC), which chartered nine task forces to develop recommendations to reduce preventable injuries. One of these, the Military Training Task Force (MTTF), worked to decrease injuries during military training activities. Each year the MTTF prioritized a number of projects directed at training-related injury reduction. In 2005, the MTTF ranked military physical training footwear prescription and trainee fitness fifth out of 21 projects. b. The practice at the time of this study in the United State Air Force was to provide a single running shoe to recruits entering Basic Military Training (BMT). However, in Army and Marine basic training new recruits are prescribed running shoes based on the amount of foot surface contacting the floor (i.e., plantar shape). The plantar shape during weight-bearing is presumed to reflect the longitudinal foot arch height. Shoe manufacturers market three classes of running shoes designed for individuals with high, normal, and low arches: cushion, stability, and motion control, respectively. These shoes presumably reduce injuries by compensating for hypothetical differences in running mechanics. The major purpose of this study was to determine whether or not injury risk can be reduced by prescribing running shoes based on the static weight-bearing plantar foot shape. Secondary purposes were to 1) examine the association between the shape of the plantar foot surface and actual arch height, 2) examine the relationship between arch height and injuries, and 3) examine risk factors for injuries in BMT. 2. METHODS. a. Participants were male and female volunteers engaged in BMT at Lackland Air Force Base, Texas. Just prior to BMT, subjects were administered a questionnaire that asked about tobacco use, physical activity, injury history, and (for women) menstrual history. To determine the shape of the plantar surface of the foot (plantar shape), the barefoot subject mounted an illuminated device that reflected the underside of the foot. Two observers made independent

EXSUM, USACHPPM Epidemiological Report No. 12-MA-05SBA-08A
ES-2
determinations of the plantar shape as high, normal, or low based on templates: more area in the middle third of the plantar surface indicated a low plantar shape and less area a high plantar shape. After the plantar shape determinations, subjects’ longitudinal foot arch heights were measured with a digital caliper as the distance from standing surface to the inferior medial border of the navicular tuberosity. b. Subjects were randomized into either an experimental (E) or control (C) group. The C group subjects received a New Balance 498 (stability shoe) regardless of plantar shape. The E group subjects received a shoe based on their plantar shape: if the E group subject had a low plantar shape, a New Balance 587 (motion control shoe) was provided; if the E group subject had a high plantar shape, a New Balance 755 (cushion shoe) was provided; if the E group subject had a normal plantar shape, a New Balance 498 (stability shoe) was provided. c. Injury data was obtained from the Defense Medical Surveillance System (DMSS, now the Armed Forces Health Surveillance Center). The DMSS regularly incorporates data on ambulatory (outpatient) encounters that occur within military treatment facilities (MTFs) as well as those that occur outside the MTFs but are paid for by DOD. The DMSS provided visit dates and ICD-9 codes for all outpatient medical visits within the BMT timeframe of each subject. Injuries were determined using standard ICD-9 codes. Additional data obtained included attrition from training, physical fitness test scores (push-ups, crunches, and 1.5-mile run), physical characteristics (height, weight, body mass index, abdominal circumference), and demographics (date of birth, component, educational level, marital status, race). 3. RESULTS. a. There were 2,167 men and 854 women who volunteered for the study during their inprocessing just prior to officially beginning BMT. Subjects were excluded from the analysis if 1) they did not actually enter BMT for medical or administrative reasons or 2) they were recycled in training (the recycle database did not have the day the subject was recycled so the time at risk could not be determined). The final cohort considered for analysis consisted of 1,979 men and 723 women. b. Injury rates during the 6-week BMT period differed little between the E and the C groups among the men (E=7.0, C=6.4 injuries/1000 person days, p=0.30) or the women (E=13.0, C=10.9 injuries/1000 person-days, p=0.11). Univariate Cox regression (a survival analysis technique) found little difference in injury risk among E and C men (hazard ratio (E/C)=1.09, 95%confidence intervals (95%CI)=0.92–1.29); however, E women tended to have higher injury risk than C women (hazard ratio (E/C)=1.23. 95%CI=1.00–1.53). In multivariate Cox regression controlling for other known injury risk factors, there was little difference in injury risk among E and C groups for either men (hazard ratio (E/C)=1.11, 95%CI=0.89–1.38) or women (hazard ratio (E/C)=1.14, 95%CI=0.85–1.55).

EXSUM, USACHPPM Epidemiological Report No. 12-MA-05SBA-08A
ES-3
c. Factors significantly associated with injury risk in both men and women included slower 1.5-mile run times and cigarette smoking prior to BMT. Men were also at higher risk if they had lower body mass index, performed fewer push-ups or abdominal crunches, were of Black race, or were of “other” marital status (i.e., divorced, widowed, or separated). Women were also at higher injury risk if they had higher body mass index, low educational status (not high school graduate), were of White or Black race (relative to Asian), or had run less frequently or for a shorter period of time prior to BMT. d. Individuals with lower measured foot arch heights (lower 20% of cases) had higher injury risk than those with normal arch heights (middle 60% of cases) or high arch heights (higher 20% of cases). For the right foot, low-arched men had injury risk 1.43 (95%CI=1.15–1.78) higher than those with normal arch heights; low-arched women had injury risk 1.41 (95%CI=1.07–1.89) higher than those with normal arch heights. e. Plantar shapes of low to normal to high had mean arch height in the expected direction. For the right foot arch of the men, plantar shapes rated as low, normal, and high had average±standard deviation arch heights (cm) of 27.6±5.7, 36.0±7.3, and 38.7±7.6, respectively (p<0.01); for women, these values were 25.2±5.7, 33.2±6.4 and 36.1±6.2, respectively (p<0.01). Arch heights were separated into the percentile distributions found in the plantar shapes and a “match” was defined as an arch height percentile that matched the low, normal, and high plantar shape percentile. Overall, arch height percentiles were matched to plantar shape percentiles only 64% of the time. Normal plantar shapes had the largest numbers of matches (over 75%) with high and low plantar shapes matching only 24% to 49% of the time, respectively. 4. CONCLUSIONS. a. This prospective study demonstrated that prescribing running shoes based on the static weight-bearing plantar foot surface shape had little influence on injury risk in BMT, after controlling for other injury risk factors. There was little difference in injury risk among those who were prescribed a shoe (motion control, stability, or cushion) based on plantar shape and those who received a stability shoe regardless of plantar shape. b. Individuals in the lower 20th percentile of arch heights tended to be at higher risk of injury during BMT. c. Plantar foot shapes visually judged as low, normal, and high had progressively higher average arch heights. Despite this, there were a considerable number of mismatches when plantar shapes were matched with corresponding percentiles of arch heights. Arch heights matched corresponding percentiles of measured plantar shapes only about 64% of the time, overall.

EXSUM, USACHPPM Epidemiological Report No. 12-MA-05SBA-08A
ES-4
d. This is the first study examining injury risk factors in US Air Force BMT. In consonance with previous Army data and some Marine data, injury risk was higher among men and women who were of lower physical fitness and/or who were cigarette smokers. Men were also at higher risk if they had lower body mass index, were of Black race, or were of “other” marital status (divorced, widowed, or separated). Women were also at higher injury risk if they had higher body mass index, low educational status (not high school graduate), were of White or Black race (relative to Asian), or had run less frequently or for a shorter period of time prior to BMT. 5. RECOMMENDATION. If the goal is injury prevention, it is not necessary to prescribe running shoes to BMT recruits based on a visual inspection of the static, weight-bearing plantar shape. Prescribing running shoes to BMT recruits on this basis was no more protective against injury than issuing a single shoe regardless of plantar shape. Other procedures need to be considered to prevent injuries in recruits with lower arch heights, since they appear to be at higher injury risk. It is still recommended that recruits receive a new shoe on entry to BMT, since older shoes have previously been shown to be associated with increase injury risk.

USACHPPM Epidemiological Report No. 12-MA-05SBA-08A
CONTENTS 1. REFERENCES ................................................................................................................ 1 2. INTRODUCTION AND PURPOSE ............................................................................... 1 3. AUTHORITY .................................................................................................................. 2 4. BACKGROUND ............................................................................................................. 2
a. Gait Mechanics and Characteristics of Running Shoes ............................................. 2 b. Running Shoe Functions ............................................................................................ 3 c. Foot Arch Height and Injuries ................................................................................... 6 d. Injuries and Footwear ................................................................................................ 7 e. Injury Incidence and Injury Risk Factors in Basic Training...................................... 9 5. METHODS ........................................................................................................................ 11 a. Subjects and Study Design......................................................................................... 11 b. Initial Testing Procedures .......................................................................................... 11 c. Running Shoe Prescription ........................................................................................ 14 d. Attrition from Training .............................................................................................. 14 e. Physical Fitness Test Scores ...................................................................................... 14 f. Physical Characteristics ............................................................................................. 15 g. Demographics ............................................................................................................ 15 h. Injury Outcome Measures.......................................................................................... 15 i. Data Analysis ............................................................................................................. 16 6. RESULTS ........................................................................................................................ 17 a. Participants and Attrition ........................................................................................... 17 b. Comparisons of E and C Groups ............................................................................... 18 c. Injury Rates and Injury Risk Factors ......................................................................... 24 d. Comparison of Plantar Surface Determination with Arch Height and Arch Indices. 32 7. DISCUSSION.................................................................................................................. 36 a. Plantar Surface Determination and Measured Arch Height and Arch Indices .......... 39 b. Foot Arch Height, Foot Indices, and Injuries. ........................................................... 40 c. Injury Rates in BMT .................................................................................................. 42 d. Injury Risk Factors..................................................................................................... 43 e. Comparison of Physical Characteristics and Demographics with Previous
Air Force Data.................................................................................................................. 48 f. Comparison of Physical Characteristics and Lifestyle Variables in Current
and Army Study ............................................................................................................... 49 8. CONCLUSIONS.............................................................................................................. 52 9. RECOMMENDATION ................................................................................................... 52

USACHPPM Epidemiological Report No. 12-MA-05SBA-08A
ii
Appendices A. REFERENCES ................................................................................................................ A-1 B. REQUEST LETTER........................................................................................................ B-1 C. APPROVAL TO CONDUCT STUDY ........................................................................... C-1 D. LIFESTYLE QUESTIONNAIRE ................................................................................... D-1 E. ACKNOWLEDGEMENTS............................................................................................. E-1 Figures 1. Plantar Foot Shape Device............................................................................................... 12 2. Device Used to Measure Foot Arch Height ..................................................................... 13 3. Foot Length and Arch Height Measurements Being Taken on a Subject........................ 14 4. Comparison of Measured Arch Height with Plantar Foot Shape .................................... 34 Tables 1. Cumulative Incidence of Injury and Injury Incidence Rates during Army, Navy, Marine and Air Force Basic Training .................................................................................... 10 2. Group Comparisons for Age, Physical Characteristics, and Fitness Scores at Start of Training ............................................................................................................................. 18 3. Group Comparisons on Physical Characteristics and Fitness Test Scores Pre- and Post-BMT........................................................................................................................ 19 4. Changes in Physical Characteristics and Fitness Scores with Both Groups Combined .. 19 5. Group Comparisons on Demographic Characteristics..................................................... 20 6. Group Comparisons on Ordinal/Nominal Questionnaire Variables ................................ 21 7. Group Comparisons on Continuous Questionnaire Variables ......................................... 23 8. Distribution of Subjects by Plantar Shape ....................................................................... 23 9. Group Comparisons on the Foot Measures and Arch Indices ......................................... 24 10. Medical Information Requested and Returned from the Army Medical Surveillance Activity .............................................................................................................................. 24 11. Comparison of Injury Incidence Rates between the E and C Groups.............................. 25 12. Injury Hazard Ratios by Group, Age, Physical Characteristics, and Fitness Test Scores (Univariate Cox Regression).................................................................................................. 26 13. Injury Hazard Ratios for Demographic Characteristics (Univariate Cox Regression).... 27 14. Injury Hazard Ratios for Questionnaire Variables (Univariate Cox Regression)............ 27 15. Injury Hazard Ratios for Plantar Surface Evaluations (Univariate Cox Regression) ...... 29

USACHPPM Epidemiological Report No. 12-MA-05SBA-08A
iii
Tables (continued) 16. Injury Hazard Ratios for Arch Height and Arch Indices (Univariate Cox Regression) .. 30 17. Injury Hazard Ratios for Study Variables (Multivariate Cox Regression)...................... 30 18. Injury Hazard Ratios by Group and Plantar Foot Shape (Univariate Cox Regression)... 31 19. Injury Hazard Ratios Comparing E and C Groups within Each Plantar Foot Shape (Univariate Cox Regression).................................................................................................. 32 20. Injury Hazard Ratios by Group with Only High/Low-Arched Individuals by Plantar Surface Evaluation (Univariate Cox Regressions) ............................................................... 32 21. Plantar Surface Determination and Corresponding Arch Height and Arch Indices ........ 33 22. Classification of Subjects by Plantar Surface Determination and Measured Arch Height and Arch Indices .................................................................................................................... 35 23. Comparison of Army and Air Force Studies Examining the Efficacy of Prescribing Running Shoes Based on Plantar Surface Prescription.......................................................... 37 24. Comparison of Army and Air Force Studies Including Only High and Low Plantar Surface Individuals (Univariate Cox Regression Analyses).................................................. 38 25. Comparison of Army and Air Force Studies Including Only C Subjects Who Wore the Stability Shoe Regardless of Plantar Shape (Univariate Cox Regression Analyses) ............ 38 26. Comparison of Arch Heights and Arch Indices in Current Study and in Study of Cowan et al. .......................................................................................................................... 41 27. Comparison of Arch Heights, Arch Indices, and Foot Lengths in Current Air Force Study and in Previous Army Study........................................................................................ 42 28. Comparison of Injury Incidence and Injury Rate in Current Study and that of Snedecor et al. .............................................................................................................................. 43 29. Injury Hazard Ratios for Age and Marital Status (Multivariate Cox Regression) .......... 47 30. Comparison of Physical Characteristics in Present and Past (1994–1995) Study........... 48 31. Comparison of Demographics in Present and Past (1994–1995) Study.......................... 49 32. Comparison of Physical Characteristics in Current Study and Army Study ................... 50 33. Comparison of Lifestyle Variables in Current Air Force Study and Previous Army Study............................................................................................................................ 50

USACHPPM REPORT NO. 12-MA-05SBA-08A INJURY REDUCTION EFFECTIVENESS OF PRESCRIBING RUNNING SHOES
BASED ON FOOT SHAPE IN BASIC MILITARY TRAINING
1. REFERENCES. Appendix A contains the scientific/technical references used in this report. 2. INTRODUCTION AND PURPOSE. a. In 2003, the Secretary of Defense directed the Department of Defense to reduce preventable mishaps or injuries by 50%. In 2006, the goal became to reduce preventable mishaps or injuries by 75%. The Under Secretary of Defense for Personnel and Readiness responded to the directive by establishing the Defense Safety Oversight Council (DSOC), which chartered nine task forces to develop recommendations for policies, programs, and investments to reduce preventable injuries and accidents. One of these task forces, the Military Training Task Force (MTTF), sought to validate solutions to reduce the risk of injury during military training activities. Each year the MTTF prioritized a number of projects directed at training-related injury reduction. In 2005, the MTTF ranked military physical training footwear prescription and trainee fitness fifth out of 21 projects. The chairman of the MTTF requested the assistance of the United States (US) Army Center for Preventive Medicine (CHPPM) and the Naval Health Research Center in organizing a triservice effort to address footwear prescription. b. The practice in the United State Air Force (USAF) at the time of the study was to provide a single running shoe to recruits entering Basic Military Training (BMT). However, in Army and Marine basic training new recruits were prescribed running shoes based on the amount of foot surface contacting the floor (i.e., the shape of the plantar foot surface). The plantar foot shape during weight-bearing is presumed to reflect foot arch height. Shoe manufacturers market three classes of running shoes designed for individuals with high, normal, and low arches: cushion, stability, and motion control, respectively. These shoes presumably reduce injuries by compensating for presumed differences in running mechanics (1). At the time this study was conceived there was insufficient evidence in the scientific literature to determine whether this strategy does, in fact, reduce injuries (2). c. The major purpose of this study was to determine whether or not injury risk can be reduced by prescribing running shoes based on the static weight-bearing plantar foot shape in USAF BMT. There were three secondary purposes to this study. As noted above, the shape of the plantar foot surface is assumed to reflect foot arch height, but this assumption has not been examined. Thus, a secondary purpose was to examine the association between the shape of the plantar foot surface and arch height. A few studies have suggested that a relationship may exist between injuries and foot arch height (3, 4). Thus, another secondary purpose was to examine the relationship between arch height and injuries. Finally, this study also presents the

USACHPPM Epidemiological Report No. 12-MA-05SBA-08A
2
opportunity to see if fitness and lifestyle factors that are known to increase injury risk in Army and Marine Corps basic training (5-7) also increase injury risk in Air Force BMT. One previous study of BMT (8) examined injury rates but did not investigate injury risk factors. 3. AUTHORITY. a. Under Army Regulation 40-5 (9), the US Army Center for Health Promotion and Preventive Medicine (CHPPM) is responsible for providing epidemiological consultation services upon request. This project was initiated by the MTTF of the DSOC and a letter of request is in Appendix B. The studies recruited Service Members participating in basic training in the Army, Air Force, and Navy. Personnel from Lackland Air Force Base collected BMT recruit data but did not have the local expertise to analyze the data. At the request of the Chief, Trainee Health Preventive Medicine, Wilford Hall Medical Center, Lackland Air Force Base, CHPPM agreed to assist with design implementation, analyze the data, and complete the scientific report on the project. b. Employing the criteria of the Council of the State and Territorial Epidemiologists (10), it was determined that this project constituted research. Thus, a research protocol was submitted to the Wilford Hall Medical Center Institutional Review Board (IRB) at Lackland Air Force Base, Texas. The IRB approved the research protocol and the approval is in Appendix C. 4. BACKGROUND. Popular running magazines, shoe companies and other publications (1, 11-15) suggest that the shape of the plantar surface of the foot can be used as an indication of the height of the longitudinal foot arch and that this can be used to select appropriate types of running shoes. Individuals with low arches are presumed to have disproportionate foot flexibility that allows the foot to pronate excessively during the stance phase of running. Motion control shoes are prescribed for those with low arches to presumably control this excessive pronation. Individuals with high arches are assumed to have rigid or inflexible feet that underpronate and impact the ground with high force. Cushioned shoes are designed for those with high arches to presumably allow more pronation and provide cushioning to reduce ground impact forces. Individuals with average arch heights are assumed to impact the ground with less force and to have an appropriate amount of pronation during the stance phase of running. Stability shoes are designed for those with average arches and these shoes have moderate cushioning and motion control characteristics (1). a. Gait Mechanics and Characteristics of Running Shoes. (1) The categorization of running shoes into motion control, stability, and cushioning shoes rests on two assumptions: 1) that individuals with high and low foot arch heights have the gait mechanics described above, and 2) that particular shoe characteristics can adjust or compensate for these gait differences to more closely conform to those of individuals with more average arch heights. With regard to the first assumption, when previously injured or
USACHPPM Epidemiological Report No. 12-MA-05SBA-08A
3
symptomatic runners with low and high arches were tested using the same shoes, there were differences in running kinematics. Runners with low arches tended to demonstrate more inversion/eversion and less internal tibial rotation on the talus during the stance phase of running. Runners with high arches had less inversion/eversion, more internal tibial rotation on the talus, more leg stiffness, higher initial ground impact forces, and a higher rate of initial force development on ground impact (16-18). On the other hand, when nonsymptomatic high- and low-arched runners or walkers were examined, there were few arch-related differences in rearfoot motion or impact forces (19-22). Thus, gait differences associated with foot type may be more applicable to symptomatic and previously injured individuals but less applicable to those who are not experiencing symptoms or who have not been previously injured. (2) The second assumption is that particular shoe characteristics can adjust the gait mechanics of high- and low-arched individuals to more closely conform to that of individuals with average arch heights. Motion control shoes attempt to attenuate excessive rearfoot motion; cushioned shoes attempt to alleviate higher impact forces while allowing more rearfoot motion. However, when high-arched or low-arched individuals ran in motion control or cushioned shoes, there was little difference in kinematics between these two foot types even during prolonged running (23, 24). The only variable to differ was the instantaneous loading rate (maximal instantaneous slope of initial force development on ground impact), which, contrary to expectation, was actually higher in the cushioned shoe (compared with the motion control shoe) when worn by the low-arched individuals. This occurred despite the fact that motion control shoes (regardless of arch type) attenuated rearfoot motion better than cushioned shoes and that cushioned shoes generally attenuated shock better than the motion control shoes (23, 24). Thus, while the shoes performed as expected, there were no differences in mechanics (other than instantaneous loading rate) between low- and high-arched individuals running in these shoes. b. Running Shoe Functions. The literature suggests that running shoes should have four major functions: a) protect the foot from the external environment, b) provide traction by increasing friction, c) attenuate the shock of foot strike, d) provide motion control during the stance phase of the running cycle (25-28). The shoes should be as light as possible to minimize the energy cost of additional weight (29). (1) Protection of the Foot. Protection of the foot from the external environment is an obvious shoe function. Surfaces can be hot, cold, rocky, and/or uneven. The shoe protects the plantar surface of the foot by providing a barrier to the external environment and a relatively even surface to bridge uneven ground. The shoe thus protects the foot from extremes of temperature and physical trauma such as abrasions, lacerations, and contusions. (2) Traction. Another function of the shoe outsole is to increase traction. The composition of the outsole of most shoes provides a high coefficient of friction with concrete and asphalt surfaces (30). Better traction may reduce the probability of traumatic injuries from slips and falls. It may also improve running efficiency by preventing slipping and by directing

USACHPPM Epidemiological Report No. 12-MA-05SBA-08A
4
muscular effort more effectively in positioning the foot during the stance phase of running. Greater traction also provides more effective forward movement during the toe-off phase of running. (3) Attenuation of Shock. (a) Compared with bare feet, running shoes generally result in a decrease in the force of the initial impact spike and a slower initial rate of force development (31-35). Certain shoe characteristics may attenuate shock. Heel counters on shoes appear to reduce the lateral compression of the anatomical heel pad, making it a more effective shock absorber (33, 36, 37). (b) The effect of shock-absorbing materials in the shoe is not clear. In studies where materials are placed on benches and durometers are used to measure material hardness (38), investigators find (as would be expected) that impact forces decrease as material hardness decreases (34, 39, 40). On the other hand, studies involving subjects running across force platforms have shown little difference in external impact forces for different types of midsole hardnesses (34, 41-43). This is surprising since, as with bench studies, lower impact forces might be expected for softer, more compliant insoles (i.e., ethyl vinyl acetate (EVA) versus polyurethane). Several hypotheses have been advanced to explain this finding. Lake (41) suggested that this lack of difference in impact forces among midsoles of various hardnesses may not be surprising since the force platform measures the vertical ground reaction forces, and these forces reflect the acceleration of the total body’s center of mass. Average measures may mask large changes occurring in the legs. Nigg et al. (42) suggested that changes in midsole hardness may result in a redistribution of loads across the foot. They found that with harder midsoles subjects landed on more lateral portions of the shoe and ankle pronation velocities were greater. With greater velocity and more deceleration distance, the initial impact force decreased. Thus, with different midsole hardnesses subjects adjusted their foot strike to achieve similar external impact forces. Studies performed on different types of running surfaces show that runners increase their leg stiffness when running on soft, compliant surfaces and decrease their leg stiffness when running on harder surfaces (44, 45). Yet, a recent study examining two-dimensional sagittal plane kinematics showed no differences in leg stiffness between the two shoes with different cushioning properties (impact forces were not reported) (46). Thus, the effects of midsole hardness on impact forces are not clear at this point. Studies using shoes with different midsole hardnesses and employing three-dimensional kinematics with force platforms are necessary. (c) Robbins and Gouw (47) have challenged the assumption that shock absorption should be a characteristic of running shoes. They hypothesize that normal plantar tactile stimulus during running results in adaptations that reduce impact forces and presumably reduce the likelihood of injury. These impact-moderating behaviors include greater use of intrinsic foot shock absorption, greater knee and hip flexion, and a decrease in the height of the leg drop just prior to the stance phase of running. They propose that plantar feedback is optimal between bare

USACHPPM Epidemiological Report No. 12-MA-05SBA-08A
5
feet and natural surfaces and that the cushioning in running shoes attenuates plantar feedback. They showed that sufficient vertical and horizontal impact forces (> 0.4 kg/cm2) evoked higher subjective discomfort; an irregular surface further increased this discomfort. However, they did not specifically measure their hypothesized impact-moderating behavior. Further, testing was not conducted while running but rather while subjects were seated with impact loads applied by pistons to the thigh and Achilles tendon regions. Also, their subjects were not runners. (4) Motion Control. (a) There has been a good deal of research on “rearfoot control,” which can be defined as the ability of shoes to limit the amount of foot pronation after foot strike (48). For example, one early study compared two shoes: 1) a training shoe that had a multidensity midsole (EVA and polyurethane), a stiff heel counter, and a wide heel base, and 2) a racing flat that had a midsole of uniform density EVA, a softer heel counter, and a much narrower heel base. The training shoe had about 20% less total rearfoot motion (49). While studies of this type are suggestive, they do not allow isolation of specific factors that may influence rearfoot control. Fortunately, other studies have systematically manipulated shoe characteristics, and specific factors that limit foot pronation have been identified. Characteristics that have been investigated include midsole hardness, heel flare, and heel lift. (b) Midsoles constructed of softer material resulted in greater and more rapid foot pronation than harder material (48, 50). Softer midsoles resulted in a resupination of the foot while the knee was still flexing. It was suggested that this could set up an antagonistic relationship: the resupinating foot caused an external rotational torque on the tibia, while the flexing knee imposed an internal rotational torque. Repeated cycles of these opposing torques during running could result in an overuse injury to the knee (50). (c) The influence of heel flare (the angular distance that the midsole in the heel area protrudes from the lateral and/or medial portions of the shoe) is not clear but the inconsistent results suggest that heel flare has no systematic influence on rearfoot motion. One study found the lack of heel flare resulted in greater and more rapid total pronation (48), while other studies showed no effect (51, 52). Heel flares of 0 to 30 degrees were tested. In one study, initial joint pronation (first tenth of foot contact time) and initial pronation velocity was less with a negative (more rounded) heel flare, but total amount of pronation was not affected. Greater heel flare did not change the vertical impact forces, but did result in a later occurrence of the impact force after heel strike (51). (d) Heel lift (a greater height in the rear of the shoe than in the front of the shoe) has been hypothesized to reduce the incidence of Achilles tendonitis by reducing forces on the Achilles tendon (53-55). However, the magnitude and time of occurrence of the maximal plantar flexion moments (a surrogate for Achilles tendon loading) were not altered by heel lifts ranging

USACHPPM Epidemiological Report No. 12-MA-05SBA-08A
6
from 5 to 9.5 degrees (55). On the other hand, as heel height increased, the angular acceleration of pronation decreased (48). (e) Medial (varus) and lateral (valgus) wedging have also been compared. Varus wedging is achieved by placing a wedged-shaped pad under the medial aspect of the heel, thus causing the calcaneus to tilt away from the midline of the body. Conversely, the same wedge placed under the lateral aspect of the heel causes the calcaneus to tilt toward the midline of the body. A 5-degree varus wedge was found to decrease foot pronation, but it also increased peak impact, rate of force development, and tibial shock (56). Thus, there are tradeoffs with wedging. (5) Energy Cost. Heel counters are firm cups surrounding the calcaneus region of the foot. They reduce the energy cost of running (36), possibly by increasing mechanical stability so that less muscular force is necessary to stabilize the lower extremity. Lighter shoes also allow individuals to run at a lower energy cost. For each kilogram added to the foot, the increase in energy expenditure is 7% to 10% (57-61). This may be because, during running, the lower extremities move through a greater range of motion than other parts of the body, resulting in more mechanical work. The additional mass on the extremities calls for greater muscular force and consequently more energy expenditure.
(6) Summary of Running Shoe Functions. Running shoes are generally designed to protect the foot, provide traction, attenuate the impact of foot strike, control foot pronation, and lower the energy cost of locomotion. Running in shoes reduces vertical ground reaction forces (shock absorbency), compared with running barefoot, and firm heel counters appear to be a key shoe characteristic for this effect. The effect of midsole hardness is not clear, but it may be that hardness does not influence shock absorbency since runners adjust their gait to achieve a similar impact force regardless of shoe hardness. Softer midsoles result in greater and more rapid pronation than harder midsoles. Studies of heel flare are not consistent with regard to pronation. Greater heel lift decreases pronation velocity. Heel wedges trade off stability for greater ground reaction forces. Lighter running shoes and firm heel counters reduce the energy cost of running. c. Foot Arch Height and Injuries. (1) Measuring arch height is often considered useful, quantifiable information regarding foot structure, shock absorption capabilities, and movement function. However, arch height measurement can be confounded by both bone and soft-tissue variation between individuals. Static arch height measurements alone do not take into account dynamic foot flexibility, which may be related to injury (22). Nonetheless, prospective studies specifically examining arch height and injuries during military training suggest that either high foot arches (4, 62) or both high and low foot arches (3) increase injury risk. (2) One civilian study (17) suggests that previously injured runners with high and low arches have different injury patterns. The study selected 20 individuals with high arches and

USACHPPM Epidemiological Report No. 12-MA-05SBA-08A
7
20 with extremely low arches who had previous injuries but no current injuries. Selection was based on 1.5 standard deviations above and below the mean arch height ratio. The arch height ratio was defined as the height from the floor to the dorsum (50% of foot length) divided by the foot length from the posterior calcaneus to the first metatarsal phalangeal joint. Subjects reported their previous injuries on a questionnaire. High-arched individuals were found to have more injuries to lateral parts of the lower extremities, more bony injuries (stress fractures and stress reactions), and more foot and ankle injuries. Low-arched runners had more medial lower extremity injuries, more soft tissue injuries, and more knee injuries. The researchers hypothesized that the “pronated position of the foot often associated with a planus foot places increased stress on the medial structures of the lower extremity.” The higher incidence of past knee injuries in the low-arched group could have been related to a greater range in external rotation of the knee, possibly resulting in misalignment of the patellofemoral joint and thus higher stress in this area. In high-arched individuals there was increased lateral loading of the foot compared with low-arched individuals, possibly placing more stress on this area and possibly leading to more foot and ankle injuries. (3) Clinical classification of foot arch height may be problematic. One study measured the level of agreement among six clinicians on the classification of foot types into flat, normal, or highly arched, based on observations of photographs of different angles of the feet (63). The authors concluded that there was unacceptable interclinician variability and stressed the need for more objective standards in evaluating foot arch height. The validity of clinically diagnosed arch-height measurement has also been questioned by other authors (2, 64). There can be significant discrepancies between the radiographic appearance of the foot and the external clinical measurement. One study observed several feet that appeared clinically flat, but when lateral radiographs were obtained and standard radiographic indices applied, the feet could be classified as highly arched. It may be that simple observation of arch height alone is of little predictive clinical value (2). d. Injuries and Footwear. (1) As noted above, there are a large number of biomechanical studies involving running shoes (e.g., 25-28, 33, 36, 37) and these studies frequently hypothesize that specific changes in body mechanics induced by running shoes can influence injury rates. However, the data linking shoes to actual cases of injuries are sparse. There are two case studies and several epidemiological investigations providing some evidence that ill-fitting and older shoes may result in higher injury rates. These studies are reviewed below. (2) Wilk et al. (65) reported a case study of a 40-year old male triathlete who presented with symptoms of right foot plantar fasciitis after a triathlon. Examination of the patient’s racing shoes (which differed from the training shoe) showed that the heel counter on the right shoe had a pronounced medial tilt when compared with the left shoe. This was because the heel counter had been glued onto the shoes at an incorrect angle. The investigators hypothesized that the

USACHPPM Epidemiological Report No. 12-MA-05SBA-08A
8
medial tilt resulted in excessive pronation, creating a torsional force that repeatedly overstretched the plantar fascia leading to the fasciitis. However, the authors did not actually measure the amount of foot pronation with and without the defective heel counter. Further, plantar fasciitis is a common running injury (66-68) and the problem in this case could have been caused by factors other than the shoe. (3) Burgess and Ryan (69) reported a case study of a 26-year-old man who lost one of his running shoes and ran a 14-km race in a borrowed pair of older “tennis” shoes. He was examined two weeks later and had slight edema and marked tenderness over the lateral aspect of both shins with radiographic evidence of bilateral fibular stress fractures. Eight weeks later there was no edema or tenderness, and radiographs showed healing stress fractures with new bone formation. Compression loading tests showed that his usual running shoe absorbed twice as much energy and deformed five times as much as the “tennis” shoe. (4) Gardner et al. (70) found that Marine Corps recruits who reported to basic training with older running shoes were more likely to experience stress fractures than those reporting with newer shoes. Recruits who indicated that their shoes were 6 months to 1 year old were 2.3 times more likely to experience a stress fracture in training than those who indicated that their shoes were less than one month old. (5) Injuries were compared in groups of Israeli Defense Force recruits training in either 1) modified high-topped basketball shoes with soles of EVA or 2) regular combat boots with soles of molded double-density polyurethane. Experiments showed that tibial accelerations while walking on concrete were 19% lower in the basketball shoes. The group with the basketball shoes had a lower incidence of metatarsal stress fractures and overuse injuries of the foot (metatarsalgia, heel pain, arch pain). However, the overall incidence of stress fractures or all injuries was not different between groups (femoral stress fractures were slightly higher in the basketball shoe group) (71). (6) An observational study of injuries in basketball found that players using shoes with air cells had 4.3 times the odds of ankle injury compared with players wearing other types of shoes (72). (7) These studies present a confusing picture. There is some suggestion that older running shoes are associated with a higher likelihood of stress fractures. This was shown in Marine Corps recruit training; one of the case studies suggested an association between lower shock absorbency and stress fractures, and there is a mileage-related loss of shock absorbency in running shoes (73). However, in the Israeli recruit study, overall stress fracture rates were the same in those wearing the boot versus the more shock-absorbent basketball shoe. In the Marine Corps recruit study, recruits wore their running shoes only for morning physical training, while in the Israeli recruit study, recruits wore the basketball shoes for all training. Perhaps shock

USACHPPM Epidemiological Report No. 12-MA-05SBA-08A
9
absorbency is more important for stress fracture reduction during more intense physical activity like running where impact forces are likely to be greater. (8) A retrospective cohort study (29) tested the effectiveness of a running shoe prescription program for reducing injuries. At Fort Drum, New York, newly arriving Soldiers had their feet examined by a physical therapist and feet were classified on the basis of observed arch height (high, medium, or low) and flexibility (normal or rigid). A category of running shoes (motion control, stability, or cushion) was then recommended on the basis of the foot examination. International Classification of Diseases, Version 9 (ICD-9) codes representing overuse-related injuries in the lower extremity or low back regions were downloaded from the local Ambulatory Data System (ADS). Denominator data were obtained from the Fort Drum (10th Mountain Division) S-1 Office (Personnel Section). Injury rates were 36.8 cases/1000 soldier-months) before the program began and 18.6 cases/1000 soldier-months 5–14 months after the program began (relative risk (after/before)=0.5, p< 0.01). Thus, the decline in injury rates corresponded in time to the implementation of the program. However, a major potential confounder was the switch in how medical surveillance data was recorded. The hospital switched from the use of the Ambulatory Data System (ADS) to another system called KG-ADS (intended as an automated upgrade to ADS). Providers considered the KG-ADS cumbersome and time-consuming, possibly resulting in provider impatience and miscoding. A number of other potential temporal confounders (paving of the shoulders of the roads at Fort Drum, the Pool Therapy Program, physical therapist turnover, recorder bias, a deployment to Bosnia, and seasonal variations) were considered and discounted. It was considered imperative that the program be tested in a randomized prospective cohort study. e. Injury Incidence and Injury Risk Factors in Basic Training. (1) Cumulative injury incidence (proportion of trainees with one or more injuries during training) and injury rates (injured trainees per month) has been examined in the basic training units of the Army, Navy, Marine Corps, and Air Force (8, 70, 74-86). These data are shown in Table 1. US Army BCT was extended from 8 to 9 weeks in October 1998 and thus studies performed before and after this time are separated in Table 1 to reflect the increased time at risk in the latter investigations. Two investigations are included of US Army infantry basic training, which is 12 weeks long. (2) With regard to data collection, most investigations used medical records screening (78, 79, 85, 87-90), but other studies used medical surveillance systems (8, 86, 91) or questionnaires (80). With regard to injury definitions, most studies have looked at cases where trainees reported to a medical care provider for any type of physical damage to the body (8, 79, 81, 85, 86, 89, 90), but other studies have included only musculoskeletal injuries (78) or lower extremity overuse injuries (6, 78, 88). One study used self-reporting and included any injury regardless of whether or not the trainees sought medical care (80).

USACHPPM Epidemiological Report No. 12-MA-05SBA-08A
10
Table 1. Cumulative Incidence of Injury and Injury Incidence Rates during Army, Navy, Marine and Air Force Basic Training
Recruits (n) Cumulative Injury
Incidence (%) Injury Incidence Rate (%/month)
Service
Length of Training (weeks)
Study (Reference Number)
Year Data
Collected Men Women Men Women Men Women
92a 1978 347 770 26.2 62.0 13.1 31.0
79 1980 1,840 644 20.7 41.2 10.4 20.6
78 1984 124 186 27.4 50.5 13.7 25.3
87 1988 509 352 27.0 57.0 13.5 28.5
85 1994 NDb 165 NDb 66.7 NDb 33.3
88 1996 159 84 41.5 65.5 20.8 32.8
8 weeks
81 1998 604 305 30.8 58.0 15.4 29.0
89 1998 655 498 29.98 65.3 13.3 29.0
90c 2000 682/441 579/554 13.5/16.9 36.1/46.8 6.0/7.5 16.0/20.8
91cd 2003 442/569 295/377 19.5/27.9 41.0/47.7 8.7/12.4 18.2/21.2 9 weeks
86 2007 2,147 915 36.9 64.7 16.4 28.8
77 1988 303 NDb 45.9 NDb 15.3 NDb
Army
12 weeks (Infantry) e 1996 768 NDb 48.0 NDb 16.0 NDb
93 1993 1,143 NDb 33.1 NDb 11.0 NDb
94 1995–96 NDb 2,766 NDb 44.0 NDb 14.7
84 1993–94 176 241 25.6 44.0 8.5 14.7
95 1993 434 366 22.8 53.0 8.3 16.3
Marine Corps 12 weeks
6 1999 NDb 824 NDb 48.4 NDb 16.1
Navy 9 weeks 94 1996 NDb 8,865 NDb 37.2 NDb 12.4
Air Force 6 weeks 8 1994–95 8,660 5,250 16.8 37.8 11.2 25.2
a. Injury data from self-report questionnaire b. ND=No data collected on other gender c. Cohort study with two groups d. Injury data from surveillance system e. Previously unpublished data (1998) (3) In addition to injury rates and incidence, injury risk factors have been identified in some of the military Services. Like comparison of injury rates, relative risks across Services cannot be quantitatively compared because of different injury collection methods and different injury definitions. Further, some risk factors identified in one Service have not been investigated in other Services. Risk factors that have been identified are as follows. In Army and Marine Corps training, risk factors included female gender (8, 75-84), low aerobic fitness (6, 7, 75, 76, 78, 81, 85, 93, 95, 96), cigarette smoking prior to BCT (77, 81, 95-97), and low physical activity prior to basic training (6, 7, 70, 76-78, 81, 96). In Army and Navy trainees, longer running mileage during basic training is an injury risk factor (98, 99). Risk factors examined and identified only in Army BCT include low muscular endurance (77, 81) and training in the

USACHPPM Epidemiological Report No. 12-MA-05SBA-08A
11
summer compared with the fall (100). In male Marines only, older running shoes were associated with a higher risk of stress fractures (70). Among female Marines, menstrual irregularities have been associated with higher injury risk (6). Multivariate analyses in Army basic training have shown that cigarette smoking prior to BCT, low levels of aerobic fitness, and low levels of physical activity prior to BCT were independent injury risk factors (77, 81, 101). 5. METHODS. a. Subjects and Study Design. (1) The subjects of this study were men and women involved in BMT at Lackland Air Force Base, Texas. On entry to BMT, potential volunteers were briefed on the purposes and risks of the study and those wishing to participate in the investigation signed an informed consent statement. The informed consent statement and research protocol were approved the institutional review board of Wilford Hall Medical Center at Lackland Air Force Base, Texas (Appendix C). (2) This was a randomized prospective cohort study. Volunteers were randomized into either an experimental (E) or control (C) group in sequential order, generally based on order of arrival for testing. The E group subjects were prescribed a running shoe based on the shape of the plantar surface of their feet. The C group subjects received a standard stability running shoe (New Balance 498) regardless of the shape of their plantar surface. All enrolled volunteers were followed until BMT graduation or separation from their original BMT unit. b. Initial Testing Procedures. (1) All initial testing was performed in the clothing issue room at Lackland AFB between April and June 2007. Immediately after the informed consent was obtained, volunteers were administered a questionnaire that asked about tobacco use, physical activity, injury history, and (for women) menstrual history. This questionnaire is in Appendix D. (2) To determine the shape of the plantar surface of the foot (plantar surface evaluation), the barefoot volunteer mounted the acrylic platform of the light box device shown in Figure 1. The device contained a mirror that reflected the underside of the trainee’s foot. This provided a view of the footprint, showing the amount of the foot that was in contact with the acrylic surface. The subjects were instructed to stand with equal weight on each foot and feet comfortably apart. The area encompassed by the footprint was examined by two testers who stood side by side. The testers made independent determinations of the plantar surface as either high arched, normal arched or low arched, based on templates (1): more area in the middle third of the plantar surface indicated a low plantar shape and less area a high plantar shape. If the assessments of the two raters differed, they discussed the assessment and reached a consensus.

USACHPPM Epidemiological Report No. 12-MA-05SBA-08A
12
Figure 1a.High-Arched Feet
Figure 1b. Normal Arched Feet Figure 1. Plantar Foot Shape Device

USACHPPM Epidemiological Report No. 12-MA-05SBA-08A
13
(3) After the plantar foot shape determinations, subjects’ foot lengths and foot arch heights were measured with the device shown in Figures 2 and 3. Total foot length and medial metatarsal phalangeal joint (MPJ) length were determined using a measuring ruler built into the device. Total foot length was measured as the distance from the most distal aspect of the first toe to the most posterior part of the heel. MPJ length was measured as the distance from the first MPJ to the most posterior part of the heel. Foot arch height was measured with a digital caliper (Figure 3) as the distance from standing surface to the inferior medial border of the navicular tuberosity. The three measures were obtained on both the right and left foot while the subject was standing with weight equally distributed on both feet.
Figure 2. Device Used to Measure Foot Arch Height

USACHPPM Epidemiological Report No. 12-MA-05SBA-08A
14
Figure 3. Foot Length and Arch Height Measurements Being Taken on a Subject
c. Running Shoe Prescription. Subjects in the C group received a New Balance 498 shoe regardless of plantar surface shape. Trainees in the E group received a shoe based on the determined shape of the plantar surface of their foot. If a subject in the E group was classified as having a low plantar shape, a New Balance 587 (motion control shoe) was prescribed. If a subject in the E group was classified as having a high plantar shape, a New Balance 755 (cushion shoe) was prescribed. If a subject in the E group was classified as having a normal plantar shape, a New Balance 498 (stability shoe) was prescribed. For subjects in the E group, if the plantar shape determination was different for a subject’s right foot and left foot, the raters determined the degree of difference and prescribed a shoe appropriate for the “average.” For example, a subject with a moderately high left foot arch and a normal right foot arch would be assigned a stability shoe since the left foot arch was not extremely high. Soldiers received their shoes in the clothing issue area just after the foot evaluations. d. Attrition from Training. Some subjects did not complete the entire 6-week BMT cycle but their data were included for the time they remained in training, as described below. Reasons for attrition included discharge from the Air Force or reassignment to a new unit (recycle). Discharges and recycles were obtained from a local data system maintained at Lackland AFB. e. Physical Fitness Test Scores. Within 2 to 5 days of arrival in their training units, recruits took the physical fitness test. The test was repeated in the fifth week of training. The test consisted of three events: a 1-minute maximal effort push-up event, a 1-minute maximal effort abdominal crunch event, and a 1.5-mile run for time, administered in that order. The three fitness test events were administered by military training instructors using standardized

USACHPPM Epidemiological Report No. 12-MA-05SBA-08A
15
procedures. For the push-up, the subject lowered his or her body in a generally straight line to a point where the upper arms were parallel to the ground, and then returned to the starting point with elbows fully extended. For the crunch, the subject’s knees were bent at a 90° angle and arms were placed across the chest with the hands resting on the shoulders or upper chest. A second person was allowed to hold the subject’s feet to keep the heels firmly on the ground. The subject raised his or her upper body to a vertical position so that elbows touched the knees or thighs and then returned to the starting position such that the shoulder blades touched the ground before beginning a new repetition. Scores were the number of push-ups or crunches successfully completed within a 1-minute time period. The performance measure for the run was the time taken to complete the 1.5-mile distance. Time between events was no less than 10 minutes. f. Physical Characteristics. Height and weight were obtained in the clothing issue facility during the initial testing. A three-dimensional body scanner (Human Solutions, Kaisenslautern Germany) incorporated a force platform to measure weight and the laser on the device measured height. Abdominal circumference was measured during the physical fitness tests with an anthropometric tape. The tape was placed parallel to the floor at the level of the iliac crest and the measurement was made at the end of a normal expiration. g. Demographics. The Army Medical Surveillance Activity (now the Armed Forces Health Surveillance Center) provided demographic data for study subjects from the Defense Medical Surveillance System (DMSS). The DMSS regularly and systematically incorporates into their systems demographic data from the Defense Manpower Data Center (DMDC) and the Military Entrance Process Command (MEPS). Information obtained from the DMSS for study subjects included date of birth, component (active, reserve, National Guard), educational level, marital status, and race. h. Injury Outcome Measures. (1) Besides demographic data, the DMSS (now the Armed Forces Health Surveillance Center) regularly incorporates data on ambulatory (outpatient) encounters that occur within military treatment facilities (MTFs), as well as those that occur outside the MTFs but are paid for by the DOD. The DMSS provided visit dates and ICD-9 codes for all outpatient medical visits within the BMT timeframe for each subject. The first four diagnoses for each visit were considered, although a single visit usually included only one diagnosis. Five injury indices were calculated: the Installation Injury Index (III), the Modified Installation Injury Index (MIII), the Training Injury Index (TII), the Comprehensive Injury Index (CII), and the Overuse Injury Index (OII). All indices include specific ICD-9 codes, as described previously (83). (2) The III and TII were developed by personnel at the DMSS. The III has been used to compare overall injury rates (acute and overuse) among military posts and is reported on a monthly basis at the Armed Forces Healthy Surveillance Center website (http://afhsc.army.mil). The TII is limited to lower extremity overuse injuries and has been used to compare injury rates

USACHPPM Epidemiological Report No. 12-MA-05SBA-08A
16
among basic training posts. The TII is reported on a monthly basis to the Army Training and Doctrine Command surgeon. (3) The MIII, CII, and OII were developed by personnel in the Injury Prevention Program at the CHPPM. The MIII captures a greater number of injuries than the III, including more overuse type injuries. The CII captures all ICD-9 codes related to injuries. The OII captures the subset of musculoskeletal injuries presumably resulting from cumulative microtrauma (overuse-type injuries) such as stress fractures, stress reactions, tendonitis, bursitis, fasciitis, arthralgia, neuropathy, radiculopathy, shin splints, synovitis, strains, and musculoskeletal pain (not otherwise specified). i. Data Analysis. (1) Age was calculated from the date of birth in the DMDC data to the date of the informed consent briefing. Body mass index (BMI) was calculated as weight/height2 (102). Foot arch indices for each foot were calculated using total foot length, MPJ length, and arch height. The arch index was defined as the arch height divided by the total foot length. The bony arch index was defined as the arch height divided by the MPJ length. The arch index and bony arch index were developed because it might be assumed that an individual with a greater foot length might have a higher foot arch. (2) The E and C groups were compared on questionnaire variables, attrition, age, physical characteristics, physical fitness, demographic characteristics, foot measurements and foot indices. For discrete, nominal, and ordinal variables comparisons were made using the chi-square statistic; for continuous measures, E and C group comparisons were performed using an independent sample t-test. Between-rater reliability of plantar foot shape determination was made with the kappa coefficient. A two-way analysis of variance (ANOVA) was used to compare the groups on physical characteristics and fitness measures before and after BMT (groups test period ANOVA with repeated measures on the test period). (3) For all injury indices, person-time injury incidence rates (injured subjects/1000 person-days) were calculated as:
(Subjects with ≥ 1 injury) (total subject time in BMT 1000) The total time in BMT was 43 days for subjects who completed BMT and less for those who attrited from training. Comparisons between the E and C groups were made using a chi-square for person-time (103). (4) Cox regression was used to examine the associations between potential risk factors (including group membership) and time to first CII injury. For each analysis, once a subject had an injury his or her contribution to time in BMT was terminated. Those who attrited from

USACHPPM Epidemiological Report No. 12-MA-05SBA-08A
17
training had their time censored (i.e., end of time at risk) at the day they left the unit. All potential risk factors were entered into the regression model as categorical variables. Some interval and ordinal variables were combined to increase statistical power. Most continuous variables were converted to four equal-sized groups based on the distribution of the scores. Age was partitioned into 3 groups (17–19, 20–24, ≥ 25 years). Arch height measures and arch indices were separated into groups comprising the highest 20% and lowest 20% of values (leaving 60% in the central distribution). For all Cox regressions, simple contrasts were used, comparing the hazard at a baseline level of a variable (defined with a hazard ratio (HR) of 1.00) to other levels of the same categorical variable. Univariate Cox regressions established the association between time to first injury and levels of each potential risk factor in isolation. Multivariate Cox regressions established the effect of multiple risk factors (including group membership) on injury risk. Potential risk factors were included in the multivariate model if they achieved p< 0.10 in the univariate analyses (104). (5) Measures of arch height and the arch indices were compared with plantar surface determinations. Analysis of variance (ANOVA) was used to determine if there were differences in the measured arch heights and arch indices for the three plantar shapes (low, normal, and high). To determine the number of subjects correctly classified, the proportion (%) of subjects in the each of the three plantar shapes was established and compared with the same distributions in the measured arch height and arch indices. 6. RESULTS. a. Participants and Attrition. (1) There were 2,167 men and 854 women who volunteered for the study. The first group began BMT on 28 April 2007 and graduated on 10 June 2007. The last group began BMT on 2 June 2007 and graduated on 15 July 2007. (2) Of the original cohort of volunteers 113 (60 men and 53 women) did not enter BMT for medical or administrative reasons. These subjects were not considered in further analyses since they had no actual time in BMT. There were 206 recycles (128 men, 78 women). The recycle database did not have the day the subject was recycled so the time at risk could not be determined; these subjects were not considered in subsequent analyses. Thus, the final cohort considered for analysis consisted of 1,979 men and 723 women. (3) Among the men, 8.9% in the E group and 8.2% in the C group attrited from training (p=0.58). Among the women, 16.0% of the E group and 11.3% of the C group attrited from training (p=0.07). These subjects were considered for analysis until the time they left training.

USACHPPM Epidemiological Report No. 12-MA-05SBA-08A
18
b. Comparisons of E and C Groups. Not all subjects had complete measurements on all variables. This occurred primarily because the data were not available in the DMSS databases, subjects did not provide a response on the questionnaire, or the training unit did not have the information. Personnel in the clothing issue section imposed time constraints so that some subjects could not complete the entire initial testing battery. Therefore, sample sizes for each variable are shown in all tables below. (1) Age, Physical Characteristics, and Fitness Test Scores. Table 2 compares group differences in age, physical characteristics, and fitness scores for men and women at the start of training. Group differences in these measures were small. Table 2. Group Comparisons for Age, Physical Characteristics, and Fitness Scores at Start of Training
Men Women
E C E C n Mean SD n Mean SD p-valuea n Mean SD n Mean SD p-valuea
Age (yr) 981 21.2±2.3 874 21.2±2.3 0.94 344 21.5±2.9 331 21.3±2.6 0.43
Height (in) 923 69.6±2.7 812 69.6±2.7 0.94 357 64.5±2.7 333 64.8±2.8 0.20
Weight (lb) 924 167±23 814 167±23 0.64 357 138±18 333 139±21 0.81
BMI (kg/m2) 923 24.3±2.7 812 24.2±2.7 0.64 357 23.4±2.6 333 23.2±2.8 0.43
Abd Cir (in)b 921 32.8±3.0 811 32.8±3.1 0.96 350 30.9±3.2 327 30.7±3.4 0.59
Push-Ups (reps) 920 37±13 809 36±13 0.64 355 15±9 332 15±11 0.79
Crunches (reps) 920 37±11 809 37±10 0.71 355 25±10 332 25±11 0.92
1.5-Mile Run (min) 911 12.9±1.8 802 12.9±1.9 0.88 352 16.7±2.7 330 16.6±2.6 0.56 a. Independent sample t-test b. Abdominal circumference (a) Table 3 compares group differences as well as changes in physical characteristics and fitness scores from the start to the end of training. Only subjects with complete data on the pre- and post-tests could be considered in the analysis since two-way ANOVA requires complete data. There was no main effect of group or any group test period interactions on any of the measures. However, pre- to post-BMT changes did show significant main effects: there were significant losses in body weight and BMI and increases in all the fitness measures. (b) Since there were no group differences in the physical characteristics or fitness measures, the data were combined to calculate mean changes pre- to post-BMT. Means and standard deviations (Mean±SD) are shown in Table 4. Men and women lost weight during training, resulting in a reduction in BMI; men lost more weight than women on both an absolute and relative basis. Improvements on the fitness measures were substantial, but women generally had greater absolute and relative (%) improvements in fitness than the men.

USACHPPM Epidemiological Report No. 12-MA-05SBA-08A
19
Table 3. Group Comparisons on Physical Characteristics and Fitness Test Scores Pre- and Post-BMT
E C p-valuesa
n Mean SD n Mean SD Group Test
Period Group
Test Period
Men
Pre Weight Post Weight (lb) 787 168±22
161±18 697 166±23 160±18 0.17 <0.01 0.65
Pre BMI Post BMI (kg/m2) 787 24.4±2.7
23.4±2.0 697 24.2±2.7 23.2±2.0 0.12 <0.01 0.69
Pre Push-Up Post Push-Ups (reps) 814 37±13
53±9 717 37±13 54±9 0.60 <0.01 0.35
Pre Crunches Post Crunches (reps) 814 37±11
56±7 717 37±10 56±7 0.44 <0.01 0.14
Pre 1.5-Mile Run Post 1.5-Mile Run (min) 789 12.7±1.7
11.5±1.3 696 12.7±1.8 11.5±1.9 0.47 <0.01 0.78
Women
Pre Weight Post Weight (lb) 295 138±17
134±15 290 138±20 135±17 0.68 <0.01 0.45
Pre BMI Post BMI (kg/m2) 295 23.3±2.6
22.7±1.9 290 23.3±2.6 22.7±1.9 0.51 <0.01 0.35
Pre Push-Up Post Push-Ups (reps) 291 16±9
33±7 283 16±11 33±9 0.68 <0.01 0.68
Pre Crunches Post Crunches (reps) 291 26±10
52±6 284 26±11 51±9 0.74 <0.01 0.36
Pre 1.5-Mile Run Post 1.5-Mile Run (min) 295 16.3±2.3
14.1±1.7 288 16.4±2.5 14.1±1.9 0.86 <0.01 0.90
a. Two-way repeated measures analysis of variance Table 4. Changes in Physical Characteristics and Fitness Scores with Both Groups Combined
Men Women
Pre Mean SD
Post Mean SD Δ Δ (%)
Pre Mean SD
Post Mean SD Δ Δ (%)
Weight (lb) 167±23 160±18 7 4.1 138±19 134±16 4 2.6
BMI (kg/m2) 24.3±2.7 23.3±2.0 1.0 4.1 23.2±2.7 22.6±1.9 0.6 2.6
Push-Ups (reps) 37±13 54±9 17 45.1 16±10 33±8 17 110.8
Crunches (reps) 38±10 56±7 18 49.3 26±10 51±7 25 97.3
1.5-Mile Run (min) 12.7±1.7 11.5±1.6 1.2 9.4 16.4±2.4 14.1±1.8 2.3 14.0

USACHPPM Epidemiological Report No. 12-MA-05SBA-08A
20
(2) Demographic Characteristics. Table 5 shows group comparisons on the demographic variables. The distribution of subjects was similar within the two groups for component, educational level, and marital status for both men and women. The distribution for race was also similar between the two groups of women; however, the E men had a larger proportion of Blacks and smaller proportions of Whites, Asians, and “others” than did the C men. Table 5. Group Comparisons on Demographic Characteristics
Men Women
Variable Level of Variable E(%) n=978
C(%) n=872 p-valuea
E(%) n=342
C(%) n=331 p-valuea
Component Active Air Force National Guard Air Force Reserve
80.8 14.8
4.4
82.0 13.3
4.7 0.63
76.3 14.0
9.6
77.3 14.8
7.9 0.70
Educational Level
< High School Graduate High School Graduate Some College or Graduate Unknown
0.7 91.6
5.0 2.7
0.7 93.8
3.7 1.8
0.32
0.9 90.9
6.7 1.5
1.2 91.5
5.7 1.5
0.93
Race
Asian/Pacific Island Black White Other Unknown
4.2 16.8 76.4
2.4 0.3
5.2 11.8 79.8
3.1 0.1
0.02
5.8 19.6 69.9
4.7 0.0
5.7 19.6 70.4
4.2 0.0
0.99
Marital Status
Single Married Other
87.2 12.6
0.2
89.1 10.6
0.3 0.34
80.7 17.5
1.8
83.4 16.0
0.6 0.32
a. Chi-square statistic (3) Questionnaire Data. (a) Table 6 compares the groups on the ordinal and nominal questionnaire variables. For most questions, the distribution of E and C subjects across the response categories was similar, although there were a few exceptions. C men had slightly higher frequency of pre-BMT running or jogging than E men; C women also tended to have a slightly higher frequency of running or jogging than E women (Question 15). Slightly fewer E men returned to full activity after a lower limb injury compared with C men (Question 21). (b) Table 7 examines group differences in the continuous questionnaire variables. Here again, differences between groups were small. E group women tended to have had fewer menstrual periods in the last year and more recent pregnancies compared with C women.

USACHPPM Epidemiological Report No. 12-MA-05SBA-08A
21
Table 6. Group Comparisons on Ordinal/Nominal Questionnaire Variables Men Women
Question Sample Sizes Response Category E(%) C(%) p-
valuea E(%) C(%) p-
valuea
Q7. Shoe Type
Men E=747 Men C=681 Women E=265 Women C=249
Boots Dress Running Heels ≤ 1 inchb Heels ≥ 1 inchb Sandals Other Unsure
10.6 4.0
67.9 --- --- 4.8 9.4 3.3
12.8 3.7
67.0 --- --- 4.6 9.0 3.1
0.87
3.8 3.8
43.4 3.4 9.8
26.4 7.2 2.3
6.8 2.4
47.0 2.0 6.4
26.9 7.2 1.2
0.43
Q8. Smoked 100 Cigarettes in Lifetime
Men E=735 Men C=671 Women E=265 Women C=250
No Yes
68.2 31.8
68.6 31.4 0.88 75.5
24.5 69.6 30.4 0.14
Q13. Self Rating of Physical Activity
Men E=739 Men C=678 Women E=265 Women C=246
Much less than average Somewhat less than average About the same Somewhat more active Much more active
4.9 16.9 36.4 29.4 12.4
5.0 18.3 32.2 33.8 10.8
0.26
7.5 27.5 34.7 22.6
7.5
8.5 24.0 35.4 25.6
6.5
0.83
Q14. Frequency of Exercise or Sports Last 2 Months
Men E=735 Men C=679 Women E=265 Women C=244
Never < 1 time/week 1 time/week 2 times/week 3 times/week 4 times/week 5 times/week 6 times/week ≥ 7 times/week
1.2 5.8 8.8
17.2 25.1 16.8 13.3
5.3 6.4
1.5 5.9 8.2
17.7 22.8 14.4 15.2 6.0 8.2
0.72
5.3 8.7 6.8
20.4 26.8 13.2 10.6
4.2 4.2
2.5 6.6
13.1 18.4 25.4 12.7
8.6 9.0 3.7
0.18
Q15. Frequency of Running or Jogging Last 2 Months
Men E=739 Men C=678 Women E=265 Women C=246
Never < 1 time/week 1 time/week 2 times/week 3 times/week 4 times/week 5 times/week 6 times/week ≥ 7 times/week
3.9 12.3 16.8 20.3 23.1 10.7
6.6 3.4 2.8
4.4 11.2 11.5 24.6 22.3 11.7 9.1 2.2 2.9
0.05
6.4 18.1
9.4 18.9 25.3 13.2
5.7 1.1 1.9
3.7 13.0 15.9 22.8 24.4
9.8 6.5 2.8 1.2
0.11
Q16. Length of Time Ran or Jogged Prior to BMT
Men E=736 Men C=678 Women E=265 Women C=246
Did not run or jog ≤ 1 month 2 months 3 months 4–6 months 7–11 months ≥ 12 months
8.3 31.4 24.0 15.1 11.0
2.7 7.5
8.0 29.2 23.0 15.5 11.8 2.8 9.7
0.79
12.1 30.6 20.4 15.8
9.1 3.4 8.7
6.9 33.3 27.2 15.4
8.1 2.8 6.1
0.25
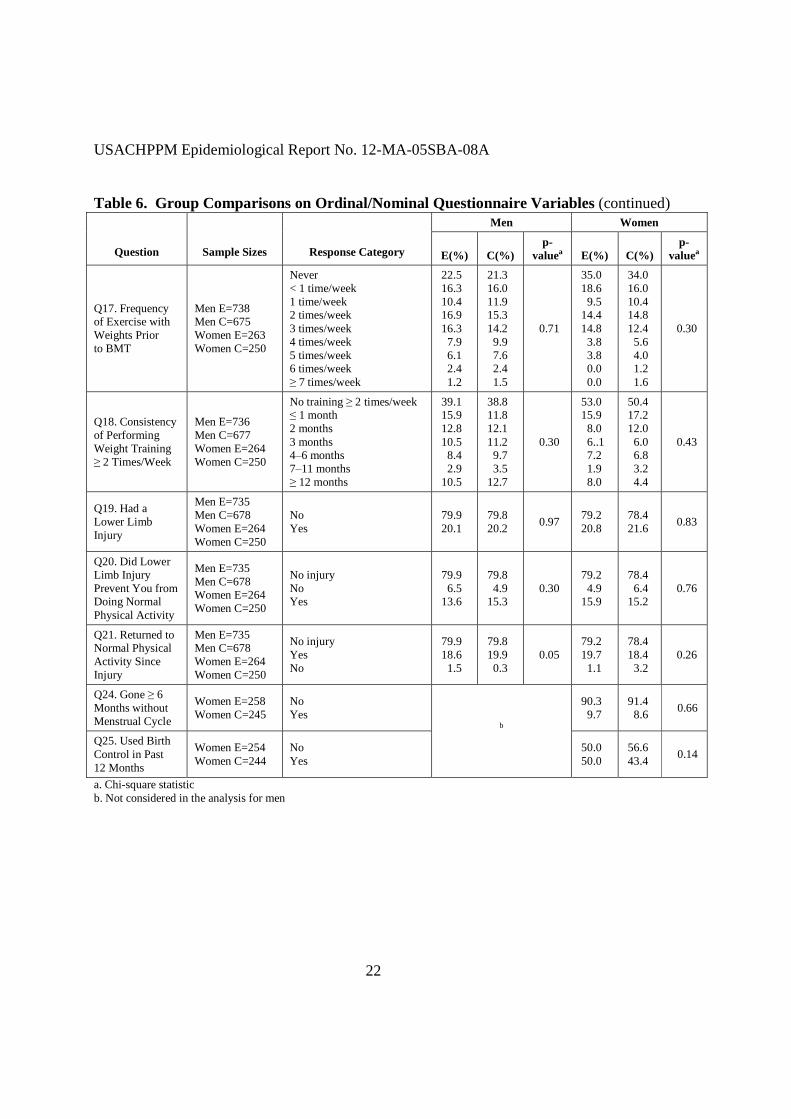
USACHPPM Epidemiological Report No. 12-MA-05SBA-08A
22
Table 6. Group Comparisons on Ordinal/Nominal Questionnaire Variables (continued) Men Women
Question Sample Sizes Response Category E(%) C(%) p-
valuea E(%) C(%) p-
valuea
Q17. Frequency of Exercise with Weights Prior to BMT
Men E=738 Men C=675 Women E=263 Women C=250
Never < 1 time/week 1 time/week 2 times/week 3 times/week 4 times/week 5 times/week 6 times/week ≥ 7 times/week
22.5 16.3 10.4 16.9 16.3
7.9 6.1 2.4 1.2
21.3 16.0 11.9 15.3 14.2 9.9 7.6 2.4 1.5
0.71
35.0 18.6
9.5 14.4 14.8
3.8 3.8 0.0 0.0
34.0 16.0 10.4 14.8 12.4
5.6 4.0 1.2 1.6
0.30
Q18. Consistency of Performing Weight Training ≥ 2 Times/Week
Men E=736 Men C=677 Women E=264 Women C=250
No training ≥ 2 times/week ≤ 1 month 2 months 3 months 4–6 months 7–11 months ≥ 12 months
39.1 15.9 12.8 10.5
8.4 2.9
10.5
38.8 11.8 12.1 11.2 9.7 3.5
12.7
0.30
53.0 15.9
8.0 6..1 7.2 1.9 8.0
50.4 17.2 12.0
6.0 6.8 3.2 4.4
0.43
Q19. Had a Lower Limb Injury
Men E=735 Men C=678 Women E=264 Women C=250
No Yes
79.9 20.1
79.8 20.2 0.97 79.2
20.8 78.4 21.6 0.83
Q20. Did Lower Limb Injury Prevent You from Doing Normal Physical Activity
Men E=735 Men C=678 Women E=264 Women C=250
No injury No Yes
79.9 6.5
13.6
79.8 4.9
15.3 0.30
79.2 4.9
15.9
78.4 6.4
15.2 0.76
Q21. Returned to Normal Physical Activity Since Injury
Men E=735 Men C=678 Women E=264 Women C=250
No injury Yes No
79.9 18.6
1.5
79.8 19.9 0.3
0.05 79.2 19.7
1.1
78.4 18.4
3.2 0.26
Q24. Gone ≥ 6 Months without Menstrual Cycle
Women E=258 Women C=245
No Yes
90.3 9.7
91.4 8.6 0.66
Q25. Used Birth Control in Past 12 Months
Women E=254 Women C=244
No Yes
b
50.0 50.0
56.6 43.4 0.14
a. Chi-square statistic b. Not considered in the analysis for men

USACHPPM Epidemiological Report No. 12-MA-05SBA-08A
23
Table 7. Group Comparisons on Continuous Questionnaire Variables Men Women
E C E C Question n MeanSD n MeanSD p-value a n MeanSD n MeanSD p-valuea
Q9. Age Started Smoking (years)b 350 16±3 317 16±2 0.11 103 16±3 101 16±2 0.25
Q10. Days Smoked Cigarettes in Last 30 Daysb
207 17±10 174 19±10 0.29 57 19±10 58 20±9 0.71
Q11. Cigarettes per Day Over Last 30 Daysb
211 7±6 173 8±8 0.17 56 8±7 55 7±6 0.57
Q12. Quit Smoking (months)c 116 13±20 98 14±19 0.48 35 12±20 35 18±23 0.26
Q22. Age at Menarche (years) 256 13±2 246 13±2 0.36
Q23 Menstrual Cycles (n/year) 265 10±4 250 11±3 0.05
Q26. Time Since Last Pregnancy (months)
32 21±21 36 34±31 0.05
a. Independent sample t-test b. Only subjects who were smokers included c. Only subjects who said they had quit smoking were included (4) Foot Measurements and Arch Indices. (a) The kappa coefficient between the two raters on the plantar surface evaluations was 0.98 for the right foot and 0.98 for the left foot. Table 8 shows the distribution of subjects by plantar shape. For both men and women, the C group had a lower proportion of low and high plantar shapes and a greater proportion of normal plantar shapes compared with the E group. Table 8. Distribution of Subjects by Plantar Shape
Men Women
E C E C Foot Plantar Shape n % n % p-valuea n % N % p-valuea
Low 134 12.9 79 8.7 38 10.8 23 6.7
Normal 726 69.7 714 78.3 273 72.8 280 81.2 Right Foot
High 181 17.4 119 13.0
<0.01
64 17.1 42 12.2
0.03
Low 148 14.2 88 9.6 44 11.7 27 7.8
Normal 703 67.5 696 76.3 256 68.3 259 75.1 Left Foot
High 190 18.3 128 14.0
<0.01
75 20.0 59 17.1
0.09
a. Chi-square statistic

USACHPPM Epidemiological Report No. 12-MA-05SBA-08A
24
(b) Table 9 compares group differences in the foot measurements and arch indices. All measures are similar for the two groups both among the men and among the women.
Table 9. Group Comparisons on the Foot Measures and Arch Indices Men Women
E C E C Foot Measures n Mean SD n Mean SD
p-valuea n Mean SD n Mean SD
p-valuea
Left Foot Total Length (cm) 958 26.8±1.3 825 26.8±1.4 0.66 304 24.3±1.2 281 24.3±1.3 0.61
Right Foot Total Length (cm) 958 26.8±13 825 26.7±1.3 0.41 304 24.2±1.2 281 24.2±1.3 0.44
Left Foot MPJ Length (cm) 958 19.9±1.1 825 19.8±1.1 0.43 304 18.1±1.3 281 18.1±1.2 0.72
Right Foot MPJ Length (cm) 958 19.9±1.1 824 19.8±1.1 0.42 304 18.0±1.1 281 18.0±1.0 0.90
Left Foot Arch Height (mm) 957 34.5±7.7 825 34.8±7.5 0.52 304 32.6±7.10 281 32.5±6.7 0.89
Right Foot Arch Height (mm) 957 35.4±7.8 825 35.6±7.7 0.57 304 32.9±7.1 281 33.0±6.6 0.84
Left Arch Index 957 0.1292±0.0331 825 0.1301±0.0292 0.52 304 0.1347±0.0305 281 0.1342±0.0296 0.85
Right Arch Index 957 0.1325±0.0308 825 0.1335±0.0298 0.55 304 0.1365±0.0307 281 0.1367±0.0294 0.93
Left Bony Arch Index 957 0.1747±0.0416 825 0.1761±0.0402 0.48 304 0.1807±0.0402 281 0.1810±0.0408 0.94
Right Bony Arch Index 957 0.1788±0.0420 824 0.1799±0.0406 0.56 304 0.1839±0.0409 281 0.1847±0.0400 0.81
a. Independent sample t-test c. Injury Rates and Injury Risk Factors. The AMSA (now the Armed Forces Health Surveillance Center) returned data on over 99% of those requested. The numbers of subjects requested and returned are displayed in Table 10. Table 10. Medical Information Requested and Returned from the Army Medical Surveillance Activity (now the Armed Forces Health Surveillance Center)
Men Women
Requested Returned Requested Returned
n n % n n %
1979 1955 99.0 723 721 99.7

USACHPPM Epidemiological Report No. 12-MA-05SBA-08A
25
(1) Injury Main Analyses. (a) Table 11 shows the person-time injury incidence rates for the various injury indices and compares the rates in the E and C groups. For both men and women, group differences in injury rates are slightly higher in E group. Table 11. Comparison of Injury Incidence Rates between the E and C Groups
Men Women
Injury Incidence Rate
(injuries/ 1000 person-days)
Injury Incidence Rate
(injuries/ 1000 person-days)
Index E C
Rate Ratio-E/C (95%
Confidence Interval)
p-valuea E C
Rate Ratio-E/C (95%
Confidence Interval)
p-valuea
Installation Injury Index 5.54 4.99 1.11 (0.92–1.35) 0.29 10.14 8.27 1.22 (0.96–1.56) 0.11
Modified Installation Injury Index
5.91 5.39 1.10 (0.92–1.32) 0.33 10.55 8.93 1.18 (0.93–1.49) 0.17
Overuse Injury Index 5.86 5.25 1.12 (0.93–1.35) 0.25 10.55 8.50 1.24 (0.98–1.58) 0.08
Training-Related Injury Index 4.62 3.94 1.17 (0.95–1.45) 0.14 8.41 6.68 1.26 (0.96–1.65) 0.09
Comprehensive Injury Index 7.04 6.43 1.09 (0.92–1.30) 0.30 12.96 10.89 1.19 (0.96–1.47) 0.11
a. Chi-square statistic for person-time (103) (b) Table 12 shows the univariate Cox regression examining the association of time to first injury with group, age, physical characteristics, and fitness test scores. Among the men, injury risk was about the same for the E and C groups. Higher injury risk was associated with lower performance on push-ups, crunches, or the 1.5-mile run. Men in the middle quartile of BMI or abdominal circumference tended to have lower risk than men with lower BMI or abdominal circumference. Among the women, those in the E group tended to be at higher injury risk than those in the C group. Higher injury risk was also associated with higher BMI, greater abdominal circumference and slower run time on the initial fitness test.

USACHPPM Epidemiological Report No. 12-MA-05SBA-08A
26
Table 12. Injury Hazard Ratios by Group, Age, Physical Characteristics, and Fitness Test Scores (Univariate Cox Regression)
Men Women
Variable Level of Variable n
Hazard Ratio (95%CI)
p-value
Level of Variable n
Hazard Ratio (95%CI)
p-value
Group E C
1042 913
1.09 (0.92–1.29) 1.00
0.31 ---
E C
373 345
1.23 (1.00–1.53) 1.00
0.06 ---
Age 18–19 years 20–24 years ≥ 25 years
446 1271 160
1.00 1.11 (0.90–1.38) 1.29 (0.94–1.81)
--- 0.32 0.12
18–19 years 20–24 years ≥ 25 years
154 442 80
1.00 1.12 (0.85–1.47) 1.09 (0.73–1.62)
--- 0.42 0.67
Height
60.0–67.0 inches 67.5–69.5 inches 70.0–71.5 inches 72.0–81.0 inches
376 477 486 396
0.87 (0.66–1.16) 0.99 (0.77–1.28) 1.04 (0.80–1.34)
1.00
0.34 0.94 0.78 ---
57.0–62.5 inches 63.0–64.5 inches 65.0–66.5 inches 67.0–73.0 inches
160 165 195 167
1.04 (0.76–1.44) 1.04 (0.75–1.43) 1.25 (0.93–1.69)
1.00
0.80 0.82 0.14 ---
Weight
96–151 pounds 152–168 pounds 169–183 pounds 184–254 pounds
448 440 432 418
1.00 0.94 (0.73–1.21) 0.83 (0.64–1.08) 1.02 (0.79–1.31)
--- 0.61 0.17 0.89
90–124 pounds 125–137 pounds 138–152 pounds 153–202 pounds
174 177 167 167
1.00 1.01 (0.74–1.37) 1.00 (0.73–1.36) 1.21 (0.89–1.65)
--- 0.96 0.99 0.22
Body Mass Index
14.72–22.28 kg/m2
22.29–24.63 kg/m2 25.64–26.39 kg/m2 26.40–35.44 kg/m2
432 432 432 430
1.49 (1.09–2.04) 1.00
0.97 (0.69–1.37) 1.19 (0.86–1.66)
0.01 ---
0.88 0.30
16.47–21.29 kg/m2 21.30–23.24 kg/m2 23.25–25.67 kg/m2 25.68–30.24 kg/m2
172 170 172 172
1.04 (0.76–1.43) 1.00
1.01 (0.73–1.38) 1.35 (1.00–1.83)
0.79 ---
0.97 0.05
Abdominal Circumference
22.0–30.5 inches 30.6–32.9 inches 33.0–35.1 inches 35.2–41.5 inches
433 452 431 416
1.00 1.02 (0.79–1.30) 0.77 (0.59–1.01) 1.01 (0.78–1.30)
--- 0.90 0.06 0.95
23.0–28.2 inches 28.3–30.6 inches 30.7–32.9 inches 33.0–45.2 inches
168 175 163 168
1.00 1.03 (0.75–1.42) 1.17 (0.85–1.60) 1.30 (0.95–1.77)
--- 0.86 0.34 0.10
Push-Ups
0–28 repetitions 29–36 repetitions 37–45 repetitions 46–94 repetitions
455 449 440 385
1.49 (1.14–1.93) 1.05 (0.80–1.39) 1.04 (0.78–1.37)
1.00
<0.01 0.72 0.81 ---
0–7 repetitions 8–14 repetitions 15–21 repetitions 22–101 repetitions
175 175 183 151
1.26 (0.92–1.71) 0.92 (0.67–1.26) 0.88 (0.64–1.21)
1.00
0.15 0.60 0.45 ---
Crunches
0–30 repetitions 31–36 repetitions 37–44 repetitions 45–75 repetitions
459 417 432 421
1.52 (1.18–1.97) 1.17 (0.89–1.55) 1.13 (0.86–1.48)
1.00
<0.01 0.25 0.40 ---
0–19 repetitions 20–26 repetitions 27–32 repetitions 33–62 repetitions
180 172 165 167
1.14 (0.84–1.54) 0.88 (0.64–1.21) 1.05 (0.77–1.43)
1.00
0.41 0.43 0.77 ---
1.5-Mile Run
8.33–11.53 minutes 11.54–12.63 minutes 12.64–13.97 minutes 13.98–20.53 minutes
432 432 422 427
1.00 0.95 (0.72–1.26) 1.34 (1.03–1.74) 1.47 (1.13–1.90)
--- 0.73 0.03
<0.01
9.67–14.92 minutes 14.93–16.50 minutes 16.51–18.23 minutes 18.24–31.40 minutes
173 174 164 169
1.00 0.98 (0.70–1.35) 1.28 (0.93–1.75) 1.62 (1.19–2.21)
--- 0.88 0.13
<0.01
(c) Table 13 shows the univariate Cox regression examining the association between time to first injury and the demographic characteristics. Men were at higher injury risk if they were active duty, of Black race or of “other” marital status (primarily divorced or separated). Among women, higher injury risk was associated with lower educational level, White race (compared with Asian descent), “other” race (compared with Whites), and being married.

USACHPPM Epidemiological Report No. 12-MA-05SBA-08A
27
Table 13. Injury Hazard Ratios for Demographic Characteristics (Univariate Cox Regression) Men Women
Variable Level of Variable n
Hazard Ratio (95%CI)
p- value
Level of Variable n
Hazard Ratio (95%CI)
p-value
Component Active Air Force National Guard Air Force Reserve
1526 84
262
1.00 0.79 (0.50–1.24) 0.77 (0.59–1.01)
--- 0.30 0.06
Active Air Force National Guard Air Force Reserve
518 59 97
1.00 1.11 (0.76–1.62) 1.18 (0.87–1.60)
--- 0.59 0.29
Educational Level
<HS Graduate HS Graduate Some College/Graduate Unknown
13 1735
82 42
0.25 (0.04–1.77) 1.00
0.89 (0.57–1.39) 0.77 (0.40–1.49)
0.16 ---
0.61 0.43
<HS Graduate HS Graduate Some College/Graduate Unknown
7 614 43 10
2.10 (0.94–4.72) 1.00
0.93 (0.60–1.48) 0.83 (0.60–1.48)
0.07 ---
0.79 0.70
Race
White Black Asian Other Unknown
1457 272
88 51
4
1.00 1.24 (0.98–1.56) 0.75 (0.47–1.20) 0.76 (0.42–1.39) 1.00 (0.14–7.14)
--- 0.07 0.23 0.38 0.99
White Black Asian Other
472 133 39 30
1.00 1.20 (0.92–1.58) 0.60 (0.33–1.06) 1.67 (1.07–2.67)
--- 0.18 0.08 0.03
Marital Status
Single, Never Married Married Other
1649 218
5
1.00 1.07 (0.82–1.39) 3.04 (0.98–9.46)
--- 0.64 0.06
Single, Never Married Married Other
553 113
8
1.00 1.31 (1.00–1.73) 1.50 (0.62–3.63)
--- 0.05 0.37
(d) Table 14 shows the association between time to first injury and the questionnaire variables. Among the men, higher injury risk was associated with smoking 100 cigarettes in a lifetime, beginning smoking at a younger age, smoking on any of the 30 days before BMT, and more cigarettes per day in the 30 days before BMT. Among the women, higher injury risk was associated with beginning smoking at a younger age, smoking in the 30 days before BMT, more cigarettes per day in the 30 days before BMT, less frequent running or jogging before BMT, and fewer months of running or jogging before BMT. Table 14. Injury Hazard Ratios for Questionnaire Variables (Univariate Cox Regression)
Men Women
Variablea Response Category n Hazard Ratio
(95%CI) p-
value n Hazard Ratio
(95%CI) p-
value
Q7. Shoe Type Worn Before BMT
Boots Running Dress Heels ≤ 1 inchb Heels >1 inchb Sandals Other Unsure
171 972
55 --- --- 68
132 46
1.00 0.89 (0.66–1.21) 1.33 (0.79–2.23)
--- ---
1.03 (0.61–1.72) 0.94 (0.61–1.45) 0.87 (0.46–1.64)
--- 0.46 0.29
--- ---
0.93 0.78 0.67
27 232
16 14 40
137 37
9
1.00 0.95 (0.53–1.69) 1.77 (0.81–3.88) 0.86 (0.33–2.27) 0.98 (0.48–1.98) 1.08 (0.60–1.96) 1.00 (0.49–2.06) 0.89 (0.29–2.72)
--- 0.86 0.15 0.77 0.95 0.80 0.99 0.83
Q8. Smoked 100 Cigarettes in Life
No Yes
969 453
1.00 1.29 (1.05–1.58)
--- 0.02
373 140
1.00 1.21 (0.92–1.60)
--- 0.18
Q9. Age Started Smoking
Never Smoked 6–9 years old 10–14 years old 15–19 years old ≥ 20 years old
773 8
160 467
40
1.00 2.37 (0.87–6.29) 1.44 (1.07–1.95) 1.17 (0.93–1.46) 1.51 (0.89–2.55)
--- 0.09 0.02 0.17 0.13
310 0
56 139
8
1.00 ---
1.44 (0.98–2.13) 1.17 (0.87–1.57) 1.33 (0.49–3.58)
--- ---
0.07 0.29 0.58

USACHPPM Epidemiological Report No. 12-MA-05SBA-08A
28
Table 14. Injury Hazard Ratios for Questionnaire Variables (Univariate Cox Regression) (continued)
Men Women
Variablea Response Category n Hazard Ratio
(95%CI) p-
value n Hazard Ratio
(95%CI) p-
value
Q10. Smoked Cigarettes in Last 30 Days
No Yes
1064 386
1.00 1.41 (1.14–1.74)
--- <0.01
400 114
1.00 1.30 (0.97–1.74)
--- 0.08
Q11. Cigarettes per Day in Last 30 Days
None 1–9 cigarettes/day ≥10 cigarettes/day
1060 241 149
1.00 1.29 (1.00–1.67) 1.47 (1.09–1.99)
--- 0.05
<0.01
404 64 46
1.00 1.50 (1.05–2.15) 1.49 (0.98–2.27)
--- 0.03 0.09
Q12. Smokers and Quitters
Never Smoker Quit
893 386 171
1.00 1.43 (1.15–1.78) 1.11 (0.82–1.52)
--- <0.01 0.51
341 114
59
1.00 1.29 (0.95–1.74) 0.95 (0.63–1.44)
--- 0.10 0.81
Q13. Self Rating of Physical Activity
Much Less Active Somewhat Less Active About the Same Somewhat More Active Much More Active
70 251 491 453 167
1.11 (0.67–1.85) 0.93 (0.64–1.35) 1.04 (0.75–1.44) 0.80 (0.57–1.13)
1.00
0.69 0.70 0.81 0.21
---
40 131 178 123
37
1.20 (0.63–2.30) 1.09 (0.64–1.84) 1.22 (0.74–2.03) 0.90 (0.53–1.55)
1.00
0.57 0.76 0.44 0.71
---
Q14. Frequency of Exercise or Sports Before BMT
≤ 1 time/week 2–4 times/week ≥ 5 times/week
223 818 391
0.85 (0.61–1.18) 1.01 (0.80–1.27)
1.00
0.33 0.93
---
109 297 101
1.24 (0.83–1.86) 1.24 (0.88–1.75)
1.00
0.30 0.22
---
Q15. Frequency of Running/Jogging Before BMT
≤ 1 time/week 2–4 times/week ≥ 5 times/week
431 806 196
1.01 (0.72–1.41) 1.14 (0.84–1.55)
1.00
0.96 0.40
---
168 291
50
1.71 (1.03–2.84) 1.43 (0.87–2.33)
1.00
0.04 0.16
---
Q16. Length of Time Running/Jogging Before BMT
≤ 1 month 2–6 months ≥ 7 months
547 719 164
1.19 (0.84–1.68) 1.14 (0.81–1.60)
1.00
0.34 0.47
---
210 244
55
1.57 (0.96–2.56) 1.64 (1.01–2.65)
1.00
0.07 0.05
---
Q17. Frequency of Exercise with Weights, Last 2 Months
≤ 1 time/week 2–4 times/week ≥ 5 times/week
701 575 153
0.94 (0.67–1.31) 1.09 (0.78–1.53)
1.00
0.71 0.61
---
316 168
27
0.94 (0.54–1.63) 1.04 (0.59–1.84)
1.00
0.83 0.89
---
Q18. Consistency of Performing Weight Training ≥ 2 Times/Week
≤ 1 month 2–3 months 4–6 months ≥ 7 months
755 331 129 214
1.08 (0.81–1.45) 1.01 (0.72–1.41) 1.13 (0.74–1.70)
1.00
0.61 0.95 0.58
---
350 81 36 45
0.99 (0.64–1.56) 1.08 (0.64–1.81) 1.16 (0.63–2.13)
1.00
0.99 0.77 0.63
---
Q19. Prior Lower Limb Injury
No Yes
1142 287
1.00 1.01 (0.80–1.30)
--- 0.89
403 109
1.00 0.99 (0.72–1.35)
--- 0.93
Q20. Did Lower Limb Injury Prevent Activity
No Yes
81 207
1.00 1.12 (0.68–1.83)
--- 0.67
29 80
1.00 1.24 (0.65–2.38)
--- 0.51
Q21. After Recovery, Returned to 100%
No Yes
13 274
0.53 (0.13–2.15) 1.00
0.37 ---
11 98
0.73 (0.26–2.02) 1.00
0.54 ---
Q22. Age at Menarche 8–10 years 11–14 years 15–26 years
29 406
65
1.11 (0.63–1.95) 1.00
1.33 (0.93–1.89)
0.71 ---
0.11
Q23. Menstrual Periods in Last Year
0 1–9 10–12 ≥ 13
b 23 58
409 23
1.32 (0.74–2.36) 1.07 (0.72–1.58)
1.00 0.85 (0.44–1.66)
0.36 0.74
--- 0.64

USACHPPM Epidemiological Report No. 12-MA-05SBA-08A
29
Table 14. Injury Hazard Ratios for Questionnaire Variables (Univariate Cox Regression) (continued)
Men Women
Variablea Response Category n Hazard Ratio
(95%CI) p-
value n Hazard Ratio
(95%CI) p-
value
Q24. 6 Months without Cycles, in Last Year
No Yes
455 46
1.00 1.02 (0.66–1.56)
--- 0.94
Q25. Taken Birth Control Pills, Last 12 Months
No Yes
264 232
1.00 0.97 (0.75–1.25)
--- 0.80
Q26. Time Since Last Pregnancy
Never Pregnant 1–6 months 7–12 months ≥ 12 months
b
446 9
16 43
1.00 1.42 (0.59–3.45) 1.38 (0.71–2.69) 1.04 (0.66–1.64)
--- 0.44 0.35 0.87
a. “Q” followed by a number indicates the question number (see Appendix D) b. Not included in the analysis for men (e) Table 15 shows the association between injury risk and the plantar surface determinations. Men and women with lower plantar surfaces generally had higher injury risk than those with normal plantar surfaces. Men with high left foot plantar surfaces also tended to have higher injury risk than men with normal plantar surfaces on the left foot; however, this was not seen for men on the right foot. Table 15. Injury Hazard Ratios for Plantar Surface Evaluations (Univariate Cox Regression)
Men Women Foot
Plantar Surface Determination n Hazard Ratio (95%CI) p-value n Hazard Ratio (95%CI) p-value
Left Low Normal High
236 1399 318
1.26 (0.98–1.62) 1.00
1.21 (0.97–1.52)
0.07 --- 0.09
70 514 133
1.41 (1.01–1.98) 1.00
1.04 (0.79–1.38)
0.04 --- 0.79
Right Low Normal High
213 1440 300
1.29 (1.00–1.36) 1.00
1.08 (0.86–1.36)
0.05 --- 0.52
60 552 105
1.32 (0.92–1.89) 1.00
0.92 (0.67–1.26)
0.14 --- 0.62
(f) Table 16 shows the association between the time to the first injury and arch height, arch index, and bony arch index. For each variable, data are grouped in the lowest 20% of values, middle 60% of values, and highest 20% of values. For both men and women, higher injury risk tends to be associated with being in the lower 20% of arch height, arch index, or lower bony arch index, compared with the midrange. There is little association between injury risk and higher arch height, arch index, or bony arch index when compared with the midranges.

USACHPPM Epidemiological Report No. 12-MA-05SBA-08A
30
Table 16. Injury Hazard Ratios for Arch Height and Arch Indices (Univariate Cox Regression) Men Women
Variable Level of Variable
(Proportional Distribution Within
Variable) n Hazard Ratio
(95%CI) p-
value
Level of Variable (Proportional
Distribution Within Variable) n
Hazard Ratio (95%CI)
p-value
Arch Height Left
12.8–27.9 mm (low 20%) 28.0–40.8 mm (mid 60%) 40.9–61.3 mm (high 20%)
357 1072 356
1.11 (0.89–1.39) 1.00
0.86 (0.68–1.09)
0.36 --- 0.22
8.8–26.7 mm (low 20%) 26.8–38.0 mm (min 60%) 38.1–53.1 mm (high 20%)
116 349 117
1.61 (1.21–2.13) 1.00
0.97 (0.71–1.34)
<0.01 --- 0.89
Arch Height Right
12.6–28.4 mm (low 20%) 28.5–41.8 mm (mid 60%) 41.9–60.6 mm (high 20%)
357 1071 357
1.43 (1.15–1.78) 1.00
1.07 (0.85–1.35)
<0.01 --- 0.56
15.5–27.4 mm (low 20%) 27.5–38.5 mm (mid 60%) 38.6–57.6 mm (high 20%)
116 349 117
1.41 (1.07–1.89) 1.00
0.91 (0.66–1.26)
0.02 --- 0.58
Arch Index Left
0.0439–0.1030 (low 20%) 0.1031–0.1539 (mid 60%) 0.1540–0.2428 (high 20%)
357 1071 356
1.28 (1.03–1.60) 1.00
0.94 (0.74–1.19)
0.03 --- 0.61
0.0358–0.1104 (low 20%) 0.1105–0.1577 (mid 60%) 0.1578–0.2395 (high 20%)
116 349 117
1.54 (1.17–2.04) 1.00
0.88 (0.64–1.21)
<0.01 --- 0.43
Arch Index Right
0.0568–0.1125 (low 20%) 0.1126–0.1616 (mid 60%) 0.1617–0.2417 (high 20%)
357 1071 356
1.40 (1.13–1.73) 1.00
1.05 (0.83–1.33)
<0.01 --- 0.68
0.0568–0.1125 (low 20%) 0.1126–0.1616 (mid 60%) 0.1617–0.2417 (high 20%)
116 349 117
1.29 (0.97–1.72) 1.00
0.89 (0.63–1.18)
0.08 --- 0.36
Bony Arch Index Left
0.0489–0.1471 (low 20%) 0.1472–0.2132 (mid 60%) 0.2132–0.3024 (high 20%)
357 1071 357
1.29 (1.04–1.61) 1.00
1.02 (0.81–1.29)
<0.01 --- 0.84
0.0489–0.1471 (low 20%) 0.1472–0.2132 (mid 60%) 0.2133–0.3024 (high 20%)
116 349 117
1.55 (1.17–2.05) 1.00
0.88 (0.64–1.22)
<0.01 --- 0.44
Bony Arch Index Right
0.0799–0.1511 (low 20%) 0.1512–0.2180 (mid 60%) 0.2181–0.3213 (high 20%)
357 1071 356
1.38 (1.11–1.71) 1.00
0.98 (0.78–1.25)
<0.01 --- 0.98
0.0799–0.1511 (low 20%) 0.1512–0.2180 (mid 60%) 0.2181–0.3213 (high 20%)
116 349 117
1.47 (1.11–1.95) 1.00
0.86 (0.62–1.19)
<0.01 --- 0.86
(g) Table 17 shows the results of the backward stepping multivariate Cox regression with group membership (E and C groups) forced into the model. Subjects with complete data on all the variables included 1,268 men (65% of the male sample) and 365 women (51% of the female sample). Among the men, injury risk was about the same for the E and C groups. Injury risk was independently associated with slower run times and smoking cigarettes in the 30 days before BMT. Among the women, injury risk was about the same for the E and C groups. Injury risk was independently associated with slower run times, smoking cigarettes in the 30 days before BMT, less time running or jogging prior to BMT, marriage, and lower bony arch index. Table 17. Injury Hazard Ratios for Study Variables (Multivariate Cox Regression) Variable Level of Variable n Hazard Ratio (95%CI) p-value
Men
Group E C
658 610
1.11 (0.89–1.38) 1.00
0.35 ---
1.5-Mile Run
8.33–11.53 minutes 11.54–12.63 minutes 12.64–13.97 minutes 13.98–20.53 minutes
330 305 310 323
1.00 0.92 (0.66–1.29) 1.33 (0.97–1.80) 1.42 (1.05–1.93)
--- 0.64 0.07 0.02
Q10. Smoked Cigarettes in Last 30 Days
No Yes
929 339
1.00 1.28 (1.01–1.61)
--- 0.04

USACHPPM Epidemiological Report No. 12-MA-05SBA-08A
31
Table 17. Injury Hazard Ratios for Study Variables (Multivariate Cox Regression) (continued) Variable Level of Variable n Hazard Ratio (95%CI) p-value
Women
Group E C
187 178
1.14 (0.85–1.55) 1.00
0.38 ---
1.5–Mile Run
9.67–14.92 minutes 14.93–16.50 minutes 16.51–18.23 minutes 18.24–31.40 minutes
103 98 83 81
1.00 1.16 (0.75–1.80) 1.11 (0.70–1.75) 1.95 (1.24–3.05)
--- 0.51 0.66
<0.01
Q10. Smoked Cigarettes in Last 30 Days
No Yes
297 68
1.00 1.39 (0.95–2.05)
--- 0.10
Q16. Length of Time Running/ Jogging Before BMT
≤ 1 month 2–6 months ≥ 7 months
147 179
39
1.21 (0.62–2.34 ) 1.74 (0.94–3.22)
1.00
0.58 0.08
---
Marital Statusb Single Married
310 55
1.00 1.53 (1.04–2.27)
--- 0.03
Bony Arch Index, Left Low (lower 20%) Normal (middle 60%) High (highest 20%)
69 219
77
1.80 (1.25–2.58) 1.00
0.91 (0.61–1.35)
<0.01 ---
0.63 b. None of the “other” marital status women were included in this analysis because only 2 subjects in this category had complete data on other variables (2) Injury Subgroup Analyses. (a) Within the E and C groups, injury risk was examined for the three plantar foot shapes. Table 18 shows the univariate Cox regression. Among the C men (all of whom wore the stability shoe), there was little difference in injury risk by plantar shape. Among the E group men, individuals with low plantar shapes who wore the motion control shoe had a higher injury risk than individuals with normal plantar shapes who wore the stability shoe. Men and women with high plantar shapes had injury risk similar to that of their normal plantar–shaped counterparts.
Table 18. Injury Hazard Ratios by Group and Plantar Foot Shape (Univariate Cox Regression) Men Women
Subjects Shoe Type Plantar
Foot Shape n Hazard Ratio
(95%CI) p-value n Hazard Ratio
(95%CI) p-value
C Subjects Only
Stability Stability Stability
Low Normal High
79 714 119
1.09 (0.70–1.70) 1.00
1.11 (0.77–1.59)
0.69 ---
0.59
23 280
41
1.50 (0.83–2.72) 1.00
0.84 (0.50–1.40)
0.18 ---
0.50
E Subjects Only
Motion Control Stability Cushion
Low Normal High
134 726 181
1.39 (1.02–1.43) 1.00
1.06 (0.76–1.43)
0.04 ---
0.73
37 272
64
1.16 (0.74–1.84) 1.00
0.95 (0.64–1.41)
0.52 ---
0.79

USACHPPM Epidemiological Report No. 12-MA-05SBA-08A
32
(b) Injury risk for the E and C groups was compared within plantar foot shapes. Table 19 shows the results of the univariate Cox regression. Among those with normal plantar shapes, all of whom wore stability shoes, E women tended to have a higher injury risk than C women. Among those with low plantar shapes, E men who wore motion control shoes (presumably designed for their foot type) tended to have a higher injury risk than C men who wore a stability shoe, although the difference was not statistically significant. Among women with high plantar shapes, E women who wore the cushioned shoe (presumably designed for their foot type) tended to have a higher injury risk than C women who wore a stability shoe, although the difference was not statistically significant. Table 19. Injury Hazard Ratios Comparing E and C Groups within Each Plantar Foot Shape (Univariate Cox Regression)
Men Women Plantar
Foot Shape Group Shoe n Hazard Ratio
(95% CI) p-value n Hazard Ratio
(95% CI) p-value
Normal E C
Stability Stability
726 714
1.05 (0.86–1.29) 1.00
0.62 ---
272 280
1.24 (0.97–1.58) 1.00
0.09 ---
Low E C
Motion Control Stability
134 79
1.33 (0.80–2.21) 1.00
0.27 ---
37 23
0.95 (0.47–1.93) 1.00
0.89 ---
High E C
Cushion Stability
181 119
1.01 (0.82–1.58) 1.00
0.98 ---
64 41
1.41 (0.78–2.58) 1.00
0.27 ---
(c) A separate analysis was performed comparing injury risk among only those individuals with high or low plantar shapes in the E and C groups. This removes the subjects with normal plantar shapes from the analysis and compares only the extreme plantar shapes. Table 20 shows that injury risk was about the same in the E and C groups (though slightly higher in the E group). Table 20. Injury Hazard Ratios by Group with Only High/Low-Arched Individuals by Plantar Surface Evaluation (Univariate Cox Regressions)
Men Women
Group n Hazard Ratio
(95%CI) p-value n Hazard Ratio
(95%CI) p-value
E C
315 198
1.14 (0.82–1.58) 1.00
0.43 ---
101 64
1.23 (0.77–1.94) 1.00
0.40 ---
d. Comparison of Plantar Surface Determination with Arch Height and Arch Indices. (1) Table 21 shows the plantar surface determinations with means and standard deviations of (Mean±SD) arch heights and arch indices. Progressively higher plantar shapes (i.e., from low to normal to high) had a correspondingly higher mean arch height, arch index, or bony arch index. Differences between all the plantar surface determinations, for all three
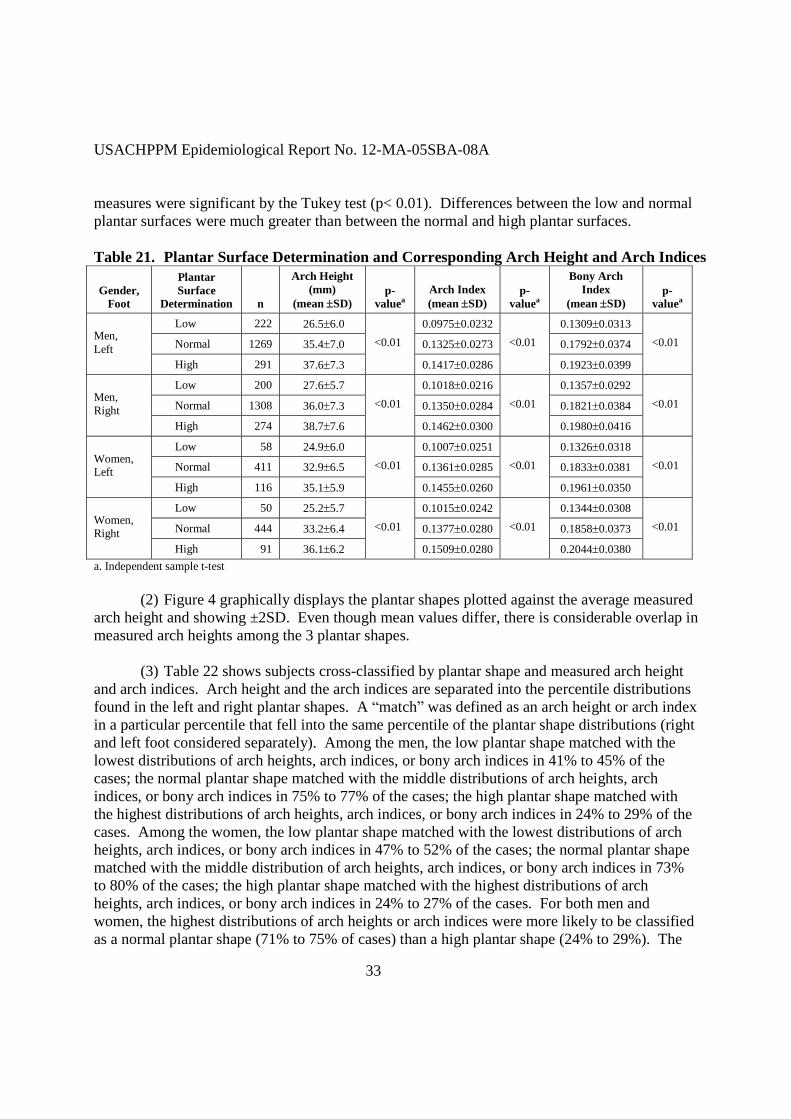
USACHPPM Epidemiological Report No. 12-MA-05SBA-08A
33
measures were significant by the Tukey test (p< 0.01). Differences between the low and normal plantar surfaces were much greater than between the normal and high plantar surfaces. Table 21. Plantar Surface Determination and Corresponding Arch Height and Arch Indices
Gender, Foot
Plantar Surface
Determination n
Arch Height (mm)
(mean SD) p-
valuea Arch Index (mean SD)
p-valuea
Bony Arch Index
(mean SD) p-
valuea
Low 222 26.56.0 0.09750.0232 0.13090.0313 Normal 1269 35.47.0 0.13250.0273 0.17920.0374 Men,
Left High 291 37.67.3
<0.01
0.14170.0286 <0.01
0.19230.0399 <0.01
Low 200 27.65.7 0.10180.0216 0.13570.0292 Normal 1308 36.07.3 0.13500.0284 0.18210.0384 Men,
Right High 274 38.77.6
<0.01 0.14620.0300
<0.01 0.19800.0416
<0.01
Low 58 24.96.0 0.10070.0251 0.13260.0318 Normal 411 32.96.5 0.13610.0285 0.18330.0381 Women,
Left High 116 35.15.9
<0.01 0.14550.0260
<0.01 0.19610.0350
<0.01
Low 50 25.25.7 0.10150.0242 0.13440.0308 Normal 444 33.26.4 0.13770.0280 0.18580.0373 Women,
Right High 91 36.16.2
<0.01 0.15090.0280
<0.01 0.20440.0380
<0.01
a. Independent sample t-test (2) Figure 4 graphically displays the plantar shapes plotted against the average measured arch height and showing ±2SD. Even though mean values differ, there is considerable overlap in measured arch heights among the 3 plantar shapes. (3) Table 22 shows subjects cross-classified by plantar shape and measured arch height and arch indices. Arch height and the arch indices are separated into the percentile distributions found in the left and right plantar shapes. A “match” was defined as an arch height or arch index in a particular percentile that fell into the same percentile of the plantar shape distributions (right and left foot considered separately). Among the men, the low plantar shape matched with the lowest distributions of arch heights, arch indices, or bony arch indices in 41% to 45% of the cases; the normal plantar shape matched with the middle distributions of arch heights, arch indices, or bony arch indices in 75% to 77% of the cases; the high plantar shape matched with the highest distributions of arch heights, arch indices, or bony arch indices in 24% to 29% of the cases. Among the women, the low plantar shape matched with the lowest distributions of arch heights, arch indices, or bony arch indices in 47% to 52% of the cases; the normal plantar shape matched with the middle distribution of arch heights, arch indices, or bony arch indices in 73% to 80% of the cases; the high plantar shape matched with the highest distributions of arch heights, arch indices, or bony arch indices in 24% to 27% of the cases. For both men and women, the highest distributions of arch heights or arch indices were more likely to be classified as a normal plantar shape (71% to 75% of cases) than a high plantar shape (24% to 29%). The

USACHPPM Epidemiological Report No. 12-MA-05SBA-08A
34
lowest distributions of arch heights or arch indices were much less likely to be classified as a high plantar shapes (<1% to 2% of cases) and the highest distributions were much less likely to be classified as low (2% to 7% of cases). Overall, arch height was correctly classified by plantar shape 64% of the time for both men and women.
26.5
37.635.4
0
10
20
30
40
50
60
70
80
Arc
h H
eigh
t (m
m)
.
Low Normal High
Plantar Foot Surface Determination
27.6
38.736.0
0
10
20
30
40
50
60
70
80
Arc
h H
eigh
t (m
m)
.
Low Normal High
Plantar Foot Surface Determination
Men’s Left Foot Men’s Right Foot
24.9
35.132.9
0
10
20
30
40
50
60
70
Arc
h H
eigh
t (m
m)
.
Low Normal High
Plantar Foot Surface Determination
25.2
36.133.2
0
10
20
30
40
50
60
70
Arc
h H
eigh
t (m
m)
.
Low Normal High
Plantar Foot Surface Determination
Women’s Left Foot Women’s Right Foot Figure 4. Comparison of Measured Arch Height with Plantar Foot Shape. Mean values are displayed and vertical bars are ±2SD.

USACHPPM Epidemiological Report No. 12-MA-05SBA-08A
35
Table 22. Classification of Subjects by Plantar Surface Determination and Measured Arch Height and Arch Indicesa
Low Plantar Shape
Normal Plantar Shape
High Plantar Shape
Variable
Percentiles of Arch Heights and Arch Indices
(Based on Distributions of Plantar Shapes) n % n % n %
Men
0.1–12.5% 101 45.3 108 48.4 14 6.3
12.6–83.7% 119 9.4 950 74.9 199 15.7 Arch Height Left
83.8–100.0% 2 0.7 211 72.5 78 26.8
0.1–11.2% 82 41.0 106 53.0 12 6.0
11.3–84.3% 115 8.8 993 76.3 194 14.9 Arch Height Right
84.4–100.0% 3 1.1 209 74.6 68 24.3
0.1–12.5% 100 44.8 110 49.3 13 5.8
12.6–83.7% 120 9.5 948 74.7 201 15.8 Arch Index Left
83.8–100.0% 2 0.7 211 72.8 77 26.6
0.1–11.2% 81 40.5 106 53.0 13 6.5
11.3–84.3% 118 9.1 1001 76.9 183 14.1 Arch Index Right
84.4–100.0% 1 0.4 201 71.8 78 27.9
0.1–12.5% 100 44.8 108 48.4 15 6.7
12.6–83.7% 120 9.5 949 74.8 199 15.7 Bony Arch Index Left
83.8–100.0% 2 0.7 212 72.9 77 26.5
0.1–11.2% 85 42.7 102 51.3 12 6.0
11.3–84.3% 114 8.8 1007 77.3 181 13.9 Bony Arch Index Right
84.4–100.0% 1 0.4 198 70.7 81 28.9
Women
0.1–9.9% 27 46.6 27 46.6 4 6.9
10.0–80.2% 29 7.1 300 73.0 82 20.0 Arch Height Left
80.3–100.0% 2 1.7 84 72.4 30 25.9
0.1–8.5% 24 49.0 23 46.9 2 4.1
8.6–84.4% 25 5.6 353 79.3 67 15.1 Arch Height Right
84.5–100.0% 1 1.1 68 74.7 22 24.2
0.1–9.9% 28 48.3 26 44.8 4 6.9
10.0–80.2% 28 6.8 302 73.5 81 19.7 Arch Index Left
80.3–100.0% 2 1.7 83 71.6 31 26.7
0.1–8.5% 23 46.9 25 51.0 1 2.0
8.6–84.4% 26 5.8 351 78.9 68 15.3 Arch Index Right
84.5–100.0% 1 1.1 68 74.7 22 24.2

USACHPPM Epidemiological Report No. 12-MA-05SBA-08A
36
Table 22. Classification of Subjects by Plantar Surface Determination and Measured Arch Height and Arch Indicesa (continued)
Low Plantar Shape
Normal Plantar Shape
High Plantar Shape
Variable
Percentiles of Arch Heights and Arch Indices
(Based on Distributions of Plantar Shapes) n % n % n %
0.1–9.9% 30 51.7 25 43.1 3 5.2
10.0–80.2% 26 6.3 302 73.5 83 20.2 Bony Arch Index Left
80.3–100.0% 2 1.7 84 72.4 30 25.9
0.1–8.5% 25 51.0 23 46.9 1 2.0
8.6–84.4% 24 5.4 354 79.6 67 15.1 Bony Arch Index Right
84.5–100.0% 1 1.1 67 73.6 23 25.3 a. Highlighted cells are where the largest agreement might be expected. Arch height and arch height indices are separated into percentiles represented by plantar surface distributions 7. DISCUSSION. a. The present study demonstrated that prescribing running shoes on the basis of the shape of plantar foot surface did not reduce injury risk in Air Force BMT. In fact, women who wore shoes prescribed for their foot type tended to have a higher injury incidence rate and a higher injury risk in the univariate Cox regression (HR(E/C)=1.23, 95%CI=1.00–1.53). However, the risk among the women wearing the prescribed shoes was reduced in the multivariate model that controlled for other significant injury risk factors (HR(E/C)=1.14, 95%CI=0.89–1.38). Men who wore the prescribed shoe also tended to have higher injury risk than the control men, but this elevated risk was small in the multivariate analysis (HR(E/C)=1.11, 95%CI=0.85–1.55) and similar to that of the women in multivariate analysis. b. The results of the current study can be compared with the results of a similar Army investigation (86) because the two studies were designed to be complementary; however, there were some important differences mandated by the respective Army and Air Force command groups. Similarities in the studies included 1) tracking of subjects in the same medical surveillance system, 2) calculation of injury indices in an identical manner, 3) the same randomized prospective cohort design with a C group receiving a single stability shoe and an E group receiving a shoe prescribed on the basis of plantar shape. Differences between the studies had to do with 1) the types of shoes, 2) the shoes selected by the E group, and 3) the nature of the training environment. C group subjects in the current Air Force study received a New Balance 498, while C group subjects in the Army study received a New Balance 767ST. E group subjects in the current Air Force study received only 1 of only 3 shoes, one for each foot type. E subjects in the Army study could select from 19 different shoes, as long as the shoe they selected had been designated by running shoe companies as appropriate for their plantar shape. There are also differences in the Army and Air Force program of instruction and length of training (6 versus 9 weeks).

USACHPPM Epidemiological Report No. 12-MA-05SBA-08A
37
c. Despite the differences in the Army (86) and Air Force studies, the results generally concur. Injury risk was slightly elevated in the group that received a shoe based on plantar shape (E group) when compared with the group that received a stability shoe regardless of plantar shape (C group). Hazard ratio comparisons for the two studies are shown in Table 23. Table 23. Comparison of Army and Air Force Studies Examining the Efficacy of Prescribing Running Shoes Based on Plantar Surface Prescription
Men Women Type of
Cox Regression Study Group n Hazard Ratio
(95%CI) n Hazard Ratio
(95%CI)
Army Stability Shoe (C) Prescribed Shoe (E)
1068 1079
1.00 1.02 (0.89–1.17)
464 451
1.00 1.06 (0.90–1.24)
Univariate
Air Force Stability Shoe (C) Prescribed Shoe (E)
913 1042
1.00 1.09 (0.92–1.29)
345 373
1.00 1.23 (1.00–1.53)
Armya Stability Shoe (C) Prescribed Shoe (E)
623 616
1.00 1.11 (0.91–1.34)
242 219
1.00 1.14 (0.91–1.44)
Multivariate
Air Force Stability Shoe (C) Prescribed Shoe (E)
610 658
1.00 1.11 (0.89–1.38)
178 187
1.00 1.14 (0.85–1.55)
a. Results are from multivariate model including fitness variables (page 34 of report, reference number 86) d. As noted earlier, motion control shoes are designed for low-arched individuals to presumably control for excessive pronation; cushioned shoes are designed for high-arched individuals to presumably provide cushioning to reduce ground impact forces and to allow for more foot pronation (25-28). If injury risk could be reduced by prescribing running shoes based on plantar shape, that reduced risk might be best seen by comparing E and C subjects at the extremes; that is, those with high and low arches. This is because E subjects wore shoes specifically designed for their foot type (motion control and cushion), while C subjects wore a stability shoe designed for another foot type. Contrary to expectation, comparing E and C subjects in this manner indicated that injury risk was slightly elevated in the E group. This indicated that even with the extreme foot types, prescribing running shoes based on plantar surface did not reduce injury risk. Again, these results concur with the Army study (86) testing the prescription efficacy as shown in Table 24. e. All C group subjects wore a stability shoe regardless of plantar shape. Injury risk was similar for all plantar shapes types regardless of the type of shoe worn. There was a tendency for women with low plantar shapes to have higher injury risk, but this subgroup included only 23 subjects. Again, these data generally concur with those from the Army study (86) as shown in Table 25. These data suggest that individuals in basic training can wear a standard stability shoe regardless of plantar shape and the associated injury risk will be as low or lower than if they wore a shoe prescribed on the basis of foot arch height.

USACHPPM Epidemiological Report No. 12-MA-05SBA-08A
38
Table 24. Comparison of Army and Air Force Studies Including Only High and Low Plantar Surface Individuals (Univariate Cox Regression Analyses)
Men Women
Study Groupa n Hazard Ratio
(95%CI) n Hazard Ratio
(95%CI)
Army Stability Shoe (C) Prescribed Shoe (E)
299 295
1.00 1.23 (0.96–1.59)
119 124
1.00 1.16 (0.85–1.58)
Air Force Stability Shoe (C) Prescribed Shoe (E)
198 315
1.00 1.14 (0.82–1.58)
64 101
1.00 1.23 (0.77–1.94)
a. The Stability Shoe (C) group and Prescribed Shoe (E) group include ONLY individuals with high and low plantar shapes (i.e., individuals with normal plantar shapes are excluded) Table 25. Comparison of Army and Air Force Studies Including Only C Subjects Who Wore the Stability Shoe Regardless of Plantar Shape (Univariate Cox Regression Analyses)
Men Women
Study Plantar Shape n Hazard Ratio
(95%CI) n Hazard Ratio
(95%CI)
Army Low Normal High
137 768 162
1.01 (0.76–1.24) 1.00
0.93 (0.70–1.24)
38 345
81
0.74 (0.47–1.18) 1.00
1.05 (0.78–1.41)
Air Force Low Normal High
79 714 119
1.09 (0.70–1.70) 1.00
1.11 (0.77–1.59)
23 280
41
1.50 (0.83–2.72) 1.00
0.84 (0.50–1,40)
f. Despite the general concurrence between the Army (86) and Air Force investigations, these studies are not in accord with a previous study (29) that showed a postwide decrease in serious injuries at Fort Drum, New York, after initiation of a running shoe prescription program. Methodological differences between the Fort Drum project and the current Air Force study are similar to those previously outlined between the Ft Drum study and the Army footwear study (29). The current Air Force study involved a prescription based only on plantar shape; the Fort Drum study involved a prescription based on an evaluation of foot arch height and foot flexibility. The current Air Force study involved a population of recruits in a situation where there was assurance that the correct shoe was obtained and worn. The Fort Drum study involved Soldiers who were given the shoe prescription, but there was little follow-up to determine whether they had actually purchased and/or worn the recommended shoe. In fact, a survey involving a convenience sample of 122 Fort Drum Soldiers (out of an average 9,752 estimated to be on post) found that only 11% had followed the shoe prescription advice. The current Air Force study involved a prospective shoe prescription involving two groups training side by side in a standardized 6-week program with follow-up for any injury occurring during the period. The Fort Drum study involved a retrospective examination of medical visits to a physical therapy clinic before and after the shoe program was initiated. A number of temporal factors were potential confounders in the Fort Drum study, and these were discussed at length in the report on that study (29). The major potential confounder was the change in the medical surveillance

USACHPPM Epidemiological Report No. 12-MA-05SBA-08A
39
system used to track injuries, which occurred at the exact point when injuries began to decrease. Thus, the current Air Force study involved manipulation of only one variable (running shoe prescription based on plantar shape), provided considerably better knowledge about the shoes worn, and involved a more controlled training environment. g. As noted in the background section of this paper, it is not clear whether or not gait mechanics differ in high- and low-arched individuals who are not symptomatic or who have not had a prior injury (19-21). There is some evidence that symptomatic individuals or individuals with prior injury may be more likely to have altered gait mechanics (16, 18, 105). We did not obtain the symptomology of the subjects in this study, but they can be assumed to be healthy and relatively symptom-free since they had been initially cleared for BMT in the MEPS. When asked on the questionnaire whether they had had a previous lower limb injury, only 20% (overall) responded positively. However, a global question like this may not capture all subjects with prior lower limb injury: studies comparing injury rates over various recall periods have shown that as the recall period increases, self-reported injury rates decrease (106-108). Nonetheless, the screening procedures and the low positive response to the prior injury question suggest that the number of symptomatic subjects in this study was probably low. a. Plantar Surface Determination and Measured Arch Height and Arch Indices. (1) The prescription of running shoes was based on the plantar foot surface evaluation because this method was being used in Army BCT at the time of the study and comparability was desired between the Air Force and Army studies (86). Further, this technique is similar to a common self-evaluation technique (the wet test) recommended by running magazines, shoe companies, and other publications (1, 13-15). This self-evaluation technique is used because plantar shape is presumed to reflect arch height and it is arch height for which running shoe types are presumably designed (1). In the current study, average arch height values did differ among the three plantar shapes with higher plantar shapes reflecting higher arch heights. However, there was considerable overlap in the individual arch height values within the three plantar surface determinations. This concurs with the Army study (86), which had essentially identical findings. (2) In the current study, over 75% of individuals classified as normal plantar shapes were matched with the middle distribution of measured arch heights. However, there was also a strong bias for those with high and low measured arch heights to be classified as having normal plantar foot surfaces (51% to 76% of cases). In fact, only 24% to 49% of the measured arch heights were correctly matched with the high and low plantar shapes. Moreover, a much lower percentage of the high-arched individuals were correctly classified compared with low-arched individuals.

USACHPPM Epidemiological Report No. 12-MA-05SBA-08A
40
(3) Comparisons of the two extreme plantar shapes showed much less overlap. High plantar surface cases were seldom found in the lowest measured arch height or arch indices (≤ 7% of cases) and low plantar surface cases were rarely found in the highest of the arch heights or arch indices (≤ 2%). Nonetheless, the bias toward the normal plantar classification brings into question the practice of using plantar surface ratings as a surrogate for arch height when this is used for individual assessment. b. Foot Arch Height, Foot Indices, and Injuries. (1) Injury risk was higher among individuals with lower arch heights or lower arch indices when compared with those with normal arch heights or arch indices. In fact, among the women, a low bony arch index was an independent injury risk factor in the multivariate Cox regression analysis. The Army running shoe study (86) demonstrated a trend toward higher risk among men with low arch heights or low arch indices. These results are not in accord with Cowan et al. (4), who showed higher injury risk among high-arched Army infantry recruits and lower risk among low-arched infantry recruits. The results are in partial accord with those of Kaufmann et al. (3), who showed higher injury risk among both high- and low-bony arch indexed Navy Sea, Air, and Land (SEAL) candidates. (2) Examination of the methodologies of the Cowan et al. (4) and Kaufmann et al. (3) studies might be instructive in accounting for the differences in the findings. Cowan et al. (4) took pictures of the right foot of 246 male infantry recruits while they stood with their weight on that foot. A calibration device was included in the picture frame and pictures were digitized to determine arch heights and foot lengths. Recruits were classified into those with the highest 20% and lowest 20% of 1) arch heights (floor to navicular bone), 2) arch index, and 3) bony arch index. After this evaluation, the recruits participated in the 12-week infantry basic training program. Recruits with the highest arch heights, highest arch index, or highest bony arch index were at the highest risk of a lower extremity injury; lower extremity injury risk was lowest among those with the lowest arch height, arch index, or bony arch index. Compared with the recent Army (86) and current Air Force running shoe studies, Cowan et al. (4) used a different subject population, different methods of arch measurement (pictures versus direct measurements), and a different definition of injury. In addition, recruits trained for a longer time in a different training environment. These methodological differences might account for some of the discrepant findings. (3) Kaufmann et al. (3) collected bony arch index data on 423 SEAL candidates prior to their 25-week training program. Methods for obtaining the measurements (photographs, direct measures, etc.) were not described and the units of measure were not noted. Compared with those with “normal” bony arch values (20.0–22.8), those defined as pes cavus (> 22.8) or pes planus (< 20.0) tended to have a higher incidence of stress fractures, Achilles tendinitis, and iliotibial band syndrome, although the differences were not statistically significant. The paucity of the methodological description make direct comparisons with the recent Army (86) and

USACHPPM Epidemiological Report No. 12-MA-05SBA-08A
41
current Air Force running shoe studies difficult. As with Cowen et al. (4), differences in subject populations, length of training time, training environments and injury definitions are likely to account for some of the differences. (4) Arch height and arch index values in the current study can be compared with those of Cowan et al. (4), since the measures were obtained using the same anatomical landmarks. As shown in Table 26, average values for all three measures of the right foot of the men in the current study were about 30% less than the right foot of the men in the Cowan et al. (4) study. The lower arch heights in the Cowan et al. (4) study may be attributed to placing the entire body weight on one foot as opposed to about half the body weight in the current study (weight was equally distributed on both feet in the current study). Men in the current study generally demonstrated a range of values similar to that of Cowan et al. (4) for all three measures. Table 26. Comparison of Arch Heights and Arch Indices in the Current Study and in the Study of Cowan et al. (4)
Measure Level of Measure Cowen et al. (4)
(Men, Right Foot) Current Study
(Men, Right Foot)
Mean SD 46.0 ± 6.1 35.5±7.8 20% Lowest 27.2–40.8 12.6–28.5
60% Middle 40.9–50.8 28.6–41.8 Navicular Height (mm)
20% Highest 50.9–60.5 41.9–49.0
Mean SD 0.17 ± 0.02 0.13±0.03 20% Lowest 0.10–0.15 0.05–0.11
60% Middle 0.15–0.19 0.11–0.16 Arch Index
20% Highest 0.19–0.24 0.16–0.18
Mean SD 0.24 ± 0.04 0.18±0.04 20% Lowest 0.14–0.21 0.06–0.14
60% Middle 0.21–0.27 0.14–0.21 Bony Arch Index
20% Highest 0.27–0.34 0.21–0.25
(5) Table 27 compares the arch height, arch indices and foot length values in the current study with that of the complementary Army running shoe study (86). Anatomical landmarks were identical in the two studies. Average values for the arch height and the arch indices were 7% to 17% lower in the current Air Force study compared with the Army study but the variances (SD) in the two studies was very similar. Average foot lengths and MPJ lengths were very similar in the two studies.
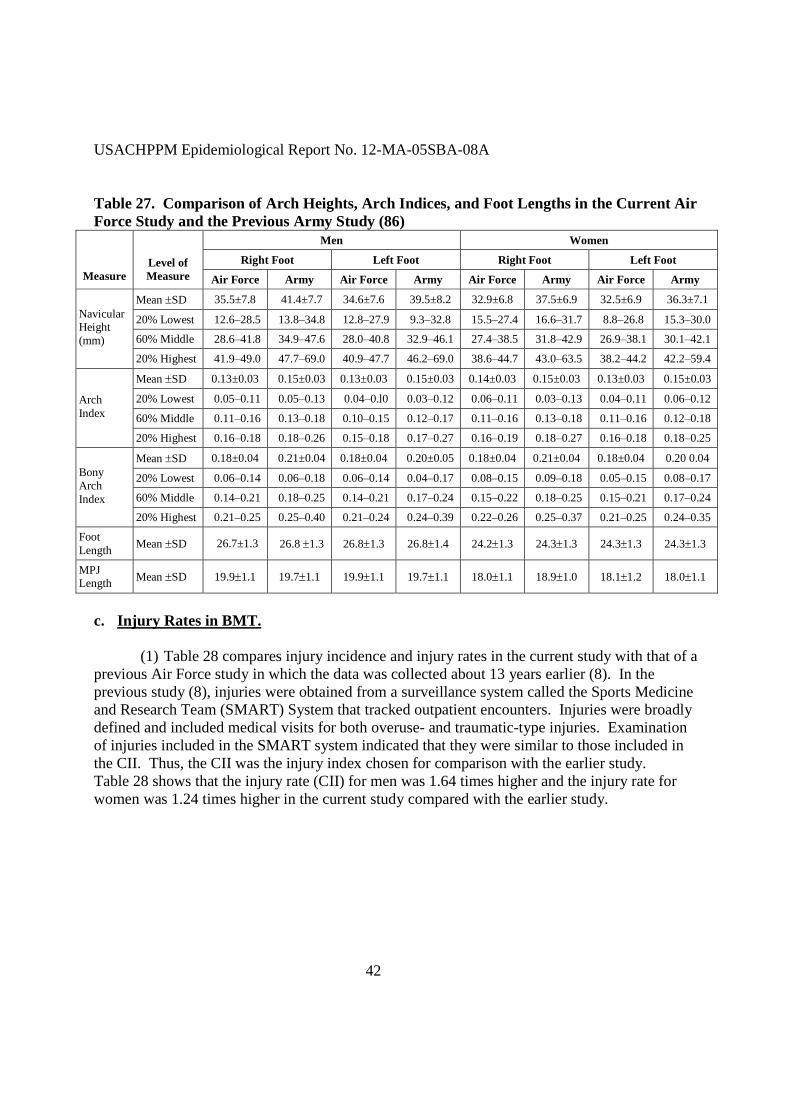
USACHPPM Epidemiological Report No. 12-MA-05SBA-08A
42
Table 27. Comparison of Arch Heights, Arch Indices, and Foot Lengths in the Current Air Force Study and the Previous Army Study (86)
Men Women
Right Foot Left Foot Right Foot Left Foot Measure
Level of Measure Air Force Army Air Force Army Air Force Army Air Force Army
Mean SD 35.5±7.8 41.4±7.7 34.6±7.6 39.5±8.2 32.9±6.8 37.5±6.9 32.5±6.9 36.3±7.1
20% Lowest 12.6–28.5 13.8–34.8 12.8–27.9 9.3–32.8 15.5–27.4 16.6–31.7 8.8–26.8 15.3–30.0
60% Middle 28.6–41.8 34.9–47.6 28.0–40.8 32.9–46.1 27.4–38.5 31.8–42.9 26.9–38.1 30.1–42.1
Navicular Height (mm)
20% Highest 41.9–49.0 47.7–69.0 40.9–47.7 46.2–69.0 38.6–44.7 43.0–63.5 38.2–44.2 42.2–59.4
Mean SD 0.13±0.03 0.15±0.03 0.13±0.03 0.15±0.03 0.14±0.03 0.15±0.03 0.13±0.03 0.15±0.03
20% Lowest 0.05–0.11 0.05–0.13 0.04–0.l0 0.03–0.12 0.06–0.11 0.03–0.13 0.04–0.11 0.06–0.12
60% Middle 0.11–0.16 0.13–0.18 0.10–0.15 0.12–0.17 0.11–0.16 0.13–0.18 0.11–0.16 0.12–0.18
Arch Index
20% Highest 0.16–0.18 0.18–0.26 0.15–0.18 0.17–0.27 0.16–0.19 0.18–0.27 0.16–0.18 0.18–0.25
Mean SD 0.18±0.04 0.21±0.04 0.18±0.04 0.20±0.05 0.18±0.04 0.21±0.04 0.18±0.04 0.20 0.04
20% Lowest 0.06–0.14 0.06–0.18 0.06–0.14 0.04–0.17 0.08–0.15 0.09–0.18 0.05–0.15 0.08–0.17
60% Middle 0.14–0.21 0.18–0.25 0.14–0.21 0.17–0.24 0.15–0.22 0.18–0.25 0.15–0.21 0.17–0.24
Bony Arch Index
20% Highest 0.21–0.25 0.25–0.40 0.21–0.24 0.24–0.39 0.22–0.26 0.25–0.37 0.21–0.25 0.24–0.35
Foot Length Mean SD 26.7±1.3 26.8 1.3 26.81.3 26.81.4 24.21.3 24.31.3 24.31.3 24.31.3
MPJ Length Mean SD 19.91.1 19.71.1 19.91.1 19.71.1 18.01.1 18.91.0 18.11.2 18.01.1
c. Injury Rates in BMT. (1) Table 28 compares injury incidence and injury rates in the current study with that of a previous Air Force study in which the data was collected about 13 years earlier (8). In the previous study (8), injuries were obtained from a surveillance system called the Sports Medicine and Research Team (SMART) System that tracked outpatient encounters. Injuries were broadly defined and included medical visits for both overuse- and traumatic-type injuries. Examination of injuries included in the SMART system indicated that they were similar to those included in the CII. Thus, the CII was the injury index chosen for comparison with the earlier study. Table 28 shows that the injury rate (CII) for men was 1.64 times higher and the injury rate for women was 1.24 times higher in the current study compared with the earlier study.

USACHPPM Epidemiological Report No. 12-MA-05SBA-08A
43
Table 28. Comparison of Injury Incidence and Injury Rate in Current Study and that of Snedecor et al. (8)
Study Year Data Collected Gender n Injury Incidence (%)
Injury Rate (injured
Airmen/month)
Men 8,660 16.8 11.2 Snedecor et al. 1994–1995
Women 5,250 37.8 25.2
Men 1,979 27.6 18.4 Currenta 2007
Women 723 46.9 31.3 a. Injury index is the CII (2) The higher injury rates in the current study could be at least partially due to changes that have occurred in the BMT program of instruction since 1999 in response to changing world conditions. Since 1999 recruits have spent more time training on field security, fighting positions, checkpoint operations, road marching, confidence courses, M-16 rifle, and cover and concealment. Recruits spend more time in the field. A two-day perimeter defense exercise (“Scorpion’s Nest”) has recently been developed and is designed to simulate defense of a fixed airfield in hostile territory. Activities during this exercise include patrolling, defense against infiltration, and area operations under simulated attacks (109-112). (3) Besides changes in the program of instruction, the Air Force also replaced the cycle ergometer test with the current 1.5 mile running test in 2004. It can be assumed that this increased emphasis on running during BMT. It has been shown that longer running distance is associated with a higher incidence of injury in both military (98, 99) and civilian (113-116) environments d. Injury Risk Factors. The present study is the first to examine risk factors for injuries in BMT. A number of risk factors previously identified in Army and Marine basic training were also established here. (1) Physical Fitness. (a) Higher injury risk was associated with lower aerobic fitness (i.e., slower 1.5-mile run times), as has been found in much of the literature when aerobic fitness is measured with either a maximal effort run (75, 76, 78, 81, 85, 86, 96, 117-119) or VO2max (81, 120). Importantly, slower run times were independent risk factors when considered in the multivariate model. Lower fit individuals are likely to fatigue more rapidly for both cardiovascular and metabolic reasons (121, 122). Fatigue has been shown to result in changes in economy (123, 124) and gait (123-128), which may put more stress on body regions not accustomed to stress. Individuals with lower aerobic capacity may perceive long-term low intensity tasks as more difficult (129). The combined cardiovascular, metabolic, biomechanical, and perceptual stress could make injuries more likely in these less fit individuals.

USACHPPM Epidemiological Report No. 12-MA-05SBA-08A
44
(b) Higher injury risk was also associated with lower muscular endurance (push-ups and crunches). Men and the women tended to have higher injury risk at the lowest muscular endurance quartile. Among the men, the relationship between muscular endurance and injury was such that progressively lower performance levels resulted in progressively higher injury risk. These findings are generally in consonance with previous Army (77, 81, 86) data showing a similar relationship. Like aerobic fitness, individuals with lower levels of muscular endurance will be required to work at a larger percentage of their maximal muscular endurance capacity during physical activities in BMT that require this fitness component (e.g., obstacle courses, climbing). In a manner analogous to aerobic fatigue, individuals with lower muscular endurance may perceive a greater level of stress and need to recruit different muscle groups as the active muscle groups begin to fatigue (127, 130, 131). The unaccustomed stress may make injuries more likely. (2) Height and Weight. In the current study there was no relationship between injury risk and body weight and this is in consonance with other basic training studies that have examined this relationship (81, 86, 132). There was also no association between injury risk and height in the current study. Previous basic training studies examining associations between injury risk and height are conflicting. One study found that shorter Australian Air Force recruits were at higher injury risk (132), while a study of Army recruits found that shorter women, but not shorter men, were at higher risk (78). Another study found no relationship between injury risk and height in Army BCT (81). In multivariate analysis, height was not found to be an independent injury risk factor (132). In the present study and another that found no relationship between height and injury (81), height was collected only to the nearest inch. Studies using finer graduations in centimeters (132) or tenths of centimeters (78) find that shorter individuals are at higher injury risk. Use of finer graduations of height may allow more accurate classification of shorter individuals. (3) Body Mass Index. (a) In the current study, there tended to be a bimodal relationship between BMI and injury risk among the men: those having both high and low BMI were at increased risk compared with the middle group. Some Army studies also report bimodal relationships among male recruits (78, 86), but others have shown no relationship (77, 81) or increased risk with higher BMI (132). One study of Chinese Armed Forces Police found that those with low BMI were at higher injury risk (133). (b) In the current study, women with higher BMI tended to be at higher injury risk than those in the middle quartile. A similar trend was reported in one Army recruit study (81), but in studies of female Army recruits (76, 78) and female Marines (134) bimodal relationships have been reported. Another Army study found that women in the lowest decile of BMI tended to be at slightly higher injury risk (86).

USACHPPM Epidemiological Report No. 12-MA-05SBA-08A
45
(c) There is evidence that BMI has been increasing in Army recruits over the last 30 years (86, 135), but also evidence that the weight gain that accounts for most of the change in BMI (height has changed little) is about evenly distributed between fat and fat-free mass (135, 136). Generally, BMI shows a close relationship with body fat in military and civilian samples, demonstrating correlations on the order of 0.7 (102, 137, 138). However, this means that only about 50% of the variance in BMI is accounted for by body fat. The relationship between BMI and injury in basic training is likely to be complex because individuals can have a high BMI either because of higher body fat or because of higher fat-free mass. If high BMI reflects a larger percentage of body fat relative to height, injury risk might be increased because the additional fat burden would both 1) increase the intensity of physical activity (139) leading to more rapid fatigue and 2) impose additional repetitive stress on the musculoskeletal system. However, body fat has not shown a consistent relationship with injuries in Army BCT (76, 78, 81). In contrast to high BMI, low BMI may reflect a paucity of either fat, fat-free mass, or both. Low BMI may make recruits more susceptible to injury if they lack the muscle mass or strength in the supportive structures (ligaments, bones) required to perform certain physical tasks and overexert or overuse the available muscle mass or supportive structures. Since various studies, including the current one, have demonstrated that both high and low BMIs are associated with injury in basic training (76, 78, 86, 132, 134), a bimodal relationship is most plausible and could probably be demonstrated with larger sample sizes. (4) Cigarette Smoking. (a) Both men and women who had smoked cigarettes in the 30 days before BMT were at increased injury risk and cigarette smoking was an independent injury risk factor in the multivariate analysis. Cigarette smoking prior to basic training has consistently been associated with increased injury risk both in US Army BCT (77, 81, 86, 140, 141) and in the army basic training in other countries (118, 142). Further, smoking was associated with injury in infantry soldiers (143) and in other occupational groups (120, 144-150). Among the men in the current study, there was a dose-response relationship such that a greater number of cigarettes/day was associated with higher injury risk. Basic training studies that included various levels of smoking have also demonstrated this dose-response relationship (77, 81, 86, 118, 140). (b) With regard to the possible mechanisms and the biological plausibility of the association between injury risk and cigarette smoking, there is considerable literature showing that cigarette smoking impairs wound healing (151-155), bone healing (156-160), tissue strength (161-166), and immune function. The immune system is important for wound healing, since macrophages, leukocytes, and lymphocytes regulate various steps in the wound-healing process and remove or assist in removal of damaged tissue (167-170). The macrophages of smokers have lower phagocytic activity, lower responsiveness to bacterial challenge, and reduced gene expression of the proinflammatory cytokines important for tissue healing (171-173).

USACHPPM Epidemiological Report No. 12-MA-05SBA-08A
46
(c) In BMT, all subjects ceased smoking at the beginning of training; thus the mechanism accounting for the association between smoking and injuries must last into the BMT period. Evidence for the longer-term effects of smoking come from studies on collagen metabolism, skin damage, immune function, and possibly bone tissue. One study (174) followed weekly urinary hyrdoxyproline/creatine levels (indicative of collagen metabolism) from individuals 14 weeks after they ceased smoking. It was estimated (by mathematical modeling) that hydoxyproline/creatine levels would return to the level of nonsmokers in about 71 weeks, among those who had previously smoked ≤ 40 cigarettes/day, while it would take 120 weeks to reach the same level in those who had been smoking > 40 cigarettes/day. Other studies have shown that tobacco users have more than twice the risk of moderate to severe facial wrinkling (indicative of skin damage) compared with nonusers, even after controlling for age, sun exposure, and body mass index (175-177). Smoking reduction (at least 50%) for 6 to 8 weeks prior to surgery has been shown to be associated with an almost threefold reduction in postsurgical complications (at 10 days post-surgery) (178). Immune studies suggest that smoking-induced leukocytosis slowly decreases over time once smoking ceases (179-185). One day to 6 weeks after smoking cessation, the leukocyte count was still elevated (181, 185). Three months after smoking cessation, the neutrophil concentration tended to decrease (180). Leukocyte counts approached the level of nonsmokers the longer it had been since the individual stopped smoking, but men who had quit smoking for 10 years or more still had higher leukocyte counts that nonsmokers in one study (182). Another investigation showed that men and women who had quit smoking for an average of 11 years had counts similar to those who had never smoked (179). (d) Besides physiological mechanisms, psychosocial factors must also be considered in accounting for the association between cigarette smoking and injury. Air Force recruits who were cigarette smokers had higher scores than nonsmokers on various measures of risk taking. These included greater rebelliousness, less seat belt use, more risky sex, more favorable view of illegal drug use, more alcohol use, more binge drinking, less physical activity, less intake of fruits and vegetables, and greater intake of high-fat foods (186). An overall measure of risk taking was also higher in the Air Force recruit smokers (186). In civilian studies, smokers had more motor vehicle accidents, more traffic violations, less seat belt use, less physical activity, more alcohol consumption, and lower intake of fruits and vegetables (187-189). Heavy smoking (≥ 20 cigarettes/day) is much more likely to be associated with multiple risk behaviors (189). It is possible that this higher risk-taking behavior of smokers manifests itself in the activities of BMT and results in a higher injury rate among smokers. (5) Physical Activity. (a) Six items on the questionnaire dealt with physical activity prior to BMT. None of these questions was associated with injury among the men. This is in sharp distinction to other studies of Army and Marine recruits, all of which have shown that higher levels of pre-basic training physical activity reduced injury risk in training (6, 7, 70, 77, 78, 81, 86, 118, 133). The

USACHPPM Epidemiological Report No. 12-MA-05SBA-08A
47
intensity of BMT may be lower than that of Army and Marine basic training and prior physical training on the part of the men may be less associated with injury for this reason. (b) On the other hand, women who had performed more running/jogging or had been running/jogging for a long period of time before BMT tended to be at lower injury risk. In BMT, subjects perform weight-bearing physical activity primarily in the form of standing (in formation), walking, and running. It seems reasonable that a higher frequency of weight-bearing physical training prior to BMT would result in less susceptibility to injury, especially for women, who have lower fitness levels than men, on average (136). Physical activity has several favorable influences on the body. Physical activity of the proper intensity, frequency, and duration can increase aerobic fitness, muscle strength, connective tissue strength, and general health, and can reduce body fat (190-197). Bone mineral density is higher in physically active individuals (141, 198-202) and higher bone mineral density has been associated with greater weekly physical activity (200). These and other factors may contribute to reducing susceptibility to injury (203).
(6) Marital Status. (a) Men who were of “other” marital status (divorced, widowed, or separated) tended to have a higher injury than single men. Only five men were in the “other” category and normally this would advise caution in interpreting this association. However, the Army running shoe study (86) also found that men of “other” marital status were at higher injury risk than those who were single and had never been married. It might be assumed that those of “other” marital status might be older and this could be the intervening factor explaining the relationship, since risk was slightly elevated in the oldest subjects. The average age (±SD) of single, married, and “other” men in this study were 21±2, 23±3, and 25±3, respectively (p<0.01). However, when age and marital status were jointly included in a multivariate model with injury as the dependent variable, age had minimal effects on the marital status on the hazard ratios, as shown in Table 29. Table 29. Injury Hazard Ratios for Age and Marital Status (Multivariate Cox Regression)
Men Women
Variable Level of Variable n Hazard Ratio
(95%CI) p-value n Hazard Ratio
(95%CI) p-value
Age 18–19 years 20–24 years ≥ 25 years
445 1267 160
1.00 1.11 (0.90–1.38) 1.27 (0.90–1.80)
--- 0.33 0.17
154 441 79
1.00 1.09 (0.83–1.43) 0.95 (0.63–1.44)
--- 0.54 0.82
Marital Status
Single Married Other
1649 218
5
1.00 1.02 (0.76–1.34) 2.80 (0.89–8.79)
--- 0.89 0.08
553 113
8
1.00 1.33 (1.00–1.77) 1.53 (0.63–3.72)
--- 0.05 0.35
(b) Among the women, those who were married had higher injury risk than single women and marital status was an independent risk factor for injury in the multivariate model. Married female Army recruits have been shown to have higher injury risk in two BCT

USACHPPM Epidemiological Report No. 12-MA-05SBA-08A
48
investigations (75, 86), although a third found this relationship only in the male recruits (96). The most recent Army BCT study also found that married status was an independent injury risk factors in multivariate analysis (86). In some of these past studies, when marital status was stratified by age, the marital status effect was considerably diminished (75, 96). The average ages (±SD) of those who were single, married, and “other” were 21±2, 23±3 and 25±5 years, respectively (p<0.01). However, when age and marital status were jointly included in a multivariate model, with injury as the dependent variable, results concurred with the data for men: age had minimal effects on the marital status hazard ratios, as shown in Table 29. Generally, civilian studies have shown that married individuals experience a lower injury rate than nonmarried individuals (204, 205). The higher injury rate in single individuals in civilian studies has been attributed to higher risk-taking behaviors (205, 206). However, in BMT this is not likely to be the case because all individuals perform the same activities so that a single individual cannot take additional risks. It may be that married individuals who receive emotional and physical support from their partners lack this support in BMT, since contact with their spouse and children is extremely limited. Conversely, it is also possible that married women may experience more stress in BMT due to family pressures and this manifests itself in a higher injury rate mediated by factors like distraction, lack of attention, or other problems. e. Comparison of Physical Characteristics and Demographics with Previous Air Force
Data. (1) Snedecor et al. (8) reported on the age and physical characteristics of 8,660 men and 5,250 women entering BMT after 1 October 1994 and completing BMT by 30 June 1995. Data in the current study were collected in April through July 2007, about 13 years after the Snedecor et al. investigation (8). A comparison of age and the physical characteristics in the Snedecor et al. study with those of the current study is shown in Table 30. Subjects in the present study were slightly older than in the Snedecor et al. study. Among the men, body weight and BMI were 5.0% and 5.7% higher, respectively, in the current study. Among the women, body weight and BMI were 8.6% and 8.3% higher, respectively, in the present study. Temporal trends indicating an increase in body weight and BMI have been noted in Army data (86, 135) and in national samples (207, 208), supporting the findings in this comparison. Table 30. Comparison of Physical Characteristics in the Present and Past (1994–1995) Studies
Snedecor et al. Study (8) Present Study Characteristic Men Women Men Women
Age (yr) 19.6±2.0 19.6±2.1 21.2±2.3 21.4±2.8 Height (in) 70±3 65±3 70±3 65±3 Weight (lbs) 159±23 128±16 167±23 139±19 BMI (kg/m2) 22.9±2.8 21.5±2.1 24.2±2.7 23.3±2.7

USACHPPM Epidemiological Report No. 12-MA-05SBA-08A
49
(2) The Snedecor et al. (8) study also reported on demographics. A comparison of the demographics from that study with those from the current study is shown in Table 31. There was little difference in the racial distribution between the two studies, although the number of women of “other” races is slightly higher in the present study. With regard to educational level, the current study had a smaller proportion of men and women with college experience and more high school graduates. Among the men, the distribution of married and single individuals was similar in the two studies; among the women, the current study had a larger proportion of married individuals than did the previous study. Table 31. Comparison of Demographics in the Present and Past (1994–1995) Studies
Snedecor et al. Study (8) Current Study Characteristic Men (%) Women (%) Men (%) Women (%)
Race Black White Other
12.4 79.9
7.8
20.8 72.0
7.1
14.6 78.0
7.4
19.7 70.0 10.2
Educational Level High School Graduate 1–4 Years College Unknown
82.5 16.5
1.0
81.2 18.4
0.4
93.3
4.4 2.3
92.1
6.4 1.5
Marital Statusa Single Married
88.1 11.9
87.7 12.3
88.3 11.7
83.0 17.0
a. “Unknowns” were eliminated from the analysis. f. Comparison of Physical Characteristics and Lifestyle Variables in Current Study
and Army Study. (1) Table 32 shows a comparison of the average physical characteristics in the current Air Force study with that of the complementary Army study (86) in which the data were collected about the same time. Army men and women tended to be slightly older. This is most likely because the maximum age for entering the Army was recently increased to 42 years (209-211) while the maximum age for entering the Air Force remained at 35 years. About 3% of the Army men and 6% of Army women were over 35 years of age. Army men also tended to be heavier and shorter than their Air Force counterparts, resulting in a higher BMI. Air Force and Army women were similar in their physical characteristics.

USACHPPM Epidemiological Report No. 12-MA-05SBA-08A
50
Table 32. Comparison of Physical Characteristics in the Current Study and the Army Study
Men Women Characteristic Current Army Current Army
Age (years) 21.2±2.3 23.0±4.8 21.4±2.8 23.2±5.6 Height (inches) 70±3 69±3 65±3 64±3 Weight (lbs) 167±23 173±32 139±19 138±23 BMI (kg/m2) 24.2±2.7 25.5±4.3 23.3±2.7 23.7±3.3
(2) Table 33 compares the current Air Force data with that of the complementary Army study (86) on tobacco use, physical activity, injury history, and other variables. The questionnaire used in both studies was identical and administered about the same time allowing for direct comparisons (Appendix D). Compared with the Air Force recruits, more Army recruits had smoked 100 or more cigarettes in their lives and reported being younger when they began smoking. The prevalence of cigarette smoking ≥ 20 days in the 30 days before basic training was more than twice as high among Army recruits compared with Air Force recruits. Army recruits also rated themselves as less physically active than their peers and reported a lower frequency of 1) exercise or sport, 2) running or jogging, and 3) weight training before basic training. Also, the number of months running/jogging or weight training prior to basic training was shorter for Army recruits. Army recruits reported a lower prevalence of lower limb injuries compared with the Air Force. Among the women, Army and Air Force recruits reported about the same number of menstrual periods in the last year and about the same proportion of recruits had gone 6 months without a menstrual cycle. A much larger proportion of Air Force women had taken birth control pills in the last year. Whereas only 13% of Air Force women had previously been pregnant, over 35% of Army women had been. Table 33. Comparison of Lifestyle Variables in the Current Air Force Study and the Previous Army Study (86)
Men Women
Variable Response Category
Air Force Study (% in Category)
Army Study (% in
Category)
Air Force Study (% in Category)
Army Study (% in
Category)
Smoked 100 Cigarettes in Life?
No Yes
68.1 31.9
46.7 53.3
72.7 27.3
54.9 45.1
Age At Which Started Smoking
Never Smoked 6–9 years old 10–14 years old 15–19 years old ≥ 20 years old
53.3 0.6
11.0 32.3
2.8
32.7 2.6
20.8 38.0
5.8
60.5 0.0
10.8 27.1
1.5
42.1 1.5
22.2 30.5
3.8
Days Smoked Cigarettes in Last 30 Days
None 1–9 days 10–19 days ≥ 20 days
73.8 7.0 4.7
14.9
50.8 10.1
7.7 31.5
77.8 3.5 5.2
13.5
57.3 8.7 5.5
28.5

USACHPPM Epidemiological Report No. 12-MA-05SBA-08A
51
Table 33. Comparison of Lifestyle Variables in the Current Air Force Study and the Previous Army Study (86) (continued)
Men Women
Variable Response Category
Air Force Study (% in Category)
Army Study (% in
Category)
Air Force Study (% in Category)
Army Study (% in
Category)
Self Rating of Physical Activity Compared with Others of Similar Age and Sex
Much Less Active Somewhat Less Active About the Same Somewhat More Active Much More Active
4.9 17.5 43.3 31.6 11.7
8.9 24.6 33.1 25.9
7.3
5.7 18.3 24.8 17.2
5.1
16.7 31.4 26.8 21.6
3.5
Frequency of Exercise or Sports Before Basic Training
≤ 1 time/week 2–4 times/week ≥ 5 times/week
11.3 41.3 19.8
27.7 54.4 18.0
21.3 58.7 20.0
36.9 49.4 13.7
Frequency of Running/Jogging Before Basic Training
≤ 1 time/week 2–4 times/week ≥ 5 times/week
30.0 56.2 13.7
46.1 45.3
8.6
33.1 57.1
9.7
50.4 42.1
7.5
Frequency of Exercise with Weights, in Last 2 Months
≤ 1 time/week 2–4 times/week ≥ 5 times/week
49.1 40.2 10.7
60.7 32.2
7.1
61.9 32.8
5.2
78.7 19.2
2.1
Length of Time Running/Jogging Before Basic Training
Did Not Run or Jog ≤ 1 month 2–3 months 4–6 months ≥ 7 months
5.8 21.8 38.7 11.5 11.5
14.5 41.1 28.7
7.2 8.5
9.6 31.8 39.2
8.8 10.7
18.3 39.5 25.8
7.6 8.8
Length of Time Performing Weight Training ≥ 2 Times/Week
Did Not Weight Train ≤ 1 month 2–3 months 4–6 months ≥ 7 months
39.0 13.9 23.2
9.0 15.0
49.9 14.8 17.9
6.8 10.6
51.9 16.5 15.9
7.0 8.7
71.6 11.1
9.1 3.3 5.1
Prior Lower Limb Injury
No Yes
79.9 20.1
85.2 14.8
78.9 21.1
86.5 13.5
Menstrual Periods Last Year
0 1–9 10–12 >12
4.4 11.2 79.9
4.4
4.9 12.4 78.1
4.5
Gone 6 Months Without a Menstrual Cycle Last Year
No Yes
90.9 9.1
88.9 11.1
Taken Birth Control Pills in Last 12 Months
No Yes
53.0 47.0
69.8 29.5
Months Since Last Pregnancy
Never 1–6 months 7–12 months ≥ 12 months
86.9 1.7 3.1 8.3
64.9 3.5 6.1
25.6

USACHPPM Epidemiological Report No. 12-MA-05SBA-08A
52
8. CONCLUSIONS. a. This prospective study demonstrated that prescribing running shoes based on the static weight-bearing plantar foot surface shape had little influence on injury risk in BMT, even after controlling for other injury risk factors. There was little difference in injury rates among those who were prescribed a different type of shoe (motion control, stability, or cushion) based on plantar foot shape and those who received a stability shoe regardless of plantar foot shape. b. Individuals in the lower 20th percentile of arch heights tended to be at higher risk of injury. c. Plantar foot shapes judged as low, normal, and high did have progressively higher average arch heights. Despite the higher average values, there were a considerable number of mismatches when plantar shapes were matched with corresponding percentiles of arch heights. Plantar shape determinations matched corresponding percentiles of measured arch heights only about 64% of the time, overall. Normal plantar shapes had the largest numbers of matches (over 75%), with high and low plantar shapes matching only 24% and 49% of the time, respectively. d. Injury incidence in this study was higher than that of a previous Air Force study conducted about 13 years ago. Changes in the BMT program of instruction involving more physically active training and more running could possibly account for some of this increase. e. This is the first study examining injury risk factors in US Air Force BMT. In consonance with previous Army data (77, 81, 86) and some Marine data (6, 7), injury risk was higher among men and women who were of lower physical fitness or who were cigarette smokers. In addition, women who were less physically active and/or who were married were at higher injury risk.

USACHPPM Epidemiological Report No. 12-MA-05SBA-08A
53
9. RECOMMENDATION. If the goal is injury prevention, it is not necessary to prescribe running shoes to BMT recruits based on a visual inspection of the static, weight-bearing plantar shape. Prescribing running shoes to BMT recruits on this basis was no more protective against injury than issuing a single shoe regardless of plantar shape. Other procedures need to be considered to prevent injuries in recruits with lower arch heights, since they are at higher injury risk. It is still recommended that recruits receive a new shoe on entry to BMT, since older shoes have previously been shown to be associated with increase injury risk (70).
JOSEPH J KNAPIK Research Physiologist
MICHELLE CANHAM-CHERVAK Acting Program Director, Injury Prevention

USACHPPM Epidemiological Report No. 12-MA-05SBA-08A
54

USACHPPM Epidemiological Report No. 12-MA-05SBA-08A
A-1
APPENDIX A REFERENCES
1. Pritchard AE (2001). Running shoe design, selection and care: does it make a difference? Army Medical Department Journal, Apr/May/Jun: 43-51. 2. Menz HB (1998). Alternative techniques for the alternative assessment of foot pronation. Journal of the American Podiatric Medical Association, 88: 119-129. 3. Kaufman KR, Brodine SK, Shaffer RA, Johnson CW, and Cullison TR (1999). The effect of foot structure and range of motion on musculoskeletal overuse injury. American Journal of Sports Medicine, 27: 585-593. 4. Cowan DN, Jones BH, and Robinson JR (1993). Foot morphologic characteristics and risk of exercise-related injuries. Archives of Family Medicine, 2: 773-777. 5. Knapik JJ, Hauret KG, and Jones BH. Primary Prevention of Injuries in Initial Entry Training. In: Textbook of Military Medicine. Recruit Medicine. MK Lenhart, DE Lounsbury, and RB North (Eds.) Washington DC: Bordon Institute, 2006. 6. Rauh MJ, Macera CA, Trone DW, Shaffer RA, and Brodine SK (2006). Epidemiology of stress fractures and lower extremity overuse injuries in female recruits. Medicine and Science in Sports and Exercise, 38: 1571-1577. 7. Shaffer RA, Brodine SK, Almeida SA, Williams KM, and Ronaghy S (1999). Use of simple measures of physical activity to predict stress fractures in young men undergoing a rigorous physical training program. American Journal of Epidemiology, 149: 236-242. 8. Snedecor MR, Boudreau CF, Ellis BE, Schulman J, Hite M, and Chambers B (2000). U.S. Air Force recruit injury and health study. American Journal of Preventive Medicine, 18(3S): 129-140. 9. Preventive Medicine. Technical Report No. 40-5, Washington DC: Headquarters, Department of the Army, 2005 10. Hodge JG (2005). An enhanced approach to distinguishing public health practice and human subjects research. Journal of Law, Medicine and Ethics, Spring: 2-19. 11. Greene W, and Fredericksen R (2005). Fall 2005 Shoe Guide. Runner's World, September 2005: 89-110. 12. Greene W, and Fredericksen R (2006). Fall Shoe Guide. Runner's World, September 2006: 99-116. 13. Greene W, and Fredericksen R (2007). Fall Shoe Guide. Runner's World, September 101-114. 14. ASICS (2008). Shoe Fit Guide. On line at: http://www.asicsamerica.com/sports/running/shoeFitGuide.aspx. Accessed 16 June 2008 15. New Balance (2008). Arch Types and Body Frames. On line at: http://www.nbwebexpress.com/siteLanding/foot_guide.asp and http://www.nbwebexpress.com/achieve_more/running_gait.asp. Accessed 16 June 2008 16. Williams DS, Davis IM, Scholz JP, Hamill J, and Buchanan TS (2004). High-arched runners exhibit increased leg stiffness compared to low-arched runners. Gait and Posture, 19: 263-269.

USACHPPM Epidemiological Report No. 12-MA-05SBA-08A
A-2
17. Williams DS, McClay IS, and Hamill J (2001). Arch structure and injury patterns in runners. Clinical Biomechanics, 16: 341-347. 18. Nawoczenski DA, Saltzman CL, and Cook TM (1998). The effect of foot structure on the three-dimensional kinematic coupling behavior of the leg and rear foot. Physical Therapy, 78: 404-416. 19. Nigg BM, Cole GK, and Nachbauer W (1993). Effects of arch height on the foot ground reaction force in running. Journal of Biomechanics, 26: 909-916. 20. Nachbauer W, and Nigg BM (1992). Effects of arch height on the foot on ground reaction forces in running. Medicine and Science in Sports and Exercise, 24: 1264-1269. 21. Hamill J, Bates BT, Knutzen KM, and Kirkpatrick GM (1989). Relationship between selected static and dynamic lower extremity measures. Clinical Biomechanics, 4: 217-225. 22. Kernozek TW, and Ricard MD (1990). Foot placement angle and arch height: effect on rearfoot motion. Archives of Physical Medicine and Rehabilitation, 71: 988-991. 23. Butler RJ, Davis IS, and Hamill J (2006). Interaction of arch type and footwear on running mechanics. American Journal of Sports Medicine, 34: 1998-2005. 24. Butler RJ, Hamill J, and Davis IS (2007). Effect of footwear on high and low arched runners' mechanics during a prolonged run. Gait and Posture, 26: 219-225. 25. McPoil TG (1988). Footwear. Physical Therapy, 68: 1857-1865. 26. McPoil TG (2000). Athletic footwear: design, performance and selection issues. Journal of Science and Medicine in Sports, 3: 260-267. 27. Nigg BM, and Segesser B (1992). Biomechanical and orthopedic concepts in sports shoe construction. Medicine and Science in Sports and Exercise, 24: 595-602. 28. Winter DA, and Bishop PJ (1992). Lower extremity injury. Biomechanical factors associated with chronic injury to the lower extremity. Sports Medicine, 14: 149-156. 29. Knapik JJ, Feltwell D, Canham-Chervak M, Arnold S, Hauret K, Renderio D, Wells J, and Rohde C (2001). Evaluation of injury rates during implementation of the Fort Drum Running Shoe Injury Prevention Program. Technical Report No. 12-MA-655-01, Aberdeen Proving Ground, MD: US Army Center for Health Promotion and Preventive Medicine. 30. CRC (1971). Handbook of Chemistry and Physics. Cleveland: The Chemical Rubber Publishing Company. 31. Cavanagh PR, and LaFortune MA (1980). Ground reaction forces in distance running. Journal of Biomechanics, 13: 397-406. 32. Dickinson JA, Cook SD, and Leinhardt TM (1985). The measurement of shock waves following heel strike while running. Journal of Biomechanics, 18: 415-422. 33. DeClercq D, Aerts P, and Kunnen M (1994). The mechanical characteristics of the human heel pads during foot strike in running: an in vivo cineradiographic study. Journal of Biomechanics, 27: 1213-1222. 34. McNair PJ, and Marshall RN (1994). Kinematic and kinetic parameters associated with running in different shoes. British Journal of Sports Medicine, 28: 256-260. 35. DeWit B, DeClercq D, and Aerts P (2000). Biomechanical analysis of the stance phase during barefoot and shod running. Journal of Biomechanics, 33: 269-278.
USACHPPM Epidemiological Report No. 12-MA-05SBA-08A
A-3
36. Jorgensen U (1990). Body load in heel strike running: the effect of a firm heel counter. American Journal of Sports Medicine, 18: 177-181. 37. Jorgensen U, and Ekstrand J (1988). Significance of heel pad confinement for the shock absorption at heel strike. International Journal of Sports Medicine, 9: 468-473. 38. Knapik JJ, Marshall SW, Lee RB, Darakjy SS, Jones SB, Mitchener TA, delaCruz GG, and Jones BH (2007). Mouthguards in sport activities: history, physical properties, and injury prevention effectiveness. Sports Medicine, 37: 117-144. 39. Nigg BM, and UU W (1999). The effect of muscle stiffness and damping on simulated impact force peaks during running. Journal of Biomechanics, 32: 849-856. 40. Gerritsen KG, Bogert AJV, and Nigg BM (1995). Direct dynamics simulation of the impact phase in heel-toe running. Journal of Biomechanics, 28: 661-668. 41. Lake MJ (2000). Determining the protective function of sports footwear. Ergonomics, 43: 1610-1621. 42. Nigg BM, Bahlsen HA, Luethi SM, and Stokes S (1987). The influence of running velocity and midsole hardness on external impact forces in heel-toe running. Journal of Biomechanics, 20: 951-959. 43. Kersting UG, and Bruggemann GP (2006). Midsole material-related force control during heel-toe running. Research in Sports Medicine, 14: 1-17. 44. Ferris DP, Liang K, and Farley CT (1999). Runners adjust leg stiffness for their first step on a new running surface. Journal of Biomechanics, 32: 787-794. 45. Kerdok A, Biewener AA, McMahon TA, Weyand PG, and Herr HM (2002). Energetics and mechanics of human running on surfaces of different stiffness. Journal of Applied Physiology, 92: 469-478. 46. Bishop M, Fiolkowski P, Conrad B, Brunt D, and Horodyski MB (2006). Athletic footwear, leg stiffness, and running kinematics Journal of Athletic Training, 41: 387-392. 47. Robbins SE, and Gouw GJ (1991). Athletic footwear: unsafe due to perceptual illusions. Medicine and Science in Sports and Exercise, 23: 217-224. 48. Clarke TE, Frederick EC, and Hamill CL (1983). The effect of shoe design parameters on rearfoot control in running. Medicine and Science in Sports and Exercise, 15: 376-381. 49. Hamill J, Freedson PS, Boda W, and Reichsman F (1988). Effects of shoe type on cardiorespiratory responses and rearfoot motion during treadmill running. Medicine and Science in Sports and Exercise, 20: 515-521. 50. Hamill J, Bates BT, and Holt KG (1992). Timing of lower extremity joint actions during treadmill running. Medicine and Science in Sports and Exercise, 24: 807-813. 51. Nigg BM, and Morlock M (1987). The influence of lateral heel flare of running shoes on pronation and impact forces. Medicine and Science in Sports and Exercise, 19: 294-302. 52. Stacoff A, Reinschmidt C, Nigg BM, DenBogert AJ, Lundberg A, Denoth J, and Stussi E (2001). Effects of shoe sole construction on skeletal motion during running. Medicine and Science in Sports and Exercise, 33: 311-319. 53. Clement DB, Taunton JE, Smart GW, and McNichol KL (1981). A survey of overuse running injuries. Physician and Sportsmedicine, 9: 47-58.

USACHPPM Epidemiological Report No. 12-MA-05SBA-08A
A-4
54. Cook SD, Brinker MR, and Poche M (1990). Running shoes. Their relationship to running injuries. Sports Medicine, 10: 1-8. 55. Reinschmidt C, and Nigg BM (1995). Influence of heel height on ankle joint moments in running. Medicine and Science in Sports and Exercise, 27: 410-416. 56. Perry SD, and Lafortune MA (1995). Influence of inversion/eversion of the foot upon impact loading during locomotion. Clinical Biomechanics, 10: 253-257. 57. Catlin MJ, and Dressendorfer RH (1979). Effect of shoe weight on the energy cost of running. Medicine and Science in Sports, 11: 80. 58. Jones BH, Toner MM, Daniels WL, and Knapik JJ (1984). The energy cost and heart-rate response of the trained and untrained subjects walking and running in shoes and boots. Ergonomics, 27: 895-902. 59. Jones BH, Knapik JJ, Daniels WL, and Toner MM (1986). The energy cost of women walking and running in shoes and boots. Ergonomics, 29: 439-443. 60. Legg SJ, and Mahanty A (1986). Energy cost of backpacking in heavy boots. Ergonomics, 29: 433-438. 61. Soule RG, and Goldman RF (1969). Energy cost of loads carried on the head, hands, or feet. Journal of Applied Physiology, 27: 687-690. 62. Giladi M, Milgrom C, Stein M, and Others (1985). The low arch, a protective factor in stress fractures. Orthopedic Review, 14: 81-84. 63. Cowan DN, Robinson JR, Jones BH, Polly DW, and Berrey BH (1994). Consistency of visual assessments of arch height among clinicians. Foot and Ankle, 15: 213-217. 64. Williams DS, and McClay IS (2000). Measurements to characterize the foot and medial longitudinal arch: reliability and validity. Physical Therapy, 80: 864-871. 65. Wilk BR, Fisher KL, and Gutierrez W (2000). Defective running shoe as a contributory factor in plantar fasciitis in a triathlete. Journal of Orthopedic and Sports Physical Therapy, 30: 21-28. 66. Brody DM (1980). Running injuries. CIBA Clinical Symposia, 32: 1-36. 67. James SL, Bates BT, and Osternig LR (1978). Injuries to runners. American Journal of Sports Medicine, 6: 40-50. 68. Jacobs SJ, and Berson BL (1986). Injuries to runners: a study of entrants to a 10,000 meter race. American Journal of Sports Medicine, 14: 151-155. 69. Burgess I, and Ryan MD (1985). Bilateral fatigue fractures of the distal fibulae caused by a change of running shoes. Medical Journal of Australia, 143: 304-305. 70. Gardner LI, Dziados JE, Jones BH, Brundage JF, Harris JM, Sullivan R, and Gill P (1988). Prevention of lower extremity stress fractures: a controlled trial of a shock absorbent insole. American Journal of Public Health, 78: 1563-1567. 71. Milgrom C, Finestone A, Shlamkovitch N, Wosk J, Laor A, Voloshin A, and Eldad A (1992). Prevention of overuse injuries of the foot by improved shoe shock attenuation. Clinical Orthopedics, 281: 189-192. 72. McKay GD, Goldie PA, and Oakes BW (2001). Ankle injuries in basketball: injury rate and risk factors. British Journal of Sports Medicine, 35: 103-108.

USACHPPM Epidemiological Report No. 12-MA-05SBA-08A
A-5
73. Cook SD, Kester MA, and Brunet ME (1985). Shock absorption characteristics of running shoes. American Journal of Sports Medicine, 13: 248-253. 74. Kaufman KR, Brodine S, and Shafer RA (2000). Military training-related injuries. Surveillance, research and prevention. American Journal of Preventive Medicine, 18(Suppl): 54-63. 75. Knapik JJ, Cuthie J, Canham M, Hewitson W, Laurin MJ, Nee MA, Hoedebecke E, Hauret K, Carroll D, and Jones BH (1998). Injury incidence, injury risk factors, and physical fitness of U.S. Army basic trainees at Ft Jackson SC, 1997. Technical Report No. 29-HE-7513-98, Aberdeen Proving Ground, MD: U.S. Army Center for Health Promotion and Preventive Medicine. 76. Jones BH, Bovee MW, and Knapik JJ. Associations among body composition, physical fitness, and injuries in men and women Army trainees. In: Body Composition and Physical Performance. BM Marriott, and J Grumstrup-Scott (Eds.) Washington, D.C.: National Academy Press, 1992, pp. 141-173. 77. Jones BH, Cowan DN, Tomlinson JP, Robinson JR, Polly DW, and Frykman PN (1993). Epidemiology of injuries associated with physical training among young men in the Army. Medicine and Science in Sports and Exercise, 25: 197-203. 78. Jones BH, Bovee MW, Harris JM, and Cowan DN (1993). Intrinsic risk factors for exercise-related injuries among male and female Army trainees. American Journal of Sports Medicine, 21: 705-710. 79. Bensel CK, and Kish RN (1983). Lower extremity disorders among men and women in Army basic training and effects of two types of boots. Technical Report No. TR-83/026, Natick, MA: U.S. Army Natick Research and Development Laboratories. 80. Kowal DM (1980). Nature and causes of injuries in women resulting from an endurance training program. American Journal of Sports Medicine, 8: 265-269. 81. Knapik JJ, Sharp MA, Canham-Chervak M, Hauret K, Patton JF, and Jones BH (2001). Risk factors for training-related injuries among men and women in Basic Combat Training. Medicine and Science in Sports and Exercise, 33: 946-954. 82. Knapik JJ, Hauret KG, Arnold S, Canham-Chervak M, Mansfield AJ, Hoedebecke EL, and McMillian D (2003). Injury and fitness outcomes during implementation of Physical Readiness Training. International Journal of Sports Medicine, 24: 372-381. 83. Knapik JJ, Darakjy S, Scott S, Hauret KG, Canada S, Marin R, Palkoska F, VanCamp S, Piskator E, Rieger W, and Jones BH (2004). Evaluation of two Army fitness programs: the TRADOC Standardized Physical Training Program for Basic Combat Training and the Fitness Assessment Program. Technical Report No. 12-HF-5772B-04, Aberdeen Proving Ground, MD: US Army Center for Health Promotion and Preventive Medicine. 84. Almeida SA, Trone DW, Leone DM, Shaffer RA, Patheal SL, and Long K (1999). Gender differences in musculoskeletal injury rates: a function of symptoms reporting? Medicine and Science in Sports and Exercise, 31: 1807-1812. 85. Westphal KA, Friedl KE, Sharp MA, King N, Kramer TR, Reynolds KL, and Marchitelli LJ (1995). Health, performance and nutritional status of U.S. Army women during basic combat
USACHPPM Epidemiological Report No. 12-MA-05SBA-08A
A-6
training. Technical Report No. T96-2, Natick, MA: U.S. Army Research Institute of Environmental Medicine. 86. Knapik JJ, Swedler D, Grier T, Hauret KG, Bullock S, Williams K, Darakjy S, Lester M, Tobler S, Clemmons N, and Jones BH (2008). Injury reduction effectiveness of prescribing running shoes based on foot shape in basic combat training. Technical Report No. 12-MA-05SB-08, Aberdeen Proving Ground MD: US Army Center for Health Promotion and Preventive Medicine. 87. Bell NS, Mangione TW, Hemenway D, Amoroso PJ, and Jones BH (2000). High injury rates among female Army trainees. A function of gender? American Journal of Preventive Medicine, 18(Suppl. 3): 141-146. 88. Jones BH (1996). Injuries among men and women in gender-integrated BCT units. Ft Leonard Wood 1995. Medical Surveillance Monthly Report, 2: 2-3,7-8. 89. Canham-Chervak M, Knapik JJ, Hauret K, Cuthie J, Craig S, and Hoedebecke E (2000). Determining physical fitness entry criteria for entry into Army Basic Combat Training: can these criteria be based on injury? Technical Report No. 29-HE-1395-00, Aberdeen Proving Ground, MD: US Army Center for Health Promotion and Preventive Medicine. 90. Knapik JJ, Hauret K, Bednarek JM, Arnold S, Canham-Chervak M, Mansfield A, Hoedebecke E, Mancuso J, Barker TL, Duplessis D, Heckel H, Peterson J, and 2001 SotUAPFSi (2001). The Victory Fitness Program. Influence of the US Army's emerging physical fitness doctrine on fitness and injuries in Basic Combat Training. Technical Report No. 12-MA-5762-01, Aberdeen Proving Ground, MD: US Army Center for Health Promotion and Preventive Medicine. 91. Knapik JJ, Darakjy S, Scott SJ, Hauret KG, Canada S, Marin R, Rieger W, and Jones BH (2005). Evaluation of a standardized physical training program for Basic Combat Training. Journal of Strength and Conditioning Research, 19: 246-253. 92. Kowal DM, Patton JF, and Vogel JA (1978). Psychological states and aerobic fitness of male and female recruits before and after basic training. Aviation, Space and Environmental Medicine, 49: 603-606. 93. Almeida SA, Williams KM, R.A. S, and Brodine SK (1999). Epidemiological patterns of musculoskeletal injuries and physical training. Medicine and Science in Sports and Exercise, 31: 1176-1182. 94. Shaffer RA, Brodine SK, Ito SI, and Le AT (1999). Epidemiology of illness and injury among U.S. Navy and Marine Corps female training populations. Military Medicine, 164: 17-21. 95. Jones BH, Shaffer RA, and Snedecor MR (1999). Injuries treated in outpatient clinics: surveys and research data. Military Medicine, 164 (Suppl): 96. Knapik JJ, Sharp MA, Canham ML, Hauret K, Cuthie J, Hewitson W, Hoedebecke E, Laurin MJ, Polyak C, Carroll D, and Jones B (1999). Injury incidence and injury risk factors among US Army Basic Trainees at Ft Jackson, SC (including fitness training unit personnel, discharges, and newstarts). Technical Report No. 29-HE-8370-99, Aberdeen Proving Ground MD: US Army Center for Health Promotion and Preventive Medicine.

USACHPPM Epidemiological Report No. 12-MA-05SBA-08A
A-7
97. Knapik JJ, Reynolds KL, and Barson J (1997). Influence of antiperspirants on foot blisters following road marching. Technical Report No. ARL-TR-1333, Aberdeen Proving Ground, MD: U.S. Army Research Laboratory. 98. Jones BH, Cowan DN, and Knapik JJ (1994). Exercise, training and injuries. Sports Medicine, 18: 202-214. 99. Trank TV, Ryman DH, Minagawa RY, Trone DW, and Shaffer RA (2001). Running mileage, movement mileage, and fitness in male US Navy recruits. Medicine and Science in Sports and Exercise, 33: 1033-1038. 100. Knapik JJ, Canham-Chervak M, Hauret K, Laurin MJ, Hoedebecke E, Craig S, and Montain S (2002). Seasonal variations in injury rates during US Army Basic Combat Training. Annals of Occupational Hygiene, 46: 15-23. 101. Knapik JJ (2001). Multivariate analysis of intrinsic injury risk factors in a cohort of US Army basic trainees. Medicine and Science in Sports and Exercise, 33: S6. 102. Knapik JJ, Burse RL, and Vogel JA (1983). Height, weight, percent body fat and indices of adiposity for young men and women entering the U.S. Army. Aviation, Space and Environmental Medicine, 54: 223-231. 103. Kahn HA, and Sempos CT (1989). Statistical Methods in Epidemiology. New York: Oxford University Press. 104. Hosmer DW, and Lemeshow S (1989). Applied Logistic Regression. New York: John Wiley & Sons. 105. Williams DS, McClay IS, Hamill J, and Buchanan TS (2001). Lower extremity kinematics and kinetic differences in runners with high and low arches. Journal of Applied Biomechanics, 17: 153-163. 106. Zwerling C, Sprince NL, Wallace RB, Davis CS, Whitten PS, and Heringa SG (1995). Effect of recall period on the reporting of occupational injuries among older workers in the Health and Retirement Study. American Journal of Industrial Medicine, 28: 583-590. 107. Landen DD, and Hendricks S (1995). Effect of recall on reporting of at-work injuries. Public Health Reports, 110: 350-354. 108. Massey JT, and Gonzalez JF (1976). Optimal recall period for estimating accidental injuries in the National Health Interview Survey. Proceedings of the American Statistical Association, 18: 584-588. 109. Garamone J. Changing Air Force means basic changes. In: American Forces Press Services. 110. Air Force Basic Military Training. In: Lackland Air Force Base Fact Sheet. 2008. 111. Crawford A (2006). Airmen warriors: Basic Military Training evolves to meet warfightiung demands. Airman, Fall: 4-16. 112. Christenson S (2008). The harder line in training. In: Air Force Magazine Online. 91(2). 113. Koplan JP, Powell KE, Sikes RK, Shirley RW, and Campbell CC (1982). An epidemiologic study of the benefits and risks of running. Journal of the American Medical Association, 248: 3118-3121. 114. Koplan JP, Rothenberg RB, and Jones EL (1995). The natural history of exercise: a 10-yr follow-up of a cohort of runners. Medicine and Science in Sports and Exercise, 27: 1180-1184.

USACHPPM Epidemiological Report No. 12-MA-05SBA-08A
A-8
115. Marti B, Vader JP, Minder CE, and Abelin T (1988). On the epidemiology of running injuries. The 1984 Bern Grand-Prix study. American Journal of Sports Medicine, 16: 285-294. 116. Powell KE, Kohl HW, Caspersen CJ, and Blair SN (1986). An epidemiological perspective on the causes of running injuries. Physician and Sportsmedicine, 14(6): 100-114. 117. Pope RP, Herbert RD, Kirwan JD, and Graham BJ (2000). A randomized trial of preexercise stretching for prevention of lower-limb injury. Medicine and Science in Sports and Exercise, 32: 271-277. 118. Heir T, and Eide G (1997). Injury proneness in infantry conscripts undergoing a physical training programme: smokeless tobacco use, higher age, and low levels of physical fitness are risk factors. Scandinavian Journal of Medicine and Science in Sports, 7: 304-311. 119. Rayson M, and Wilkinson D (2003). Potential risk modifiers for training outcomes and injury in single entry recruits: body mass, composition and aerobic fitness. Technical Report No. 22APR03, Farnham, Surry, England: Optimal Performance. 120. McSweeney KP, Congleton JJ, Kerk CJ, Jenkins O, and Craig BN (1999). Correlation of recorded injury and illness data with smoking, exercise, and absolute aerobic capacity. International Journal of Industrial Ergonomics, 24: 193-200. 121. Hickson RC, Foster C, Pollock ML, Galassi TM, and Rich S (1985). Reduced training intensities and loss of aerobic power, endurance, and cardiac growth. Journal of Applied Physiology, 58: 492-499. 122. Katch FI (1973). Optimal duration of endurance performance on the cycle ergometer in relation to maximal oxygen intake. Ergonomics, 16: 227-235. 123. Candau R, Belli A, Millet GY, George D, Barbier B, and Rouillon JD (1998). Energy cost and running mechanics during a treadmill run to voluntary exhaustion in humans. European Journal of Applied Physiology, 77: 479-485. 124. Mercer JA, Bates BT, Dufek JS, and Hreljac A (2003). Characteristics of shock attenuation during fatigued running. Journal of Sports Sciences, 21: 911-919. 125. Derrick TR, Dereu D, and Mclean SP (2002). Impacts and kinematic adjustments during an exhaustive run. Medicine and Science in Sports and Exercise, 34: 998-1002. 126. Dutto DJ, and Smith GA (2002). Changes in spring-mass characteristics during treadmill running to exhaustion. Medicine and Science in Sports and Exercise, 34: 1324-1331. 127. Enoka RM, and Stuart DG (1992). Neurobiology of muscle fatigue. Journal of Applied Physiology, 72: 1631-1648. 128. Mizrahi J, Verbitsky O, Isakov E, and Daly D (2000). Effect of fatigue on leg kinematics and impact acceleration in long distance running. Human Movement Science, 19: 139-151. 129. Garcin M, Vautier JF, Vandewalle H, and Monod H (1988). Rating of perceived exertion (RPE) as an index of aerobic endurance during local and general exercise. Ergonomics, 41: 105-114. 130. Gleeson NP, Reilly T, Mercer TH, Rakowski S, and Rees D (1998). Influence of acute endurance activity on leg neuromuscular and musculoskeletal performance. Medicine and Science in Sports and Exercise, 30: 596-608. 131. Gandevia SC (1992). Some central and peripheral factors effecting human motoneuronal output in neuromuscular fatigue. Sports Medicine, 13: 93-98.

USACHPPM Epidemiological Report No. 12-MA-05SBA-08A
A-9
132. Ross J, and Woodward A (1994). Risk factors of injury during basic military training. Journal of Occupational Medicine, 10: 1120-1126. 133. Wang X, Wang PS, and Zhou W (2003). Risk factors of military training-related injuries in rrrrecruits of Chinese People's Armed Police Force. Chinese Journal of Traumatology, 6: 12-17. 134. Rauh MJ, Koepsell TD, Rivara FP, Margherita AJ, and Rice SG (2006). Epidemiology of musculoskeletal injuries among high school cross-country runners. American Journal of Epidemiology, 163: 151-159. 135. Knapik JJ, Sharp MA, Darakjy S, Jones SB, Hauret KG, and Jones BH (2006). Temporal changes in the physical fitness of United States Army recruits. Sports Medicine, 36: 613-634. 136. Sharp MA, Patton JF, Knapik JJ, Smutok MA, Hauret K, Mello RP, Ito M, and Frykman PN (2002). A comparison of the physical fitness of men and women entering the US Army during the years 1978-1998. Medicine and Science in Sports and Exercise, 34: 356-363. 137. Knapik JJ, Jones SB, Sharp MA, Darakjy S, Hauret KG, Burrell L, Goddard D, Nevin R, and Jones BH (2006). A prospective study of injuries and injury risk factors among United States Army wheel vehicle mechanics. Technical Report No. 2-MA-7193B-06, Aberdeen Proving Ground MD: US Army Center for Health Promotion and Preventive Medicine. 138. Roche AF, Siervogel RM, Chumlea WM, and Webb P (1981). Grading body fatness from limited anthropometric data. American Journal of Clinical Nutrition, 34: 2831-2838. 139. Cureton KJ. Effects of experimental alterations in excess weight on physiological responses to exercise and physical performance. In: Body Composition and Physical Performance. Applications for Military Services. BM Marriott, and J Grumstrup-Scott (Eds.) Washington, D.C.: National Academy Press, 1992. 140. Altarac M, Gardner JW, Popovich RM, Potter R, Knapik JJ, and Jones BH (2000). Cigarette smoking and exercise-related injuries among young men and women. American Journal of Preventive Medicine, 18 (Suppl 3S): 96-102. 141. Lappe JM, Stegman MR, and Recker RR (2001). The impact of lifestyle factors on stress fractures in female Army recruits. Osteoporosis International, 12: 35-42. 142. Valimaki MJ, Alhava E, Lehmuskallio E, Loyttyniemi E, Sah T, Suominen H, and Valimakii MJ (2005). Risk factors for clinical stress fractures in male military recruits: a prospective cohort study. Bone, 37: 267-273. 143. Reynolds KL, Heckel HA, Witt CE, Martin JW, Pollard JA, Knapik JJ, and Jones BH (1994). Cigarette smoking, physical fitness, and injuries in infantry soldiers. American Journal of Preventive Medicine, 10: 145-150. 144. Cady LD, Bischoff DP, O'Connell ER, Thomas PC, and Allen JH (1979). Strength and fitness and subsequent back injuries in firefighters. Journal of Occupational Medicine, 21: 269-272. 145. Chau N, Bourgkard E, Bhattacherjee A, Ravaud JF, Choquet M, and Mur JM (2008). Associations of job, living conditions and lifestyle with occupational injury in working population: a population-based study. International Archives of Occupational and Environmental Health, 81: 379-389.

USACHPPM Epidemiological Report No. 12-MA-05SBA-08A
A-10
146. Craig BN, Congleton JJ, Kerk CJ, Amendola AA, and Gaines WG (2006). Personal and non-occupational risk factors and occupational injury/illness. American Journal of Industrial Medicine, 49: 249-260. 147. Mudr D, Naus A, Hetychova V, and Vavreckova O (1966). Work injuries and smoking. Industrial Medicine and Surgery, 35: 880-881. 148. Ryan J, Zwerling C, and Orav EJ (1992). Occupational risk associated with cigarette smoking: a prospective study. American Journal of Public Health, 82: 29-32. 149. Sacks JJ, and Nelson DE (1994). Smoking and injuries: an overview. Preventive Medicine, 23: 515-520. 150. Tsai SP, Gilstrap EL, Cowles SR, Waddell LC, and Ross CE (1992). Personal and job characteristics of musculoskeletal injuries in an industrial population. Journal of Occupational Medicine, 34: 606-612. 151. Jones JK, and Triplett RG (1992). The relationship of cigarette smoking to impaired intraoral wound healing. Journal of Oral and Maxillofacial Surgery, 50: 237-239. 152. Mosely LH, Finseth F, and Goody M (1978). Nicotine and its effect on wound healing. Plastic and Reconstructive Surgery, 61: 570-575. 153. Reus WF, Robson MC, Zachary L, and Heggers JP (1984). Acute effects of tobacco smoking in the cutaneous micro-circulation. British Journal of Plastic Surgery, 37: 213-215. 154. Riefkohl R, Wolfe JA, Cox EB, and McCarthy KS (1986). Association between cutaneous occlusive vascular disease, cigarette smoking, and skin slough after rhytidectomy. Plastic and Reconstructive Surgery, 77: 592-595. 155. Siana JE, Rex S, and Gottrup F (1989). The effect of cigarette smoking on wound healing. Scandinavian Journal of Plastic and Reconstructive Surgery, 23: 207-209. 156. Castillo RC, Bosse MJ, MacKenzie EJ, and Patterson BM (2005). Impact of smoking of fracture healing and risk of complications in limb-threatening open tibia fractures. Journal of Orthopaedic Trauma, 19: 151-157. 157. Riebel GD, Boden SD, Whitesides TE, and Hutton WC (1995). The effects of nicotine on incorporation of cancellous bone graft in an animal model. Spine, 20: 2198-2202. 158. Raikin SM, Landsman JC, Alexander VA, Froimson MI, and Plaxton NA (1998). Effect of nicotine on the rate and strength of long bone fracture healing. Clinical Orthopedics, 353: 231-237. 159. Silcox DH, Daftari T, Boden SD, Schimandle JH, Hutton WC, and Whitesides TE (1995). The effect of nicotine on spinal fusion. Spine, 14: 1549-1553. 160. Chen F, Osterman L, and Mahony K (2001). Smoking and bony union after ulna-shorting osteotomy. American Journal of Orthopedics 30: 486-489. 161. Karim A, Pandit H, Murray J, Wandless F, and Thomas NP (2006). Smoking and reconstruction of the anterior cruciate ligament Journal of Bone and Joint Surgery. British Volume, 88: 1027-1031. 162. Gill CS, Sandell LJ, El-Zawawy HB, and Wright RW (2006). Effects of cigarette smoking on early medial collateral ligament healing in a mouse model. Journal of Orthopaedic Research, 24: 2141-2149.

USACHPPM Epidemiological Report No. 12-MA-05SBA-08A
A-11
163. Wong LS, Green HM, Feugate JE, Yadav M, Nothnagel EA, and Martins-Green M (2004). Effects of "second hand" smoke on structure and function of fibroblasts, cells that are critical for tissue repair and remodeling. BMC Cell Biology, 5: 13. 164. Carnevali S, Nakamura Y, Mio T, Liu X, Takigawa K, Romberger DJ, Spurzem JR, and Rennard SI (1998). Cigarette smoke extract inhibits fibroblast-mediated collagen gel contraction. American Journal of Physiology, 274: L591-L598. 165. Nakamura Y, Romberger DJ, Tate L, Ertl RF, Kawamoto M, Adachi Y, Sisson JH, Spurzem JB, and Rennard SI (1995). Cigarette smoke inhibits fibroblast proliferation and chemotaxis. American Journal of Respiratory Critical Care Medicine, 151: 1497-1503. 166. Raveendran M, Senthil D, Utama B, Shen Y, Dudley D, Wang J, Zhang Y, and Wang XL (2004). Cigarette suppresses the expression of P4Halpha and vascular collagen production. Biochemical and Biophysical Research Communications, 323: 592-598. 167. Schaffer M, and Barbul A (1998). Lymphocyte function in wound healing and following injury. British Journal of Surgery, 85: 444-460. 168. Barbul A, and Regan MC (1995). Immune involvement in wound healing. Otolaryngologic Clinics of North America, 28: 955-968. 169. DiPietro LA (1995). Wound healing: the role of macrophages and other immune cells. Shock, 4: 233-240. 170. Park JE, and Barbul A (2004). Understanding the role of immune regulation in wound healing. American Journal of Surgery, 187 (Suppl 1): 11S-16S. 171. Sopori ML, and Kozak W (1998). Immunomodulatory effects of cigarette smoke. Journal of Neuroimmunology, 83: 148-156. 172. Chen H, Cowan MJ, Hasday JD, Vogel SN, and Medvedev AE (2007). Tobacco smoke inhibits expression of proinflammatory cytokines and activation of IL-1R-associated kinase, p38, and NF-kappa-B in aveolar macrophages stimulated with TLR2 and TLR4 angonists. Journal of Immunology, 179: 6097-6106. 173. McCrea KA, Ensor JE, Nall K, Bleeker ER, and Hasday JD (1994). Altered cytokine regulation in the lungs of cigarette smokers. American Journal of Respiratory and Critical Care Medicine, 150: 696-703. 174. Suchi M, Matsuki H, Misawa K, Kasuga H, and Yanagisawa Y (1989). The effect of abstinence from smoking on urinary excretion of hydroproline. Tokai Journal of Experimental and Clinical Medicine, 14: 401-407. 175. Ernster VL, Grady D, Miike R, Black D, Selby J, and Kerlikowske K (1995). Facial wrinkling in men and women by smoking status. American Journal of Public Health, 85: 78-82. 176. Model D (1985). Smoker's face: an underrated clinical sign? British Medical Journal, 291: 1760-1762. 177. Kadunce DP, Burr R, Gress R, Kanner R, Lyon JL, and Zone JJ (1991). Cigarette smoking: risk factor for premature facial wrinkling. Annals of Internal Medicine, 114: 840-844. 178. Moller AM, Villebro N, Pedersen T, and Tonnesen H (2002). Effect of peoperative smoking intervention on postoperative complications: a randomized clinical trial. Lancet, 359: 114-117.

USACHPPM Epidemiological Report No. 12-MA-05SBA-08A
A-12
179. Tollerud DJ, Clarke JW, Brown LM, Neuland CY, Mann DL, Pankiw-Trost LK, Blattner WA, and Hoover RN (1989). Association of cigarette smoking with decreased numbers of circulating natural killer cells. American Review of Respiratory Diseases, 139: 194-198. 180. Hersey P, Prendergast D, and Edwards A (1983). Effects of cigarette smoking on the immune system. Medical Journal of Australia, 2: 425-429. 181. Miller LG, Goldstein G, Murphy M, and Ginns LC (1982). Reversible alterations in immunoregulatory T Cells in smoking. Chest, 82: 526-529. 182. Yarnell JWG, Sweetnam PM, Rogers S, Elwood PC, Bainton D, Baker IA, Esatham R, and Etherington MD (1987). Some long term effects of smoking from the Caerphilly and Speedwell Collaborative Surveys. Journal of Clinical Pathology, 40: 909-913. 183. Friedman GD, Siegelaub AB, Seltzer CC, Feldman R, and Collen MF (1973). Smoking habits and the leukocyte count. Archives of Environmental Health, 26: 137-143. 184. Hughes DA, Haslam PL, Townsend PJ, and Turner-Warwick M (1985). Numerical and functional alterations in circulatory lymphocytes in cigarette smokers. Clinical and Experimental Immunology, 61: 459-466. 185. Nobel RC, and Penny BB (1975). Comparison of leukocyte count and function in smoking and nonsmoking men. Infection and Immunity, 12: 550-555. 186. Lando HA, Haddock CK, Klesges RC, Talcott GW, and Jensen J (1999). Smokeless tobacco use in a population of young adults. Addictive Behaviors, 24: 431-447. 187. DiFranza JR, Winters TH, Goldberg RJ, Cirillo L, and Biliouris T (1986). The relationship of smoking to motor vehicle accidents and traffic violations. New York State Journal of Medicine, 86: 464-467. 188. Eiser JR, and Sutton SR (1979). Smoking, seat belts, and beliefs about health. Addictive Behaviors, 4: 331-338. 189. Chiolero A, Wietlisbach V, Ruffieux C, Paccaud F, and Cornuz J (2006). Clustering of risk behaviors with cigarette consumption: a population-based survey. Preventive Medicine, 42: 348-353. 190. Kohrt M, Bloomfield SA, Little KD, Nelson ME, and Yingling VR (2004). Physical activity and bone health. Position stand of the American College of Sports Medicine. Medicine and Science in Sports and Exercise, 36: 1985-1996. 191. Layne JE, and Nelson ME (1999). The effects of progressive resistance training on bone density: a review. Medicine and Science in Sports and Exercise, 31: 25-30. 192. ACSM (1998). The recommended quantity and quality of exercise for developing and maintaining cardiorespiratory and muscular fitness, and flexibility in healthy adults. Medicine and Science in Sports and Exercise, 30: 975-991. 193. Fleck SJ, and Kraemer WJ (1987). Designing Resistance Training Programs. Champaign IL: Human Kinetic Publishers. 194. Maffulli N, and King JB (1992). The effects of physical activity on some components of the skeletal system. Sports Medicine, 13: 393-407. 195. Blair SN, Cheng Y, and Holder S (2001). Is physical activity or physical fitness more important in defining health benefits? Medicine and Science in Sports and Exercise, 33: S379-S399.
USACHPPM Epidemiological Report No. 12-MA-05SBA-08A
A-13
196. Kell RT, Bell G, and Quinney A (2001). Musculoskeletal fitness, health outcomes and quality of life. Sports Medicine, 31: 863-873. 197. Ross R, and Janssen I (2001). Physical activity, total and regional obesity: dose-response considerations. Medicine and Science in Sports and Exercise, 33: S521-S527. 198. Pettersson U, Nordstrom P, and Lorentzon R (1999). A comparison of bone mineral density and muscle strength in young male adults with different exercise level. Calcified Tissue International, 64: 490-498. 199. Elgan C, Dykes AK, and Samsioe G (2002). Bone mineral density and lifestyle among female students aged 16-24 years. Gynecological Endocrinology, 16: 91-98. 200. Babroutsi E, Magkos F, Manios Y, and Sidossis LS (2005). Lifestyle factors affecting heel ultrasound in Greek females across different life stages. Osteoporosis International, 16: 552-561. 201. Valimaki MJ, Karkkainen M, Lamberg-Allardt C, Laitinen K, Alhava E, Heikkinen J, Impivaara O, Makela P, Palmgren J, and Seppanen R (1994). Exercise, smoking, and calcium intake during adolescence and early adulthood as determinants of peak bone mass. Cardiovascular Risk in Young Finns Study Group. British Medical Journal, 309: 230-235. 202. Afghani A, Xie B, Wiswell RA, Gong J, Li Y, and Johnson CA (2003). Bone mass of Asian adolescents in China: influence of physical activity and smoking. Medicine and Science in Sports and Exercise, 35: 720-729. 203. Knapik JJ, Darakjy S, Hauret KG, Canada S, Scott S, Rieger W, Marin R, and Jones BH (2006). Increasing the physical fitness of low fit recruits prior to Basic Combat Training: an evaluation of fitness, injuries and training outcomes. Military Medicine, 171: 45-54. 204. Leff M, Stallones L, Keefe TJ, Rosenblatt R, and Reeds M (2003). Comparison of urban and rural non-fatal injury: the results of a statewide survey. Injury Prevention, 9: 332-337. 205. Whitlock G, Norton R, Clark T, Jackson R, and MacMahon S (2004). Motor vehicle driver injury and marital status: a cohort study with prospective and retrospective driver injuries. Injury Prevention, 10: 33-36. 206. West GB, Moskal PD, Dziuban CD, and Rumbough LP (1996). Gender and marital differences for risk taking among undergraduates. Psychological Reports, 78: 315-320. 207. Ogden CL, Carroll MD, Curtin LR, McDowell MA, Tabak CJ, and Flegal KM (2006). Prevalence of overweight and obesity in the United States, 1999-2004. JAMA, 295: 1549-1555. 208. Ogden CL, Fryar CD, Carroll MD, and Flegal KM (2004). Mean body weight and body mass index, United States 1960-2002. Advance Data, October 27 (347): 1-17. 209. Burgess L (2006). Army raises maximum enlistment age. Stars and Stripes, June 23. 210. Moore M (2006). Army reforms enlistment rules. Cox Newspapers, February 3. 211. Belkin D (2006). Struggling for recruits, Army relaxes its rules. Boston Globe, February 20.

USACHPPM Epidemiological Report No. 12-MA-05SBA-08A
B-1
APPENDIX B REQUEST LETTER


USACHPPM Epidemiological Report No. 12-MA-05SBA-08A
D-1
APPENDIX D LIFESTYLE QUESTIONNAIRE (EXAMPLE)
Physical Training Footwear & Musculoskeletal Injuries: Trainee Survey
PLEASE READ ALL DIRECTIONS AND QUESTIONS CAREFULLY.
Answer all questions to the best of your recollection. Ask research staff for help if you need it.
About You 1. Today’s date: |___|___| / |___|___| / |___|___|___|___|
MONTH DAY YEAR
2. What is your name? __________________________________________ (LAST NAME, FIRST NAME, MIDDLE INITIAL)
3. What is your SSN? |___|___|___|-|___|___|-|___|___|___|___|
4. What is your birth date? |___|___| / |___|___| / |___|___|___|___|
MONTH DAY YEAR
5. Are you… 1 Male
2 Female
6. Which service branch are you in? 1 Air Force
2 Army
3 Marine Corps
4 Navy 7. Prior to entering basic training, what type of shoes did you wear most of the day?
0 Don’t know
1 Boots Name or type, ______________
2 Dress shoes Name or type, ______________
3 Women Only: Dress shoes with heels (1” or less)
Name or type ______________
4 Women Only: Dress shoes with heels (More than 1”)
Name or type, ______________

USACHPPM Epidemiological Report No. 12-MA-05SBA-08A
D-2
5 Running shoes Name or type, ______________
6 Sandals Name or type, _____________
7 Other Please specify, ____________
Tobacco Use
8. Have you smoked at least 100 cigarettes in your life? (100 cigarettes = 5 packs)
1 YES
2 NO
9. About how old were you when you smoked a whole cigarette for the first time? (If you have never smoked a whole cigarette, write 00)
|___|___| Years Old
10. During the past 30 days, on how many days did you smoke a cigarette? (If you have never smoked or not smoked in the last 30 days, write 00)
|___|___| Days
11. During the past 30 days, on the days you smoked, how many cigarettes did you smoke per day? (If you have never smoked or not smoked in the last 30 days, write 00)
|___|___| Cigarettes
12. If you used to smoke cigarettes and quit, how many months ago did you quit? (If you have never smoked, write 00)
|___|___| Months
Physical Activity 13. Compared to others your same age and sex, how would you rate yourself as to the amount of
physical activity you performed prior to entering basic training?
1 Much less active
2 Somewhat less active
3 About the same
4 Somewhat more active
5 Much more active

USACHPPM Epidemiological Report No. 12-MA-05SBA-08A
D-3
14. Over the last 2 months, what was the average number of times per week you exercised or played
sports for at least 30 minutes at a time?
0 Never
1 Less than 1 time per week
2 1 time per week
3 2 times per week
4 3 times per week
5 4 times per week
6 5 times per week
7 6 times per week
8 7 times or more per week 15. Over the last 2 months, how many times per week did you run or jog?
0 Never
1 Less than 1 time per week
2 1 time per week
3 2 times per week
4 3 times per week
5 4 times per week
6 5 times per week
7 6 times per week
8 7 times or more per week
16. How long were you running or jogging before you entered basic training?
0 Did not run or jog
1 1 month or less
2 2 months
3 3 months
4 4 to 6 months
5 7 to 11 months
6 1 year or more

USACHPPM Epidemiological Report No. 12-MA-05SBA-08A
D-4
17. Over the last 2 months, how often per week did you perform weight training exercises?
0 Never
1 Less than 1 time
2 1 time
3 2 times
4 3 times
5 4 times
6 5 times
7 6 times
8 7 times or more
18. How consistently, 2 or more times per week, have you been performing weight training?
0 Did not weight train > 2/wk
1 1 month of less
2 2 months
3 3 months
4 4 to 6 months
5 7 to 11 months
6 1 year or more
Injury History
19. Have you ever injured bone, muscle, tendon, ligaments, and/or cartilage in one or both of your lower limbs?
1 YES 2 NO
20. Did any of these injuries prevent you from participating in your normal physical activities for at least one week?
0 Does not apply, never been injured
1 YES
2 NO

USACHPPM Epidemiological Report No. 12-MA-05SBA-08A
D-5
21. Following these injuries, were you able to eventually return to 100% of your normal
physical activities?
0 Does not apply, never been injured
1 YES
2 NO
If you are a man, stop here and wait for further instructions. If you are a woman, complete questions 21 through 25 on the following
page.
Women Only: Menstrual History
22. At what age did you start to menstruate? (If you have not had a menstrual cycle, write 00) |___|___| Years
23. Over the last 12 months, how many menstrual periods did you have? (If you have not had a menstrual period, write 00)
|___|___| Menstrual Periods
24. During the last 12 months, have you ever missed six or more months in a row between menstrual cycles?
0 N/A, I have never had a menstrual period
1 No, I have never missed 6 or more months in a row between menstrual cycles
2 Yes, I have missed 6 months or more in a row between menstrual cycles
25. In the last 12 months, have you taken birth control pills or any other hormonal therapy?
1 YES
2 NO

USACHPPM Epidemiological Report No. 12-MA-05SBA-08A
D-6
26. If you have ever been pregnant, how many months ago were you last pregnant?
(If you have never been pregnant, write 00) |___|___| Months
Stop here and wait for further instructions from the staff.

USACHPPM Epidemiological Report No. 12-MA-05SBA-08A
E-1
APPENDIX E ACKNOWLEDGEMENTS
We would like to thank Ms Lisa Young and Ms Michel Waltermyer for assistance with data
collection. Ms Carol Pace and Ms Claudia Coleman put forth dedicated efforts to obtaining many of the references used in this paper. Ms Anita Spiess edited the final manuscript.