Miscommunication Workshop QMUL, London, January 26, 2006 Staffan Larsson Göteborg University

US05EBCA02 (Software Project Management) Unit-IV
SEMCOM Page 1 of 27
CHARUTAR VIDYA MANDAL’S SEMCOM
VallabhVidyanagar
Faculty Name: Ami D. Trivedi Class: TYBCA (Semester – V) Subject: US05EBCA02 (Software Project Management)
UNIT – 4 PROJECT SCHEDULING AND TRACKING TECHNIQUES **INTRODUCTION TO PROJECT SCHEDULING AND TRACKING TECHNIQUES
It will come as no surprise that the young engineer stayed 90 percent complete for the entire project duration and finished (with the help of others) only one month late.
This story has been repeated tens of thousands of times by software developers during the past three decades. The big question is why?
*BASIC CONCEPTS (INTRODUCTION)
Although there are many reasons why software is delivered late, most can be traced to one or more of the following root causes:
1. An unrealistic deadline established by someone outside the software development
group and forced on managers and practitioners within the group.
2. Changing customer requirements that are not reflected in schedule changes.
3. An honest underestimate of the amount of effort and / or the number of resources
that will be required to do the job.
4. Predictable and/or unpredictable risks that were not considered when the project
commenced.
5. Technical difficulties that could not have been for seen in advance.
6. Human difficulties that could not have been foreseen in advance.
7. Miscommunication among project staff that results in delays.
8. A failure by project management to recognize that the project is falling behind
schedule and a lack of action to correct the problem.
Aggressive (read "unrealistic") deadlines are a fact of life in the software business.
Sometimes such deadlines are demanded for reasons that are legitimate (genuine), from the point of view of the person who sets the deadline.
But common sense says that legitimacy must also be perceived by the people doing the work.

US05EBCA02 (Software Project Management) Unit-IV
SEMCOM Page 2 of 27
COMMENTS ON “LATENESS”
Napoleon once said: "Any commander in chief who undertakes to carry out a plan which he considers defective is at fault; he must put forth his reasons, insist on the plan being changed, and finally tender his resignation rather than be the instrument of his army's downfall."
These are strong words that many software project managers should ponder (consider / think about).
The estimation and risk analysis activities and the scheduling techniques are often implemented under the constraint of a defined deadline.
If best estimates indicate that the deadline is unrealistic, a competent project manager should "protect his or her team from undue [schedule] pressure . . . [and] reflect the pressure back to its originators”.
To illustrate, assume that a software development group has been asked to build a real-time controller for a medical diagnostic instrument that is to be introduced to the market in nine months.
After careful estimation and risk analysis, the software project manager comes to the conclusion that the software, as requested, will require14 calendar months to create with available staff. How does the project manager proceed?
It is unrealistic to march into the customer's office (in this case the likely customer is marketing/sales) and demand that the delivery date be changed.
External market pressures have dictated the date, and the product must be released. It is equally foolhardy (foolish) to refuse to undertake the work (from a career standpoint). So, what to do?
The following steps are recommended in this situation:
1. Perform a detailed estimate using historical data from past projects.
Determine the estimated effort and duration for the project.
2. Using an incremental process model, develop a software engineering strategy that will deliver critical functionality by the imposed deadline, but delay other functionality until later.
Document the plan.
3. Meet with the customer and (using the detailed estimate) explain why the imposed deadline is unrealistic.
Be certain to note that all estimates are based on performance on past projects.
Also be certain to indicate the percent improvement that would be required to achieve the deadline as it currently exists.

US05EBCA02 (Software Project Management) Unit-IV
SEMCOM Page 3 of 27
4. Offer the incremental development strategy as an alternative: “We have a few options, and I'd like you to make a decision based on them.
First, we can increase the budget and bring on additional resources so that we’ll have a shot at getting this job done in nine months. But understand that this will increase risk of poor quality due to the tight timeline.
Second, we can remove a number of the software functions and capabilities that you’re requesting. This will make the preliminary version of the product somewhat less functional, but we can announce all functionality and then deliver over the 14 month period.
Third, we can dispense with reality and wish the project complete in nine months. We'll wind up with nothing that can be delivered toa customer.
The third option, I hope you'll agree, is unacceptable. Past history and our best estimates say that it is unrealistic and a recipe for disaster."
There will be some grumbling (upset), but if solid estimates based on good historical data are presented, it's likely that negotiated versions of option 1 or 2 will be chosen. The Unrealistic deadline evaporates. *PROJECT SCHEDULING The reality of a technical project (whether it involves building a hydroelectric plant or developing an operating system) is that hundreds of small tasks must occur to accomplish a larger goal. Some of these tasks lie outside the mainstream and maybe completed without worry about impact on project completion date. Other tasks lie on the "critical” path. If these "critical" tasks fall behind schedule, the completion date of the entire project is put into danger. The project manager’s objective is
To define all project tasks,
Build a network that depicts their interdependencies,
Identify the tasks that are critical within the network, and then
Track their progress to ensure that delay is recognized "one day at a time”.

US05EBCA02 (Software Project Management) Unit-IV
SEMCOM Page 4 of 27
To accomplish this, the manager must have a schedule that has been defined at a degree of resolution that enables the manager to monitor progress and control the project. Software project scheduling is an activity that distributes estimated effort across the planned project duration by allocating the effort to specific software engineering tasks.
It is important to note, however, that the schedule evolves over time.
During early stages of project planning, a macroscopic scheduleis developed.
This type of schedule identifies all major software engineering activities and the product functions to which they are applied. As the project gets under way, each entry on the macroscopic schedule is refined into a detailed schedule. Here, specific software tasks (required to accomplish an activity) are identified and scheduled. Scheduling for software engineering projects can be viewed from two rather different perspectives.
1. In the first, an end-date for release of a computer-based system has already (and irrevocably i.e. permanently) been established.
The software organization is constrained to distribute effort within the prescribed time frame.
2. The second view of software scheduling assumes that rough chronological bounds have been discussed but that the end-date is set by the software engineering organization. Effort is distributed to make best use of resources and an end-date is defined after careful analysis of the software. Unfortunately, the first situation is encountered far more frequently than the second.
US05EBCA02 (Software Project Management) Unit-IV
SEMCOM Page 5 of 27
BASIC PRINCIPLES Basic principles that guide software project scheduling
1. Compartmentalization
The project must be compartmentalized into a number of manageable activities and tasks. To accomplish compartmentalization, both the product and the process are decomposed.
2. Interdependency
The interdependency of each compartmentalized activity or task must be determined.
Some tasks must occur in sequence while others can occur in parallel. Some activities cannot commence until the work product produced by another is available. Other activities can occur independently.
3. Time allocation
Each task to be scheduled must be allocated some number of work units (e.g., person-days of effort).
In addition, each task must be assigned a start date and a completion date that are a function of the interdependencies and whether work will be conducted on a full-time or part-time basis.
4. Effort validation
Every project has a defined number of staff members. As time allocation occurs, the project manager must ensure that no more than the allocated numbers of people have been scheduled at any given time.
For example, consider a project that has three assigned staff members (For example, 3 person-days are available per day of assigned effort5).
On a given day, seven concurrent tasks must be accomplished. Each task requires 0.50 person days of effort. More effort has been allocated than there are people to do the work.
5. Defined responsibilities
Every task that is scheduled should be assigned to a specific team member.

US05EBCA02 (Software Project Management) Unit-IV
SEMCOM Page 6 of 27
6. Defined outcomes
Every task that is scheduled should have a defined outcome.
For software projects, the outcome is normally a work product (e.g. the design of a module) or a part of a work product. Work products are often combined in deliverables.
7. Defined milestones
Every task or group of tasks should be associated with project milestone.
A milestone is accomplished when one or more work products has been reviewed for quality and has been approved.
Each of these principles is applied as the project schedule evolves. **EFFORT ESTIMATION METHODS
Consequently, independent of the estimation method used to calculate the effort needed, the more detailed the information provided is, the more accurate the estimation will be.
Function-point, object-point, use case-point, COCOMO-I & II or even domain expert knowledge, all methods for effort estimation share the same need for information in order to be able to produce accurate results.
Hereby, all estimation methods are based upon the five core metrics introduced by, as depicted in Figure 1. These are: 1. Quality 2. Quantity (Size) 3. Time 4. Costs 5. Productivity
Figure-1

US05EBCA02 (Software Project Management) Unit-IV
SEMCOM Page 7 of 27
The resulting "devil’s square", as shown in Figure-1, depicts the problem of finding the best fitting combination of these factors. 1. In software engineering, Quality is represented as the metric of compliance to user
requirements. Thus, in order to be able to measure quality, the degree of conformance must previously be made quantifiable.
2. Quantity represents the "size" of a project. In terms of software, there are a variety of possible metrics available to measure its size, for instance, lines of code (LOC), function-points or use case-points.
The final choice depends on the data available, such as data-flow diagrams for function-points or UML diagrams for object-points.
3. Time is expressed as a logarithmic function based on the effort.
4. Costs are calculated using a rather trivial estimation function, based on the product
of quantity and quality, divided by the corresponding productivity.
5. Productivity is a constant that is fixed for a company at the time of a project. Project Management Institute (PMI) identifies Quality as the center of the triple constraints triangle consisting of the following as the governing project constraints:
1. Scope (Functionality) 2. Cost (Budget) 3. Time (Duration)
If one of the triple constraints or the quality requirement changes, the other constraints are affected. This directly affects project estimating because software development projects are always limited by budget (cost), time to market (duration), quality and / or scope (functionality). For example: 1. If scope is increased and there is limited time and cost allocated for the project, the
product quality will suffer.
2. If quality demands for a project increase after project estimate is made, then the functionality must be decreased in order to finish the project within the same timeline and cost structure.

US05EBCA02 (Software Project Management) Unit-IV
SEMCOM Page 8 of 27
TEST EFFORT ESTIMATION METHODS Especially in the field of software engineering, the process of testing plays a crucial part to ensure a high level of quality.
According to, testing activities make up 40% of the total software development effort, as depicted in Figure-2.
Figure-2 Effort Distribution in Software Projects
Conventional estimation techniques tend to put a large focus only on the actual development effort instead of including the broad range of additional activities involved, such as the crucial process of testing the software. So it adds further complications to achieve accurate overall effort estimations.
This problem is based on the fact, that when techniques for estimating development effort evolved, the concept of estimating test-engineering time was completely overlooked.
Independent of the size of the software to be tested, certain preconditions must be met in order to be able to design appropriate test cases to achieve a (guaranteed) level of code coverage.
Thus, requirement specifications must be as detailed as possible to ensure a high level of testability.
To estimate the effort needed to design, implement and execute these tests, special methods are needed. EFFORT ESTIMATION METHODS (COMMONLY USED) 1. Function point analysis (FPA) 2. Test point analysis (TPA) 3. Use case-points (UCP)

US05EBCA02 (Software Project Management) Unit-IV
SEMCOM Page 9 of 27
1. FUNCTION POINT ANALYSIS
Since its publication, function point analysis has proven to be a reliable method for measuring the size of software, thus providing test designers, as well as project managers with a solid tool to estimate the efforts needed. Apart from purely measuring its output (i.e. un-adjusted function points), FPA additionally is extremely useful in 1. Estimating project efforts, 2. Managing change of scope (functionality), 3. Measuring productivity, as well 4. Providing means for communicating functional requirements.
In contrast to other test effort estimation methods, FPA was initially designed to be used from the user’s point of view. The designers had realized that the best way to gain an understanding of the users’ needs was
to approach the problem from their perspective and
how they viewed and interpreted the results an automated system produces. Consequently, FPA’s evaluation mechanism is based upon the ways users interact with the system’s capabilities. Hereby, software systems provide users with a distinct set of five basic functions, in order to do their jobs. These functions are separated into two different categories:
1) Data Functions 2) Transactional Functions
1) Data functions address the data requirements of end user, that in return can be
divided into the sub-categories:
Internal Logical Files (ILF) and
External Interface Files (EIF) 2) Transactional functions cope with the user’s need to access data through either
External Inputs (EI),
External Outputs (EO) and
External Inquiries (EQ)

US05EBCA02 (Software Project Management) Unit-IV
SEMCOM Page 10 of 27
ADJUSTMENT FACTORS TO CALCULATE FP Apart from these 5 functional components there exist 2 so-called adjustment factors needed to calculate the actual FP:
1) Functional Complexity and 2) Value Adjustment Factor (VAF)
1) FUNCTIONAL COMPLEXITY Functional Complexity represents the complexity of a single parameterized function (i.e. a test step), that is determined by a combination of the amount of data fields and their corresponding data types. Thus, for every of the five basic function types described above (ILF, EIF, EI, EO, EQ) there exists a complexity matrix, consisting of the distinct combination of its input parameters, resulting in a complexity rating ranging from low to high. The sum of the individual functional complexity based on these calculations, gives the so-called sum of unadjusted function points (UFP).
2) VALUE ADJUSTMENT FACTOR (VAF) VAF considers a system’s technical, as well as operational characteristics. The value adjustment factor (VAF) is based on 14 general system characteristics (GSC's) that rate the general functionality of the application being counted. Each characteristic has associated descriptions that help determine the total degrees of influence (TDI) of the characteristics.

US05EBCA02 (Software Project Management) Unit-IV
SEMCOM Page 11 of 27
General characteristics are:
Data communication,
Distributed data processing
Performance and
Complexity of data processing etc. Once all the 14 GSC’s have been answered, they should be tabulated using the IFPUG (International Function Point User Group) Value Adjustment Equation (VAF) – 14. Each component is rated from 0 to 5, where 0 means the component has no influence on the system and 5 means the component is essential. VAF = 0.65 + ∑(Ci) / 100 where i = is from 1 to 14 representing each GSC.
Below table provides an overview of each GSC.
Sr. No.
General System Characteristic
Brief Description
1. Data communications
How many communication facilities are there to aid in the transfer or exchange of information with the application or system?
2. Distributed data processing
How are distributed data and processing functions handled?
3. Performance Was response time or throughput required by the user? 4. Heavily used
configuration How heavily used is the current hardware platform where the application will be executed?
5. Transaction rate How frequently are transactions executed daily, weekly, monthly, etc.?
6. On-Line data entry What percentage of the information is entered On-Line?
7. End-user efficiency Was the application designed for end-user efficiency? 8. On-Line update How many ILF’s are updated by On-Line transaction? 9. Complex processing Does the application have extensive logical or
mathematical processing? 10. Reusability Was the application developed to meet one or many
user’s needs? 11. Installation ease How difficult is conversion and installation? 12. Operational ease How effective and/or automated are start-up, back-up,
and recovery procedures?
13. Multiple sites Was the application specifically designed, developed, and supported to be installed at multiple sites for multiple organizations?
14. Facilitate change Was the application specifically designed, developed, and supported to facilitate change?

US05EBCA02 (Software Project Management) Unit-IV
SEMCOM Page 12 of 27
FP CALCULATION Finally, FP can be calculated using the following formula: F P = U F P * V AF DRAWBACKS OF FPA Unfortunately, FPA also has its drawbacks. One of FPA’s crucial pitfalls is the fact, that it needs very detailed requirements to produce accurate results. As already mentioned earlier, requirement specifications tend to not be as complete as they should be. Thus, this leaves room for further improvement. 2. TEST POINT ANALYSIS
TPA
FPA
Test point analysis (TPA) represents a test estimate preparation technique that can be used to objectively prepare estimates for system- and acceptance tests.
FPA does not cover system- and acceptance tests.
TPA only covers black-box testing. TPA only covers white-box testing. Consequently, FPA and TPA merged together provide means for estimating both, white- and black-box testing efforts.
TPA also offers the possibility to determine the relative importance of the functions to be tested, so that the available testing time can be used as efficiently as possible.
TP CALCULATION Based on the metrics derived from FPA (UFP, VAF and finally FP), then was able to determine the corresponding amount of TP. Factors involved in determining the TP are rather wide-ranging. Thus, there are a lot of dependent and independent factors that need to be taken into account. Since TPA is based upon the principles of a black-box test, formulating an estimate requires knowledge of 3 basic elements. 1) Size of the software system 2) Test strategy 3) Level of Productivity

US05EBCA02 (Software Project Management) Unit-IV
SEMCOM Page 13 of 27
1) Size of the software system
Using TPA, the size of a software system is approximately equivalent to the amount of FP previously calculated through FPA. Nevertheless, again certain factors need to be taken into account, which has alternating influences on the testing size, as opposed to the amount of FP.
These factors are: 1. Complexity It refers to number of conditions in a function. More conditions
almost always mean more test cases and therefore a greater volume of testing work.
2. Interfacing The degree of interfacing of a function is determined by
the number of data sets maintained by a function and
the number of other functions which makes use of those data sets.
Interfacing is relevant because these other functions will require testing if the maintenance function is modified.
3. Uniformity It is important to consider the extent to which the structure of a function allows it to be tested using existing or slightly modified specifications. i.e. the extent to which the information system contains similarly structured functions.
2) Test strategy
Test strategy specifies which quality characteristics are going to be tested for each function, as well as the degree of coverage.
Hereby, more important functions and characteristics are going to be tested more intensively, thus increasing the testing volume as such.
Therefore, it is important to note, that recommends to determining the importance of these characteristics in conjunction with the client to achieve a maximum level of testing conformance.
Further differentiates between two factors that influence the thoroughness of testing in accordance with the client: 1. User importance- denotes the level of significance of a particular function. 2. User intensity- describes its level of usage.

US05EBCA02 (Software Project Management) Unit-IV
SEMCOM Page 14 of 27
A function that is going to be used throughout the day is characterized as more important by the user.
A function that is used very rarely will not be marked a high priority. The same principle can be applied to the user-intensity factor. 3) Level of Productivity Finally, the level of productivity is defined as the amount of time needed to realize a single test point, as determined by the test strategy and the system’s size. Productivity is composed of 2 components (as shown in Figure-3): 1. Productivity factor and 2. Environmental factor 1. Productivity factor is specific to the individual organization, represented by the
knowledge and skill of the test team. 2. Environmental factor describes the external influence of the environment on the
test activities, including the availability of test tools, the level of the team’s experience with the test environment.
Through a simple multiplication using the third factor, the level of productivity, the estimated amount of hours needed can be determined. PRIMARY FACTORS AND STEPS INVOLVED IN PROCEDURE OF CALCULATING THE AMOUNT OF TP Figure depicts the primary factors and steps involved in the procedure of calculating the amount of TP, which eventually leads to the total amount of test hours estimated.
Figure-3: Overview of Test Point Analysis procedure

US05EBCA02 (Software Project Management) Unit-IV
SEMCOM Page 15 of 27
Overall procedure behind TPA, as depicted by Figure-3, is based upon the following steps. 1) First, the amounts of dynamic test points have to be calculated, as the sum of the
TP assigned to all functions. Hereby, TP are calculated for each individual function using
Amount of FP,
Function-dependent factors (user-importance, user-intensity, complexity, uniformity and interfacing), as well as
Quality requirements.
2) Secondly, the static test points are a result of determining the number of test points required to test static measurable characteristics. The total amount of TP is the sum of dynamic and static TP.
3) Following, the amount of primary test hours can be calculated using the following
formula: ∑ (T P) *Environmental factor * Productivity factor
Primary test hours represent the volume of work required for the primary testing activities, represented by the amount of time required for completion of the test phases:
Preparation,
Specification,
Execution and
Completion 4) Finally, in order to get to the total amount of estimated test hours, the volume of
work needed for additional management activities needs to be taken into account.
The magnitude of these secondary test activities primarily depends on the availability of management tools, as well as the size of the test team.
All in all, the resulting total amount of test hours represents an estimate of the total time needed for the entire set of testing activities, excluding process of formulating of the test plan.

US05EBCA02 (Software Project Management) Unit-IV
SEMCOM Page 16 of 27
3. USE CASE POINTS In contrast to FPA and TPA, test effort estimation using UCP is based upon use cases (UC). Definition:UC is a system’s behaviour under various conditions, based on requests from a so-called "primary stakeholder", i.e. one of the stakeholders. Thus, UC capture contractual agreements between these stakeholdersabout the system’s behaviour. Main goal is to honour and protect the interests of all stakeholders involved. Furthermore, by collecting all possible behavioural sequences, based on requests submitted to the system, UC also capture the wide range of scenarios possible. So, according to, UC basically represent what users want from a system. V-model should be the life cycle model of choice, due to the fact, that for each development activity it clearly associates a corresponding testing activity, as shown in Figure-4.
Figure-4: The V-Model

US05EBCA02 (Software Project Management) Unit-IV
SEMCOM Page 17 of 27
Thus, subsequent steps involved in this model ensure that the required test documentation is complete and comprehensive.
When developing an estimation method that is placed after the operational/business needs have been defined (see Figure-4), it becomes obvious that UC will serves as its corresponding input. Thus, the primary task of UCP is to map use cases (UC) to test cases (TC).
Hereby, each scenario together with the corresponding exception flow for each UC serves as input for a specific TC.
Basically, the amount of test cases identified through this mapping results in the corresponding test effort estimation.
6 basic steps to determine a project’s required test effort
UCP is comprised of 6 basic steps that determine a project’s required test effort:
1. Calculate unadjusted actor weights (UAW)
2. Determine unadjusted UC weights (UUCW)
3. Compute unadjusted UC points (UUCP)
4. Determine technical and environmental factors
5. Calculate adjusted UCP (AUCP)
6. Compute final effort
DETAILED EXPLANATION
UCP is comprised of 6 basic steps that determine a project’s required test effort:
1. Calculate unadjusted actor weights (UAW) An actor in a use case might be a person, another program, a piece of hardware, and so on.
Each actor in the system is classified as simple, average, or complex.
Actor is assigned a weight in the same way the use cases were weighted like 1 for simple, 2 for average and 3 for complex.
The sum of all actor weights in known as Unadjusted Actor Weight (UAW).
Calculating UAW for a sample project
US05EBCA02 (Software Project Management) Unit-IV
SEMCOM Page 18 of 27
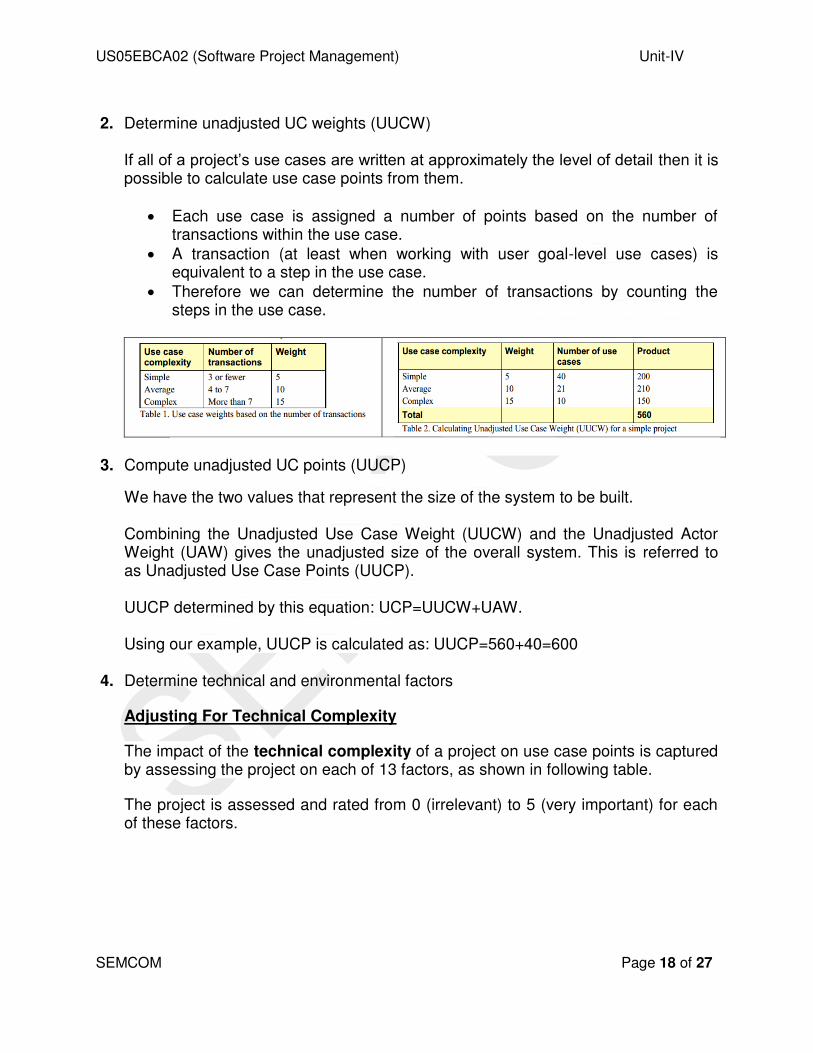
2. Determine unadjusted UC weights (UUCW)
If all of a project’s use cases are written at approximately the level of detail then it is possible to calculate use case points from them.
Each use case is assigned a number of points based on the number of transactions within the use case.
A transaction (at least when working with user goal-level use cases) is equivalent to a step in the use case.
Therefore we can determine the number of transactions by counting the steps in the use case.
3. Compute unadjusted UC points (UUCP)
We have the two values that represent the size of the system to be built. Combining the Unadjusted Use Case Weight (UUCW) and the Unadjusted Actor Weight (UAW) gives the unadjusted size of the overall system. This is referred to as Unadjusted Use Case Points (UUCP). UUCP determined by this equation: UCP=UUCW+UAW. Using our example, UUCP is calculated as: UUCP=560+40=600
4. Determine technical and environmental factors
Adjusting For Technical Complexity
The impact of the technical complexity of a project on use case points is captured by assessing the project on each of 13 factors, as shown in following table.
The project is assessed and rated from 0 (irrelevant) to 5 (very important) for each of these factors.
US05EBCA02 (Software Project Management) Unit-IV
SEMCOM Page 19 of 27
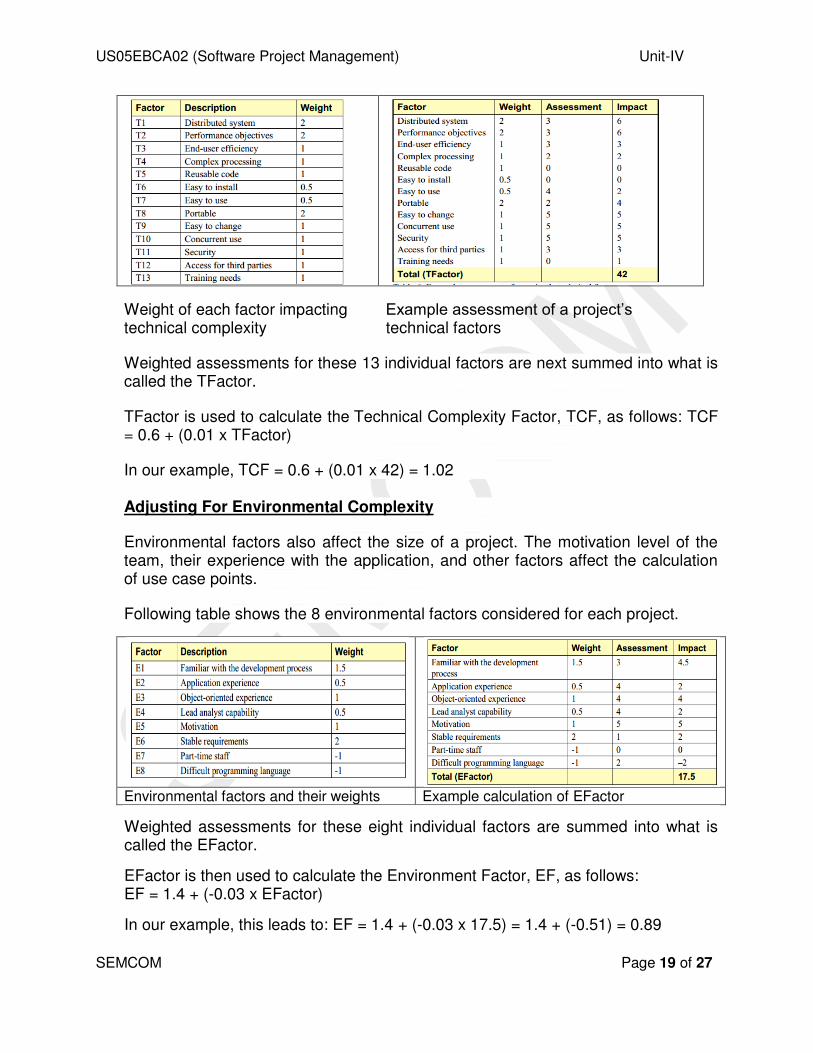
Weight of each factor impacting technical complexity
Example assessment of a project’s technical factors
Weighted assessments for these 13 individual factors are next summed into what is called the TFactor.
TFactor is used to calculate the Technical Complexity Factor, TCF, as follows: TCF = 0.6 + (0.01 x TFactor)
In our example, TCF = 0.6 + (0.01 x 42) = 1.02 Adjusting For Environmental Complexity
Environmental factors also affect the size of a project. The motivation level of the team, their experience with the application, and other factors affect the calculation of use case points.
Following table shows the 8 environmental factors considered for each project.
Environmental factors and their weights Example calculation of EFactor
Weighted assessments for these eight individual factors are summed into what is called the EFactor.
EFactor is then used to calculate the Environment Factor, EF, as follows: EF = 1.4 + (-0.03 x EFactor)
In our example, this leads to: EF = 1.4 + (-0.03 x 17.5) = 1.4 + (-0.51) = 0.89

US05EBCA02 (Software Project Management) Unit-IV
SEMCOM Page 20 of 27
5. Calculate adjusted UCP (AUCP) Unadjusted Use Case Points (UUCP) can be calulated with the following formula: UCP = UUCW x TCF x EF
For our example: UCP = 600 x 1.02 x 0.89 = 545
6. Compute final effort
Now, size of the project is known. So we can estimate total effort for the project using following formula.
Estimated Effort = UCP x Hours/UCP For Hours/UCP:
Use Scheider and Winters’ range of 20 to 28 hours per use case point. Take 20 (Karner originally proposed a ratio of 20 hours per use case point) or
calculate your organization’s own historical average from past projects
In our example, the complete project will take 10,900 hours and 15,260 hours to complete (545 X 20 = 10,900 and 545 x 28 = 15,260). With 10 developers, this means the team will make 10 x 30 = 300 hours per week or 600 hours of progress per two-week iteration. Dividing 10,900 hours by 600 hours and rounding up indicates that the overall project might take 19 two-week iterations. Dividing 15,260 by 600 hours and rounding up indicates that it might take 26 two-week iterations. Our estimate is then that this project will take between 19 and 26 two-week iterations (38 to 52 weeks).
TASK NETWORK AND SCHEDULING *TASK NETWORK Individual tasks and subtasks have interdependencies based on their sequence. In addition, when more than one person is involved in a software engineering project, it is likely that development activities and tasks will be performed in parallel. When this occurs, concurrent tasks must be coordinated so that they will be complete when later tasks require their work product(s).

US05EBCA02 (Software Project Management) Unit-IV
SEMCOM Page 21 of 27
A task network, also called an activity network, is a graphic representation of the task flow for a project. It is sometimes used as the mechanism through which task sequence and dependencies are input to an automated project scheduling tool. In its simplest form (used when creating a macroscopic schedule), the task network depicts major software engineering tasks. Figure-5 shows a schematic task network for a concept development project. The concurrent nature of software engineering activities leads to a number of important scheduling requirements. Because parallel tasks occur asynchronously, the planner must determine inter task dependencies to ensure continuous progress toward completion. In addition, the project manager should be aware of those tasks that lie on the critical path. That is, tasks that must be completed on schedule if the projectas a whole is to be completed on schedule. It is important to note that the task network shown in Figure-5 is macroscopic. In a detailed task network (a precursor to a detailed schedule), each activity shownin Figure-5 would be expanded.
Figure-5

US05EBCA02 (Software Project Management) Unit-IV
SEMCOM Page 22 of 27
*SCHEDULING Scheduling of a software project does not differ greatly from scheduling of any multitask engineering effort. Therefore, generalized project scheduling tools and techniquescan be applied with little modification to software projects. 2 project scheduling methods that can be applied to software development: 1. Program Evaluation and Review Technique(PERT) and 2. Critical Path Method(CPM) Both techniques are driven by information already developed in earlier projectplanning activities:
Estimates of effort
A decomposition of the product function
The selection of the appropriate process model and task set
Decomposition of tasks Interdependencies among tasks may be defined using a task network. Tasks, sometimescalled the project work breakdown structure(WBS), are defined for the productas a whole or for individual functions. Both PERT and CPM provide quantitative tools that allow the software planner to: 1. Determine the critical path—the chain of tasks that determines the duration of
theproject;
2. Establish “most likely” time estimates for individual tasks by applying statisticalmodels; and
3. Calculate “boundary times” that define a time "window" for aparticular task.
Both PERT and CPM have been implemented in a wide variety of automated toolsthat are available for the personal computer. Such tools are easy to use andmake the scheduling methods described previously available to every software projectmanager.
US05EBCA02 (Software Project Management) Unit-IV
SEMCOM Page 23 of 27
TIMELINE CHARTS
When creating a software project schedule, the planner begins with a set of tasks (thework breakdown structure). If automated tools are used, the work breakdown is input as a task network or task outline. Effort, duration, and start date are then input foreach task. In addition, tasks may be assigned to specific individuals.As a consequence of this input, a timeline chart, also called a Gantt chart, is generated. A timeline chart can be developed for the entire project. Alternatively, separate charts can be developed for each project function or for each individual working on the project. TRACKING THE SCHEDULE The project schedule provides a road map for a software project manager. If it has been properly developed, the project schedule defines the tasks and milestones that must be tracked and controlled as the project proceeds.
Tracking can be accomplishedin a number of different ways: 1. Conducting periodic project status meetings in which each team member reports
progress and problems. 2. Evaluating the results of all reviews conducted throughout the software engineering
process. 3. Determining whether formal project milestones have been accomplished by the
scheduled date. 4. Comparing actual start-date to planned start-date for each project task listed in the
resource table. 5. Meeting informally with practitioners to obtain their subjective assessment of
progress to date and problems on the horizon. 6. Using earned value analysis to assess progress quantitatively.
In reality, all of these tracking techniques are used by experienced project managers.
Control is employed by a software project manager to administer projectresources, cope with problems, and direct project staff.
If things are going well (i.e., the project is on schedule and within budget, reviews indicate that real progress is being made and milestones are being reached), control is light.

US05EBCA02 (Software Project Management) Unit-IV
SEMCOM Page 24 of 27
But when problems occur, the project manager must exercise control to reconcile them as quickly as possible. After a problem has been diagnosed, additional resources may be focused on the problem area:
staff may be redeployed or
the project schedule can be redefined.
When faced with severe deadline pressure, experienced project managers sometimes use a project scheduling and control technique called time-boxing.
The time-boxing strategy recognizes that the complete product may not be deliverable by the predefined deadline.
Therefore, an incremental software paradigm is chosen and a schedule is derived for each incremental delivery.
The tasks associated with each increment are then time-boxed. This means that the schedule for each task is adjusted by working backward from the delivery date for the increment.
A “box” is put around each task. When a task hits the boundary of its time box (plus or minus 10 percent), work stops and the next task begins.
The initial reaction to the time-boxing approach is often negative: “If the work isn’t finished, how can we proceed?”
The answer lies in the way work is accomplished.
By the time the time-box boundary is encountered, it is likely that 90 percent of the task has been completed. The remaining 10 percent, although important, can
1. be delayed until the next increment or 2. be completed later if required.
Rather than becoming “stuck” on a task, the project proceeds toward the delivery date. *PROJECT MONITORING AND CONTROL
The purpose of Project Monitoring and Control is to provide an understanding of the Project’s progress so that appropriate corrective actions can be taken when the project’s Performance deviates significantly from the plan. Throughout the executing process, there is also another project management process group of stages that is happening.

US05EBCA02 (Software Project Management) Unit-IV
SEMCOM Page 25 of 27
Monitoring and controlling often happens concurrently with executing, but this particular group offers its own separate list of tasks. Often what is associated with monitoring and controlling is checking to make sure that the works output from the executing processes match what the end objectives of the project are. It also involves making adjustments as needed. The monitoring and controlling phase can be made easier by the use of project management software. Monitoring progress against the values entered into the computer program during the initiating, planning, and executing stages, one can get a clearer picture of what is happening with the project. But it is not enough to merely monitor the project; the project manager must also
control the project,
nudging (push) it back on track when it strays (drift) a little and
ensuring that the end result is of high quality. Part of controlling is also addressing problems and making sure that issues are resolved as they arise. While monitoring and controlling, it is also necessary for a project manager to revisit the project plan and also the scope. As projects progress, especially if they are projects that are slated (scheduled) to last for more than a year, often the scope and direction will need adjustment. A plan should not be written in stone, and if the project manager or his or her superiors see a need for some tweaking (change) of the objectives, goals, or scope, the project plan should allow for that. Inspection of the product or results of tasks as they are fulfilled is also part of this project management process group. The project manager should make sure that the results of the execution match up with the objectives. Quality should be looked at, ensuring that the sponsor of the project is satisfied. This is monitoring. The controlling comes in when improvements need to be made. If quality needs to be improved, this takes place at this time.
US05EBCA02 (Software Project Management) Unit-IV
SEMCOM Page 26 of 27
The sponsor of the project informally approves the end products of the work, and expresses whether or not he or she is generally satisfied with the results. Finally, part of the monitoring and controlling project management process group is making sure that there are lessons learned document drafted and that evaluations are completed. The lessons learned is a list of important things that should be remembered for next time. It can also serve as a helpful guide if someone else is performing the follow up or is taking over the next part of the project. Evaluations should be made for each team member as well as for the results. It is important for the project manager to monitor each member’s performance and form an opinion as to how she or he did. It is also necessary for evaluations to show whether or not the product of the project fulfills expectations and objectives. Effective project management means that one must be careful to know what is happening on the project, and whether the result is desirable. It is about quality control and keeping everything running as on time as possible. *GRAPHICAL REPORTING TOOLS Senior managers may have only a few minutes of uninterrupted time to digest your report. Respect that time. They won’t be able to fully read and understand your report if they have to read 15 pages before they get any useful information. Having to read several pages only to find out that the project is on schedule is frustrating and a waste of valuable time. GANTT CHARTS A Gantt chart is one of the most convenient, most used, and easy-to-grasp depictions (representation) of project activities. The chart is formatted as a two-dimensional representation of the project schedule with activities shown in the rows and time shown across the horizontal axis. It can be used during planning for
resource scheduling, and
status reporting.

US05EBCA02 (Software Project Management) Unit-IV
SEMCOM Page 27 of 27
The only down side to using Gantt charts is that they do not contain dependency relationships. Some project management software tools have an option to display these dependencies, but the result is a graphical report that is so cluttered with lines representing the dependencies that the report is next to useless. In some cases, dependencies can be guessed at from the Gantt chart, but in most cases they are lost. Disclaimer The study material is compiled by Ami D. Trivedi. The basic objective of this material is to supplement teaching and discussion in the classroom in the subject. Students are required to go for extra reading in the subject through library work.


![[Amy Singer] İyilik Yap Denize At.pdf](https://static.fdocuments.in/doc/165x107/56d6be261a28ab301690d72f/amy-singer-iyilik-yap-denize-atpdf.jpg)