Us Retail SGA Book of Metrics 021010
20
SGA Book of Metrics for Retail: 2009 Executive Summary First-of-its-kind insights into retail’s store operations, general and administrative functions Global Benchmarking Center February 2010
-
Upload
daengmaduppa -
Category
Documents
-
view
15 -
download
0
Transcript of Us Retail SGA Book of Metrics 021010

SGA Book of Metrics for Retail: 2009 Executive SummaryFirst-of-its-kind insights into retail’s store operations, general and administrative functions
Global Benchmarking CenterFebruary 2010

21“Low-cost performers” refers to companies in the first quartile of the five process categories. They are not necessarily “best in class” along other meaningful dimensions, such as quality, innovation, or customer/employee satisfaction. The benchmarks in this study suggest possible cost-reduction opportunities, which must be balanced against growth strategies.
Dear Colleague:
Managing through one of the deepest recessions of the past 30 years, retail executives are facing a market where reduced consumer spending has made cost-management initiatives more critical than ever. They are faced with many questions and challenges, such as:
• “Where will I get the most impact without negatively affecting our ability to serve the customer or the customer’s experience?”
• “Where can I reduce costs without endangering our ability to drive growth quickly when the economy improves?”
Measuring store operations and general and administrative costs (SGA) and comparing them against low-cost performers can help retail executives in their efforts to identify and close competitive cost gaps that exist in their business.
To develop a baseline of current, retail-specific data that can be used to quantify SGA improvement opportunities, Deloitte has conducted a benchmarking study of core SGA functions in the retail industry:
•Store operations•Merchandising•Supply chain management•Marketing•Information technology•Finance•Human resources•Support services
We believe that in conducting this study and by identifying the spend amounts of low-cost performers, we can provide retail executives relevant data and practical insights about their organizations’ competitive positioning.
We hope you find the results of our study helpful and instructive, and we invite you to contact us for further information about our research and how it may help your company.
Sincerely,
Stacy JaniakVice Chairman & U.S. Retail LeaderPartnerDeloitte LLP
John RooneyPrincipalNational Retail IndustryDeloitte Consulting LLP
Richard T. RothPrincipalNational Benchmarking LeaderDeloitte Consulting LLP
All study data and statistics referenced and presented in this report, as well as the representations made and opinions expressed, unless specifically described otherwise, pertain only to the participating organizations and their responses to the Deloitte Global Benchmarking Center study of retail process performance conducted in 2009.
As used in this document, “Deloitte” means Deloitte Consulting LLP, a subsidiary of Deloitte LLP. Please see www.deloitte.com/us/about for a detailed description of the legal structure of Deloitte LLP and its subsidiaries.

Overall findings ......................................................................................... 1
Key themes ................................................................................................ 3
Functional analysis .................................................................................... 5
Store operations ................................................................................. 5
Supply chain ....................................................................................... 6
Merchandising .................................................................................... 6
Information technology ...................................................................... 7
Finance ............................................................................................... 7
Looking forward ........................................................................................ 8
Study approach and methodology ............................................................. 9
Performance measures ............................................................................ 10
Representative participant list.................................................................. 13
About the Global Benchmarking Center .................................................. 14
Contents
Executive Summary SGA book of metrics for retail

1
As consumers spend less and save more, retailers face continued pressure to improve bottom-line perfor-mance — even after previous cost-cutting initiatives. We project that US consumer spending will rise in the next several years at a slower rate than the GDP due to tighter credit conditions, slowly recovering home equity, and slow recovering employment. Facing this, what should retail executives keep in mind as they take steps to reduce additional costs now?
The customer experience is often a critical competitive differentiator among retailers, making cost-reduction efforts tricky. For many, improvement benefits come not from reducing costs, but reallocating them more effec-tively. We believe that reducing or reallocating costs — while achieving sales growth and maintaining strong brand value — requires retailers to view cost improve-ment opportunities through a customer-experience lens: “How would this action impact my customers?” “How can we adjust our cost structure to achieve improvements and preserve customer loyalty?”
This study compares store operations and general and administrative functions (SGA1) against median and
Overall findings
Figure 1: Total SGA function cost as a percent of sales
35.9%
Information technologyFinanceHuman resourcesSupport services
Store operationsMerchandisingSupply chainMarketing
24.9%
Retailmedian
Retaillow-cost performer
Information technologyFinanceHuman resourcesSupport services
Store operationsMerchandisingSupply chainMarketing
Privatelabel
Non-privatelabel
Figure 2: Total SGA function cost as a percent of sales (median)
46.8%
38.4%
low-cost performers in the benchmark group. The results show gaps that point to significant potential for strategic cost reductions, not only for short-term relief during this economic downturn, but also for the long-term process efficiencies needed to jump start growth upon recovery.
The study also shows that retail low-cost performers have created distinctive characteristics over their median counterparts by:
Allotting more staff to shopper-facing areas •Transforming their advertising mix for an enhanced •return on investmentReverting to in-house supply chain options to •improve cost performanceReducing store operations cost by managing their •assortment to a smaller number of stock-keeping units (SKUs) — without negatively impacting salesInvesting strategically in IT •Reducing costs in traditional back-office areas to the •point where they can focus on improving new areas of spend, such as marketing, IT and supply chain
1 This study’s reference to “SGA” should not be confused with the traditional selling, general and administrative function. We’re defining SGA in a wider, expanded sense to also include store operations, merchan-dising and supply chain.

SGA book of metrics for retail 2
As expected, according to the study, the median allocate more than 70% of SGA to store operations — dwarfing other functional cost areas (Figure 1). This area continues to represent a key opportunity for all retailers in our study: Apparel, private label2, other/specialty and non-private label (Figure 2).
Our analysis included an examination of cost gaps between median and low-cost performers in the study — by function and by sector. We compared metrics such as cost and full-time equivalents (FTEs) against a defined set of retail peers to identify cost gaps. This analysis is significant; while a metric is a useful number on its own, a cost gap – measured in pure dollars – identifies opportunities for improvement. In other words, companies looking to move from the median to low-cost performer level will see what that means to them in actual cost savings.
Information technologyFinanceHuman resourcesSupport services
Store operationsMerchandisingSupply chainMarketing
Retailoverall
Apparel Other/Specialty
36.8%
Figure 3: Total SGA function cost gap from median to low-cost performer per $1 billionin sales by subsector ($US M)
109.9
62.3
108.7
Our study found that the apparel sector has a lower cost-improvement opportunity than the other/specialty retailers. Merchandising is the only retail-specific “front-office” function where apparel has a larger opportunity than the other/specialty retailers (Figure 3).
Overall, we’ve found that the gap between the median and low-cost performers is smaller in typical back-office functions (i.e., finance, human resources, support services) and higher in areas such as marketing, infor-mation technology and merchandising. This is likely because retailers, in our experience, have prioritized cost-reduction efforts on the back-office functions first, viewing the other functions as more strategic.
2 The private label peer group includes study participants with a high percentage of sales from private label products; the median, or midpoint value, of “private label sales as a percent of total sales” is 98% of the peer group.
Note: Retail overall includes apparel, other/specialty and other subscribers. See page 13 for details.

3
Key themes
Low-cost performers spend much more on visual merchandising and online advertising than traditional print and TV/radio advertising
Retail low-cost performers consistently place a higher percentage of their advertising spend on below-the-line (BTL) vehicles targeting customers more directly through loyalty programs, community via event sponsorships, in-store displays and messaging, or online. In contrast, the median spends more proportionately on above-the-line (ATL) vehicles, which include more traditional mass advertising through print, TV and radio (Figure 4). This validates the strong industry case for BTL being more cost-effective while delivering better results. We also note an increase in customer research spending for low-cost performers.
Figure 5: Total SKUs per retailer
121,478
Retailmedian
79,104
Retaillow-cost performer
Low-cost performers benefit from targeted investments and simplified SKUs
When it comes to the operations-specific elements of merchandising, low-cost performers within a given sector — e.g., apparel — rely on targeted investments and a smaller assortment of SKUs for their advantage over the median. They manage 35% fewer SKUs (Figure 5), providing the necessary product variety customers demand without the complexity of overextended inventory. In addition, through further correlation analysis, we found that low-cost performers spend 84% more on store operations technology, which contributes to lower process costs.
Note: Total SKUs per retailer includes all SKUs, i.e., styles, colors, sizes, etc.
Print advertisingTV/Radio advertisingSponsorship advertising
Visual merchandisingOnline advertisingOther advertising
Figure 4: Advertising spend allocation
Retail median Retail low-cost performer

SGA book of metrics for retail 4
Retailoverall
Figure 7: Occupancy, depreciation, and maintenance as a percent of total SGA cost (median)
29.1%
39.0%
22.4%
35.5%
Apparel Non-privatelabel
Other/Specialty
20.8%
Privatelabel
Within functions, the top five costs represent 65% to 70% of total SGA cost for each of the subsectors
We probed costs within functions and, not surpris-ingly, found that store operations dominates the cost categories (Figure 6). In our experience, retailers have typically brought store real estate costs down by rene-gotiating leases, standardizing maintenance policies, and reducing usage costs by incorporating efficient energy and maintenance technologies. Also, we believe that increased productivity and innovation have helped low-cost performers decrease merchandising store activities and advertising spend.
Store size has a direct impact on cost per square foot
Occupancy costs generally represent 20-35% of overall SGA cost, and apparel and private label retailers tend to have higher occupancy spend. As expected, store size directly impacts cost per square foot, with larger stores driving lower per-square-foot costs (Figures 7-8).
Average square footage per store
Figure 8: Occupancy cost per square foot
$80
60
40
20
0800006000040000200000
Store operations: Occupancy, depreciation, maintenenceStore operations: Merchandise and sell goodsStore operations: Manage and plan store operationsStore operations: Miscellaneous other costMarketing: Advertising spend
Figure 6: Top five costs as a percent of total SGA (median)29.1%
15.5%
10.0%8.9%
5.7%

5
Functional analysis
Store operations:
Retailers focus staff on shopper-facing functions to ensure a brand-building customer experience that supports growth
Retailers focus staff on shopper-facing functions to ensure a brand building customer experience that supports growth
As expected, more than 84% of staff resides in store operations, with store labor costs as a percent of sales being relatively consistent between the median and low-cost performers. However, it’s interesting to note that low-cost performers can maintain their overall low-cost ranking while still spending 6% more on store operations staff per billion in sales than the median; through this, we can infer that the low-cost performers focus their spend in customer-facing areas and achieve cost reductions in non-customer-facing areas. While both
median and low-cost performers are employing process and technology innovations to help reduce staff require-ments in heavy transactional areas, such as finance and HR, low-cost performers are doing a better job of ensuring they have the necessary higher-level staff.
In addition, apparel low-cost performers have 68% lower process costs than the median in managing and planning store operations, representing about $30 million in opportunity per $1 billion in sales. Meanwhile, the difference is much lower within the other/specialty subsector, where low-cost performers spend 22% less than the median on process costs.
Figure 9: Manage and plan store operations process cost per $1 billion in sales ($US M)
4.44%
1.43%
2.22%
1.74%
4.8
Low-Cost PerformerMedian
Apparel Other/Specialty
SGA book of metrics for retail 6
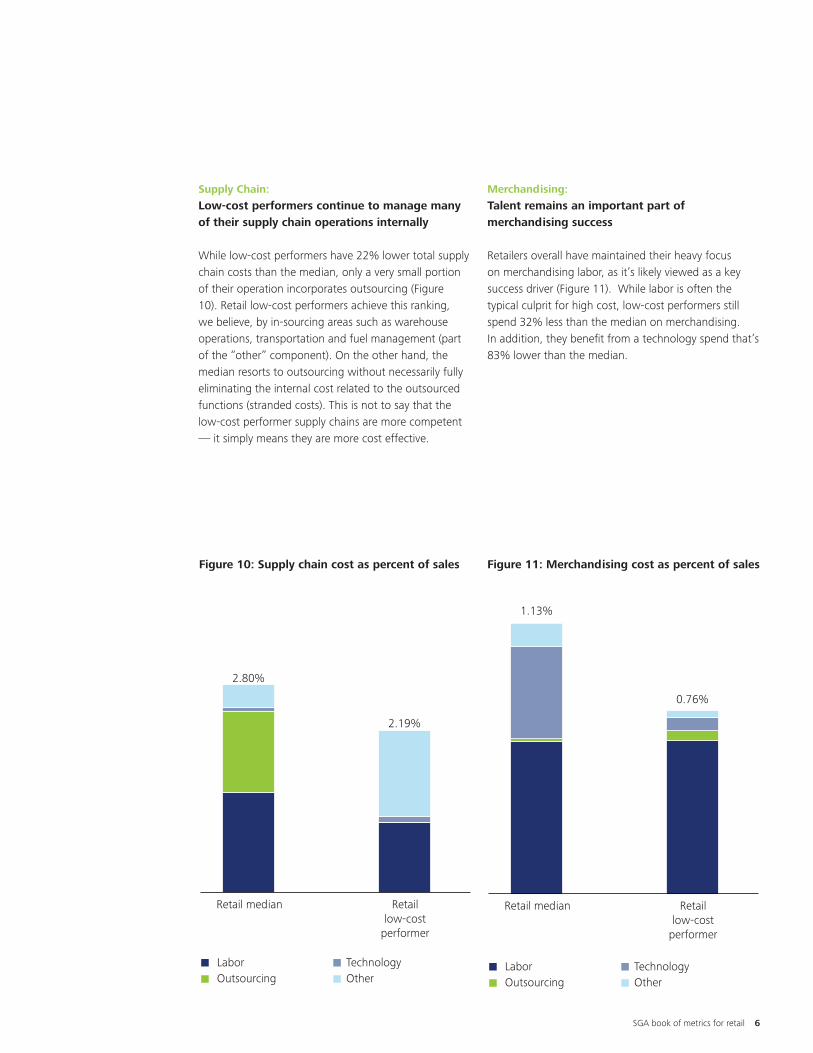
Supply Chain:
Low-cost performers continue to manage many of their supply chain operations internally
While low-cost performers have 22% lower total supply chain costs than the median, only a very small portion of their operation incorporates outsourcing (Figure 10). Retail low-cost performers achieve this ranking, we believe, by in-sourcing areas such as warehouse operations, transportation and fuel management (part of the “other” component). On the other hand, the median resorts to outsourcing without necessarily fully eliminating the internal cost related to the outsourced functions (stranded costs). This is not to say that the low-cost performer supply chains are more competent — it simply means they are more cost effective.
Figure 10: Supply chain cost as percent of sales
TechnologyOther
LaborOutsourcing
Retail median Retaillow-cost
performer
2.80%
2.19%
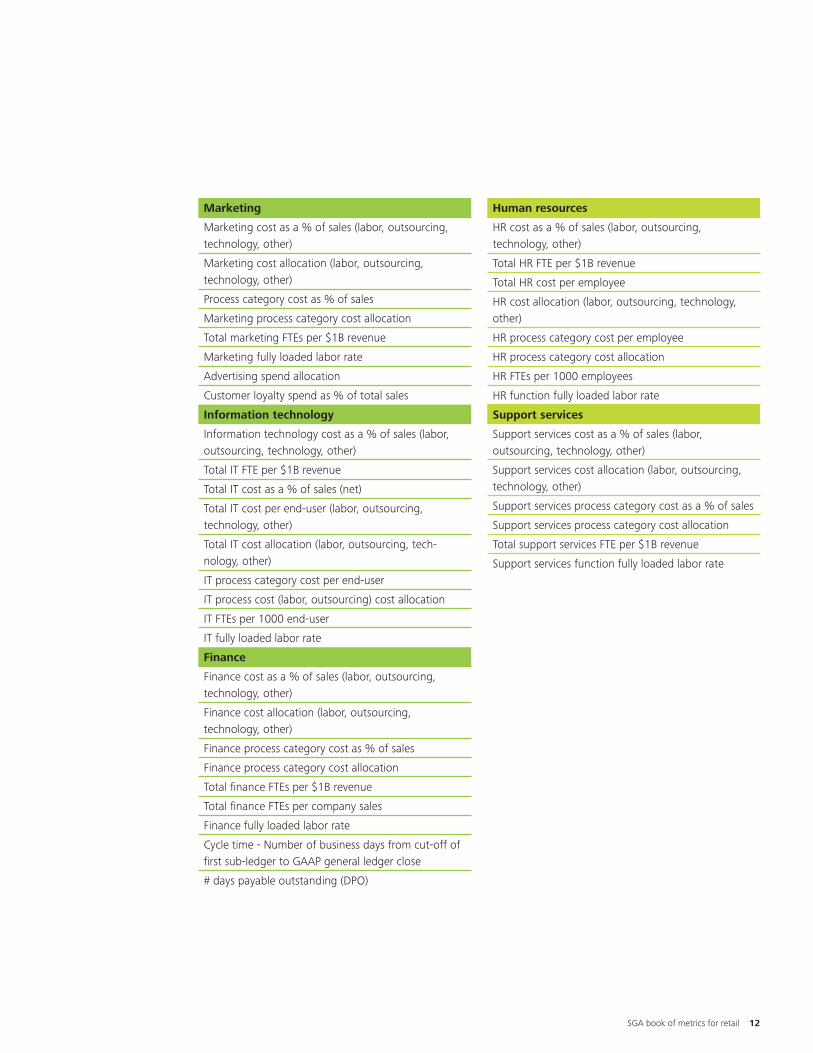
Merchandising:
Talent remains an important part of merchandising success
Retailers overall have maintained their heavy focus on merchandising labor, as it’s likely viewed as a key success driver (Figure 11). While labor is often the typical culprit for high cost, low-cost performers still spend 32% less than the median on merchandising. In addition, they benefit from a technology spend that’s 83% lower than the median.
Figure 11: Merchandising cost as percent of sales
TechnologyOther
LaborOutsourcing
Retail median Retaillow-cost
performer
1.13%
0.80%
Figure 10: Supply chain cost as percent of sales
TechnologyOther
LaborOutsourcing
Retail median Retaillow-cost
performer
2.80%
2.19%
Figure 11: Merchandising cost as percent of sales
TechnologyOther
LaborOutsourcing
Retail median Retaillow-cost
performer
1.13%
0.76%

7
Information technology:
Surprisingly, outsourcing is not driving lower IT costs
While low-cost performers have a 36% lower IT cost per end-user relative to the median, it’s not because they outsource much more, as is often thought (Figure 12). Low-cost performers in our study achieve their cost savings through a lower labor and technology spend than the median.
This finding supports the belief that outsourcing rarely provides cost savings unless additional factors are taken into consideration: Sound management of the effort, clear and effective communication, effective processes, high-quality deliverables and explicit service-level agreements.
Finance:
Process innovation gives low-cost performers an edge over the median
Low-cost performers spend 27% less than the median on finance, with labor and technology being the largest sources of the cost gap (Figure 13).
In our experience, highly effective retailers have done a good job of developing the finance process innovations that help lower costs and increase productivity. They make use of efficient technologies and shared services to reduce transaction costs and labor requirements.
Figure 12: IT total cost per end-user ($US)
TechnologyOther
LaborOutsourcing
Retail median Retaillow-cost
performer
$2,567
$1,652
Figure 12: IT total cost per end-user ($US)
TechnologyOther
LaborOutsourcing
Retail median Retaillow-cost
performer
2,567
1,652
Figure 13: Finance cost as a percent of sales
TechnologyOther
LaborOutsourcing
Retail median Retaillow-cost
performer
0.57%
0.78%

SGA book of metrics for retail 8
Looking forward
More than ever, retail executives need timely, relevant, industry-specific data to make effective business decisions, to assess priorities and to develop a plan for improvement in the areas that matter most. Through benchmarking, executives can:
Identify and quantify potential improvement opportunities, •Set reasonable, attainable performance goals and analyze trends from one year to the next, •Establish targets that make sense and evaluate the accuracy of forecasts, and •Perform competitive analysis that leads to fast, meaningful improvement.•
By comparing their organizations’ performance against measures like those found in our study, retail executives can get help in making fast, effective decisions based on relevant, objective information — not anecdotal experi-ence or estimates. The answer isn’t always to be lowest cost in every area; rather, the goal should be to find the position that makes the most sense for the organization’s overall business strategy. Hence, cost-reduction initiatives should not necessarily be aimed at reaching the low-cost performer level across all functions. Organizations should determine what percentage is achievable and what tactics could potentially reduce the opportunity gap.
Of course, some reduction initiatives are tactical and immediate; others are strategic and long-term. Cost reduc-tions should reflect a balance of short-, mid- and long-term objectives so executives can effectively lead their companies forward during challenging business cycles.

9
Approach and methodology
Taxonomy
This report is the result of a Deloitte Global Benchmarking Center study of store operations, general and admin-istrative process performance. We gathered fiscal-year 2008 data across 40 process categories in eight functions. By following a strict taxonomy, the researchers generated apples-to-apples comparisons necessary for meaningful performance measures:
StoreOperations
MerchandisingSupply Chain Management
Marketing
Manage store-level •inventory
Merchandise and sell •goods
Manage and plan store •operations
Manage customer •services
Manage and plan store •real estate
Merchandise buying, •vendor management, and category performance
Plan, allocate and replenish •merchandise
Develop and manage •pricing strategies
Manage store presentation •(planogramming and layout)
Develop and source private •label
Warehousing •management
Merchandise distribution•
Transportation •management
Manage supply chain •performance
Advertising•
Promotions and events•
Develop visual •merchandising
Manage customer •research
Information Technology
FinanceHuman
ResourcesSupport Services
Application development •and management
Controls and risk •management
Infrastructure technology •management
Planning, strategy and •services
Transaction processing•
General accounting/•financial reporting
Controls•
Tax and treasury•
Performance management•
Transaction processing•
Rewards administration•
Talent management•
Strategy and program •design
Aviation•
Communications services•
Environmental health and •safety
Executive office•
Legal•
Mergers and acquisitions•
Non-merchandise •procurement
Strategic planning•
Travel management•

SGA book of metrics for retail 10
Key definitions and methodology
Data normalized by:Sales • for store operations, merchandising, supply chain, marketing, finance, support servicesEnd-users• for information technologyEmployees• for human resources
Driver analysis:Examined select drivers in highest cost categories to •identify what factors impact them the most
Peer groups:Retail overall (all participants of study)•Apparel subsector•Other/Specialty subsector (retailers offering a specific •product type, such as toys or sporting goods)Private label peer group (participants with a high •percentage of sales from private label products; the median, or midpoint value, of “private label sales as a percent of total sales” is 98% for this peer group)Non-private label peer group•
Low-cost performers: Participating companies in the first quartile of the eight functions*
Median: Midpoint value of participants
Total SGA cost at the companies in the study: Labor: Fully loaded labor cost (compensation and •benefits) of employees, contractors and temporariesOutsourcing: Services provided by third-party vendors•Technology: Hardware, software, license fees, and •the related supportOther: Facilities, supplies, travel, training •
Process cost: Cost of labor plus outsourcing at the companies in the study
*Low-cost performers are not necessarily “best in class” along other meaningful dimensions, such as quality, innovation, or customer/employee satisfaction. The benchmarks in this study suggest possible cost-reduction opportunities, which must be balanced against growth strategies.
All study data and statistics referenced and presented in this report, as well as the representations made and opinions expressed, unless specifically described otherwise, pertain only to the participating organizations and their responses to the Deloitte Global Benchmarking Center study of retail process performance conducted in 2009.
3-year revenue CAGR
Total sales
Other/SpecialtyApparel
Gross margin
Employees
Stores
Min 1st Quartile Median 3rd Quartile Max
Retail banners
Average squarefootage per store
$59M $46.8B$2.6B$1.3B $7.0B
14 6,351689352 1,196
1 2021 4
-8.4% 26.2%2.1%-0.1% 11.0%
511 324,00019,5526,925 43,328
34%23% 27% 44% 67%
3,126 129,00011,8224,531 38,779
Profile of participants

11
Performance measures
The following is a list of sample metrics available to participants:
Demographics
Total sales
Three-year revenue CAGR
Employees
End-users
Domestic sales as % of total sales
Gross margin %
Number of retail banners
Number of stores
Average square footage per store
Baseline
Total SGA cost distribution by cost component
Total SGA cost distribution by function
Total SGA staff distribution by function
Executive summary
Total SGA cost as a percent of sales by function
Total SGA cost gap to low-cost performer by function
Eight largest cost gaps across all cost categories
Cost as a percent of total SGA cost
Total process cost as a percent of sales
Staff per $1B in sales by function
Store operations
Store operations cost as a % of sales (labor, outsourcing, technology, other)
Store operations cost allocation (labor, outsourcing, technology, other)
Store management cost allocation
Process category cost as % of sales
Store operations process category cost allocation
Total store operations FTEs per $1B revenue
Store operations fully loaded labor rate
Store operations total cost per store operations staff
Store operations total cost per store
Occupancy cost per store
Store operations process cost per store
Sales per sq ft selling space
Store operations cost per sq ft selling space
Sales per labor hour (SPLH)
Store associate turnover %
Inventory shrink %
Total shopper returns as % of total sales
Loss prevention process cost as a percent of sales
Merchandising
Merchandising cost as a % of sales (labor, outsourcing, technology, other)
Merchandising cost allocation (labor, outsourcing, technology, other)
Process category cost as % of sales
Merchandising process category cost allocation
Total merchandising FTEs per $1B revenue
Merchandising fully loaded labor rate
Sales per buyer
Average number of SKUs managed per buyer
Number active vendors
Number of purchase orders generated
% goods sourced domestically
Private label sales as % of total sales
% direct sales (online, catalog, phone) as % of total sales
% sales promoted
% sales on markdown
Supply chain
Supply chain cost as a % of sales (labor, outsourcing, technology, other)
Supply chain cost allocation (labor, outsourcing, technology, other)
Process category cost as % of sales
Supply chain process category cost allocation
Total supply chain FTEs per $1B revenue
Supply chain fully loaded labor rate
Inventory turns
Cartons picked per labor hour (pick function only)
% merchandise returns to warehouse
Vendor compliance offset $ as % of total revenue
Transportation cost per inbound carton
Transportation cost per outbound carton
Import order cycle time days
Import shipments routed via airfreight as % of total shipments
SGA book of metrics for retail 12
Marketing
Marketing cost as a % of sales (labor, outsourcing, technology, other)
Marketing cost allocation (labor, outsourcing, technology, other)
Process category cost as % of sales
Marketing process category cost allocation
Total marketing FTEs per $1B revenue
Marketing fully loaded labor rate
Advertising spend allocation
Customer loyalty spend as % of total sales
Information technology
Information technology cost as a % of sales (labor, outsourcing, technology, other)
Total IT FTE per $1B revenue
Total IT cost as a % of sales (net)
Total IT cost per end-user (labor, outsourcing, technology, other)
Total IT cost allocation (labor, outsourcing, tech-nology, other)
IT process category cost per end-user
IT process cost (labor, outsourcing) cost allocation
IT FTEs per 1000 end-user
IT fully loaded labor rate
Finance
Finance cost as a % of sales (labor, outsourcing, technology, other)
Finance cost allocation (labor, outsourcing, technology, other)
Finance process category cost as % of sales
Finance process category cost allocation
Total finance FTEs per $1B revenue
Total finance FTEs per company sales
Finance fully loaded labor rate
Cycle time - Number of business days from cut-off of first sub-ledger to GAAP general ledger close
# days payable outstanding (DPO)
Human resources
HR cost as a % of sales (labor, outsourcing, technology, other)
Total HR FTE per $1B revenue
Total HR cost per employee
HR cost allocation (labor, outsourcing, technology, other)
HR process category cost per employee
HR process category cost allocation
HR FTEs per 1000 employees
HR function fully loaded labor rate
Support services
Support services cost as a % of sales (labor, outsourcing, technology, other)
Support services cost allocation (labor, outsourcing, technology, other)
Support services process category cost as a % of sales
Support services process category cost allocation
Total support services FTE per $1B revenue
Support services function fully loaded labor rate

13
Representative participant list
Abercrombie & Fitch Co.•Academy Sports & Outdoors, Ltd.•Advance Auto Parts, Inc.•Aeropostale, Inc.•AnnTaylor Stores Corporation•Army and Air Force Exchange Service•Beall’s, Inc.•Best Buy Co., Inc.•Burlington Coat Factory Warehouse Corp•Canadian Tire Corporation, Limited•Carrefour SA•C.I. Hermeco Corporation•Coldwater Creek, Inc.•Cost Plus, Inc.•Decathlon SA •Dick’s Sporting Goods, Inc.•The Dress Barn, Inc.•The Finish Line, Inc.•Food Lion, LLC•Foot Locker, Inc.•The Gap, Inc.•Groupe ADEO (France)•Guess?, Inc.•The Gymboree Corporation•Harris Teeter, Inc.•
Additional participant categorization
Private label, 41%
Non-privatelabel, 35%
hhgregg, Inc.•Jos. A. Bank Clothiers, Inc.•Kibe•Kmart Corporation (Sears)•Limited Brands, Inc.•The Liquor Control Board of Ontario•Maurices Inc.•The Men’s Wearhouse, Inc.•Navy Exchange Service Command•Nordstrom, Inc.•Office Depot, Inc.•Pacific Sunwear of California, Inc.•Payless ShoeSource•PETCO Animal Supplies, Inc.•Sears Holdings Corporation•
Sears Canada, Inc. -Sears Domestic, Inc. -Lands’ End, Inc. -
Sephora USA, Inc.•Shoe Carnival, Inc.•The Sports Authority, Inc.•Toys “R” Us Holdings, Inc•The Wet Seal, Inc.•Williams-Sonoma, Inc.•The Yankee Candle Company, Inc. •
Participants by industry subsector
Apparel, 41%
Other/Specialty,35%
Other subsectors,24%

SGA book of metrics for retail 14
About the Global Benchmarking Center
Deloitte’s Global Benchmarking Center (GBC) was established to provide executives with industry-relevant metrics and insight. The GBC delivers this information through annual benchmark studies in areas such as sales, general and administrative (SG&A), finance and accounting, supply chain, information technology, human resources, and operations. The GBC has conducted studies in more than 600 global organizations since 2005. These studies are uniquely designed to provide industry-specific insight relevant to multiple functions.
Financial Services•Banking -Securities -Insurance -
Life Sciences and Health Care•Health Care Provider -Life Sciences -Health Plan -
Public Sector•Federal -State -Local -
Technology, Media and Telco•Media -Telecommunications -High Technology -
Consumer and Industrial Products•Aerospace and Defense -Automotive -Process & Industrial Products -Consumer Products -
Retail•Apparel -Other/Specialty -Private Label -Tourism, Hospitality and -Leisure
Energy and Resources•Oil and Gas -Mining -Power and Utilities -Water and Waste -Management
Industry
Store Operations•
Merchandising•
Supply Chain•
Marketing•
Information Technology•
Finance•
Human Resources•
Support Services•
Retail Functions

15

AuthorsRichard T. RothPrincipalNational Benchmarking Practice LeaderDeloitte Consulting LLPAtlanta, GA+1 404 942 [email protected]
Rod SidesPrincipal Retail Operations Excellence LeaderDeloitte Consulting LLPCharlotte, NC+1 704 887 [email protected]
ContributorsMark E. DanielGlobal Benchmarking CenterDeloitte Consulting LLPAtlanta, GA+1 404 631 [email protected]
Jean-Michel FallySenior ManagerDeloitte Consulting LLPIrving, TX+1 469 417 [email protected]
Andrew SimpsonGlobal Benchmarking CenterDeloitte Consulting LLPMcLean, VA+1 703 251 [email protected]
Participation in this study is open to all retailers. For information, visit www.deloitte.com/us/SGA4Retail, or contact:
Global Benchmarking CenterDeloitte Consulting LLP+1 866 897 [email protected]
To learn more about our Retail practice, visit us online at www.deloitte.com/us/Retail. Here you can access our complimentary Dbriefs webcast series, Deloitte Insights podcast program, innovative and practical industry research, and a lot more about the issues facing retailers from some of the industry’s most experienced minds.
Stacy JaniakVice Chairman & U.S. Retail LeaderDeloitte LLPTel: +1 312 486 [email protected]
John SchefflerPartner & U.S. Assurance Leader, RetailDeloitte & Touche LLPTel: +1 415 783 [email protected]
John RooneyPrincipal & U.S. Consulting Leader, RetailDeloitte Consulting LLPTel: +1 215 446 [email protected]
Lawrence HutterPartner, Deloitte UK & Global Consumer Business &Transportation Industry LeaderDeloitte Touche TohmatsuTel: +44 20 7303 [email protected]
Nancy WertheimPartner & U.S. Tax Leader, RetailDeloitte Tax LLPTel: +1 617 437 [email protected]
Sandra ViolaDirector of MarketingDeloitte Services LPTel: +1 212 436 [email protected]
For information about Deloitte LLP’s Retail services, contact:

This publication contains general information only and is based on the experiences and research of Deloitte practitioners. Deloitte is not, by means of this publication, rendering business, financial, investment, or other professional advice or services. This publication is not a substitute for such professional advice or services, nor should it be used as a basis for any decision or action that may affect your business. Before making any decision or taking any action that may affect your business, you should consult a qualified professional advisor. Deloitte, its affiliates, and related entities shall not be responsible for any loss sustained by any person who relies on this publication.
Copyright © 2010 Deloitte Development LLC. All rights reserved.Member of Deloitte Touche Tohmatsu