U.S. LCI Database Project User’s Guide · Section 3, The EcoSpold Format, gives an overview...
21
3/4/04 U.S. LCI Database Project – User’s Guide D R A F T February 2004 • NREL/BK-35854 National Renewable Energy Laboratory, USA Athena Sustainable Materials Institute, Canada Franklin Associates, Ltd., USA Sylvatica, USA National Renewable Energy Laboratory 1617 Cole Boulevard Golden, Colorado 80401-3393 NREL is a U.S. Department of Energy Laboratory Operated by Midwest Research Institute • Battelle Contract No. DE-AC36-99-GO10337
Transcript of U.S. LCI Database Project User’s Guide · Section 3, The EcoSpold Format, gives an overview...
3/4/04
U.S. LCI Database Project – User’s Guide
D R A F T
February 2004 • NREL/BK-35854
National Renewable Energy Laboratory, USA Athena Sustainable Materials Institute, Canada Franklin Associates, Ltd., USA Sylvatica, USA
National Renewable Energy Laboratory 1617 Cole Boulevard Golden, Colorado 80401-3393 NREL is a U.S. Department of Energy Laboratory Operated by Midwest Research Institute • Battelle
Contract No. DE-AC36-99-GO10337
NOTICE This report was prepared as an account of work sponsored by an agency of the United States government. Neither the United States government nor any agency thereof, nor any of their employees, makes any warranty, express or implied, or assumes any legal liability or responsibility for the accuracy, completeness, or usefulness of any information, apparatus, product, or process disclosed, or represents that its use would not infringe privately owned rights. Reference herein to any specific commercial product, process, or service by trade name, trademark, manufacturer, or otherwise does not necessarily constitute or imply its endorsement, recommendation, or favoring by the United States government or any agency thereof. The views and opinions of authors expressed herein do not necessarily state or reflect those of the United States government or any agency thereof.
Available electronically at http://www.osti.gov/bridge
Available for a processing fee to U.S. Department of Energy and its contractors, in paper, from:
U.S. Department of Energy Office of Scientific and Technical Information P.O. Box 62 Oak Ridge, TN 37831-0062 phone: 865.576.8401 fax: 865.576.5728 email: [email protected]
Available for sale to the public, in paper, from:
U.S. Department of Commerce National Technical Information Service 5285 Port Royal Road Springfield, VA 22161 phone: 800.553.6847 fax: 703.605.6900 email: [email protected] online ordering: http://www.ntis.gov/ordering.htm
Printed on paper containing at least 50% wastepaper, including 20% postconsumer waste
3/4/04

Contents 1 INTRODUCTION .................................................................................................................. 1
1.1 Background ..................................................................................................................... 1 1.2 Anticipated data users and uses ...................................................................................... 1 1.3 Data Providers................................................................................................................. 2 1.4 Organization of this Guide.............................................................................................. 2
2 UNDERSTANDING DATA MODULES.............................................................................. 2
2.1 Basic module description................................................................................................ 2 2.2 Using data modules......................................................................................................... 3 2.3 Aggregation..................................................................................................................... 5 2.4 Co-Product Allocation .................................................................................................... 5 2.5 Critical review................................................................................................................. 6
3 THE ECOSPOLD FORMAT ................................................................................................. 7
3.1 Background ..................................................................................................................... 7 3.2 Spreadsheet Overview .................................................................................................... 8
4 VIEWING AND ACCESSING DATA.................................................................................. 9
5 PROVIDING DATA ............................................................................................................ 11
5.1 Basic Data Documentation ........................................................................................... 11 5.2 Using the Streamlined EcoSpold Format...................................................................... 12
5.2.1 General Spreadsheet Features .............................................................................................. 12 5.2.2 The Process Info, Source Info, and Person Info Sheets ........................................................ 13 5.2.3 The Flow Info Sheet .............................................................................................................. 14 5.2.4 Uncertainty Information........................................................................................................ 17
3/4/04

U.S. LCI Database Project User’s Guide
DRAFT 1 Introduction
1.1 Background The U.S. LCI Database Project is a public/private research partnership to develop a publicly available life cycle inventory (LCI) database for commonly used materials, products, and processes. The database provides LCI data to support public, private, and non-profit sector efforts to develop product life cycle assessments and environmentally oriented support systems and tools.
The project was conceived in response to the lack of available transparent LCI data in North America. Until now, LCI databases in the U.S. have had restricted access or data that was not verifiable. The objective of the U.S. LCI Database Project is to provide LCI data that follows a single protocol consistent with international standards, and therefore allows users to objectively review and compare data based on similar data collection and analysis methods.
The U.S. LCI Database Project is a three-phased effort that began in May 2001with an intensive initiation and planning phase. Phase II involves an initial two-year period of basic data collection, analysis, and review. Phase III will include long-term data dissemination, database expansion, and maintenance.
There were several key outcomes in Phase I based on the work of an advisory group and consultant team, including data development guidelines and a Phase II work program, which set research priorities for Phase II. Both the Final Phase I Version of the Data Development Guidelines and the Final Phase I Report are available for viewing or downloading from http://www.nrel.gov/lci/planning_progress.html. Quarterly progress reports that provide up to date information about Phase II of the project can also be viewed or downloaded from the same link.
1.2 Anticipated data users and uses The LCI data is provided in the form of modules that quantify the environmental burdens of common unit processes. The modules can be readily accessed, combined, and augmented by users to develop more complex LCIs or a full life cycle assessment (LCA). The database does not contain complete product LCIs or LCAs that would enable comparison; rather, it contains the building blocks to create such LCIs and LCAs. To facilitate the creation full product LCIs or LCAs, the data format has been specifically selected to ensure compatibility with the major LCA software tools, as explained in Section 3.1
This modular approach supports the underlying intentions of the U.S. LCI Database Project, which are to facilitate the development of environmentally-oriented decision support systems and tools, to further the potential for realistic product assessment and labeling systems, and to
support the work of manufacturers and researchers undertaking specific product or process LCAs. Further details about data modules are provided in Section 2.
In light of both the project intent and the type of LCI data included in the database, it is important to note the difference between the concept of publicly available data and the idea of data for use by the general public. Although the LCI data in the database is publicly available, it is not intended for use by the general public in the way that full product LCAs might be used. There is an assumed level of knowledge on the part of the anticipated user and the database is intended for LCA practitioners or others with LCA experience.
1.3 Data Providers This guide provides important information for those wishing to submit data to the U.S. LCI Database. This information includes descriptions of the required documents and detailed instructions on how to enter data into the templates.
1.4 Organization of this Guide The remainder of this user’s guide is structured as follows:
Section 2, Understanding Data Modules, describes the concept of data modules, including how they may be interrelated and can be used together, as well as some cautions regarding use of the modules.
Section 3, The EcoSpold Format, gives an overview description of the Streamlined EcoSpold data format developed for the U.S. LCI Database Project.
Section 4, Viewing and Accessing Data, explains the organization of the database and provides instructions for viewing and downloading the various data sheets and reports.
Section 5, Providing Data, outlines the basic data documentation required for submission of data and detailed instructions on how to navigate and enter data into the template spreadsheet in the Streamlined EcoSpold data format.
2 Understanding Data Modules
2.1 Basic module description The database is composed of LCI data modules, which contain the following specific information about the environmental burdens of a common unit process: extractions from and releases to nature, inputs from other processes (known as the technosphere), and the product output(s) of the process being examined. Figure 1 provides a basic overview of the data module concept.
3/4/04
2
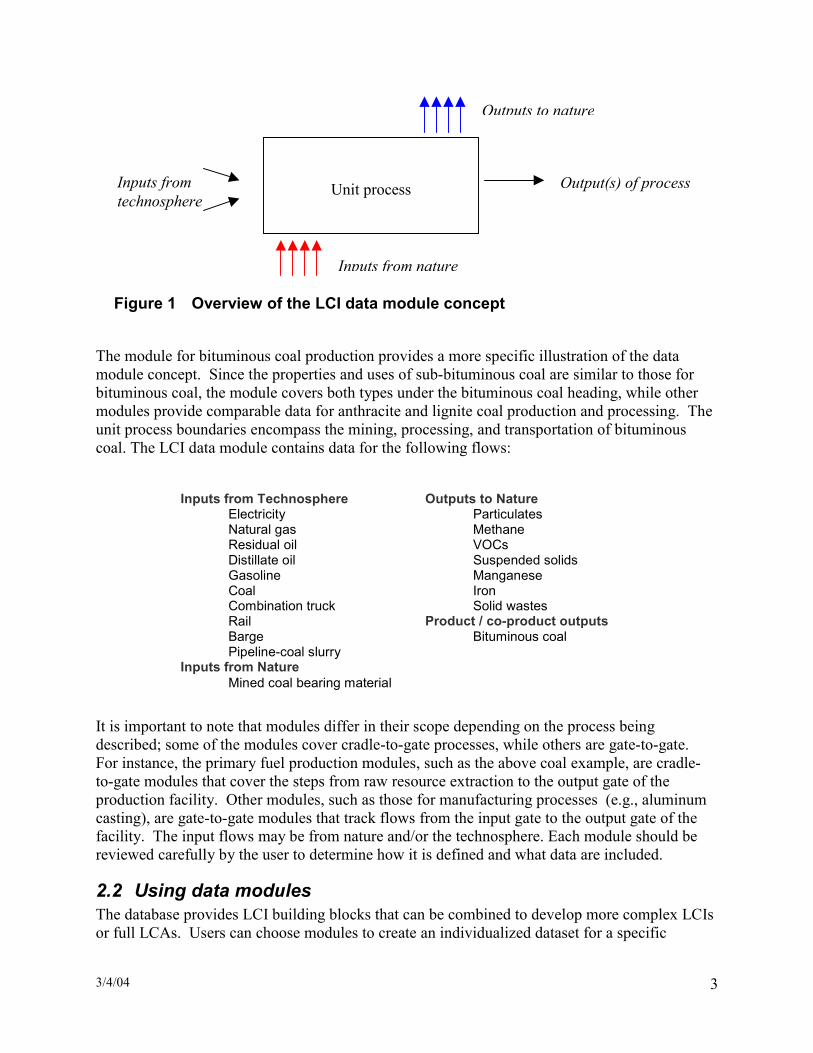
Unit process Output(s) of process
Inputs from nature
Outputs to nature
Inputs from technosphere
Figure 1 Overview of the LCI data module concept
The module for bituminous coal production provides a more specific illustration of the data module concept. Since the properties and uses of sub-bituminous coal are similar to those for bituminous coal, the module covers both types under the bituminous coal heading, while other modules provide comparable data for anthracite and lignite coal production and processing. The unit process boundaries encompass the mining, processing, and transportation of bituminous coal. The LCI data module contains data for the following flows:
Inputs from Technosphere Outputs to Nature Electricity Particulates Natural gas Methane Residual oil VOCs Distillate oil Suspended solids Gasoline Manganese Coal Iron Combination truck Solid wastes Rail Product / co-product outputs Barge Bituminous coal Pipeline-coal slurry Inputs from Nature Mined coal bearing material
It is important to note that modules differ in their scope depending on the process being described; some of the modules cover cradle-to-gate processes, while others are gate-to-gate. For instance, the primary fuel production modules, such as the above coal example, are cradle-to-gate modules that cover the steps from raw resource extraction to the output gate of the production facility. Other modules, such as those for manufacturing processes (e.g., aluminum casting), are gate-to-gate modules that track flows from the input gate to the output gate of the facility. The input flows may be from nature and/or the technosphere. Each module should be reviewed carefully by the user to determine how it is defined and what data are included.
2.2 Using data modules The database provides LCI building blocks that can be combined to develop more complex LCIs or full LCAs. Users can choose modules to create an individualized dataset for a specific
3/4/04
3

product or process, although they may have to add data to reflect unique aspects of the product or process under study. For example, users developing an LCA for a consumer product can draw on database modules for energy production and use, transportation, the production of basic inputs from the technosphere, etc. However, users will then have to add data for specific in-plant processes, use phase flows, and end-of-life flows. In some cases, it will be possible to combine existing database modules to construct complete cradle-to-gate systems up to some pre-defined level of production. In fact, in some cases the database offers the option of selecting an already aggregated (or ‘rolled up’) system of multiple, interconnected unit processes. Again, it must be emphasized that the data modules only provide inventory information, without any characterization or normalization of flows.
Figure 2, below, illustrates the concept of modules as building blocks. Along the left side of the figure are a series of modules typical of those included or planned for inclusion in the database. As illustrated by the connecting arrows, a module for quarrying could draw on the trucking module for data regarding the related energy use and emissions. Similarly, a module for scrap steel processing could draw on the trucking and electricity generation modules. In each of these cases, the module in question need only specify the amount of electricity or trucking required.
In the case of the bituminous coal production example, the inputs from the technosphere include various energy forms and types of transportation. The LCI for coal production provides data on the amounts of each input (e.g., ton-miles of truck transportation), while the relevant related database modules provide the full LCIs for those inputs (e.g., energy use and related combustion emissions per ton-mile of truck transportation).
A user developing an LCI for steel rebar production can draw on several of the basic modules as illustrated. If the database already includes a module for steel rebar production and another for cement manufacturing, then a user developing a concrete product LCI could draw on both of those modules.
CementManufacturing
Steel RebarProduction
Trucking
Quarrying
Electricitygeneration
Scrap steelprocessing
EnergyPre-combustion
Fly ash ConcreteProduction
Figure 2 Database module relationships
3/4/04
4
2.3 Aggregation The level of aggregation differs among modules within the database. Aggregation occurs for two basic reasons:
1. Modules have been aggregated within the database for the convenience of users; or
2. Data for a specific product or process has only been made available to the LCI Database at an aggregated level.
An example of the first kind of aggregation is the module for kiln dried softwood lumber from the Pacific Northwest. That module combines data from four process modules that are separately provided in the database — forest resources (forest management and harvesting), sawing, kiln drying, and planning — as well as data from the common energy production and transportation modules. A user can choose this rolled-up module or do their own aggregation using the individual unit process modules, with the choice depending on various factors. For example, the following may be important considerations in the softwood lumber case.
1. There are three separate modules available in the database for different levels of intensity of forest management, and the rolled up lumber module uses a weighted average of the three. A user may prefer to develop a softwood lumber LCI for one specific management regime, in which case the user would want to build up the LCI using the separate modules.
2. Rolled up modules will usually involve some degree of co-product allocation. For example, in the case of softwood lumber there is co-product allocation among lumber, pulp chips, and other co-products. A user may disagree with the allocation methods used and may therefore wish to work at the disaggregated level where allocation has not yet been applied (see Section 2.4).
Users must be especially cautious when data has been provided to the database in an aggregated form, which is the second reason for aggregation noted at the beginning of this subsection. In such cases, the data documentation will clearly indicate whether there is co-product allocation involved and if so, how the allocation has been done. However, users are unlikely to be able to modify the data to reflect application of a different allocation method.
The documentation will also indicate whether the aggregated data draws on the common energy pre-combustion, combustion, and transportation modules from the U.S. LCI Database. This may not always be the case for older LCI datasets developed prior to common process modules being made available. Over time, that problem will be of less concern as data developers draw on the available modules and as older datasets are revised.
2.4 Co-Product Allocation There are instances when a unit process produces multiple product outputs, or co-products. In such cases, only a portion of the input and output flows are attributable to each product. In Figure 3, all of the inputs from nature and the technosphere, and all of the outputs to nature have to be allocated to products A and B. Properly allocating flows in these situations is a significant concern in LCI data development since different allocation methods can lead to quite different LCI results for any given product or process. Although the U.S. LCI Database Project adheres to the ISO 14041 three-step hierarchy for co-product allocation as detailed in Section 14 of the Data Development Guidelines (http://www.nrel.gov/lci/planning_progress.html), this is a contentious
3/4/04
5

aspect of LCI practice and every effort has therefore been made to provide unallocated modules. This will allow users to apply allocation methods as they see fit or to undertake sensitivity analysis for different methods.
Inputs from technosphere
Product A Product B
Inputs from nature
Outputs to nature
Unit process
Figure 3 Data module with co-products
2.5 Critical review As the agency responsible for the U.S. LCI Database, NREL has adopted the following two-step critical review process.
Step 1 — This step involves routine internal review of submitted data modules by NREL, with specific regard for the following:
• adherence to the U.S. LCI Database Project Data Development Guidelines;
• plausibility of the data, including comparisons with published data when feasible;
• apparent completeness in terms of elementary and intermediate flows; and
• mathematical correctness.
Step 2 — This step involves submission of a data module to an appropriately constituted external review panel. Step 2 will typically be taken only if one or both of the following events have occurred:
1. the internal review revealed significant unexplained or unjustified departures from the Data Development Guidelines, discrepancies, significant differences compared to other published sources, or any other factors that, in the judgment of the internal reviewer(s), made the data suspect; and/or
2. a third party (e.g., a data user, relevant manufacturer, other data providers) challenged a given data module and provided sufficient evidence or argument to cast reasonable doubt on its validity.
The level of Step 1 internal review, and the need for a Step 2 external review, will be dictated in part by the existence of any prior reviews commissioned by data providers, assuming that the relevant review report is submitted with the data and that NREL is satisfied with regard to the credentials and impartiality of the reviewers.
The above critical review approach reflects basic realities of the LCI field.
3/4/04
6

• In practice, it is very difficult for reviewers to either validate or challenge specific numbers unless they have done, or have access to, a comparable study.
• Other published sources are often not available for comparison purposes, especially for data modules of the kind being developed in the U.S. LCI Database Project.
• The act of making the data modules public is in many respects the most important element of a review process.
To facilitate casual external review, the database web site includes a mechanism for users to comment on, or challenge, specific data modules. Any such comments received after publication of a data module, and judged by NREL to be noteworthy, are added to the data module documentation.
3 The EcoSpold Format Data is provided to the U.S. LCI Database Project and can be accessed by users in a streamlined EcoSpold format. This format has been specifically designed to ensure that LCI data is available:
• with full transparency in terms of modeling approaches and data sources, • with ample documentation on quality and relevance to support informed use, and • in a format that maximizes ease of use with the full spectrum of LCA software tools and
other uses.
3.1 Background The data module format for the U.S. LCI Database Project is designed to serve three main purposes:
1. to provide a simple but complete way for data providers to fully specify the data and data documentation for unit processes and systems of interconnected unit processes,
2. to provide a simple way for casual data users to view data and documentation on unit processes and systems, and
3. to enable simple and complete importation of the data and documentation by LCA tool developers or by the users of such tools.
The data module format is a streamlined, or simplified, version of the EcoSpold spreadsheet format developed by and used in the Swiss EcoInvent project (www.ecoinvent.ch). The EcoInvent database is a significant new European LCA data source, and major LCA software tool developers are implementing EcoSpold import capability. The streamlining process consisted mainly of two types of simplification:
1. parameters that are not relevant in the context of the database were stripped away (e.g., German language process names, and data related to impact assessment methods); and
2. parameters which can readily be specified by a single, centralized party (e.g., NREL) were removed, including items like the ISO code for the region of interest, or the NAICS code for the process.
3/4/04
7

The streamlining was done to ease the reporting burden on data providers as much as possible while still maintaining the project’s ability to provide data fully compliant with the EcoSpold format. Other ancillary benefits of being consistent with EcoSpold include the following:
• the potential for interoperability between North American and European databases and
• providing added momentum or encouragement to other LCA database projects around the world to move towards consistent formatting and interoperability of data.
When data is provided in the streamlined format, NREL expands the data sheets into the full EcoSpold format, and users are offered the choice of format as explained in Part II of this guide.
3.2 Spreadsheet Overview The Streamlined EcoSpold Spreadsheet (hereafter referred to as simply “the spreadsheet”) has four worksheets for data input, a “HELP” sheet containing basic information for users, and a module information sheet that provides a one-page overview of the module. The contents of the four data input sheets are summarized in the table below.
Worksheet Name Information contained in worksheet Process Info Properties of the process data, for example:
• the region and time period • representativeness • sub-processes included • general comments • links to sources and people (detailed on the source and person
info sheets described below) Flow Info The basic life cycle inventory (LCI) data:
• flows into the process from nature and from other processes • flows out of the process to nature and to other processes
This sheet also allows for: • flow-specific comments • specification of uncertainty data for each flow
Source Info Bibliographic information for sources used to generate the unit process (“flow info”) data.
Person Info Basic contact information for the person(s) involved in preparing the data spreadsheet.
3/4/04
8

4 Viewing and Accessing Data The database has been organized so that users can readily browse the available data modules and then view or download modules at the desired level of detail. The intent is to make it as easy as possible for users to understand the exact nature of a module and assess its potential value before getting into the more detailed data sheets and downloading procedures.
The home page for the Project (www.nrel.gove/lci) provides access to all of the background documents noted in Section 1.1. Clicking on the database button opens a basic registration page where user’s are required to either register if a first-time user, or sign in using an already registered password. A user is then required to accept the Data User Disclaimer Agreement before proceeding to the module list, view and download page. Once on that page the user can view and select from the list of available data modules, and then proceed to view or download information at various levels of detail.
The documents available for viewing and downloading include the following:
Streamlined Spreadsheet Template The streamlined spreadsheet template document provides the format that data providers must use to submit data to the Life-Cycle Inventory Database Project (see Part III of this guide).
The streamlined spreadsheet template document is provided as a Microsoft Excel file that can be viewed or downloaded or for data submission to the Life-Cycle Inventory Database Project.
Module Info The module info document provides a high level overview of the selected data module.
The purpose is to provide key information for determining whether the selected module meets the user’s needs and if more detailed information is desired.
The module info document is provided as a PDF file that can be viewed or downloaded. Data Module Report The data module report expands on the module info document, providing flow diagrams where necessary, boundary and scope definitions, basic background or other information depending on the module. The purpose is to provide more information about the nature of a unit process, or set of processes, that can serve as an overview with explanatory material of the type typically included in a detailed LCA report. The report in combination with the module info sheets will give a more complete picture of the selected module.
The data module report document is provided as a PDF file that can be viewed or downloaded. Data Module Files Three data module files are provided for importing the selected data module into other tools. Users have the ability to select one of three formats - the streamlined spreadsheet, the EcoSpold spreadsheet and the EcoSpold XML.
Streamlined Spreadsheet
The streamlined spreadsheet has five worksheets for data input, plus a “HELP” sheet containing basic information for users.
3/4/04
9
The Module Info sheet contains the information in the Module Info document and is included in the streamlined spreadsheet for completeness.
The Process Info sheet contains Properties of the process data, for example: the region and time period, sub-processes included, general comments.
The Flow Info sheet contains the basic life cycle inventory (LCI) data including: flows into the process from nature and from other processes and flows out of the process to nature and to other processes.
The Source Info sheet contains bibliographic information for sources used to generate the flow info data.
The Person Info sheet contains contact information for the person(s) involved in preparing the data spreadsheet.
The streamlined spreadsheet document is provided as a Microsoft Excel file that can be downloaded or viewed for further analysis.
EcoSpold Spreadsheet
This Excel spreadsheet file is in the original EcoSpold spreadsheet format. In general, most users in North America will probably find this format less useful: titles are less intuitive; the explanatory comments are missing; and there are additional rows and columns of data that will not be of interest to most users (e.g., EcoSpold ID numbers of each data item, fields for the German names of flows and processes). Nevertheless, this format may still be useful to users familiar with the standard EcoSpold spreadsheet format, users in Europe, and users of software tools designed to import data in standard EcoSpold format.
The EcoSpold spreadsheet document is provided as a Microsoft Excel file that can be downloaded or viewed for further analysis.
EcoSpold XML XML formatted files are readable by a wide variety of software tools, including web browser software. To most users, this format will be less readable than the spreadsheet formats, because it lacks column structure, the division of data into the four separate worksheets, and the explanatory comments provided in the streamlined spreadsheet. This format will be of interest primarily to users of software tools that are designed to import data in EcoSpold XML format.
The EcoSpold XML document is provided as an XML text file that can be downloaded or viewed for further analysis.
Detailed Spreadsheet In addition to the three data module files described above, detailed spreadsheets are available. These Excel worksheets provide the ultimate level of database transparency for those interested in specific calculations and other research details. The detailed spreadsheet can be downloaded or viewed for further review of a selected data module.
3/4/04
10
5 Providing Data
5.1 Basic Data Documentation Those wishing to provide data to the U.S. LCI Database will be required to submit three documents.
1. A data submittal sheet containing essentially the same information as will be provided on the Module Info sheet (see Section 4). The submittal sheet should indicate clearly whether the data module has been critically reviewed and, if so, by whom and under what conditions. If the data has been critically reviewed, the review report should be appended to the submittal sheet. The submittal sheet should also highlight cautions with regard to aggregation, allocation, or any other aspect that should be noted by a user of the data. A data submittal sheet template can be downloaded from the Resource Page of the web site. [To be developed when User’s Guide finalized]
2. The completed streamlined EcoSpold spreadsheets (see Section 5.2).
3. Detailed worksheet(s) to provide full transparency with regard to specific values and related references, calculations, assumptions, and other details underlying the LCI. We suggest that data providers generally follow the pattern set out in the example worksheet for bituminous coal provided on the Resources Page of the web site. However, unlike the EcoSpold sheets, the requirements for the detailed worksheets are not rigid. The key is to provide the level of detail necessary to reviewers and data users to follow and understand the data trail and calculations. The guiding principle is as stated in the Project Data Development Guidelines (http://www.nrel.gov/lci/planning_progress.html):
". . . develop and publish LCI data in a form that provides enough information about the nature and sources of the data so that users and third parties can do the following for each data item:
• know the source(s) and age of the data;
• know how well the data represents an industry or process;
• understand how the underlying calculations were made;
• evaluate the appropriateness of the data for the user’s intended application;
• validate the results through testing and cross-checking of data and modeling; and, ultimately,
• make an informed determination concerning the extent to which they can rely on the data and conclusions drawn from it."
4. The data module report, which expands on the module info document, providing flow diagrams where necessary, boundary and scope definitions, basic background or other information depending on the module. The purpose is to provide more information about the nature of a unit process, or set of processes, that can serve as an overview with explanatory material of the type typically included in a detailed LCA report. An example is provided for bituminous coal on the Resource Page of the web site.
3/4/04
11

5.2 Using the Streamlined EcoSpold Format If you have not already done so, please review the basic overview of the EcoSpold spreadsheets in Sections 3.2 and 4.
5.2.1 General Spreadsheet Features Color Conventions
The cells in the spreadsheet are colored differently, to help indicate the uses of each cell.
Grey cells contain row and column header information, and are not to be edited by the user.
Blue cells do not contain data and are not to be edited by the users.
Tan cells are edited directly by the user, and their contents are used by other (yellow) cells in the workbook.
Yellow cells have their contents specified by the contents of tan cells. Yellow cells on the Flow Info page are not editable; instead, their content is fully specified by data on the Process Info page. Yellow cells on the Process Info page contain “pick lists” (see below) whose content come from tan cells on the Source Info and Person Info pages. For example, row 21 on the Process Info page allows a data provider to specify the person who completed the process data entry. The pick list will be empty until at least one person has been entered in a tan cell on the Person Info page.
Pick Lists
The spreadsheet makes extensive use of pick lists, or pop-up, pull-down menus. A pick list is indicated by the appearance of a little gray downward arrow icon to the right of the cell of interest, as shown in the figure below. When the user highlights (clicks in) a pick list cell, a pop-up box containing help text also appears.
Pick lists are used for two reasons:
• to simplify user input, by listing all possible options, and • to ensure use of consistent nomenclature.
The simplest way to enter data into a pick list cell is to click on the gray arrow icon at the right of the cell and select an element from the resulting menu. As another option, the user is allowed to type into a pick list cell, but upon hitting the Return or Enter keys, the spreadsheet will check to ensure that the typed text matches some element in the pick list. For example, a user is allowed to type in “kg” in the units cell illustrated in the figure above, since “kg” is a unit contained in the pick list. However, if the user tries to enter “horsepower”, an error message appears. Clicking on “Cancel” returns the cell to its last acceptable state. Click on “Retry”
3/4/04
12
allows the data provider to edit the typed contents. To use the pick list after receiving an error message, first delete the typed contents, and then click on the pick list menu icon.
As noted above, yellow shaded pick lists will be empty until at least some data has been entered into the corresponding tan shaded cells. For example, row 21 on the Process Info page allows you to specify the person who completed the process data entry, but the pick list will be empty until at least one person has been entered in a tan cell in row 2 of the Person Info page.
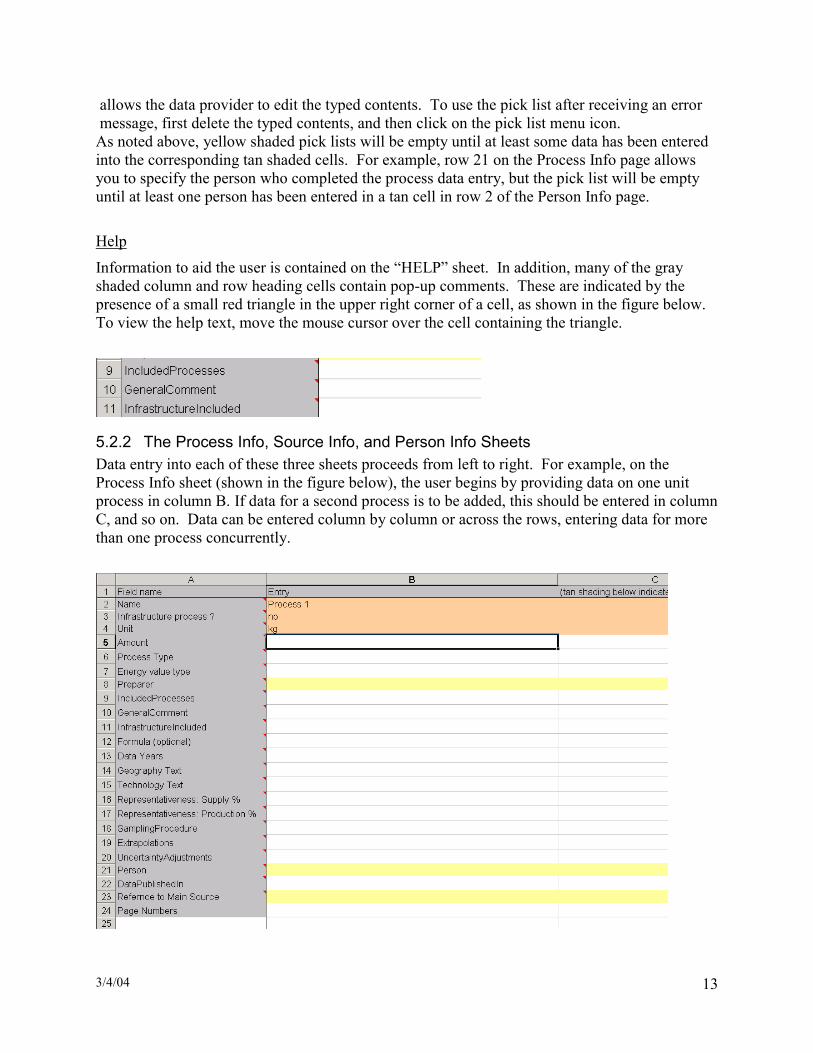
Help
Information to aid the user is contained on the “HELP” sheet. In addition, many of the gray shaded column and row heading cells contain pop-up comments. These are indicated by the presence of a small red triangle in the upper right corner of a cell, as shown in the figure below. To view the help text, move the mouse cursor over the cell containing the triangle.
5.2.2 The Process Info, Source Info, and Person Info Sheets Data entry into each of these three sheets proceeds from left to right. For example, on the Process Info sheet (shown in the figure below), the user begins by providing data on one unit process in column B. If data for a second process is to be added, this should be entered in column C, and so on. Data can be entered column by column or across the rows, entering data for more than one process concurrently.
3/4/04
13

5.2.3 The Flow Info Sheet Data entry for most of the sheets should be self-explanatory beyond the use of the information provided above, and the information provided by the pop-up help comments. However, the Flow Info sheet deserves additional explanation.
Four kinds of LCI data on flows are entered into the spreadsheet, two kinds of inputs and two kinds of outputs:
• Inputs from the Technosphere (from other processes) • Inputs from nature (generally these are raw material resources) • Outputs to nature (these are usually emission flows) • Product / co-product outputs (not to nature, but to other uses in the “technosphere”)
Flow names are entered in column B, as illustrated in the figure above.
Flows from and to nature are called “inventory flows” in LCA terminology. These flows are often later processed in a “life cycle impact assessment” (LCIA). LCIA methods in turn are increasingly able to make use of information concerning the location or other properties of the inventory flow. Partly for this reason, users need to specify Category and Sub-Category information for inventory flows, using columns C and D.
3/4/04
14

Important Note: First enter the names of processes in the Process Info sheet. Then, these process names, the units of the product output, and whether or not the process is an infrastructure process, will all be entered in yellow cells at the top of appropriate columns in the Flow Info sheet. Also, this procedure allows the spreadsheet to fill in the required additional data columns in the flow info sheet, for such aspects as uncertainty data, flow comments, etc. For inputs from nature, use the pick lists in column C to specify whether the input is water, a different natural resource, or “other”. For outputs to nature, use the pick lists in column C to specify whether the output is a release to air, water, waste management processes, or another destination. Then, depending on the Category choice made in column C, a number of sub-category choices are available in pick lists in Column D. The options associated with each type of inventory flow are listed in the table on the following page.
It is possible to choose from the pick list menus, or alternatively type entries in the Category and Sub-Category fields. If you have made any typing errors, or have left subcategory selections which are not options that validly correspond to the category selections, an error message will be generated when you click to move to a different worksheet, indicating a cell whose contents needs editing.
Note that blue shading indicates that category and subcategory data are not required for inputs from other processes (e.g., from the “technosphere”), nor for product and co-product outputs.
Column E allows you to specify whether the input from the technosphere represents an input from an infrastructure process or not. Column F allows you to specify the units of measurement for this flow. Note that units can, and generally will, vary from flow to flow, as illustrated in the figure below.
Columns G onward allow you to specify the actual life cycle inventory data for as many processes as are listed on the Process Info sheet. The process names, units, and whether or not they are infrastructure processes, are all contained in the non-editable yellow cells at the top of columns such as G. In the white cells of column G you enter the actual inventory flow values.
3/4/04
15

Flow Type Category Sub Category
Resource Biotic In air In ground In water Land
Water Lake Ocean Protected area River River, long-term Unspecified
Input from Nature
Other Unspecified To Air High population density
Low population density Low population density, long-term Protected area Stratosphere Unspecified
To Water Fossil Ground Ground, long-term Lake Ocean Protected area River River, long-term Unspecified
To Waste Management Building demolition Hazardous waste incineration Inert material landfill Land farming Municipal incineration Recycling Residual material landfill Sanitary landfill Underground deposit Wastewater treatment Others
Output to Nature
Other Unspecified
3/4/04
16
3/4/04
17
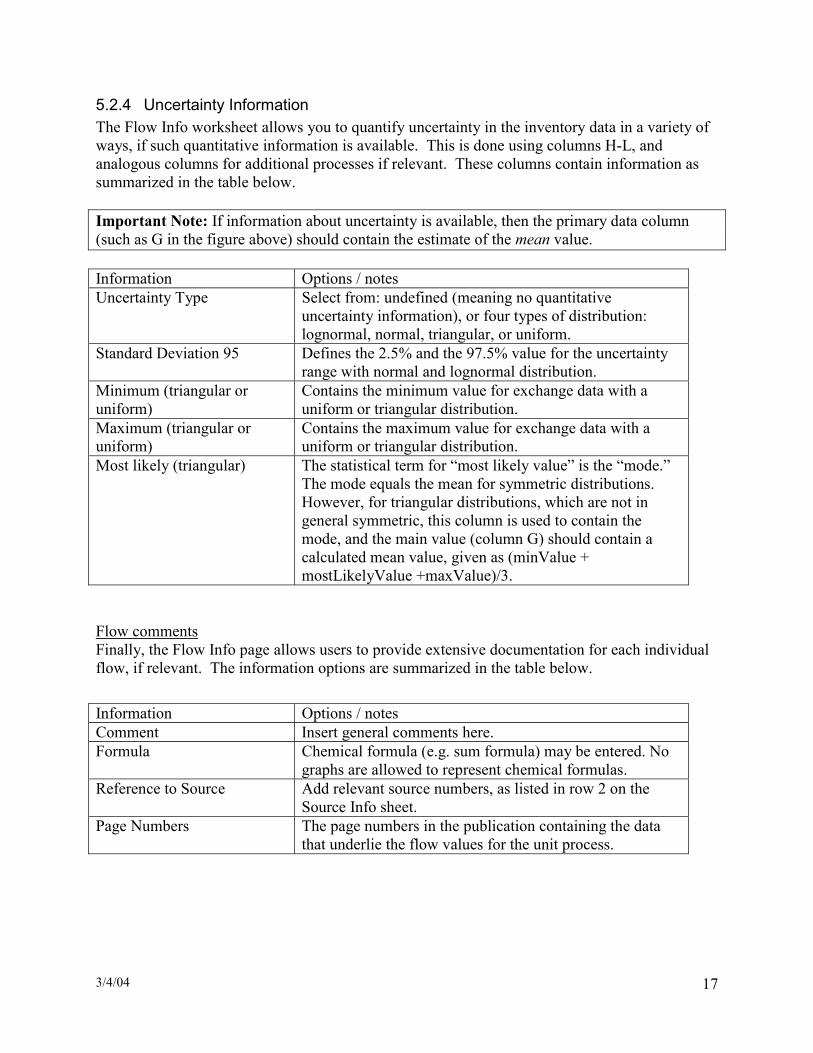
5.2.4 Uncertainty Information The Flow Info worksheet allows you to quantify uncertainty in the inventory data in a variety of ways, if such quantitative information is available. This is done using columns H-L, and analogous columns for additional processes if relevant. These columns contain information as summarized in the table below. Important Note: If information about uncertainty is available, then the primary data column (such as G in the figure above) should contain the estimate of the mean value. Information Options / notes Uncertainty Type Select from: undefined (meaning no quantitative
uncertainty information), or four types of distribution: lognormal, normal, triangular, or uniform.
Standard Deviation 95 Defines the 2.5% and the 97.5% value for the uncertainty range with normal and lognormal distribution.
Minimum (triangular or uniform)
Contains the minimum value for exchange data with a uniform or triangular distribution.
Maximum (triangular or uniform)
Contains the maximum value for exchange data with a uniform or triangular distribution.
Most likely (triangular) The statistical term for “most likely value” is the “mode.” The mode equals the mean for symmetric distributions. However, for triangular distributions, which are not in general symmetric, this column is used to contain the mode, and the main value (column G) should contain a calculated mean value, given as (minValue + mostLikelyValue +maxValue)/3.
Flow comments Finally, the Flow Info page allows users to provide extensive documentation for each individual flow, if relevant. The information options are summarized in the table below.
Information Options / notes Comment Insert general comments here. Formula Chemical formula (e.g. sum formula) may be entered. No
graphs are allowed to represent chemical formulas. Reference to Source Add relevant source numbers, as listed in row 2 on the
Source Info sheet. Page Numbers The page numbers in the publication containing the data
that underlie the flow values for the unit process.