
U.S. INTERNATIONAL TRADE COMMISSION. T SUJI “E CONOMICS OF P RECIOUS M ETALS ” J UNE 15, 2011...
38
U.S. INTERNATIONAL TRADE COMMISSION OFFICE OF INDUSTRIES SEMINAR SERIES A PRESENTATION BY KARL S. TSUJI “ECONOMICS OF PRECIOUS METALS” JUNE 15, 2011
Transcript of U.S. INTERNATIONAL TRADE COMMISSION. T SUJI “E CONOMICS OF P RECIOUS M ETALS ” J UNE 15, 2011...

U.S. INTERNATIONAL TRADE COMMISSION
OFFICE OF INDUSTRIES SEMINAR SERIES
A PRESENTATION BY KARL S. TSUJI
“ECONOMICS OF PRECIOUS METALS”
JUNE 15, 2011

What can economic theory tell us about
the price behavior of precious metals?
Karl Tsuji (L) receiving the 2011 Herbert C. Hoover Award from Lee Bray (R), the 2010-11 First Vice Chairman, at the SME-DC Section’s May 10, 2011, meeting in Washington DC
THIS PRESENTATION ADAPTED FROM A PREVIOUS ONE TO THE SME-DC SECTION

Mineral Economics
An interdisciplinary approach to economics applied to what can be dug out or pumped out of the ground:
• Economics • Finance • Engineering • Geosciences

U.S. International Trade Commission
• What the USITC is:
– Established by Congress in 1916 – An independent, quasi-judicial Federal agency – Impartial and non-partisan – Scope of trade-related mandates expanded over time
• What the USITC is not: – …not a court of law – …not a policy-making agency – …not a trade-negotiating agency

The three-fold mission of the USITC
• Administers U.S. trade-remedy laws within its mandate, including:
– Import injury investigations
– Intellectual property-based investigations
• Provides impartial advice to Congress & Executive Branch agencies on:
– Trade issues
– Industry competitiveness issues
• Maintains the U.S. Harmonized Tariff Schedule

USITC OFFICE OF INDUSTRIES
Natural Resources and Metals (NRM) Division
• My various minerals and metals assignments: • Certain steel mill products • Precious metals • Copper, lead, zinc, and molybdenum • Various base-metal products
• My various issues assignments: • Steel industries of Africa, the Middle East, and Indian
Subcontinent • Mining industries of Africa, the Middle East, and Indian
Subcontinent

U.S. International Trade Commission
• Also interested in current issues of: • Strategic raw-materials access and • Conflict minerals issues.
• Also analyze products beyond my officially assigned minerals and metals: • Cover for colleagues’ assigned minerals and metals. • Project assignments outside the NRM Division.
Hence, to a certain extent…
International Trade Analysts have to be
“Renaissance Men and Women”

A couple disclaimers…
• The views expressed in this presentation are solely those of the author and are not those of the Commission or of any of its Commissioners.
• This presentation is not intended as financial planning advice.

Financial Times, April 29, 2011, p. 22.

The Wall Street Journal, May 3, 2011, p. C2.

Precious Metals • Gold • Silver • Platinum-group Metals (PGMs):
– Platinum – Palladium – Rhodium – Iridium – Ruthenium – Osmium
Economic theory generally focuses on gold but is also applicable to silver and PGMs.

What makes precious metals “precious”? • Ostensibly their high unit values:
– Gold: $1,200 per troy ounce $31,747 per kilogram – Silver: $ 18 per troy ounce $ 470 per kilogram – Platinum: $1,600 per troy ounce $42,329 per kilogram – Palladium: $ 500 per troy ounce $13,228 per kilogram – Rhodium: $2,500 per troy ounce $66,139 per kilogram – Ruthenium: $ 198 per troy ounce $ 5,238 per kilogram – Iridium: $ 635 per troy ounce $16,799 per kilogram
• But some non-precious metals can also have high unit values: – Gallium: $ 670 per kilogram – Germanium: $ 940 per kilogram – Hafnium: $ 398 per kilogram – Indium: $ 550 per kilogram – Rhenium: $ 2,300 per kilogram – Scandium (oxide, 99.9% purity): $ 1,400 per kilogram – Tellurium: $ 210 per kilogram – Thallium: $ 5,930 per kilogram
Source: Compiled by the U.S. Geological Survey from Platts Metals Week.

Gold: Monthly average London-fix prices, January 2001 to April 2011
Source: Compiled from statistics of the World Gold Council.
0
200
400
600
800
1,000
1,200
1,400
1,600
2001 2002 2003 2004 2005 2006 2007 2008 2009 2010 2011
Nom
inal
U.S
. dol
lars
per
troy
oun
ce

Silver: Monthly average London-fix prices, January 2001 to March 2011
Source: Compiled from statistics of the Silver Institute.
0
5
10
15
20
25
30
35
40
2001 2002 2003 2004 2005 2006 2007 2008 2009 2010 2011
Nom
inal
U.S
. dol
lars
per
troy
oun
ce

Platinum-group metals: Monthly average Johnson Matthey producer prices, January 2001 to May 2011
Source: Compiled from statistics of Johnson Matthey.
0
2,000
4,000
6,000
8,000
10,000
2001 2002 2003 2004 2005 2006 2007 2008 2009 2010 2011
Nom
inal
U.S
. dol
lars
per
troy
oun
ce
Platinum Palladium Rhodium Iridium Ruthenium

Precious-metal distinctions • Distinguished by extent to which they’re held for:
• Financial security or • Anticipation of capital gains.
• A long history as a near-universally accepted: • Medium of exchange • Unit of account • Store of value:
• Official financial reserves— held by central banks and multilateral institutions.
• Investment items and financial instruments— traded by private and institutional investors.

Gold: global demand by end-use sectors, 2010
Source: Compiled from statistics of the World Gold Council.
Jewelry 54.0%
Electronics 7.5%
Other industrial 2.2%
Dentistry 1.3%
Cast & minted bars
18.7%
Official coins 5.4%
Medallions 2.0%
Investment funds 8.9%
Gold: global demand = 100.9 million troy ounces

Silver: global demand by end-use sectors, 2010
Source: Compiled from statistics of the Silver Institute.
Industrial 46.1%
Photography 6.9%
Jewelry 15.8%
Silverware 4.8%
Coins & medallions
9.6%
Implied net investment
16.8%
Silver: global demand = 1.1 billion troy ounces

Platinum and palladium: global demand by end-use sectors, 2010
Source: Compiled from statistics of Johnson Matthey.
Autocatalysts 39.5%
Chemicals 6.0% Electrical
3.0% Glass 4.8%
Investment items 5.8%
Jewelry 32.0%
Petroleum 2.3%
Medical & biomedical
3.4%
Other 3.3%
Platinum: global demand = 7.6 millon troy ounces
Autocatalysts 57.6%
Chemicals 4.3%
Dental 6.9%
Electronics 15.7%
Investment items 7.5%
Jewelry 7.0%
Other 0.9%
Palladium: global demand = 8.9 million troy ounces
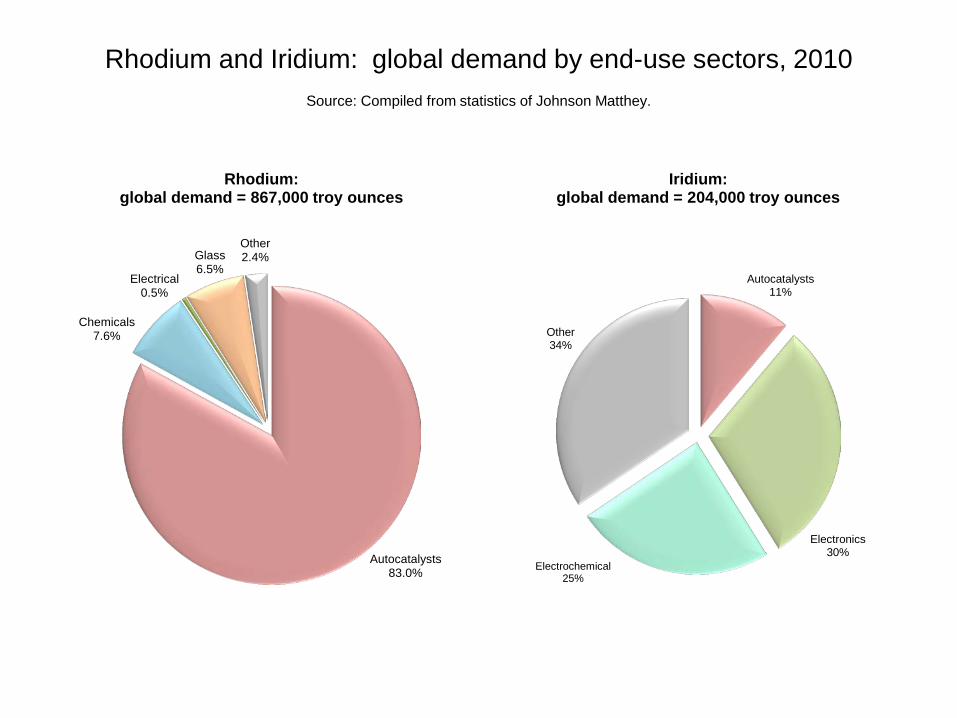
Rhodium and Iridium: global demand by end-use sectors, 2010
Source: Compiled from statistics of Johnson Matthey.
Autocatalysts 83.0%
Chemicals 7.6%
Electrical 0.5%
Glass 6.5%
Other 2.4%
Rhodium: global demand = 867,000 troy ounces
Autocatalysts 11%
Electronics 30%
Electrochemical 25%
Other 34%
Iridium: global demand = 204,000 troy ounces
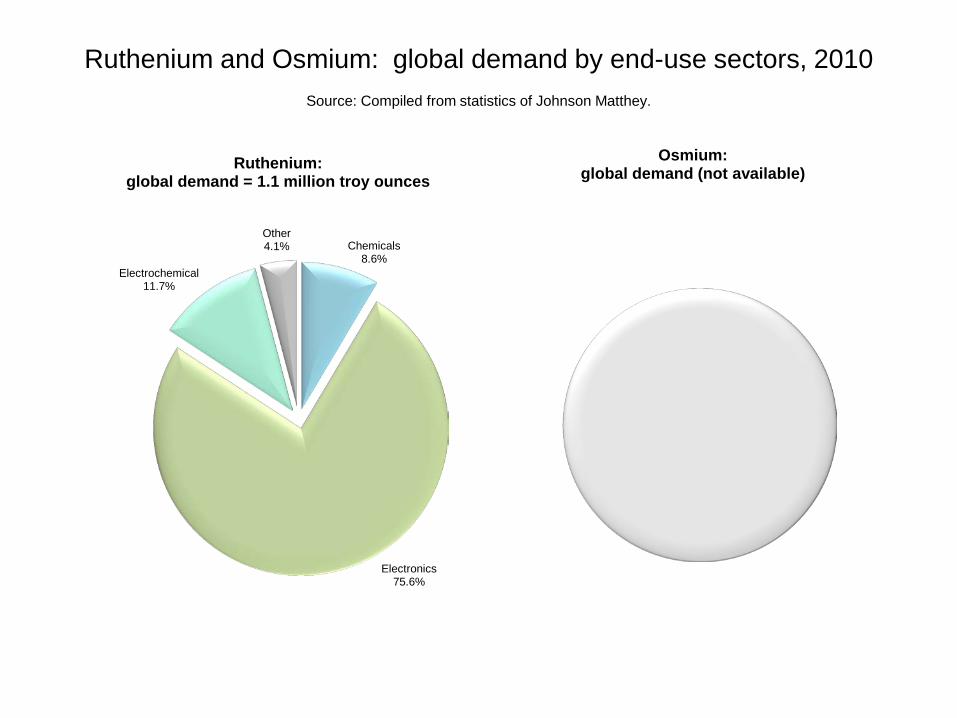
Ruthenium and Osmium: global demand by end-use sectors, 2010
Source: Compiled from statistics of Johnson Matthey.
Chemicals 8.6%
Electronics 75.6%
Electrochemical 11.7%
Other 4.1%
Ruthenium: global demand = 1.1 million troy ounces
Osmium: global demand (not available)

Reasons cited for holding gold and other precious metals:
• Asset diversification: • Official financial reserves • Private and institutional portfolios
• Inflation hedge • Currency hedge • Risk diversification Source: World Gold Council.

Investment forms of precious metals: • Investment items:
• Non-numismatic coins (e.g., the U.S. Eagle) • Cast and minted bars • Medallions • Precious jewelry (a traditional form)
• Financial instruments: – Precious-metal mining company stocks – Commodity futures and options markets – Commodity mutual funds – Exchange-traded funds
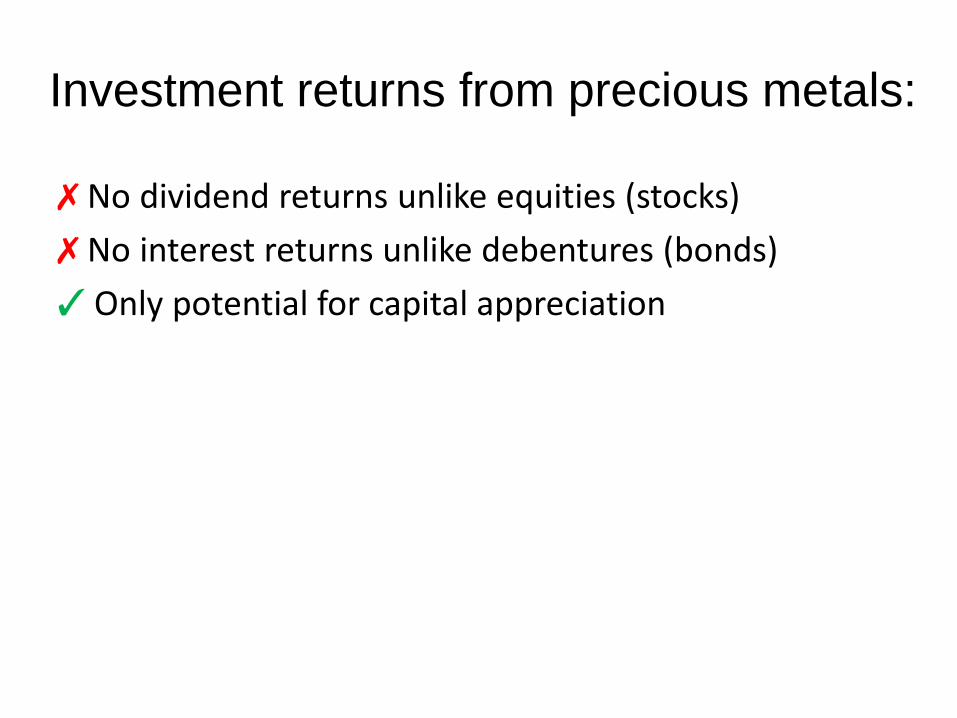
Investment returns from precious metals:
No dividend returns unlike equities (stocks) No interest returns unlike debentures (bonds) Only potential for capital appreciation

Precious-metals pricing • Three views of precious-metals pricing (late 1970s to
early 1990s): • Resource exhaustion—Assumes known and finite resource stock
and no advancements in mining or processing technologies (VanTassel 1979, 1982).
• Abnormal deviations— Speculative price swings are disruptions from the more “normal” mine-supply and fabrication-demand price trends (Languetin 1982, Quadrio-Curzio 1982, DuBoulay 1983).
• Economic theory— Pricing of precious metals is in accord with economic rationale (Abklen 1980, Raftopulos 1981, Sherman 1981, Koutsoyiannis 1983, Neal 1987, Murray 1991, etc.).

Precious-metals pricing • Economic theory: precious metals distinguished by:
• The extent to which they are held for financial security or anticipation of capital gains, and
• (Dis)hoarding flows can exceed production and consumption flows.
• Hence, in accordance with economic theory: precious metals distinguished by: • The extent to which they are held for financial security or
anticipation of capital gains, and • (Dis)hoarding flows can exceed production and consumption
flows.

Sc = Supply curve Qc = Supply capacity quantity Dh = (Dis)hoarding demand curve Df = Fabrication demand curve DT = Total demand curve ( = Df + Dh ) P* = Equilibrium price P’ = No net (dis)hoarding price Qh = Hoarding demand quantity Qf = Fabrication demand quantity QT = Total demand quantity ( = Qf + Qh ) Source: Tilton (1985)
Short-run Supply and Demand Stock-flow Model

Accumulation can be modeled in accord with economic rationale
Rational accumulation of another unit of precious metal when the net marginal benefit (anticipated price gain) equals the net marginal cost (net marginal cost of storage):
PF* – P0 = NMSC PF* = Anticipated future price P0 = Current price
Net marginal cost of storage (with three components): NMSC = MOC + MIC – MCY
MOC = Marginal outlay cost (warehousing and insurance) MIC = Marginal interest cost (time value of money) MCY = Marginal convenience yield
Source: Abken (1980) and others.

Precious-metal prices are interest-rate sensitive
• High unit values lead to predominance of the MIC (time value of money):
PF* = P0 (1 + rnom)t
• Hence, precious metal prices are sensitive to both anticipated future prices PF* and prevailing nominal interest rates rnom.

Monthly average nominal interest rates, January 2001 to April 2011
Source: Compiled from official statistics of the U.S. Federal Reserve Bank.
0.00
1.00
2.00
3.00
4.00
5.00
6.00
7.00
8.00
9.00
10.00
2001 2002 2003 2004 2005 2006 2007 2008 2009 2010 2011
Perc
ent p
er a
nnum
Average majority bank prime rate Moody's AAA seasoned corporate bond rate, all industries
30-year fixed-rate conventional home mortgages 3-month Treasury bill, secondary market rate

Precious-metal prices are also sensitive to inflation
• Precious metal prices are also sensitive to inflation (I) which is a component of nominal interest rates rnom:
rnom = rreal + I
PF* = P0 (1 + (rreal + I))t

Precious-metal prices are also exchange-rate sensitive
• Global trade in precious metals— generally denominated in U.S. dollars.
• Recent weakness of the U.S. dollar against many foreign currencies— cheaper precious-metal prices in foreign-currency terms for foreign purchasers.

U.S. dollar foreign exchange rate, broad index, January 2001 to April 2011
Source: Compiled from official statistics of the U.S. Federal Reserve Bank.
0
20
40
60
80
100
120
140
2001 2002 2003 2004 2005 2006 2007 2008 2009 2010 2011
Broa
d In
dex,
200
7 =
100

Indices of monthly average gold prices in selected currencies, per troy ounce, London fix, January 2001 to May 2011
Source: Compiled from official statistics of the World Gold Council.
0
100
200
300
400
500
600
2001 2002 2003 2004 2005 2006 2007 2008 2009 2010 2011
Inde
x 20
01 =
100
U.S. dollar EU euro Japanese yen British pound Australian dollar
South African rand Canadian dollar Indian rupee Chinese renminbi

Precious metals can be complements or substitutes
Depending on current relative price levels and anticipated future price levels, and other factors, precious metals can be:
• Complements— increased investment in gold can also prompt increased investment in silver and PGMs.
• Substitutes—increased gold prices may encourage consumer switching to cheaper silver-containing products.

Precious-metals pricing • Hence, economic theory provides the basis for
multivariate time-series modeling of precious-metals prices: • Selection of explanatory variables and • Model specification. • Results based on economic theory rather than “ad-hoc”
explanatory variables selection and model specification.
• Likewise, economic theory provides the basis for attempts to forecast precious-metals prices: • Selection of explanatory variables and • Model specification. • Results based on economic theory rather than ad-hoc
specification— but not guarantees of the accuracy of such “ex-ante” forecasts.

Thank You!