US Global Leadership Project Report
28
e U.S.-Global Leadership Project A partnership between the Meridian International Center and Gallup
Transcript of US Global Leadership Project Report
The U.S.-Global Leadership ProjectA partnership between the Meridian International Center and Gallup

Copyright © 2011 Gallup, Inc. All rights reserved. Gallup® is a trademark of Gallup, Inc.All other trademarks are the property of their respective owners.
Through advanced social and economic
analysis, Gallup helps organizations, cities,
and countries solve the world’s foremost
problems. For more information, please visit
socialandeconomicanalysis.gallup.com
or contact Sarah Van Allen at 202.715.3152

Copyright © 2011 Gallup, Inc. All rights reserved. 1
The U.S.-Global Leadership Project is a joint effort between the Meridian International Center and Gallup to provide a comprehensive assessment of how world residents view U.S. leadership. The project combines Gallup’s unique global opinion data from more than 150 countries with Meridian’s leadership-focused context to create
a powerful and useful barometer.
The U.S.-Global Leadership Project gives public- and private-sector leaders a better understanding of what is driving global views of U.S. leadership, creates a context for collaboration on how to improve those views, and enhances U.S. public and private global engagement efforts.
The U.S.-Global Leadership Track
A barometer of global perspectives on U.S. leadership
The U.S.-Global Leadership Track is the largest global public opinion study of views about U.S. leadership. This report is the third in an annual series and includes U.S. leadership approval data from more than 130 countries that Gallup surveyed during the third year of the Obama administration. The Track ultimately will feature data from more than 150 countries.
Gallup has been asking residents worldwide to rate the leadership of the U.S. since 2005, providing a comparison of how perceptions of U.S. leadership change over time and from administration to administration.
Worldwide Perceptions of U.S. Leadership
The U.S. has changed leadership, struggled economically, and adjusted its foreign policy over the past five years. The U.S.-Global Leadership Track illustrates how different regions and countries around the world have responded to these changes from year to year.
Although the image of U.S. leadership is showing some cracks in the third year of President Barack Obama’s presidency, it remains more positive worldwide than during the last years of the Bush administration. U.S. leadership ratings in 2011 failed to regain the momentum they lost in 2010, and instead remained static or retreated even more in some places.
The U.S.-Global Leadership Track included 136 countries in 2011 — more than ever before — and some, like Swaziland and Lesotho, for the first time. Median approval of U.S. leadership across these 136 countries stood at 46% —
The U.S.-Global Leadership ProjectA partnership between the Meridian International Center and Gallup

2 Copyright © 2011 Gallup, Inc. All rights reserved.
relatively unchanged from the 47% median across 116 countries in 2010. Looking at median approval in these same 116 countries in 2011, the median is slightly lower at 43%, suggesting the U.S. has lost some of its status.
A closer look at where U.S. leadership stands at the regional and country levels reveals specific areas of strength and weakness.
U.S. Approval Remains Strong in Most of Africa
The image of U.S. leadership continued to be the strongest worldwide in Africa in 2011, bolstered by strong majority approval in sub-Saharan Africa. However, this strong support in the subcontinent is showing signs of weakening for the first time during the Obama administration.
U.S. leadership remains far less popular in North Africa. No approval rating tops 40%. Ratings after the Arab Spring are not any worse or any better in most countries except Tunisia and Morocco, where ratings were somewhat higher.
U.S. Losing Some Fans, Not Making New Ones
After two consecutive years of approval in the mid-80s, support across Africa dropped to a median of 74% in 2011. Double-digit losses in 10 sub-Saharan countries, including an 18-percentage point drop in South Africa, led the declines that essentially negate the gains after the transition from the Bush to the Obama administration.
Regional Highlights and Insights
• At least two-thirds of residents in 33 sub-Saharan African countries said they approve of the job performance of the leadership of the U.S. Ghanaians are the most likely in all of Africa to approve, with 92% expressing support.
• Approval in the region is lowest in Egypt, where 19% said they approved — unchanged from before the revolution that toppled former President Hosni Mubarak. Since then, other Gallup surveys show Egyptians growing increasingly skeptical of U.S. aid.

Copyright © 2011 Gallup, Inc. All rights reserved. 3
Do you approve or disapprove of the job performance of the leadership of the U.S.?Africa
Approve DisapproveDon't know/
Refused 2011 Survey dates
Approval difference from 2010 to 2011
(pct. pts.)
Ghana 92% 6% 2% Apr 15-Apr 29, 2011 **Mali 87% 10% 4% Oct 23-Nov 4, 2011 -8Mozambique 86% 13% 0% May 21-June 4, 2011 **Congo Brazzaville 86% 10% 4% Jun 26-Jul 9, 2011 **Burkina Faso 85% 12% 2% Sep 21-Sep 30, 2011 -10Kenya 83% 16% 0% Jun 3-Jun 14, 2011 -4Senegal 83% 17% 0% Mar 2-Apr 10, 2011 -1Zambia 83% 12% 5% Jun 25-Jul 6, 2011 **Angola 82% 13% 5% Sep 23-Oct 9, 2011 **Gabon 82% 15% 3% Sep 2-Sep 21, 2011 **Sierra Leone 81% 14% 4% Sep 30-Oct 10, 2011 -12Uganda 79% 18% 3% Aug 11-Aug 21, 2011 -11Madagascar 79% 12% 9% May 12-May 25, 2011 **
Mauritania* 79% 18% 3%Feb 11-Feb 24, 2011; Sep 8-Sep 20, 2011
8
Lesotho 79% 17% 3% Nov 7-Nov 17, 2011 **Nigeria 77% 8% 14% Jul 23-Aug 4, 2011 -1Burundi 77% 17% 5% Aug 1-Aug 10, 2011 **Guinea 77% 8% 15% Apr 23-May 8, 2011 **Tanzania 75% 23% 2% Jun 18-Jul 1, 2011 -12South Africa 74% 20% 6% Aug 27-Sep 9, 2011 -18Zimbabwe 74% 22% 3% Feb 26-Mar 5, 2011 -2Togo 74% 7% 18% Aug 18-Aug 28, 2011 **Mauritius 74% 17% 9% Mar 28-Apr 30, 2011 **Cameroon 73% 26% 1% Mar 20-Apr 2, 2011 -18Central African Republic 73% 6% 21% Nov 14-Nov 28, 2011 -21Swaziland 73% 17% 9% Nov 13-Nov 21, 2011 **
Comoros* 71% 26% 3%Feb 26-Mar 14, 2011; Sep 10-Sep 22, 2011
3
Congo (Kinshasa) 71% 14% 15% Jul 14-Aug 8, 2011 **Malawi 69% 29% 1% Dec 9-Dec 19, 2011 **Niger 69% 27% 4% Oct 29-Nov 7, 2011 -17Botswana 67% 25% 8% Oct 15-Oct 29, 2011 **

4 Copyright © 2011 Gallup, Inc. All rights reserved.
Do you approve or disapprove of the job performance of the leadership of the U.S.?Africa
Approve DisapproveDon't know/
Refused 2011 Survey dates
Approval difference from 2010 to 2011
(pct. pts.)
Somaliland region* 66% 33% 0%Mar 12-Mar 21, 2011; Sep 14-Sep 25, 2011
-2
Benin 63% 18% 20% Aug 25-Sep 9, 2011 **Chad 62% 31% 7% Oct 6-Oct 17, 2011 -17Djibouti 61% 30% 9% May 21-Jun 1, 2011 -15
Algeria* 37% 63% 0%Mar 9-Mar 30, 2011; Sep 26-Oct 13, 2011
2
Morocco* 35% 55% 26%Apr 1-24, 2011; Oct 4,
2011-Jan 9, 20125
Tunisia* 27% 57% 16%Mar 27-Apr 8, 2011; Sep 17-Oct 30, 2011
8
Egypt* 19% 47% 18%
Mar 25-Apr 2, 2011; Jun 10-Jun 17, 2011; Jul 25-Aug 1, 2011;
Sep 16-Sep 23, 2011; Dec 16-Dec 23, 2011
0
*Data aggregated from multiple surveys in 2011. **No data available for 2010. Figures may not add to 100% because of rounding.
Copyright © 2011 Gallup, Inc. All rights reserved. 5
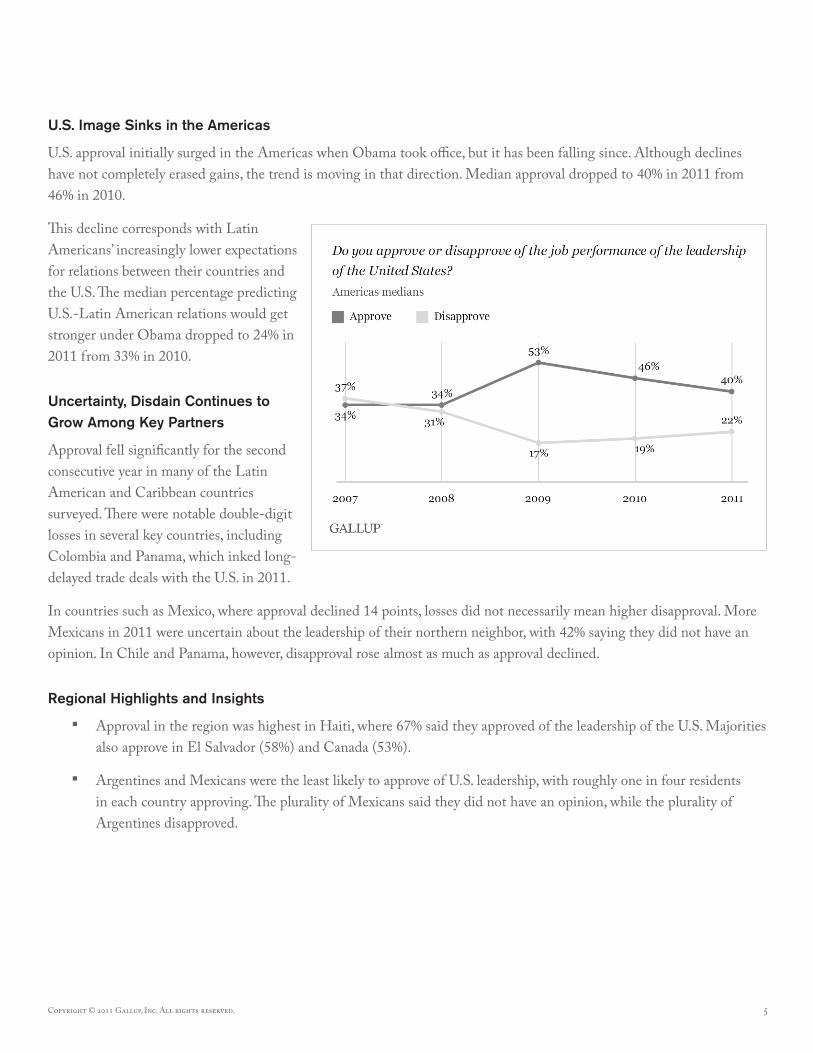
U.S. Image Sinks in the Americas
U.S. approval initially surged in the Americas when Obama took office, but it has been falling since. Although declines have not completely erased gains, the trend is moving in that direction. Median approval dropped to 40% in 2011 from 46% in 2010.
This decline corresponds with Latin Americans’ increasingly lower expectations for relations between their countries and the U.S. The median percentage predicting U.S.-Latin American relations would get stronger under Obama dropped to 24% in 2011 from 33% in 2010.
Uncertainty, Disdain Continues to Grow Among Key Partners
Approval fell significantly for the second consecutive year in many of the Latin American and Caribbean countries surveyed. There were notable double-digit losses in several key countries, including Colombia and Panama, which inked long-delayed trade deals with the U.S. in 2011.
In countries such as Mexico, where approval declined 14 points, losses did not necessarily mean higher disapproval. More Mexicans in 2011 were uncertain about the leadership of their northern neighbor, with 42% saying they did not have an opinion. In Chile and Panama, however, disapproval rose almost as much as approval declined.
Regional Highlights and Insights
• Approval in the region was highest in Haiti, where 67% said they approved of the leadership of the U.S. Majorities also approve in El Salvador (58%) and Canada (53%).
• Argentines and Mexicans were the least likely to approve of U.S. leadership, with roughly one in four residents in each country approving. The plurality of Mexicans said they did not have an opinion, while the plurality of Argentines disapproved.
6 Copyright © 2011 Gallup, Inc. All rights reserved.
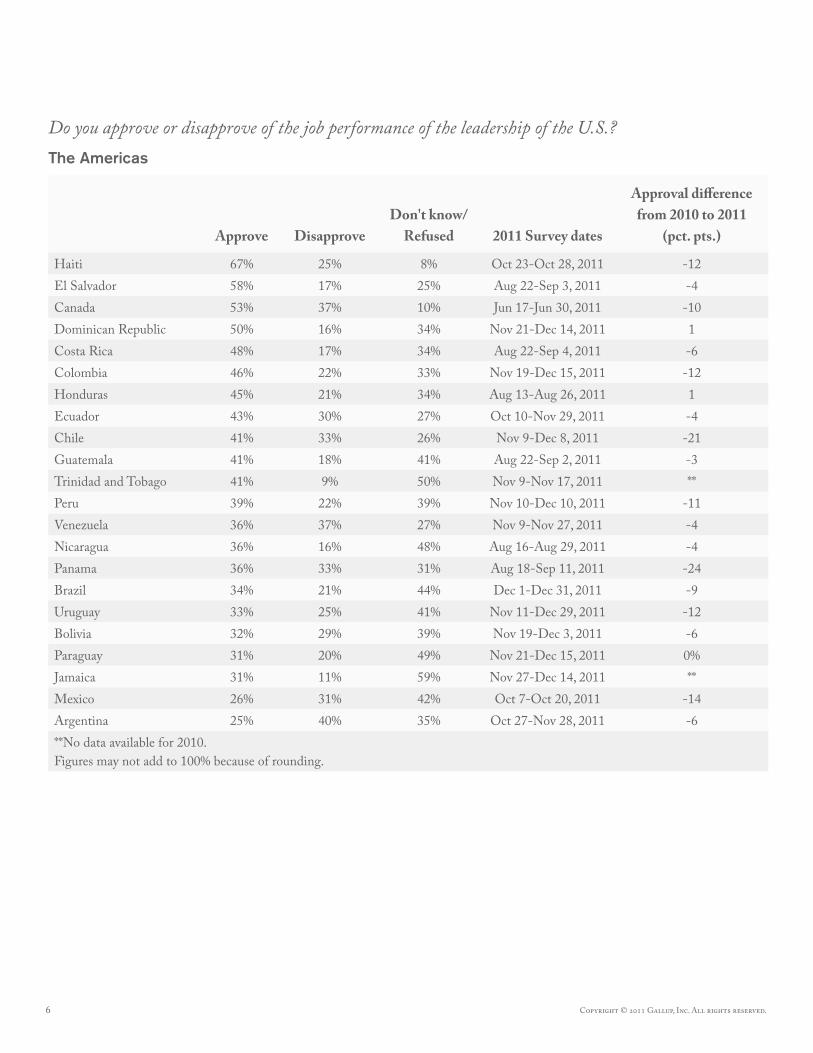
Do you approve or disapprove of the job performance of the leadership of the U.S.?The Americas
Approve DisapproveDon't know/
Refused 2011 Survey dates
Approval difference from 2010 to 2011
(pct. pts.)
Haiti 67% 25% 8% Oct 23-Oct 28, 2011 -12El Salvador 58% 17% 25% Aug 22-Sep 3, 2011 -4Canada 53% 37% 10% Jun 17-Jun 30, 2011 -10Dominican Republic 50% 16% 34% Nov 21-Dec 14, 2011 1Costa Rica 48% 17% 34% Aug 22-Sep 4, 2011 -6Colombia 46% 22% 33% Nov 19-Dec 15, 2011 -12Honduras 45% 21% 34% Aug 13-Aug 26, 2011 1Ecuador 43% 30% 27% Oct 10-Nov 29, 2011 -4Chile 41% 33% 26% Nov 9-Dec 8, 2011 -21Guatemala 41% 18% 41% Aug 22-Sep 2, 2011 -3Trinidad and Tobago 41% 9% 50% Nov 9-Nov 17, 2011 **Peru 39% 22% 39% Nov 10-Dec 10, 2011 -11Venezuela 36% 37% 27% Nov 9-Nov 27, 2011 -4Nicaragua 36% 16% 48% Aug 16-Aug 29, 2011 -4Panama 36% 33% 31% Aug 18-Sep 11, 2011 -24Brazil 34% 21% 44% Dec 1-Dec 31, 2011 -9Uruguay 33% 25% 41% Nov 11-Dec 29, 2011 -12Bolivia 32% 29% 39% Nov 19-Dec 3, 2011 -6Paraguay 31% 20% 49% Nov 21-Dec 15, 2011 0%Jamaica 31% 11% 59% Nov 27-Dec 14, 2011 **Mexico 26% 31% 42% Oct 7-Oct 20, 2011 -14Argentina 25% 40% 35% Oct 27-Nov 28, 2011 -6**No data available for 2010. Figures may not add to 100% because of rounding.

Copyright © 2011 Gallup, Inc. All rights reserved. 7
European Approval Ratings Edge Down
Europeans’ median approval of U.S. leadership is still more than twice as high in 2011 as it was during the last years of the Bush administration, but the trend is moving in a negative direction. A median of 42% approved of U.S. leadership last year, down from the peak of 47% in 2009.
U.S. Image Has Ups and Downs Across Europe
Approval increased by double digits in the United Kingdom and Belgium in 2011. The U.S. also retained majority support in eight countries in 2011 that span several regions: Kosovo, Albania, Ireland, the United Kingdom, the Netherlands, Macedonia, Hungary, and Lithuania.
However, U.S. leadership lost key favor among other longtime allies, with double-digit declines in countries such as France, Germany, Spain, and Sweden. In France and Spain, approval fell below the majority level. Ratings did not change significantly in about half of the 37 countries Gallup surveyed, which could be a positive indicator given the declines in leading nations and the volatility of the economic situation gripping Europe and the U.S.
Regional Highlights and Insights
• U.S. leadership approval remains lowest in Serbia (8%) and highest in Kosovo (90%), unchanged from 2010. This likely reflects U.S. support for Kosovo’s independence from Serbia.
• Majorities in Serbia (75%), Bosnia and Herzegovina (61%), Greece (58%), and Montenegro (53%) disapproved of the leadership of the U.S.

8 Copyright © 2011 Gallup, Inc. All rights reserved.
Do you approve or disapprove of the job performance of the leadership of the U.S.?Europe
Approve DisapproveDon't know/
Refused 2011 Survey dates
Approval difference from 2010 to 2011
(pct. pts.)
Kosovo 90% 8% 2% Jun 28-Jul 15, 2011 2Albania 77% 11% 12% Jul 4-Jul 18, 2011 -7Ireland 68% 13% 19% Apr 7-Apr 27, 2011 5United Kingdom 67% 14% 19% Oct 1-Dec 30, 2011 13Netherlands 65% 18% 16% Mar 16-May 2, 2011 3Macedonia 54% 15% 30% Jul 7-Aug 25, 2011 -4Hungary 53% 18% 29% Apr 12-Apr 30, 2011 -1Lithuania 53% 19% 28% Apr 19-May 8, 2011 3Italy 50% 15% 35% Mar 15-Mar 31, 2011 -1Denmark 50% 22% 29% Apr 5-Apr 25, 2011 -7Finland 50% 33% 17% Apr 5-Apr 28, 2011 -3Romania 46% 16% 39% Apr 16-May 12, 2011 -1Luxembourg 46% 31% 23% Apr 11-May 5, 2011 -9Belgium 45% 22% 33% Apr 6-May 16, 2011 15Moldova 45% 15% 40% Jun 21-Jul 20, 2011 0Portugal 45% 8% 47% Apr 5-May 12, 2011 5Czech Republic 43% 21% 36% Apr 15-May 9, 2011 0France 42% 32% 25% May 13-Jun 17, 2011 -13Spain 42% 33% 24% Mar 14-Mar 30, 2011 -12Austria 41% 37% 22% Apr 6-May 16, 2011 -4Germany 40% 39% 21% Jul 1-Sep 30, 2011 -10Bulgaria 40% 21% 38% Apr 12-May 10, 2011 -3Poland 38% 26% 35% Apr 14-May 16, 2011 2Sweden 35% 26% 39% Apr 4-May 2, 2011 -15Croatia 35% 23% 42% Jun 29-Jul 18, 2011 -7Slovakia 35% 31% 34% Apr 12-May 8, 2011 2Ukraine 34% 28% 38% Jul 3-Aug 28, 2011 -4Estonia 32% 38% 30% May 14-Jun 4, 2011 **Bosnia and Herzegovina 29% 61% 10% Jul 6-Jul 24, 2011 -5Latvia 27% 35% 39% May 20-Jun 14, 2011 **Slovenia 26% 48% 26% Apr 4-May 20, 2011 -8Malta 25% 12% 62% Apr 7-Apr 18, 2011 -5Greece 22% 58% 19% Apr 14-May 3, 2011 -6

Copyright © 2011 Gallup, Inc. All rights reserved. 9
Do you approve or disapprove of the job performance of the leadership of the U.S.?Europe
Approve DisapproveDon't know/
Refused 2011 Survey dates
Approval difference from 2010 to 2011
(pct. pts.)
Montenegro 22% 53% 25% Jul 2-Aug 6, 2011 -10Russia 20% 39% 41% May 8-Jun 30, 2011 -3Belarus 19% 41% 41% Jun 7-Jul 7, 2011 -10Serbia 8% 75% 16% Jul 8-Jul 31, 2011 -4*Data aggregated from multiple surveys in 2011. **No data available for 2010. Figures may not add to 100% because of rounding.
10 Copyright © 2011 Gallup, Inc. All rights reserved.
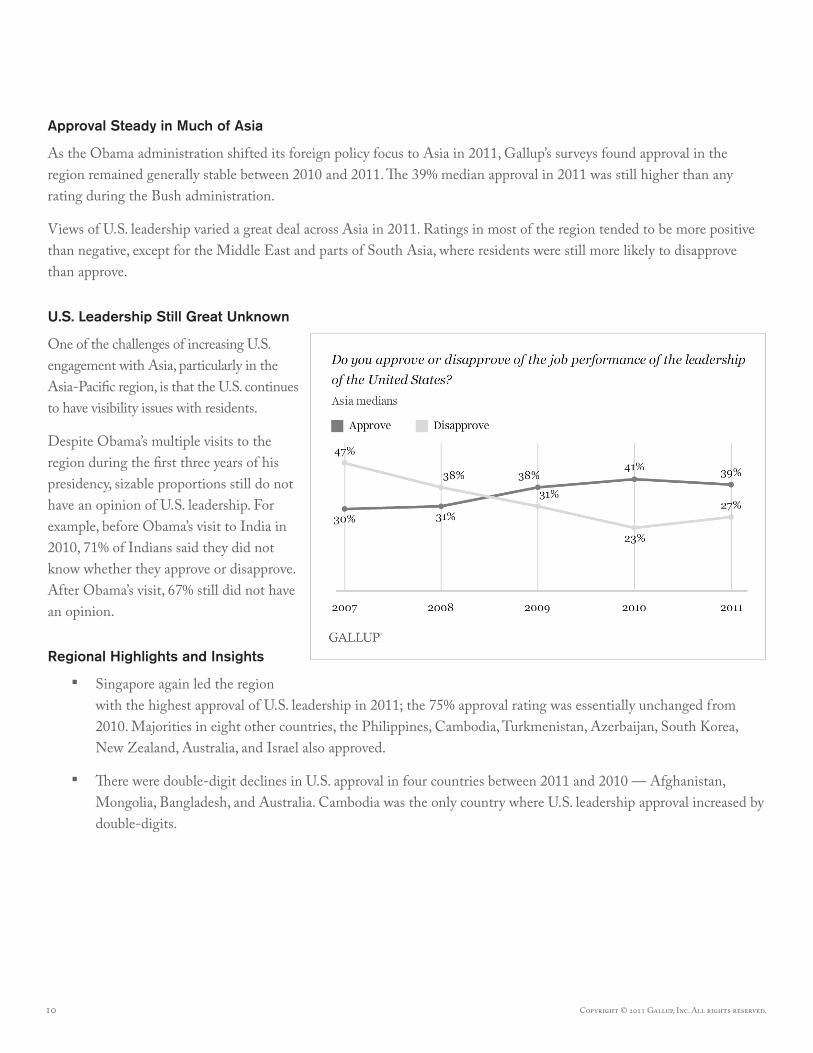
Approval Steady in Much of Asia
As the Obama administration shifted its foreign policy focus to Asia in 2011, Gallup’s surveys found approval in the region remained generally stable between 2010 and 2011. The 39% median approval in 2011 was still higher than any rating during the Bush administration.
Views of U.S. leadership varied a great deal across Asia in 2011. Ratings in most of the region tended to be more positive than negative, except for the Middle East and parts of South Asia, where residents were still more likely to disapprove than approve.
U.S. Leadership Still Great Unknown
One of the challenges of increasing U.S. engagement with Asia, particularly in the Asia-Pacific region, is that the U.S. continues to have visibility issues with residents.
Despite Obama’s multiple visits to the region during the first three years of his presidency, sizable proportions still do not have an opinion of U.S. leadership. For example, before Obama’s visit to India in 2010, 71% of Indians said they did not know whether they approve or disapprove. After Obama’s visit, 67% still did not have an opinion.
Regional Highlights and Insights
• Singapore again led the region with the highest approval of U.S. leadership in 2011; the 75% approval rating was essentially unchanged from 2010. Majorities in eight other countries, the Philippines, Cambodia, Turkmenistan, Azerbaijan, South Korea, New Zealand, Australia, and Israel also approved.
• There were double-digit declines in U.S. approval in four countries between 2011 and 2010 — Afghanistan, Mongolia, Bangladesh, and Australia. Cambodia was the only country where U.S. leadership approval increased by double-digits.

Copyright © 2011 Gallup, Inc. All rights reserved. 11
Do you approve or disapprove of the job performance of the leadership of the U.S.?Asia
Approve DisapproveDon't know/
Refused 2011 Survey dates
Approval difference from 2010 to 2011
(pct. pts.)
Singapore 75% 16% 9% Sep 1-Oct 30, 2011 -2Cambodia 67% 7% 26% Apr 22-May 5, 2011 11Philippines 63% 21% 16% May 22-May 28, 2011 -3Turkmenistan 62% 18% 20% Jun 9-Jul 29, 2011 **Azerbaijan 58% 19% 22% Jul 17-Aug 7, 2011 **New Zealand 57% 28% 14% Sep 26-Nov 1, 2011 -8South Korea 57% 18% 25% Jun 16-Jul 12, 2011 2Australia 56% 22% 22% Mar 9-Apr 16, 2011 -13Israel 55% 34% 10% Oct 31-Dec 18, 2011 1Georgia 50% 21% 29% Jun 15-Jul 15, 2011 3Mongolia 48% 6% 46% Jun 3-Jun 26, 2011 -10Taiwan 47% 15% 38% Jun 15-Oct 6, 2011 -5Hong Kong 46% 41% 13% Jun 7-Jul 8, 2011 5Japan 46% 27% 28% Nov 9-Dec 4, 2011 -5Armenia 46% 31% 22% Jul 6-Aug 2, 2011 -4Thailand 44% 8% 48% Jun 11-Jul 22, 2011 3Uzbekistan 42% 22% 35% Aug 29-Sep 18, 2011 -5Tajikistan 41% 35% 24% Jun 23-Aug 19, 2011 -6Kazakhstan 39% 21% 40% Jun 9-Jul 1, 2011 -3Malaysia 38% 31% 32% Jul 4-Aug 4, 2011 -1Kyrgyzstan 35% 37% 28% Jun 4-Jun 30, 2011 5Indonesia 32% 34% 34% May 18-May 31, 2011 -1Afghanistan 31% 62% 7% Apr 24-May 2, 2011 -12
Iraq* 29% 56% 15%Feb 21-Mar 3, 2011; Sep 13-Sep 25, 2011
-7
Nepal 28% 16% 55% Apr 17-May 4, 2011 -6Turkey 27% 59% 14% Apr 14-May 11, 2011 1Pakistan 26% 49% 24% Apr 25-May 14, 2011 8Laos 26% 11% 63% Jun 10-Aug 6, 2011 **Bangladesh 23% 37% 40% Apr 15-Apr 30, 2011 -17Sri Lanka 23% 26% 50% Apr 5-Apr 22, 2011 -7Vietnam 21% 12% 67% Apr 11-Apr 26, 2011 -5

12 Copyright © 2011 Gallup, Inc. All rights reserved.
Do you approve or disapprove of the job performance of the leadership of the U.S.?Asia
Approve DisapproveDon't know/
Refused 2011 Survey dates
Approval difference from 2010 to 2011
(pct. pts.)
Lebanon* 20% 71% 9%Mar 1-Apr 25, 2011; Sep 14-Oct 16, 2011
-6
Cyprus 18% 40% 41% Apr 11-May 10, 2011 -6Yemen* 18% 57% 24% Jul 23-Jul 29, 2011 1India 16% 17% 67% Apr 11-Jun 16, 2011 -2Palestinian Territories* 10% 80% 10% Sep 2-Sep 10, 2011 -7Iran 9% 65% 25% Feb 26-Mar 30, 2011 ***Data aggregated from multiple surveys in 2011. **No data available for 2010. Figures may not add to 100% because of rounding.
Copyright © 2011 Gallup, Inc. All rights reserved. 13
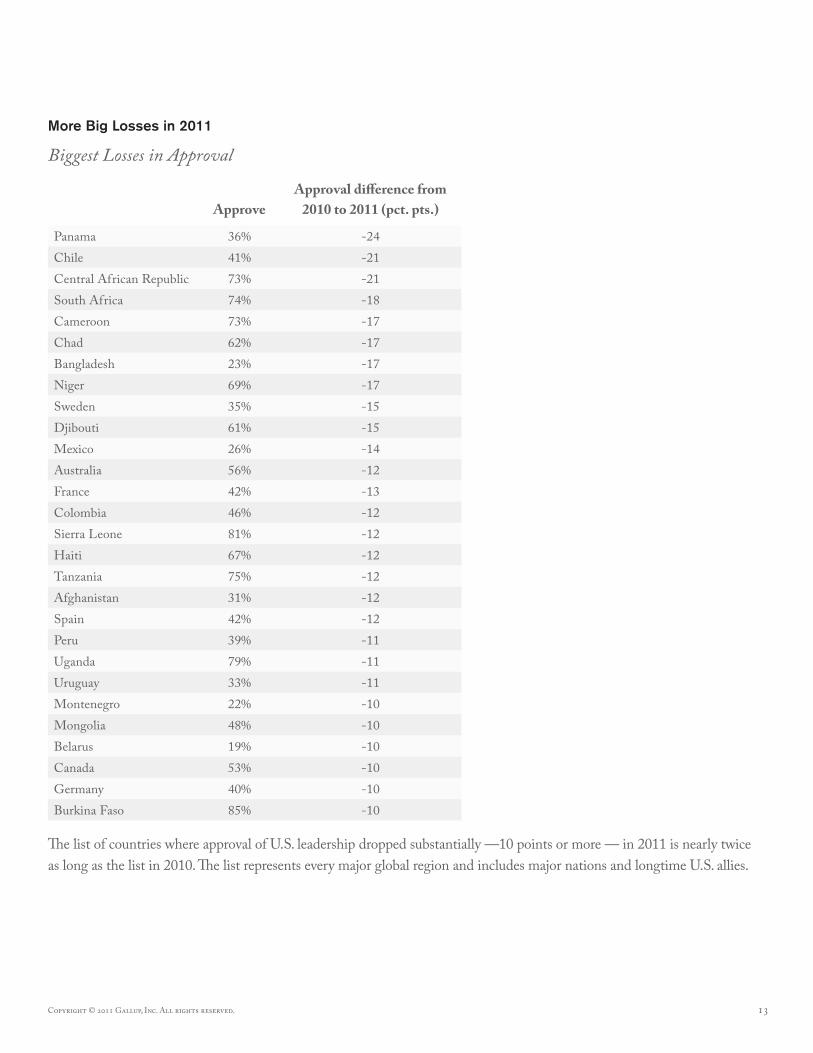
More Big Losses in 2011
Biggest Losses in Approval
ApproveApproval difference from
2010 to 2011 (pct. pts.)
Panama 36% -24Chile 41% -21Central African Republic 73% -21South Africa 74% -18Cameroon 73% -17Chad 62% -17Bangladesh 23% -17Niger 69% -17Sweden 35% -15Djibouti 61% -15Mexico 26% -14Australia 56% -12France 42% -13Colombia 46% -12Sierra Leone 81% -12Haiti 67% -12Tanzania 75% -12Afghanistan 31% -12Spain 42% -12Peru 39% -11Uganda 79% -11Uruguay 33% -11Montenegro 22% -10Mongolia 48% -10Belarus 19% -10Canada 53% -10Germany 40% -10Burkina Faso 85% -10
The list of countries where approval of U.S. leadership dropped substantially —10 points or more — in 2011 is nearly twice as long as the list in 2010. The list represents every major global region and includes major nations and longtime U.S. allies.
14 Copyright © 2011 Gallup, Inc. All rights reserved.
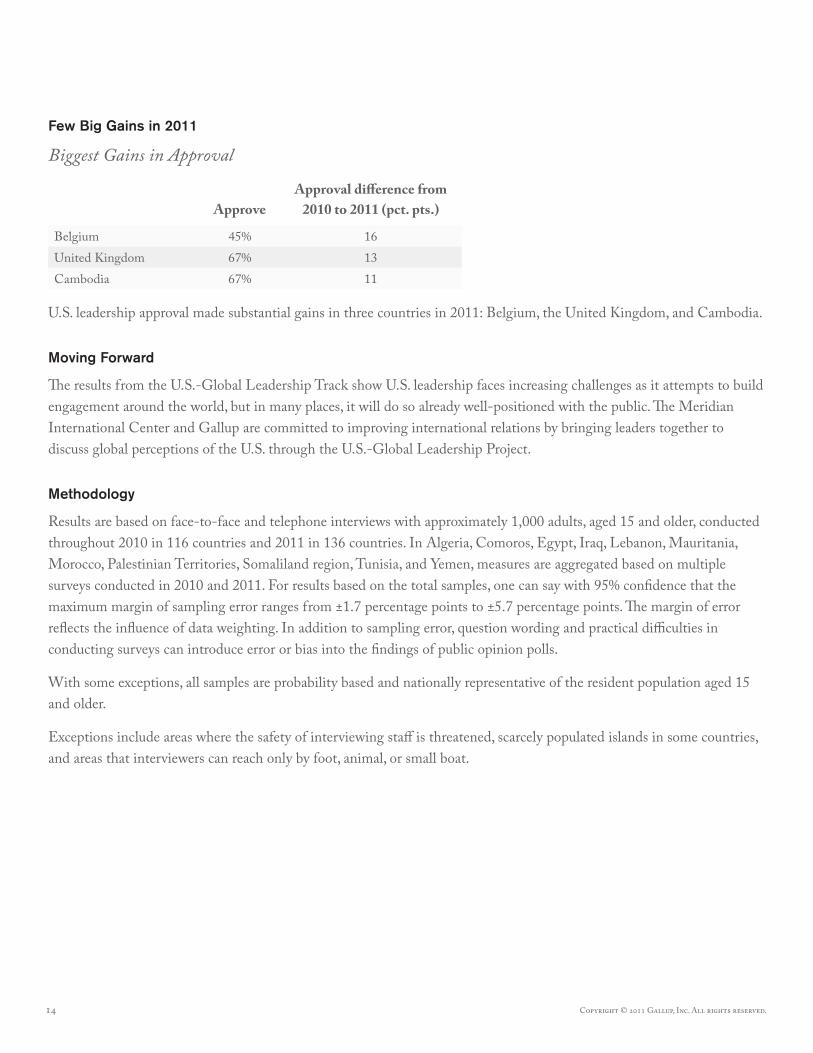
Few Big Gains in 2011
Biggest Gains in Approval
ApproveApproval difference from
2010 to 2011 (pct. pts.)
Belgium 45% 16United Kingdom 67% 13Cambodia 67% 11
U.S. leadership approval made substantial gains in three countries in 2011: Belgium, the United Kingdom, and Cambodia.
Moving Forward
The results from the U.S.-Global Leadership Track show U.S. leadership faces increasing challenges as it attempts to build engagement around the world, but in many places, it will do so already well-positioned with the public. The Meridian International Center and Gallup are committed to improving international relations by bringing leaders together to discuss global perceptions of the U.S. through the U.S.-Global Leadership Project.
Methodology
Results are based on face-to-face and telephone interviews with approximately 1,000 adults, aged 15 and older, conducted throughout 2010 in 116 countries and 2011 in 136 countries. In Algeria, Comoros, Egypt, Iraq, Lebanon, Mauritania, Morocco, Palestinian Territories, Somaliland region, Tunisia, and Yemen, measures are aggregated based on multiple surveys conducted in 2010 and 2011. For results based on the total samples, one can say with 95% confidence that the maximum margin of sampling error ranges from ±1.7 percentage points to ±5.7 percentage points. The margin of error reflects the influence of data weighting. In addition to sampling error, question wording and practical difficulties in conducting surveys can introduce error or bias into the findings of public opinion polls.
With some exceptions, all samples are probability based and nationally representative of the resident population aged 15 and older.
Exceptions include areas where the safety of interviewing staff is threatened, scarcely populated islands in some countries, and areas that interviewers can reach only by foot, animal, or small boat.

Copyright © 2011 Gallup, Inc. All rights reserved. 15
Global Snapshots
Afghanistan2007 2008 2009 2010 2011
Approve of U.S. leadership - 48% 47% 43% 37%
Albania2007 2008 2009 2010 2011
Approve of U.S. leadership - - 78% 84% 77%
Algeria*2007 2008 2009 2010 2011
Approve of U.S. leadership - 25% 45% 35% 37%
Angola2007 2008 2009 2010 2011
Approve of U.S. leadership - 54% - - 82%
Argentina2007 2008 2009 2010 2011
Approve of U.S. leadership 11% 11% 42% 31% 25%
Armenia2007 2008 2009 2010 2011
Approve of U.S. leadership 55% 54% 50% 50% 46%
Australia2007 2008 2009 2010 2011
Approve of U.S. leadership 25% 25% - 69% 56%
Austria2007 2008 2009 2010 2011
Approve of U.S. leadership - 8% - 45% 41%
Azerbaijan2007 2008 2009 2010 2011
Approve of U.S. leadership 31% 48% 53% 58% 58%
Azerbaijan2007 2008 2009 2010 2011
Approve of U.S. leadership 31% 48% 53% 58% 58%
Bahrain*2007 2008 2009 2010 2011
Approve of U.S. leadership - - 38% - -
Bangladesh2007 2008 2009 2010 2011
Approve of U.S. leadership 19% 34% 38% 40% 23%
Belarus2007 2008 2009 2010 2011
Approve of U.S. leadership 11% 13% 23% 29% 19%
Belgium2007 2008 2009 2010 2011
Approve of U.S. leadership 8% 12% - 30% 45%
Belize2007 2008 2009 2010 2011
Approve of U.S. leadership 32% - - - -
Benin2007 2008 2009 2010 2011
Approve of U.S. leadership - - - - 63%
Bolivia2007 2008 2009 2010 2011
Approve of U.S. leadership 26% 22% 40% 38% 32%
Bosnia and Herzegovina2007 2008 2009 2010 2011
Approve of U.S. leadership - - 25% 34% 29%

16 Copyright © 2011 Gallup, Inc. All rights reserved.
Global Snapshots continued
Botswana2007 2008 2009 2010 2011
Approve of U.S. leadership - 65% - - 67%
Brazil2007 2008 2009 2010 2011
Approve of U.S. leadership 26% 23% 48% 43% 34%
Bulgaria2007 2008 2009 2010 2011
Approve of U.S. leadership - - - 43% 40%
Burkina Faso2007 2008 2009 2010 2011
Approve of U.S. leadership 60% 67% - 95% 85%
Burundi2007 2008 2009 2010 2011
Approve of U.S. leadership - 67% 86% - 77%
Cambodia2007 2008 2009 2010 2011
Approve of U.S. leadership 85% 62% 64% 56% 67%
Cameroon2007 2008 2009 2010 2011
Approve of U.S. leadership 58% 63% 88% 91% 73%
Canada2007 2008 2009 2010 2011
Approve of U.S. leadership - 22% 63% 63% 53%
Central African Republic2007 2008 2009 2010 2011
Approve of U.S. leadership - - - 94% 73%
Chad2007 2008 2009 2010 2011
Approve of U.S. leadership 57% 84% 86% 79% 62%
Chile2007 2008 2009 2010 2011
Approve of U.S. leadership 27% 29% 59% 62% 41%
Colombia2007 2008 2009 2010 2011
Approve of U.S. leadership 34% 48% 60% 58% 46%
Comoros*2007 2008 2009 2010 2011
Approve of U.S. leadership - - 61% 68% 71%
Congo Brazzaville2007 2008 2009 2010 2011
Approve of U.S. leadership - 85% - - 71%
Congo Kinshasa2007 2008 2009 2010 2011
Approve of U.S. leadership - - 89% - 86%
Costa Rica2007 2008 2009 2010 2011
Approve of U.S. leadership 35% 33% 62% 54% 48%
Croatia2007 2008 2009 2010 2011
Approve of U.S. leadership - - 56% 42% 35%
Cyprus2007 2008 2009 2010 2011
Approve of U.S. leadership - - 27% 24% 18%

Copyright © 2011 Gallup, Inc. All rights reserved. 17
Global Snapshots continued
Czech Republic*2007 2008 2009 2010 2011
Approve of U.S. leadership - - 27% 24% 18%
Denmark2007 2008 2009 2010 2011
Approve of U.S. leadership 21% 24% 61% 57% 50%
Djibouti*2007 2008 2009 2010 2011
Approve of U.S. leadership - 80% 75% 76% 61%
Dominican Republic2007 2008 2009 2010 2011
Approve of U.S. leadership 31% 35% 55% 49% 50%
Ecuador2007 2008 2009 2010 2011
Approve of U.S. leadership 37% 35% 42% 47% 43%
Egypt*2007 2008 2009 2010 2011
Approve of U.S. leadership 13% 6% 31% 19% 19%
El Salvador2007 2008 2009 2010 2011
Approve of U.S. leadership 32% 36% 68% 62% 58%
Estonia2007 2008 2009 2010 2011
Approve of U.S. leadership 22% 18% 40% - 32%
Finland2007 2008 2009 2010 2011
Approve of U.S. leadership - 26% - 53% 50%
France2007 2008 2009 2010 2011
Approve of U.S. leadership - 13% 52% 55% 42%
Georgia2007 2008 2009 2010 2011
Approve of U.S. leadership 42% 41% 45% 47% 50%
Germany*2007 2008 2009 2010 2011
Approve of U.S. leadership - 19% 57% 50% 40%
Ghana2007 2008 2009 2010 2011
Approve of U.S. leadership 70% 69% 80% 91% 92%
Greece2007 2008 2009 2010 2011
Approve of U.S. leadership 16% - 41% 28% 22%
Guatemala2007 2008 2009 2010 2011
Approve of U.S. leadership 41% 40% 45% 44% 41%
Guinea2007 2008 2009 2010 2011
Approve of U.S. leadership 70% - - - 77%
Guyana2007 2008 2009 2010 2011
Approve of U.S. leadership 65% - - - -
Haiti2007 2008 2009 2010 2011
Approve of U.S. leadership - 69% - 79% 67%

18 Copyright © 2011 Gallup, Inc. All rights reserved.
Global Snapshots continued
Honduras2007 2008 2009 2010 2011
Approve of U.S. leadership 50% 47% 54% 44% 45%
Hong Kong2007 2008 2009 2010 2011
Approve of U.S. leadership - 22% 48% 41% 46%
Hungary2007 2008 2009 2010 2011
Approve of U.S. leadership 41% - 39% 54% 53%
Iceland2007 2008 2009 2010 2011
Approve of U.S. leadership - 14% - - -
India2007 2008 2009 2010 2011
Approve of U.S. leadership 27% 31% 26% 18% 16%
Indonesia2007 2008 2009 2010 2011
Approve of U.S. leadership 31% 46% 35% 33% 32%
Iran2007 2008 2009 2010 2011
Approve of U.S. leadership 22% 16% - - 9%
Iraq*2007 2008 2009 2010 2011
Approve of U.S. leadership - 35% 24% 36% 29%
Ireland2007 2008 2009 2010 2011
Approve of U.S. leadership - 23% 80% 63% 68%
Israel2007 2008 2009 2010 2011
Approve of U.S. leadership 66% 62% 61% 54% 55%
Italy2007 2008 2009 2010 2011
Approve of U.S. leadership 18% 19% 49% 51% 50%
Ivory Coast2007 2008 2009 2010 2011
Approve of U.S. leadership - - 94% - -
Jamaica2007 2008 2009 2010 2011
Approve of U.S. leadership - - - - 31%
Japan2007 2008 2009 2010 2011
Approve of U.S. leadership 24% 28% 66% 51% 46%
Jordan2007 2008 2009 2010 2011
Approve of U.S. leadership 18% 9% - - -
Kazakhstan2007 2008 2009 2010 2011
Approve of U.S. leadership 30% 20% 36% 42% 39%
Kenya2007 2008 2009 2010 2011
Approve of U.S. leadership 80% 82% 93% 87% 83%
Kosovo2007 2008 2009 2010 2011
Approve of U.S. leadership - - 88% 88% 90%
Copyright © 2011 Gallup, Inc. All rights reserved. 19
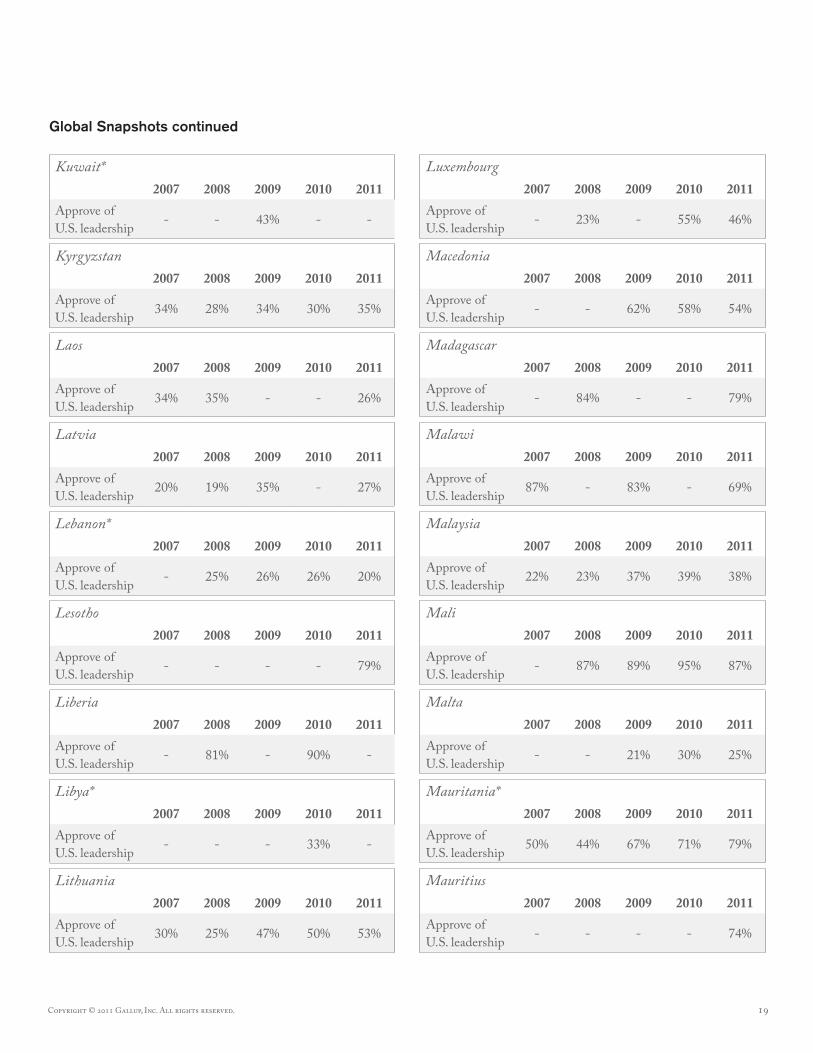
Global Snapshots continued
Kuwait*2007 2008 2009 2010 2011
Approve of U.S. leadership - - 43% - -
Kyrgyzstan2007 2008 2009 2010 2011
Approve of U.S. leadership 34% 28% 34% 30% 35%
Laos2007 2008 2009 2010 2011
Approve of U.S. leadership 34% 35% - - 26%
Latvia2007 2008 2009 2010 2011
Approve of U.S. leadership 20% 19% 35% - 27%
Lebanon*2007 2008 2009 2010 2011
Approve of U.S. leadership - 25% 26% 26% 20%
Lesotho2007 2008 2009 2010 2011
Approve of U.S. leadership - - - - 79%
Liberia2007 2008 2009 2010 2011
Approve of U.S. leadership - 81% - 90% -
Libya*2007 2008 2009 2010 2011
Approve of U.S. leadership - - - 33% -
Lithuania2007 2008 2009 2010 2011
Approve of U.S. leadership 30% 25% 47% 50% 53%
Luxembourg2007 2008 2009 2010 2011
Approve of U.S. leadership - 23% - 55% 46%
Macedonia2007 2008 2009 2010 2011
Approve of U.S. leadership - - 62% 58% 54%
Madagascar2007 2008 2009 2010 2011
Approve of U.S. leadership - 84% - - 79%
Malawi2007 2008 2009 2010 2011
Approve of U.S. leadership 87% - 83% - 69%
Malaysia2007 2008 2009 2010 2011
Approve of U.S. leadership 22% 23% 37% 39% 38%
Mali2007 2008 2009 2010 2011
Approve of U.S. leadership - 87% 89% 95% 87%
Malta2007 2008 2009 2010 2011
Approve of U.S. leadership - - 21% 30% 25%
Mauritania*2007 2008 2009 2010 2011
Approve of U.S. leadership 50% 44% 67% 71% 79%
Mauritius2007 2008 2009 2010 2011
Approve of U.S. leadership - - - - 74%

20 Copyright © 2011 Gallup, Inc. All rights reserved.
Global Snapshots continued
Mexico2007 2008 2009 2010 2011
Approve of U.S. leadership 34% 24% 53% 40% 26%
Moldova2007 2008 2009 2010 2011
Approve of U.S. leadership 39% 39% 44% 45% 45%
Mongolia2007 2008 2009 2010 2011
Approve of U.S. leadership 56% 51% - 58% 48%
Montenegro2007 2008 2009 2010 2011
Approve of U.S. leadership - - 34% 32% 22%
Morocco*2007 2008 2009 2010 2011
Approve of U.S. leadership - - 33% 30% 35%
Mozambique2007 2008 2009 2010 2011
Approve of U.S. leadership 63% 80% - - 86%
Namibia2007 2008 2009 2010 2011
Approve of U.S. leadership 39% - - - -
Nepal2007 2008 2009 2010 2011
Approve of U.S. leadership 39% 37% - 34% 28%
Netherlands2007 2008 2009 2010 2011
Approve of U.S. leadership 18% 17% - 62% 65%
New Zealand2007 2008 2009 2010 2011
Approve of U.S. leadership 20% 22% - 65% 57%
Nicaragua2007 2008 2009 2010 2011
Approve of U.S. leadership 50% 45% 42% 40% 36%
Niger2007 2008 2009 2010 2011
Approve of U.S. leadership 50% 50% 83% 86% 69%
Nigeria2007 2008 2009 2010 2011
Approve of U.S. leadership 68% 72% 70% 78% 77%
Norway2007 2008 2009 2010 2011
Approve of U.S. leadership - - - - -
Pakistan*2007 2008 2009 2010 2011
Approve of U.S. leadership 19% 11% 13% 18% 26%
Palestinian Territories*2007 2008 2009 2010 2011
Approve of U.S. leadership 12% 13% 14% 17% 10%
Panama2007 2008 2009 2010 2011
Approve of U.S. leadership 63% 47% 63% 60% 36%
Paraguay2007 2008 2009 2010 2011
Approve of U.S. leadership 16% 19% 28% 31% 31%
Copyright © 2011 Gallup, Inc. All rights reserved. 21
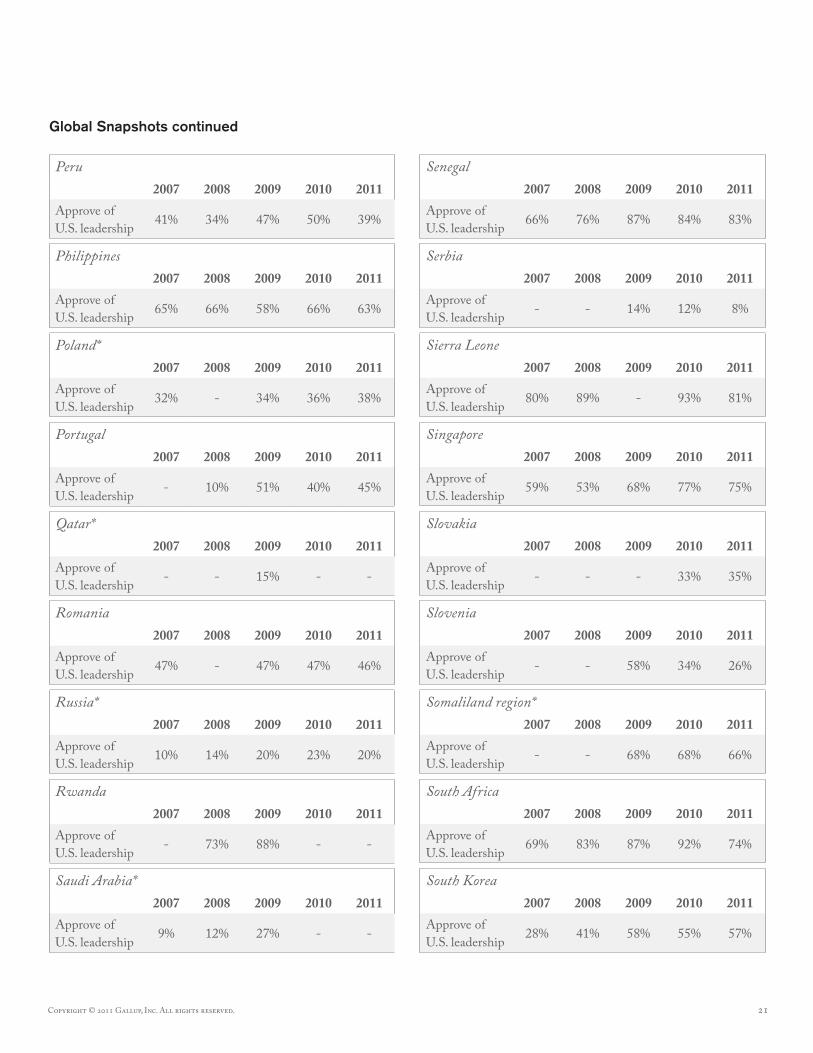
Global Snapshots continued
Peru2007 2008 2009 2010 2011
Approve of U.S. leadership 41% 34% 47% 50% 39%
Philippines2007 2008 2009 2010 2011
Approve of U.S. leadership 65% 66% 58% 66% 63%
Poland*2007 2008 2009 2010 2011
Approve of U.S. leadership 32% - 34% 36% 38%
Portugal2007 2008 2009 2010 2011
Approve of U.S. leadership - 10% 51% 40% 45%
Qatar*2007 2008 2009 2010 2011
Approve of U.S. leadership - - 15% - -
Romania2007 2008 2009 2010 2011
Approve of U.S. leadership 47% - 47% 47% 46%
Russia*2007 2008 2009 2010 2011
Approve of U.S. leadership 10% 14% 20% 23% 20%
Rwanda2007 2008 2009 2010 2011
Approve of U.S. leadership - 73% 88% - -
Saudi Arabia*2007 2008 2009 2010 2011
Approve of U.S. leadership 9% 12% 27% - -
Senegal2007 2008 2009 2010 2011
Approve of U.S. leadership 66% 76% 87% 84% 83%
Serbia2007 2008 2009 2010 2011
Approve of U.S. leadership - - 14% 12% 8%
Sierra Leone2007 2008 2009 2010 2011
Approve of U.S. leadership 80% 89% - 93% 81%
Singapore2007 2008 2009 2010 2011
Approve of U.S. leadership 59% 53% 68% 77% 75%
Slovakia2007 2008 2009 2010 2011
Approve of U.S. leadership - - - 33% 35%
Slovenia2007 2008 2009 2010 2011
Approve of U.S. leadership - - 58% 34% 26%
Somaliland region*2007 2008 2009 2010 2011
Approve of U.S. leadership - - 68% 68% 66%
South Africa2007 2008 2009 2010 2011
Approve of U.S. leadership 69% 83% 87% 92% 74%
South Korea2007 2008 2009 2010 2011
Approve of U.S. leadership 28% 41% 58% 55% 57%

22 Copyright © 2011 Gallup, Inc. All rights reserved.
Global Snapshots continued
Spain2007 2008 2009 2010 2011
Approve of U.S. leadership 6% 8% 54% 54% 42%
Sri Lanka2007 2008 2009 2010 2011
Approve of U.S. leadership 32% 36% 36% 30% 23%
Sudan2007 2008 2009 2010 2011
Approve of U.S. leadership 34% - - - -
Swaziland2007 2008 2009 2010 2011
Approve of U.S. leadership - - - - 73%
Sweden2007 2008 2009 2010 2011
Approve of U.S. leadership 13% 12% 42% 50% 35%
Switzerland2007 2008 2009 2010 2011
Approve of U.S. leadership - - 58% - -
Syria2007 2008 2009 2010 2011
Approve of U.S. leadership - 4% 15% 14% -
Taiwan2007 2008 2009 2010 2011
Approve of U.S. leadership - 27% - 52% 47%
Tajikistan2007 2008 2009 2010 2011
Approve of U.S. leadership 26% 30% 42% 47% 41%
Tanzania2007 2008 2009 2010 2011
Approve of U.S. leadership 62% 76% 89% 87% 75%
Thailand2007 2008 2009 2010 2011
Approve of U.S. leadership 40% 37% 48% 41% 44%
Togo2007 2008 2009 2010 2011
Approve of U.S. leadership - 53% - - 74%
Trinidad and Tobago2007 2008 2009 2010 2011
Approve of U.S. leadership - 21% - - 41%
Tunisia*2007 2008 2009 2010 2011
Approve of U.S. leadership - 14% 27% 19% 27%
Turkey2007 2008 2009 2010 2011
Approve of U.S. leadership 16% 16% 22% 26% 27%
Turkmenistan2007 2008 2009 2010 2011
Approve of U.S. leadership - - 61% - 62%
Uganda2007 2008 2009 2010 2011
Approve of U.S. leadership 82% 84% 91% 90% 79%
Ukraine2007 2008 2009 2010 2011
Approve of U.S. leadership 16% 26% 24% 38% 34%

Copyright © 2011 Gallup, Inc. All rights reserved. 23
Global Snapshots continued
United Arab Emirates2007 2008 2009 2010 2011
Approve of U.S. leadership - - 34% 15% -
United Kingdom2007 2008 2009 2010 2011
Approve of U.S. leadership - 23% 64% 54% 67%
Uruguay2007 2008 2009 2010 2011
Approve of U.S. leadership 25% 13% 53% 45% 33%
Uzbekistan2007 2008 2009 2010 2011
Approve of U.S. leadership - 22% 41% 47% 42%
Venezuela2007 2008 2009 2010 2011
Approve of U.S. leadership - 35% 50% 40% 36%
Vietnam2007 2008 2009 2010 2011
Approve of U.S. leadership 30% 44% 17% 26% 21%
Yemen*2007 2008 2009 2010 2011
Approve of U.S. leadership - - 18% 17% 18%
Zambia2007 2008 2009 2010 2011
Approve of U.S. leadership 54% 54% 90% - 83%
Zimbabwe2007 2008 2009 2010 2011
Approve of U.S. leadership 56% 74% 82% 76% 74%

24 Copyright © 2011 Gallup, Inc. All rights reserved.

Copyright © 2011 Gallup, Inc. All rights reserved. 25