Wetlands Wildlife Populations and Research Group Street Bemidji
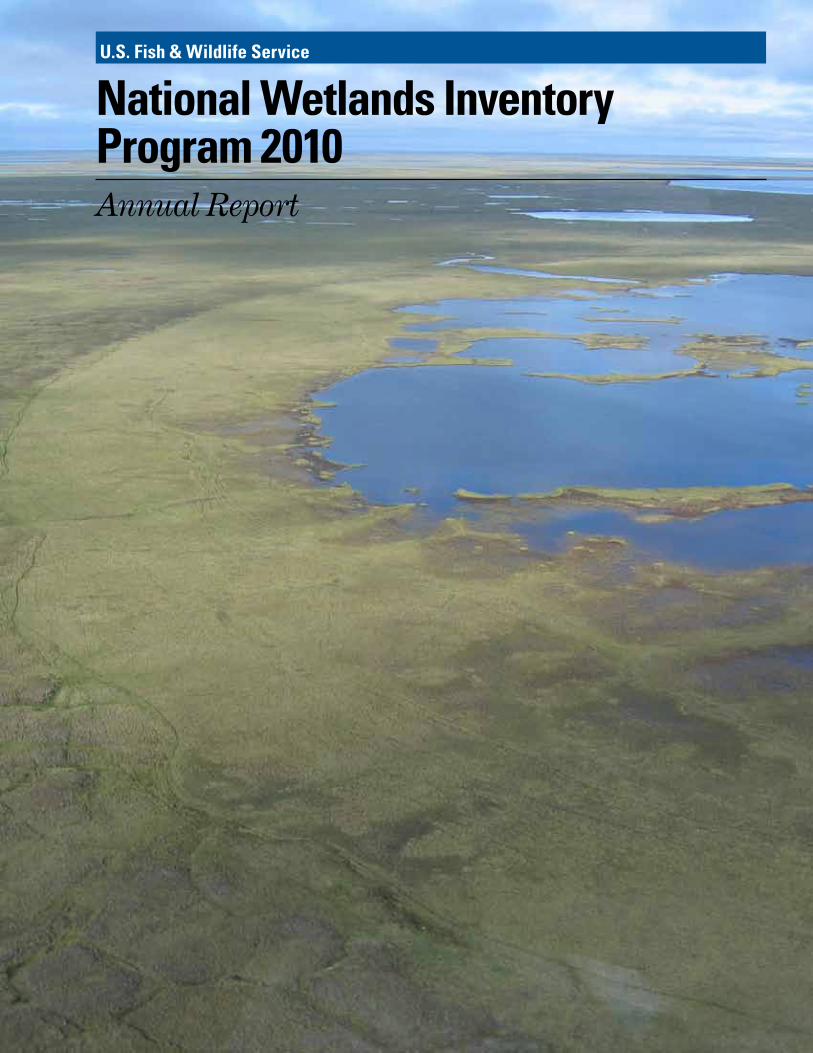
National Wetlands Inventory Program 2010Annual Report
U.S. Fish & Wildlife Service

National Wetlands Inventory Program 2010Annual Report
U.S. Fish and Wildlife Service Division of Habitat and Resource Conservation Branch of Resource and Mapping Support Arlington, Virginia 22203
May 2011

ii
National Wetlands Inventory Program 2010 Annual Report
This document may be referenced as: Tande, G.F. and J.M. Michaelson (editors). 2011. National Wetlands Inventory Program: 2010 Annual Report. U.S. Fish and Wildlife Service, Division of Habitat and Resource Conservation, Branch of Resource and Mapping Support, Arlington, VA. 39 pp.
iii
National Wetlands Inventory Program 2010 Annual Report
PROGRAM CONTACTS U.S. FISH AND WILDLIFE SERVICE
David Stout Chief, Division of Habitat and Resource Conservation
U.S. Fish and Wildlife Service 4401 North Fairfax Drive Arlington, VA 22203-1610
(703) 358-2161
Chief, Branch of Resource and Mapping Support U.S. Fish and Wildlife Service
4401 North Fairfax Drive Arlington, VA 22203-1610
(703) 358-2161
For other NWI contacts, check web at: http://www.fws.gov/wetlands/Organization/staff.html
iv
National Wetlands Inventory Program 2010 Annual Report
Table of Contents
Acknowledgments…………………………………………………………………………………………. v Executive Summary………………………………………………………………………………………… vi Introduction………………………………………………………………………………………………… 1 Regional Reports of the NWI……………………………………………………………………………….. 4 Region 1: Pacific Northwest by Bill Kirchner………………………………………………………………. 4 Region 2: Southwest by Jim Dick…………………………………………………………………………….. 8 Region 3: Great Lakes/Big Rivers by Brian Huberty……………………………………………………… 12 Region 4: Southeast by John Swords………………………………………………………………………… 15 Region 5: Northeast by Ralph Tiner…………………………………………………………………………. 18 Region 6: Mountain-Prairie by Kevin Bon…………………………………………………………………... 20 Region 7: Alaska by Jerry Tande and Julie Michaelson……………………………………………………. 22 Region 8: Pacific Southwest by Elaine Blok…………………………………………………………………. 30
Washington Office Activities by Bill Wilen and Jo Ann Mills…………………………………………… … 34
National Standards and Support Team by Tom Dahl…………………………………………………………… 36
Appendix A: List of 2010 Contributors and Cooperators by Jo Ann Mills…………………………………… 39 Appendix B: 2010 National Wetlands Inventory Projects added to the Wetlands by Jo Ann Mills………… 40
Appendix C: Landscape Conservation Cooperatives Boundaries and Mapping Status …………………… 42
v
National Wetlands Inventory Program 2010 Annual Report
Acknowledgements
The editors, Jerry Tande and Julie Michaelson, NWI Region 7 staff, express their gratitude for the material and peer review of the draft provided by NWI’s Regional, Washington Office, and Madison Office personnel: Bill Kirchner, Jim Dick, Brian Huberty, John Swords, Ralph Tiner, Kevin Bon, Bill Wilen, Jo Ann Mills, and Tom Dahl. We also express our appreciation to Region 7 External Affairs (Larry Bell) and Habitat Restoration and Partnership Programs (John Delapp), in particular, Bruce Woods for technical editing and Katrina Mueller for layout. Special thanks go to all the agencies and organizations that have contributed to the NWI in various ways to the success of the NWI over the last year (Appendix A). This report would not have been possible without their contributions.

vi
National Wetlands Inventory Program 2010 Annual Report
This document represents the second annual report of the National Wetlands Inventory (NWI), and focuses on reporting the accomplishments, activities, and involvement in wetlands-related issues by each Region and our National offices. The report highlights a number of completed and ongoing projects.
The NWI Program had 16 staff nationwide during FY 2010. There were Regional Wetlands Coordinators (RWC) in each of the Service’s eight Regions, plus an Assistant in the Alaska Region. Regional staff worked with cooperators to coordinate, analyze, and report wetland information needs within their Region; provided training and technical assistance for the development and uses of NWI data; supported the Regions’ landscape-level planning, analysis, and modeling; provided quality control for produced or contributed wetlands data; assisted on national program development or projects; and responded to customer and national data or information inquiries. Headquarters staff provided coordination, national-level policy and budget support, and training development. The National Standards and Support Team (NSST) in Madison, Wisconsin managed the wetlands geospatial database; delivered the data online to the public; provided data verification, technical assistance, and training; implemented Office of Management and Budget (OMB), Department, and Service IT, security, and information quality assurance requirements; and conducted the national status and trends study. U.S. Geological Survey (USGS) continued to provide support for the NSST through interagency cooperation.
NWI’s 2010 program activities served a wide variety of customers and wetland data needs. Activities
included providing data to address Congressional and Administrative mandates, providing wetland information to Federal, State, and private agencies, and responding to the data needs of the general public. There were more than 55 million customer requests for wetlands information provided by the online resources of NWI, and 32 partner agencies provided funding, products, and services in FY 2010 to enhance NWI program data goals (Appendix A).
Two important focal areas for the NWI program during the 2010 fiscal year were the completion of the national 2010 wetlands status and trends summary and the continued data stewardship for wetlands geospatial data. The program worked collaboratively with governmental and non-governmental agencies to address wetland mapping goals, and implemented current geospatial data collection techniques to enhance mapping efficiencies. Additionally, data distribution was improved through the update of on-line services and the addition of enhanced visual representation capability to the Wetlands Mapper, the data portal for wetlands information.
The Service is responsible for wetlands data stewardship as required by Congress (EWRA) and the OMB (Circular A-16). In FY 2010, these stewardship responsibilities included securing, managing, and distributing existing data and providing coordination, standards maintenance, training, and quality control of contributed data.
NWI is required to provide a national wetlands status and trends report to Congress every ten years. The Service has a 50 year record of wetland trends for the conterminous U.S. and the latest report is to be published in summer of 2011.
Other important publications and reports from the program included: Wetland and Land Use Change in the Willamette Valley 1994-2005, developed together with the Oregon Department of State Lands Wetlands Program; Wetlands of Cape Cod and the Islands, Massachusetts; 2009 Eel Grass Survey of Eastern Long Island Sound, Connecticut, and New York; Wetlands of the Northeast: Results of the National Wetlands Inventory; and Landscape Changes in Coastal Ecosystems, Yukon-Kuskokwim Delta, a retrospective change analysis of Arctic coastal shorelines and estuarine and lacustrine wetland habitats along the Bering Sea coast of the Yukon Delta National Wildlife Refuge, Alaska.
NWI Regional Wetlands Coordinators estimated that, for FY 2010, internal and external partners contributed $1.4 million in products or services to modernize or digitize data for the wetlands layer. Landscape Conservation Cooperatives (LCCs), for example, contributed to projects in Montana for the Plains and Prairie Pothole LLC and in Wisconsin for the Upper Mississippi and Great Lakes LCC. The National Wildlife Refuge System’s Information and Monitoring Program also provided support to update wetland digital data for nine Refuges.
In FY 2010, NWI also provided mapping, analysis, and data delivery technological assistance to the Service and Department of the Interior (DOI) in such areas as geo-Mines (Bureau of Mines); an Oil-Spill Mapper for the Natural Resources of the Gulf during the Deepwater Horizon spill; a DOI cloud-computing pilot; Sea Level Affecting Marshes Model (SLAMM) support; habitat mapping for endangered species (whooping crane migration corridor subject to wind power development, piping plover
Executive Summary
vii
National Wetlands Inventory Program 2010 Annual Report
nesting habitat in ND); threatened species (Howell’s spectacular thelypody, Thelypodium howellii); and invasive species (Phragmites mapping for Lake Huron coastline in Michigan); study site selection for a malformed frog study in Alaska; and wetland functional assessments (NWIPlus completed for Delaware and in various stages for coastal Georgia, Lake Ontario watershed, New Jersey, Connecticut, Massachusetts, and Wisconsin’s St. Croix watershed). These and other activities are discussed in the Regional summaries.
The National Wildlife Refuge System used NWI data in SLAMM simulations for a critical part of
their planning in Comprehensive Conservation Plans (CCPs) for 170 coastal Refuges. Recent updates for coastal Georgia will be used by that State for conservation planning, local ordinance development, wetland assessments, regulatory activities, and restorations. Updated wetlands data for Wells County, North Dakota, will be used by the Service’s Habitat and Population Evaluation Team to identify the current status of wetlands and possible areas for wetlands restoration. The EPA and local and State partners are using NWI updated maps along the Wasatch Front and Great Salt Lake to identify waterfowl and shorebird feeding preferences in order to develop alternate wetland
features in the rapidly expanding urban corridor around Salt Lake City, Utah. Updated Refuge data for the Gulf Coast will be used for oil spill remediation. Regional sections describe these and many other uses of NWI data.
Many activities begun in 2010 will be completed in or continue through 2011. Regions estimated that they will complete more than 56 million acres of modernized data and 18 reports in FY 2011. Updating wetland maps will also be completed for numerous Refuges and other resource priority areas.

viii
National Wetlands Inventory Program 2010 Annual Report
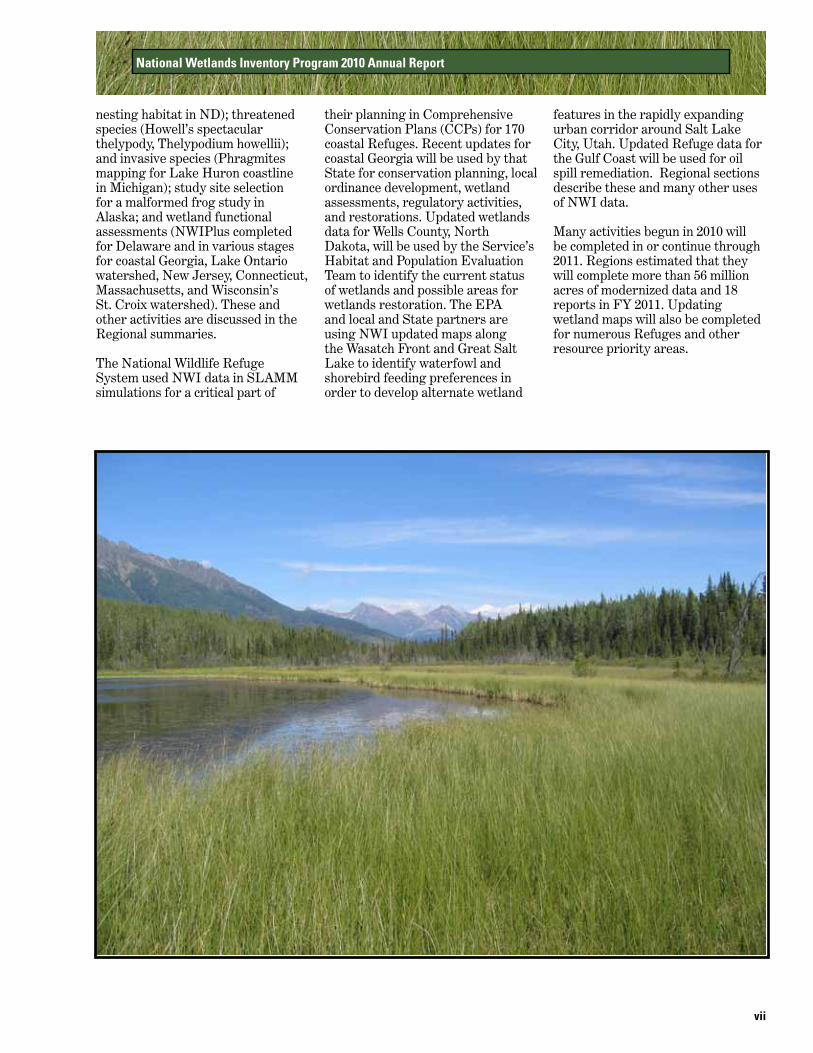
Photo by U.S. Fish and Wildlife Service “Wetlands are the cornerstone of many important and complex ecosystems, providing numerous ecological and economic benefits to fish, wildlife, and people.” On this National Wildlife Refuge, geese settle in at sunset.
1
Wetlands are the cornerstone of many important and complex ecosystems, providing numerous ecological and economical benefits to fish, wildlife, and people. Effective conservation of our Nation’s remaining wetlands requires consistent, reliable information about their locations, characteristics, and values. The Emergency Wetlands Resources Act of 1986 directed the Fish and Wildlife Service (Service) to map the Nation’s wetlands and deepwater habitats and produce information on their characteristics, extent, and status. These products, produced by the National Wetlands Inventory (NWI) over the past 30 years, are tools used to manage, protect, and restore our wetland resources. While the focus of the NWI has been on producing wetland mapping and geospatial data, the Service and its partners are increasingly interested in a much wider variety of wetlands products for use in responding to emerging conservation issues.
Emerging conservation issues related to global climate change
(including sea-level rise, storm flooding, and drought) and domestic energy development have heightened the need for current wetlands data. Recent applications of NWI data now include use in: 1) predicting the impacts of sea-level rise, 2) wetland restoration planning, 3) planning for energy independence (oil and gas exploration, wind power), 4) analyzing carbon sequestration in wetlands, 5) landscape-level or watershed-based wetland characterizations and functional assessments, 6) planning and management for National Wildlife Refuges (including targeting areas for acquisition) and other Federal lands, 7) planning, modeling, research, and monitoring for Strategic Habitat Conservation work by the Service, 8) recovery planning for endangered species, fish, migratory birds, marine mammals, and other imperiled species, and 9) invasive species management (Tiner 2009).
The NWI Program began revising its Strategic Plan in 2010 to more specifically address these emerging
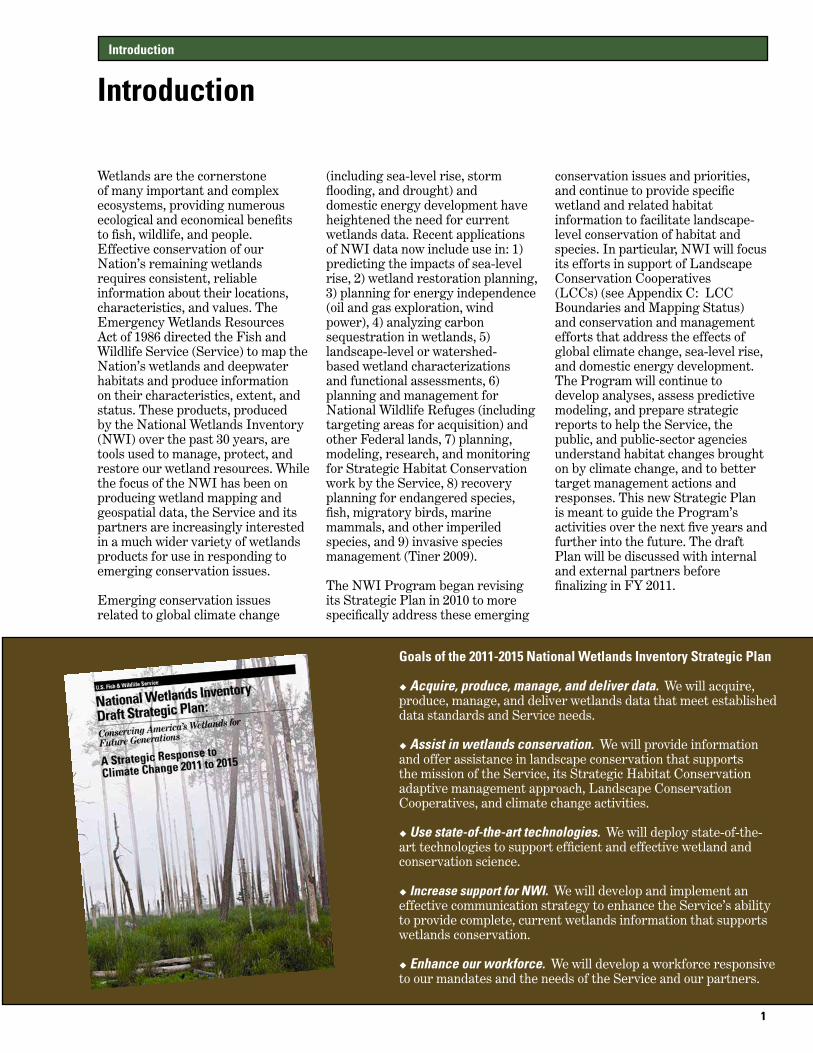
conservation issues and priorities, and continue to provide specific wetland and related habitat information to facilitate landscape-level conservation of habitat and species. In particular, NWI will focus its efforts in support of Landscape Conservation Cooperatives (LCCs) (see Appendix C: LCC Boundaries and Mapping Status) and conservation and management efforts that address the effects of global climate change, sea-level rise, and domestic energy development. The Program will continue to develop analyses, assess predictive modeling, and prepare strategic reports to help the Service, the public, and public-sector agencies understand habitat changes brought on by climate change, and to better target management actions and responses. This new Strategic Plan is meant to guide the Program’s activities over the next five years and further into the future. The draft Plan will be discussed with internal and external partners before finalizing in FY 2011.
Introduction
Goals of the 2011-2015 National Wetlands Inventory Strategic Plan
u Acquire, produce, manage, and deliver data. We will acquire, produce, manage, and deliver wetlands data that meet established data standards and Service needs.
u Assist in wetlands conservation. We will provide information and offer assistance in landscape conservation that supports the mission of the Service, its Strategic Habitat Conservation adaptive management approach, Landscape Conservation Cooperatives, and climate change activities.
u Use state-of-the-art technologies. We will deploy state-of-the-art technologies to support efficient and effective wetland and conservation science.
u Increase support for NWI. We will develop and implement an effective communication strategy to enhance the Service’s ability to provide complete, current wetlands information that supports wetlands conservation.
u Enhance our workforce. We will develop a workforce responsive to our mandates and the needs of the Service and our partners.
Introduction
2
Introduction
The NWI Program has come a long way since its beginnings in the mid-1970s. It has evolved into much more than a mapping and inventory program by providing data and analyses that allow decision-makers to make better informed decisions on the fate of wetlands, and that help educate the American public on wetlands, their values, status, and threats.
NWI produced its first annual report for public distribution in 2009. Tiner (2009) prepared a Status Report of the NWI, providing an introduction to the Program, in addition to a thorough review of its history since the mid-1970s. This report covered the evolution of the NWI to the present, discussed the diversity of
products and activities in which the Program has been involved, and the wide public use of its products. The Status Report also included the first annual progress and activities reporting across the Regions.
This document represents the second annual report of the NWI and focuses on the accomplishments, activities, and involvement in wetlands-related issues by each Region and our National offices. Reporting for 2010 follows in the footsteps of the development of the Draft Strategic Plan for 2011-2015. Although many of the Program’s accomplishments continue in the tradition of our past mapping and geospatial data production, a number of our completed and ongoing
projects highlight the fact that the Program has already been rising to the challenging goals of the 2011-2015 Strategic Plan, and meeting the needs of emerging conservation issues of the Service and the Nation.
References
Tiner, R.W. (editor). 2009. Status Report for the National Wetlands Inventory Program: 2009. U.S. Fish and Wildlife Service, Division of Habitat and Resource Conservation, Branch of Resource and Mapping Support, Arlington, VA. 48 pp.
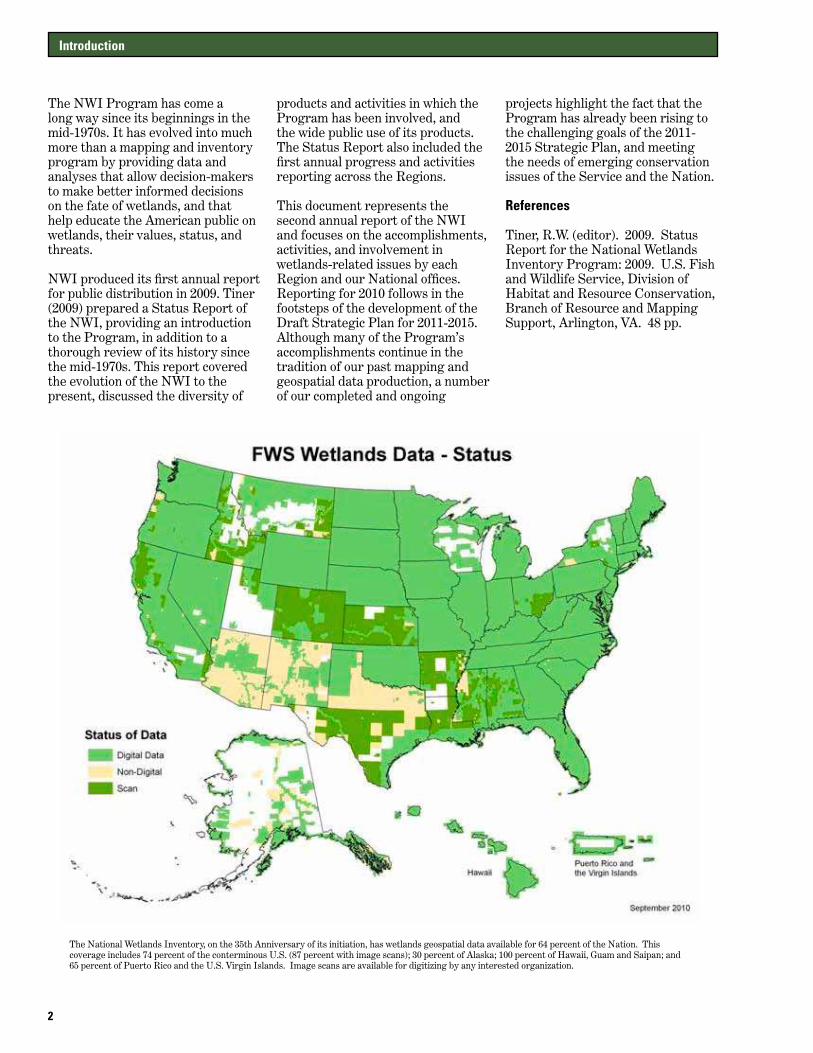
The National Wetlands Inventory, on the 35th Anniversary of its initiation, has wetlands geospatial data available for 64 percent of the Nation. This coverage includes 74 percent of the conterminous U.S. (87 percent with image scans); 30 percent of Alaska; 100 percent of Hawaii, Guam and Saipan; and 65 percent of Puerto Rico and the U.S. Virgin Islands. Image scans are available for digitizing by any interested organization.
3
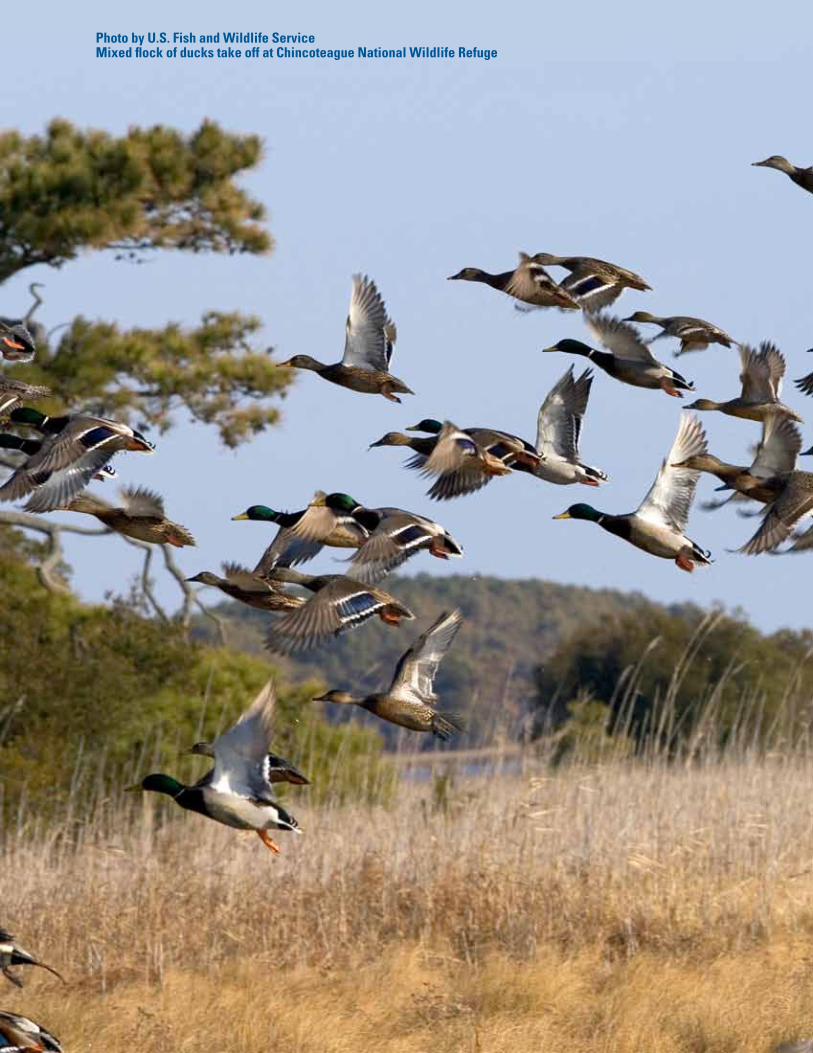
Photo by U.S. Fish and Wildlife Service Mixed flock of ducks take off at Chincoteague National Wildlife Refuge
4
Region 1: Pacific Northwest
For 2010, the Region 1 National Wetland Inventory (the Region) program continued to work with our Federal, State, and nonprofit partners to identify strategic mapping needs (e.g., Great Northern Landscape Conservation Cooperative); analyze changes and trends for the 2010 (national status and trends) report; disseminate habitat information to better identify threats and risks to wetland habitat; and assure that planned projects promote sound decision making.
Mapping Activities
National Wildlife Refuges. The Region’s National Wildlife Refuge (NWR) strategic initiative, started in 2007, targets Refuge lands for National Wetland Inventory updates. The purpose of this initiative was to produce contemporary digital data that allow for more efficient project evaluation and assessment of impacts to species of concern at each Refuge. The digital NWI data are also used for Refuge planning (e.g., Comprehensive Conservation Plans, CCP) and management efforts. Each targeted Refuge has its own unique purpose and separate challenges that need to be addressed in the framework of the CCP. This
year an update for Malheur NWR was completed, and NWI updates for Siletz Bay and Ridgefield NWR were initiated with completion dates expected in 2011.
Yakima River, Washington. This four quad project was funded by the Central Washington Field Office (FO), and the data are being used by the FO to assess the hydrologic impact review of gravel extraction from the floodplain and adjacent wetlands.
Clearwater River, Idaho Digitizing. This digitizing project was initially funded by the Idaho Department of Game and Fish. In 2010, additional funding was received from the NWI program (i.e., $177K) to continue digitizing raster scans in support of data needs for the Great Northern Landscape Conservation Cooperative (LCC). The NWI funding was used to leverage an additional $100K to digitize and complete updates where NWI does not exist. For FY 2010, 40 raster scans were converted to vector (i.e., digital format) data. This work will continue throughout FY 2011 and 2012 until the State has a complete digital wetland data theme.
Special Projects
Stream Mitigation. In collaboration with the Environmental Protection Agency (EPA), the Oregon Department of State Lands, and the Army Corps of Engineers, the Region hosted a workshop to discuss a methodology for stream mitigation for the State. The goal of the workshop was to start the discussion and the initial development of joint and consistent stream mitigation guidance. Historically, compensatory mitigation for impacts to all aquatic systems was in the form of wetland mitigation. However, wetland mitigation does not provide appropriate replacement of aquatic functions lost due to impacts to stream systems. Because of this, the workgroup agreed to require that compensatory mitigation for impacts to stream resources should be in the form of restoration and/or enhancement of degraded stream channels using natural channel design and bio-engineering techniques. Channel preservation of unique or otherwise ecologically important stream segments may also play an important role in mitigating stream impacts.
By Bill Kirchner Regional Wetlands Coordinator USFWS, Region 1, Portland, OR
Region 1: Pacific Northwest
5
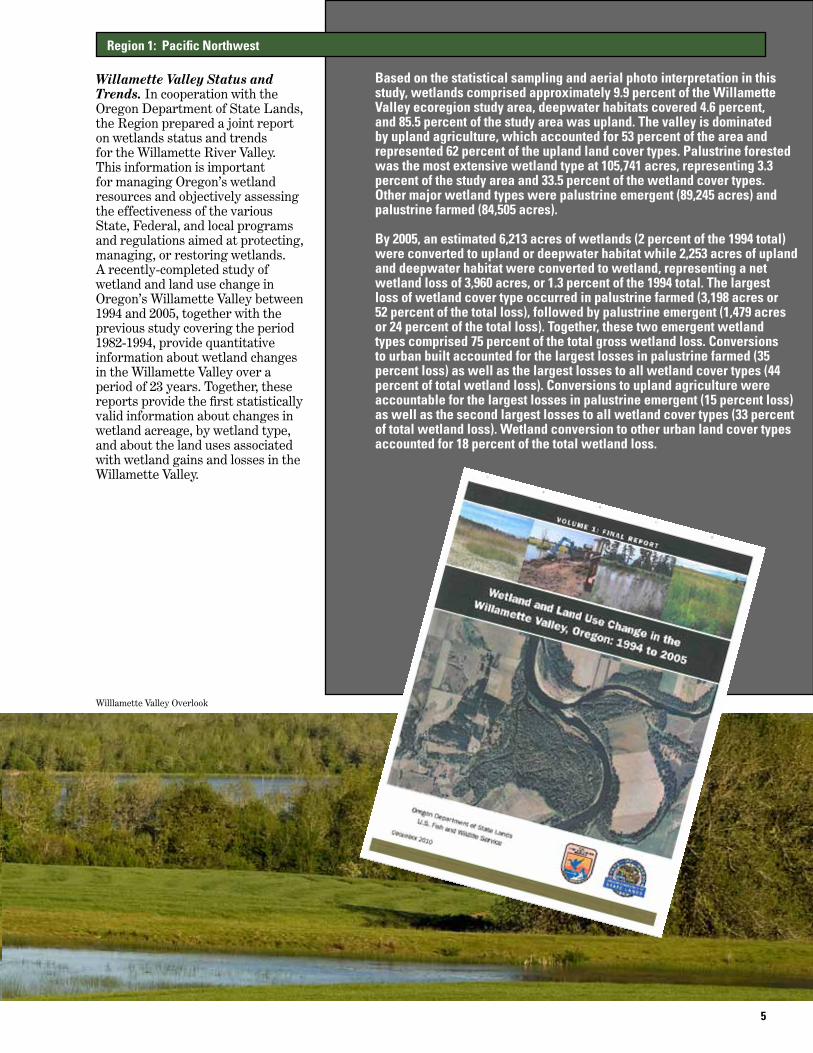
Willamette Valley Status and Trends. In cooperation with the Oregon Department of State Lands, the Region prepared a joint report on wetlands status and trends for the Willamette River Valley. This information is important for managing Oregon’s wetland resources and objectively assessing the effectiveness of the various State, Federal, and local programs and regulations aimed at protecting, managing, or restoring wetlands. A recently-completed study of wetland and land use change in Oregon’s Willamette Valley between 1994 and 2005, together with the previous study covering the period 1982-1994, provide quantitative information about wetland changes in the Willamette Valley over a period of 23 years. Together, these reports provide the first statistically valid information about changes in wetland acreage, by wetland type, and about the land uses associated with wetland gains and losses in the Willamette Valley.
Region 1: Pacific Northwest
Based on the statistical sampling and aerial photo interpretation in this study, wetlands comprised approximately 9.9 percent of the Willamette Valley ecoregion study area, deepwater habitats covered 4.6 percent, and 85.5 percent of the study area was upland. The valley is dominated by upland agriculture, which accounted for 53 percent of the area and represented 62 percent of the upland land cover types. Palustrine forested was the most extensive wetland type at 105,741 acres, representing 3.3 percent of the study area and 33.5 percent of the wetland cover types. Other major wetland types were palustrine emergent (89,245 acres) and palustrine farmed (84,505 acres).
By 2005, an estimated 6,213 acres of wetlands (2 percent of the 1994 total) were converted to upland or deepwater habitat while 2,253 acres of upland and deepwater habitat were converted to wetland, representing a net wetland loss of 3,960 acres, or 1.3 percent of the 1994 total. The largest loss of wetland cover type occurred in palustrine farmed (3,198 acres or 52 percent of the total loss), followed by palustrine emergent (1,479 acres or 24 percent of the total loss). Together, these two emergent wetland types comprised 75 percent of the total gross wetland loss. Conversions to urban built accounted for the largest losses in palustrine farmed (35 percent loss) as well as the largest losses to all wetland cover types (44 percent of total wetland loss). Conversions to upland agriculture were accountable for the largest losses in palustrine emergent (15 percent loss) as well as the second largest losses to all wetland cover types (33 percent of total wetland loss). Wetland conversion to other urban land cover types accounted for 18 percent of the total wetland loss.
Willlamette Valley Overlook
6
Region 1: Pacific Northwest
2010 National Status and Trends Study. In 2010, the Region provided technical and field verification support for the change analysis on all national status and trends plots in the two Pacific regions as well as plots in Utah and Montana. NWI also conducted the review and analysis for 290 new west coast plots that were added to support the Environmental Protection Agency’s 2011 Wetland Condition Assessment report. The addition of the 290 new plots will also provide a sufficient sample size from which to draw statistically valid conclusions about west coast coastal changes and losses. This will enable the program to develop the first status and trends report for the Pacific coastal watersheds, in cooperation with the National Ocean Atmospheric Administration (NOAA).
Sea Level Affecting Marshes Model (SLAMM). The Region prepared and delivered a presentation on the elements and inputs for the Sea Level Rise Affecting Marshes Model (SLAMM) to the Coastal/Partners Division Chief and the Coastal Coordinator. The Coastal and Partners programs are now integrating the results of the model into their funding decision for coastal restoration projects. Modeling of west coast Refuges continued in 2010. For 2011, the Region will continue to support development of SLAMM simulations for the Region’s coastal Refuges (e.g., Siletz Bay National Wildlife Refuge) and is also planning a Siletz Bay study to validate the model outputs.
Coordination with Others
National Wetland Plant Panel (NWPP). The Region has provided national direction and leadership for updating the National List of Plants that Occur in Wetlands since 2009 (https://wetland_plants.usace.army.mil ). Work is coordinated with the U.S. Army Corps of Engineers (USACE), U.S. Natural Resource Conservation Service (NRCS), and the U.S. Environmental Protection Agency (EPA). Regional representatives for all four agencies were selected and a website was developed for their use on voting for
the wetland indicator status of each species (i.e., obligate, facultative wet, facultative, or upland). The Regional panels completed two rounds of voting on the 8,544 species in 2010. After the Regional Panels voted, a list of species that had no ratings was developed and presented to botanical experts for their input and vote. The draft list from this process was reviewed by the NWPP and the draft List was prepared for the Federal Register Notice. The response to public comments and finalizing the List will be completed in 2011.
Hawaii Partnership. There are 410 species in Hawaii on the Federal Endangered Species list and many are associated with stream and wetland habitats. The Region is working with the State and the Pacific Islands Field Office on a funding strategy to update wetlands data for the remaining islands to aid decision-making on conservation actions needed to perpetuate the unique natural resources of the Pacific Islands.
With the completion of the update for Kauai, the Region is working with the Pacific Islands Field Office and the State to have the Alikai Swamp, a high elevation wetland, designated as a World Wetland Ramsar Site.
Idaho Partnership. The Region is working with the Great Northern LCC and the Bureau of Land Management to convert scans into digital data, update maps, and create new data for unmapped areas. The Service is interested in updating and modernizing 102 quads in the Coeur d’Alene River Basin to be used by the Natural Resource Damage Assessment and Restoration Trustees for wetland restoration planning. Additionally, inventory data was used to delineate feeding habitat for tundra swans in the Coeur d’Alene Basin. The map was then used in the calculation of the injury to this species from the release of lead into the feeding habitat and damages associated with a Natural Resource Damage Assessment and Restoration case.
Oregon Partnership. The Oregon Watershed Enhancement Board (OWEB), the Wetland Conservancy, and the Region are working together to complete the digital wetland data theme for the State. In a joint funding effort, the Region and OWEB funded a scalable mapping project to be conducted by the Wetlands Conservancy. Funds were used to update the 94 outdated NWI maps from the 1970’s in Oregon’s Coast Range. Work was completed by the Oregon Natural Heritage Information Centers Institute for Natural Resources at Oregon State University in conjunction with the development of the Oregon Wetlands Explorer portal (http://oregonexplorer.info/). The Explorer supports the conservation and restoration of Oregon’s wetlands through a variety of multimedia stories, data collections, mapping tools, and other wetland resources. The intent has been to create a single web-based source for information on wetlands in Oregon that will improve decision-making for wetlands restoration and protection programs and projects. This portal provides analytical and mapping tools and information to the public, decision makers, environmental professionals and land managers. Uses of the Explorer include: wetland mapping; finding priority areas for wetland mitigation; and learning about Oregon’s Greatest Wetlands, wetland restoration, history, ecology, and classification.
In 2007, the Oregon Department of State Lands, OWEB, and the Region planned a coastal status and trend study to evaluate losses of coastal resources. The project was not completed due to insufficient funding, but the updated NWI data are available for a status and trends analysis. In 2011, the Region will work with the State to fund and complete a trend analysis as originally proposed.
The Region is working with the Field Office to map suitable habitat for Howell’s spectacular thelypody (Thelypodium howellii). This species was federally listed as threatened without critical habitat in 1999, and a draft recovery plan was completed in
7
2001. In 2010, the Region used NWI data with digital hydric soils data to identify suitable habitat for this facultative wetland plant.
Washington Partnership. The Region and Ducks Unlimited are interested in updating the channeled scablands of eastern Washington. The scablands were created by glaciers and cataclysmic floods, and provide extremely important waterfowl breeding habitat for species such as mallards, redhead, teal, ruddy ducks, and large Canada geese. The Service will continue ongoing mapping for the Ridgefield National Wildlife Refuge and will likely start Willapa and Julia Hansen Butler Refuges in 2011.
In coordination with the Spokane Field Office, a contaminants site sampling plan for Lake Roosevelt was developed using NWI data. The sampling plan is being used to assess contaminant levels and injuries to trust resource that may be occurring from the release of hazardous materials. The area is under investigation by the Service and the Environmental Protection Agency for a release of hazardous material that could injure Service trust resources.
Projects in Progress for 2011
National Wildlife Refuges. National Wetland Inventory wetland map updates will continue on the following Refuges in 2011:
Siletz Bay NWR was established to protect salt marsh, brackish marsh, tidal sloughs, mudflats, and coniferous and deciduous forestland. The Refuge provides nursery grounds for coho and Chinook salmon, steelhead, and cutthroat trout. The Refuge’s primary ecological goal is to allow the salt marsh to return to its natural tidally-influenced state. To this end, a 100-acre tidal marsh restoration
project was completed on Millport Slough through a partnership between the Service, Ducks Unlimited, and the Confederated Tribes of the Siletz Indians. The restoration involved breaching 220 feet of dike, removing two dikes totaling 9,300 feet, and filling 1,200 feet of artificial ditches. Large woody debris was placed in the marsh to improve habitat for anadromous fish.
Ridgefield NWR was established in 1965 in response to a need to establish winter habitat for the dusky Canada goose, whose nesting areas in Alaska were severely impacted by the violent earthquake of 1964. The Refuge has a total of 5,218 acres of marshes, grasslands, and woodlands, and preservation of the natural Columbia River floodplain is the management objective.
The following Refuges are currently planned for updates starting in 2011, with funding provided by NWI and Refuges, and are expected to be completed in 2012:
• Willapa and Julia Butler Hansen NWRs in Washington.
• Kootenai NWR in Idaho’s Panhandle.
• Kealia Pond NWR on Maui.
• Bandon Marsh NWR in Oregon.
Great Northern Landscape Conservation Cooperative (LCC). The Region plans to continue the ongoing work (i.e., raster scans to vector, and update to 2009 imagery) for the LCC. Work in 2011 will focus on the Coeur d’Alene River Basin.
Bureau of Land Management (BLM). The Region is working under a reimbursable agreement with the BLM to convert existing NWI scans in southwest Idaho to vector data. The work will progress
from the southwest to the southeast, and finally to north of the Snake River, until all BLM lands in Idaho have digital coverage. Once the project is completed the data will be shared with the Great Basin LCC.
Other Activities
Converting Scanned Maps. The Region is converting scanned maps. Converting raster scan to vector (i.e., digital format) data, with a twist. For Idaho scans, the converted line work is overlaid on 2009 NAIP imagery and spatially adjusted. Corrections are made for stream meandering, deleting wetland polygons that are no longer present, and adding wetlands and ponds developed since the initial photo interpretation. Depending on the complexity of the stream network and wetland polygons, an update can be produced in a day or less. This process is more efficient than starting an update from scratch, which takes a week or more per quad. The saving in time means we could get more data up on the Master Geodatabase if we convert scans to digital data and do a quick update on new imagery to bring the data current. A paper entitled “Converting Scanned NWI Raster Data into Vector Form Using ArcScan” was written about the cost- saving process.
References
Morlan, J., E.F. Blok, J. Miner and B. Kirchner. 2010. Wetland and Land Use Change in the Willamette Valley, Oregon: 1994 to 2005. Oregon Department of State Lands, Salem, Oregon and U.S. Fish and Wildlife Service, Portland, Oregon.
Griffin, R.K. and T.D O’Neill. 2010. Converting Scanned NWI Raster Data Into Vector Form Using ArcScan. SWCA Environmental Consulting, Portland, Oregon.
Region 1: Pacific Northwest

8
Region 2: Southwest
Region 2: Southwest By Jim Dick Regional Wetlands Coordinator USFWS, Region 2, Albuquerque, NM
Mapping Activities
National Status and Trends. In 2010, the Region’s primary focus was completion of 911 plots for the national status and trends study. Interpretation and change analysis was completed for 293 Texas plots, 525 Louisiana plots, 30 New Mexico plots, and 63 Oklahoma plots (QC only). These status and trends plots document natural and man-made changes throughout the south-central states, including imperiled wetland habitats along the Texas and Louisiana coasts.
Update Mapping/Climate Change. Due to the Region’s primary focus on status and trends, only a limited quantity of wetland update work was completed. Eighteen quads were updated along the coastal bend of Texas, which includes the Aransas National Wildlife Refuge. This area mapping was accomplished through a cooperative partnership
with Virginia Tech University, using advanced image-recognition remote sensing software to accurately identify and delineate these complex wetland habitats. This data was updated to develop sea-level rise models using the Sea Level Affecting Marshes Model (SLAMM) for this area of the Texas coast.
This particular area of the Texas coast has a significant population of wintering whooping cranes. The Service’s Ecological Services and Coastal Programs are concerned about how climate change may affect these wintering habitats. With the modeling nearly completed, these programs will get their first look at potential climate change/sea-level rise scenarios for this area.
Contributed Digital Data. More than 33 million acres of digitized NWI data was added the Wetlands Master Geodatabase and Wetlands Mapper in 2010. The Oklahoma
Conservation Commission, in conjunction with Oklahoma State University, digitized existing NWI hard-copy maps for approximately four million acres (112 quads) of Oklahoma. This 5-year process (funded by EPA) brought the State of Oklahoma’s wetlands data layer to 100 percent completion, making it the first State in the Region to have complete digital wetlands coverage.
USDA’s Forest Service funded the digitizing of existing NWI hard-copy maps for more than 29 million acres (656 quads) covering US National Forests in Arizona and New Mexico, as part of an interagency initiative to populate the wetlands layer of the National Spatial Data Infrastructure. These data, digitized cooperatively through the Tennessee Valley Authority, will be used by the Forest Service as a baseline dataset to track changes to wetland habitats and develop wetland restoration strategies.
New Mexico Project Assistance: Aiding the Development of State-Level Wetlands Legislation
Region 2 completed new and updated mapping for all US Forest Service Wilderness Areas in New Mexico, covering over 1.4 million acres of pristine alpine and subalpine terrain throughout the State. The State petitioned to designate all surface waters in Wilderness Areas, including these fragile wetland systems, as Outstanding National Resource Waters (ONRW; Clean Water Act designation). This is a first step in developing broader wetlands protection legislation for wetlands in the State of New Mexico. NWI will play a vital role in the initial development of this process by providing data, field assistance, and any other wetland-related expertise needed by the State.
Excerpt from a letter to the Regional NWI Wetlands Coordinator from the New Mexico State Wetlands Program Coordinator:“I wanted to thank you (NWI) again for your invaluable help in getting 4,930 acres of Wetlands in FS Wilderness areas in New Mexico designated as Outstanding National Resource Waters (ONRW). In order to designate waters, they have to be mapped and you so generously mapped these wetlands for us on a tight deadline. Without your help, there would not be wetlands included in this designation. ONRW status is authorized under the State Water Quality Act and the Federal Clean Water Act. The designation will protect approximately 700 miles of 195 perennial rivers and streams, 29 lakes, and approximately 4,930 acres of 1,405 wetlands in 12 Wilderness areas. These waters represent the State’s most valuable headwater streams. Protection of these headwaters will help maintain a clean water supply for uses in Wilderness and for downstream uses by municipalities, agriculture, and recreational interests, and will help maintain healthy ecosystems, preserve habitat, and protect vulnerable and endangered species. Although wetlands are considered waters of the State, this is the first time water quality standards will be specifically applied to wetlands as part of the State Water Quality Act. The part of the Act that applies is the anti-degradation clause which states that these waters and wetlands cannot be degraded from their present state, and that any degradation could be a violation of State regulations.”
9
Special Projects
New Mexico Wilderness Wetlands Protection. New Mexico is developing legislation to protect wetlands in Wilderness areas, an effort that represents the first of its kind for Service Wilderness Areas. The NWI coordinator has personally assisted the State in these efforts for many years. This successful collaborative effort to complete riparian- and watershed-based wetlands assessments has been recognized by State officials. The State of New Mexico may someday broaden this protected designation to roadless areas adjacent to Wilderness Areas. Currently, the State is developing project work areas to continue this effort. Further wetlands mapping efforts are anticipated in FY 2011.
Whooping Crane Stopover Habitat Pilot Study. A pilot study was begun in 2010 and will continue into 2011 to update NWI data within the whooping crane migratory corridor. Texas Tech University will work cooperatively to assist the Southwest and Rocky Mountain Regions by updating wetlands data in Oklahoma and Kansas. The data will be analyzed to determine if Cowardin wetland type classification (Cowardin et al. 1979) can be used to identify potential stopover habitats for these birds during their migration. The cranes have specific requirements for stopover habitats. If NWI data can identify areas meeting these criteria, it will provide an invaluable aid to energy development projects (wind power and transmission projects) and will assist with whooping crane recovery.
The whooping crane corridor nearly bisects the Great Plains LCC and ends in the Gulf Coast Plains and Ozarks LCC. Little work has been done on stopover habitats in Kansas, Oklahoma, and inland Texas due to the lack of current or digital NWI data. This project will begin to fill those data gaps.
Region 2: Southwest
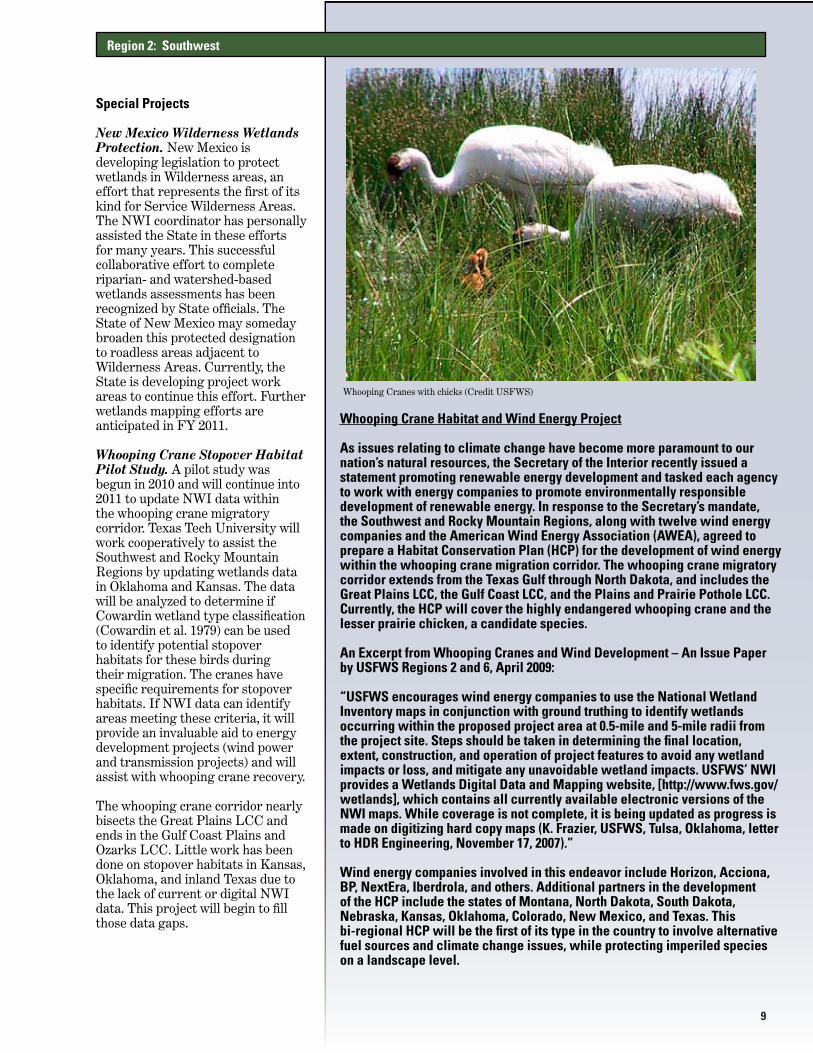
Whooping Crane Habitat and Wind Energy Project
As issues relating to climate change have become more paramount to our nation’s natural resources, the Secretary of the Interior recently issued a statement promoting renewable energy development and tasked each agency to work with energy companies to promote environmentally responsible development of renewable energy. In response to the Secretary’s mandate, the Southwest and Rocky Mountain Regions, along with twelve wind energy companies and the American Wind Energy Association (AWEA), agreed to prepare a Habitat Conservation Plan (HCP) for the development of wind energy within the whooping crane migration corridor. The whooping crane migratory corridor extends from the Texas Gulf through North Dakota, and includes the Great Plains LCC, the Gulf Coast LCC, and the Plains and Prairie Pothole LCC. Currently, the HCP will cover the highly endangered whooping crane and the lesser prairie chicken, a candidate species.
An Excerpt from Whooping Cranes and Wind Development – An Issue Paper by USFWS Regions 2 and 6, April 2009:
“USFWS encourages wind energy companies to use the National Wetland Inventory maps in conjunction with ground truthing to identify wetlands occurring within the proposed project area at 0.5-mile and 5-mile radii from the project site. Steps should be taken in determining the final location, extent, construction, and operation of project features to avoid any wetland impacts or loss, and mitigate any unavoidable wetland impacts. USFWS’ NWI provides a Wetlands Digital Data and Mapping website, [http://www.fws.gov/wetlands], which contains all currently available electronic versions of the NWI maps. While coverage is not complete, it is being updated as progress is made on digitizing hard copy maps (K. Frazier, USFWS, Tulsa, Oklahoma, letter to HDR Engineering, November 17, 2007).”
Wind energy companies involved in this endeavor include Horizon, Acciona, BP, NextEra, Iberdrola, and others. Additional partners in the development of the HCP include the states of Montana, North Dakota, South Dakota, Nebraska, Kansas, Oklahoma, Colorado, New Mexico, and Texas. This bi-regional HCP will be the first of its type in the country to involve alternative fuel sources and climate change issues, while protecting imperiled species on a landscape level.
Whooping Cranes with chicks (Credit USFWS)
10
Region 2: Southwest
Coordination with Others
USGS/Texas Tech University Agreements - Climate Change and Energy. The Southwest Region initiated an Interagency Agreement with the US Geological Survey’s Texas Cooperative Fish and Wildlife Research Unit at Texas Tech University (USGS-TTU) to cooperate on digital mapping and data analysis. This project is investigating the feasibility of developing ecological models to study potential effects of climate change on the playa lakes of the Southern Great Plains.
Working cooperatively with the Region, the Texas Tech Geography Department, Center for Geospatial Technology, completed the updated mapping for the Texas Panhandle. Students were trained in applying the Cowardin wetland classification system standard and photo interpretation techniques. This project will also involve the collection and assessment of various climatic and meteorological datasets, as well as site-specific field data from monitored playa lakes to determine the feasibility of developing climate change models for the playa lakes region. NWI staff, with University personnel, will shortly begin the model development process.
Texas Tech University will also work cooperatively with the Southwest and Rocky Mountain Regions to update wetlands data in Oklahoma and Kansas in a pilot study for the whooping crane migratory corridor (see Special Projects). The cranes have specific requirements for stopover habitats. If NWI data can identify areas that meet these requirements, it will be an invaluable aid to energy development projects such as wind power and transmission projects, and will assist with recovery of the whooping crane.
USGS/National Wetlands Research Center Agreement - Climate Change and Sea-level Rise. An Interagency Agreement with the US Geological Survey/ National Wetlands Research Center in Lafayette, LA, was initiated to fund the first phase of digital wetlands
mapping on the south Texas Coast, including Laguna Atascosa National Wildlife Refuge, which comprises a large percentage of the area to be updated. These unique coastal wetland areas provide habitat for a variety of migratory and shorebird species as well as abundant fishery resources and sea turtle breeding areas. This area is highly susceptible to development, hurricanes/tropical storms, and long-term global climate change threats such as sea-level rise and changing precipitation patterns.
University of Oklahoma Agreement - Service/Refuge Support. With late FY 2010 funding provided from the National Wildlife Refuge System Inventory and Monitoring (I&M) initiative, the Region set up a Cooperative Ecosystems Study Unit (CESU) agreement with the University of Oklahoma to update the wetland and riparian data layers for the Washita NWR. The project is in its initial phases, but will be set up to address potential future Refuge I&M update projects.
All of these agreements tie into the Regional Climate Change Geographic Framework. Both the Texas Coast and the Southern Great Plains are primary areas of interest for the Region for implementing Strategic Habitat Conservation (SHC) techniques as applied to the issues of climate change effects on species and their habitats. NWI is now participating in both of these areas through these partnerships.
Tribal Project Assistance - Climate Change and Energy. The Navajo Nation completed its effort to digitally map the entire Reservation covering 378 quads in New Mexico, Colorado, Utah, and Arizona. The Region provided initial training in applying the Cowardin wetland mapping system and photo interpretation. In the spirit of inter-Regional cooperation, the Pacific Northwest Region spearheaded the data quality control process to expedite the Service’s quality requirements. This data will play a critical role with upcoming energy development and potential climate change issues. The Navajo Nation
has taken a proactive approach to satisfying its wetland data needs.
New Mexico Project Assistance - Development of Wetlands Legislation. The Region completed new and updated mapping for all USDA Forest Service Wilderness Areas in New Mexico, covering over 1.4 million acres of pristine alpine and subalpine terrain throughout the State (see Special Projects). NWI will continue this cooperation for future wetlands protection.
The State’s Surface Water Quality Bureau (SWQB) initiated an EPA-funded project to update digital wetlands data for the Canadian River Watershed and northeastern New Mexico. As part of the State of New Mexico Wetlands Work Group, the Region will provide any needed guidance and project support and development assistance to the SWQB. All wetland and riparian data collected will conform to national and Service standards. This project will also include a landscape-level functional assessment [Landscape Position, Landform, Water Flow Path, and Waterbody Type (LLWW)] as part of the final product.
National Riparian Data Steward. The NWI Regional Coordinator is the national Riparian Data Steward. Responsibilities include updating the riparian data collection documentation, A System for Mapping Riparian Areas in the Western United States (USFWS 2009). Originally drafted in the late nineties, this document described methods for identifying and mapping riparian habitats and has been adopted as a Data Layer Standard by the Service. Though complete in its concepts, the mapping methodology was dated. The document has been brought up to date to address these changes in methodology and recent technical advances in the Program, and is available for viewing/download on the NWI website (http://www.fws.gov/wetlands/).
Regional/State/National Climate Change and LCC Coordination. NWI staff provided a variety of
11
services to the Region beyond NWI activities. Currently the Regional coordinator also participates on the Technical Sub-Group Regional Climate Change Team. The Team is developing support documentation for the development of the Regional Geographic Framework on which all climate change activities will be based. The Team also works as a conduit, disseminating information on climate change activities to the Washington Office, the Regional Directorate, and the different programs and personnel throughout the Region. In conjunction with this role, the Region participated in the Service’s Climate Change/LCC data needs workshop held March 30-April 1, 2010, at the Service’s National Conservation Training Center (NCTC). This workshop for LCC Coordinators, FWS regional and program staff, and LCC partners (from within DOI and beyond) was held to define LCC data needs, address the need for data integration, and explore tools to form a seamless data network for LCCs.
In a similar role, the Region participated in the Western Governors’ Association data integration meeting in Denver in April 2010, serving on a Federal panel of geographic and spatial data experts that provided the western States’ representatives with insight and information gained at the previous NCTC meeting on data integration issues.
Projects in Progress for 2011
Ongoing Work in Great Plains LCC - Partnering with TTU and UO. Wetland updates and new mapping and data collection are ongoing in the Great Plains LCC. The Texas Tech University (TTU) four-county project area for whooping crane stopover habitat is about 75 percent complete. At the end of calendar year 2010, Regional LCC funds were allocated to NWI to continue “filling in the gaps” for wetlands data in the Great Plains LCC. Contracting with the Oklahoma Biological Survey, University of Oklahoma (UO), update and new wetlands mapping data collection is underway in nine
counties in New Mexico, Kansas, and Oklahoma. Six habitat types have been identified as potential priorities within the Great Plains LCC area [short grass and mixed grass prairies, playa wetlands, riparian streams, prairie rivers, cross-timbers (Central OK/TX Plains), savannahs, shrub lands, and sand dune systems]. NWI is helping to meet the scientific needs of this LCC by providing data for three of the six LCC priority habitats.
Extension of USGS Interagency Agreement for Coastal Mapping - Update Mapping Data for SLAMM. NWI update mapping is also ongoing on the Texas coast. NWI and the USGS National Wetlands Research Center (NWRC) are in the process of extending the current interagency agreement. The extension will foster interagency partnerships for ongoing wetland mapping and data collection activities to benefit two Gulf Coast LCCs and the Gulf Coast Regional Climate Science Center. The NWRC has recently completed mapping of the south Texas coast including Laguna Atascosa NWR. These data will feed into Refuge habitat assessments and sea-level rise modeling (SLAMM). Potential work is also being discussed related to the Deepwater Horizon oil spill and further sea-level rise modeling for the Texas coastal Refuges.
Building Regional Capacity -New Blood for the NWI Program. The NWI office now has two new wetland interpreters on staff. The new biologists will bring increased wetland mapping capacity to the Region, aid in the quality control process for incoming contributed data, and provide assistance to the National mapping effort as needed. These biologists represent the next generation of NWI wetland scientists, ensuring the future of the NWI expertise and national standards.
Potential Refuge Inventory and Monitoring Mapping. NWI is once again looking to work with the National Wildlife Refuge System to aid its I&M Program. Two more Refuges, Anahwac and McFaddon, in two different LCC project proposals,
were approved for 2011 funding. The primary focus in 2011 will be the Texas coast, where updated wetlands data are needed to run sea-level rise models for Refuge CCPs.
Working with the State of Arizona. After a short hiatus, mapping efforts have been reinitiated with the State of Arizona and the University of Arizona to complete the digital wetlands data layer for the State. Meetings to facilitate wetlands interpretation have taken place recently to have a preliminary look at new digital data for the two pilot areas in central Arizona. Work will be ongoing throughout 2011.
Working with the State of New Mexico. On the heels of the very successful New Mexico Wilderness mapping effort, which helped initiate statewide wetlands protection legislation, the State of New Mexico and NWI will continue efforts to map and gain protection for wetlands throughout the State. Work is ongoing in the La Cienega watershed south of Santa Fe (spring fed/riverine systems) and in northeastern New Mexico (Canadian River watershed/playa lakes). The Region will continue to provide mapping and technical support to the State and its contractors as these projects progress through 2011.
Region 2: Southwest
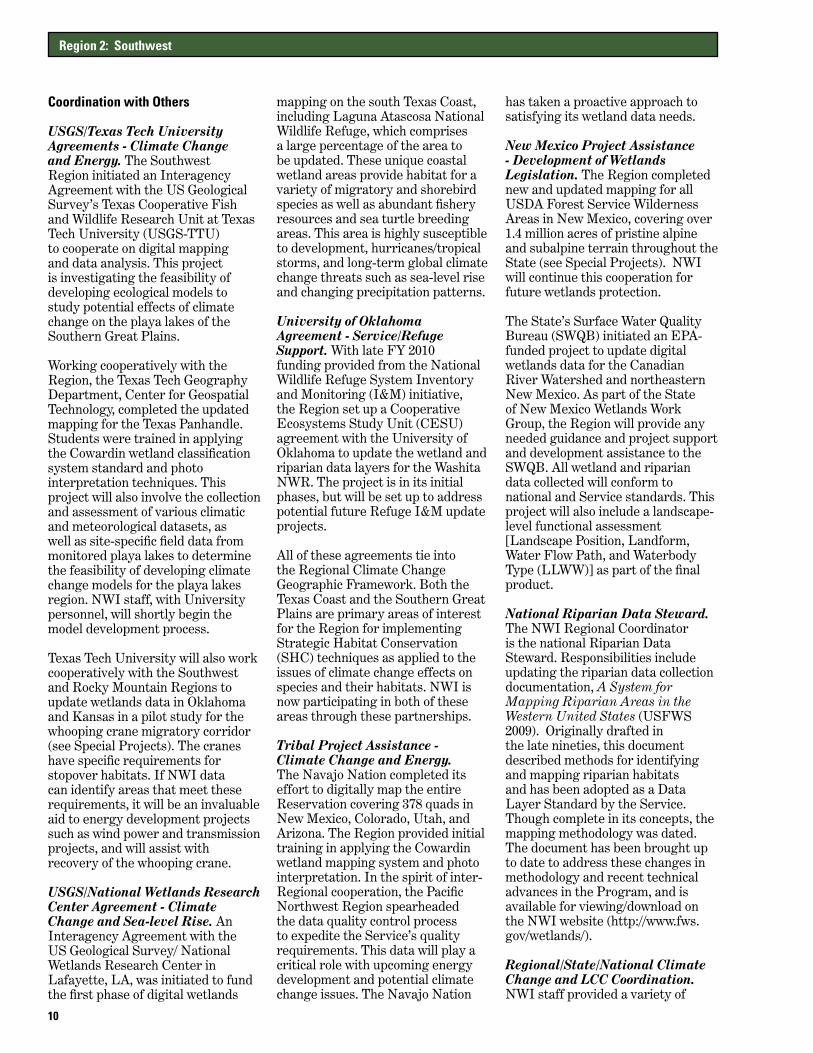
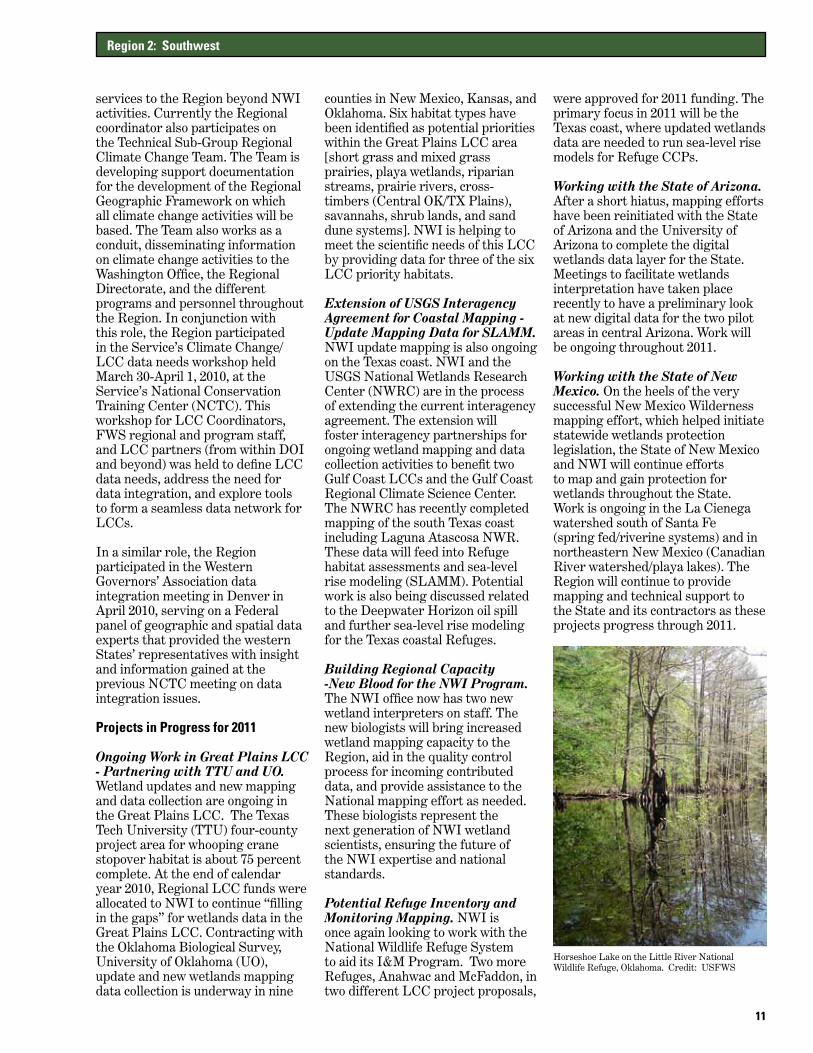
Horseshoe Lake on the Little River National Wildlife Refuge, Oklahoma. Credit: USFWS
12
For 2010 and into 2011, the regional National Wetland Inventory program continues to work with a variety of International, Federal, Tribal, State, Local, and nonprofit partners to strategically map and assess the Great Lakes and Upper Mississippi River Basins. These partnerships are critical to developing the current picture of our changing wetlands and habitats across the landscape upon which the Service and our partners focus their natural resource management decisions.
Partnership Projects
Great Lakes Restoration Initiative. Work for 2010 was dominated by the Great Lakes Restoration Initiative (GLRI), which will continue into 2011. This unique project, mandated by the President and Congress, is designed to help restore the Great Lakes Basin. Central to restoration is the requirement to first understand the baseline conditions for the Great Lakes Basin. Updating and upgrading the NWI is a key factor to understanding the Basin’s wetlands and habitats.
The Region started working on a habitat assessment and accounting system for the Great Lakes, in 2010, which included updating the NWI for the Basin. In addition to helping support NWI update mapping, the Region is leading wetland invasive species mapping, improved habitat modeling, and shared geospatial data access for the project. NWI in the Northeast Region is leading wetland updates for its portion of the Great Lakes Watershed as well as developing wetland functional assessment enhancements.
Phragmites and Wetland Extent Mapping Project. One of the significant needs for the Great Lakes Basin has been the capability to map forested wetlands and invasive
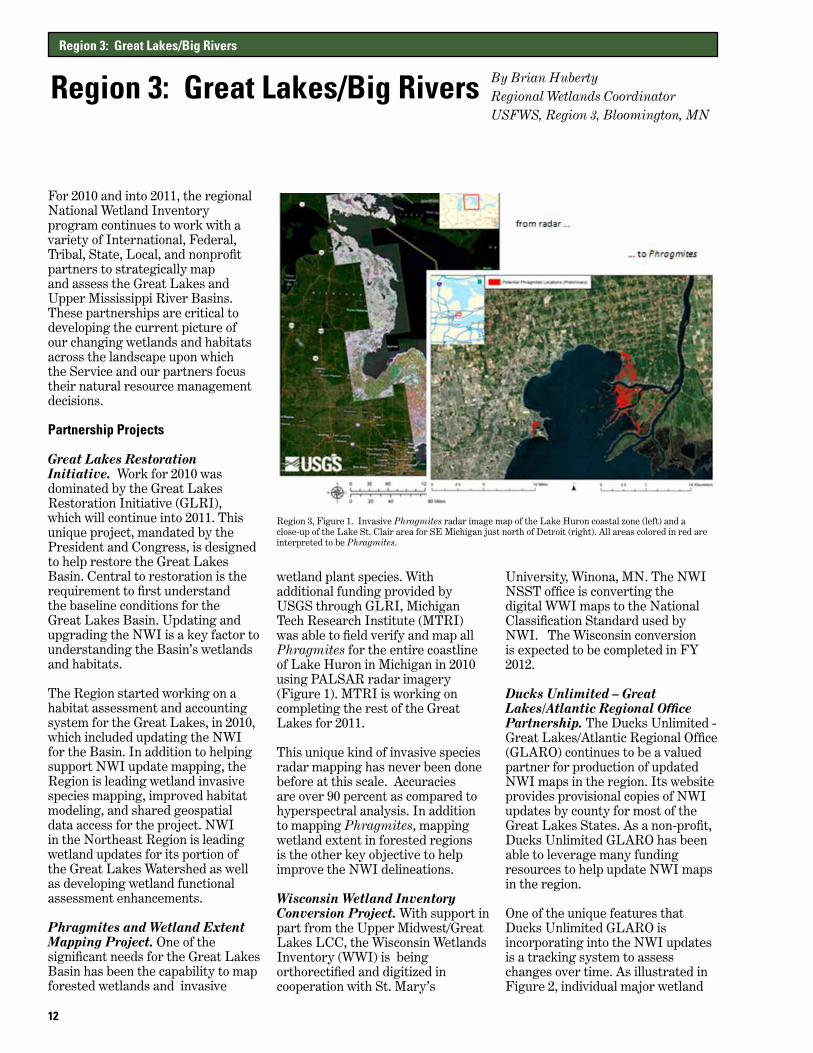
wetland plant species. With additional funding provided by USGS through GLRI, Michigan Tech Research Institute (MTRI) was able to field verify and map all Phragmites for the entire coastline of Lake Huron in Michigan in 2010 using PALSAR radar imagery (Figure 1). MTRI is working on completing the rest of the Great Lakes for 2011.
This unique kind of invasive species radar mapping has never been done before at this scale. Accuracies are over 90 percent as compared to hyperspectral analysis. In addition to mapping Phragmites, mapping wetland extent in forested regions is the other key objective to help improve the NWI delineations.
Wisconsin Wetland Inventory Conversion Project. With support in part from the Upper Midwest/Great Lakes LCC, the Wisconsin Wetlands Inventory (WWI) is being orthorectified and digitized in cooperation with St. Mary’s
University, Winona, MN. The NWI NSST office is converting the digital WWI maps to the National Classification Standard used by NWI. The Wisconsin conversion is expected to be completed in FY 2012.
Ducks Unlimited – Great Lakes/Atlantic Regional Office Partnership. The Ducks Unlimited - Great Lakes/Atlantic Regional Office (GLARO) continues to be a valued partner for production of updated NWI maps in the region. Its website provides provisional copies of NWI updates by county for most of the Great Lakes States. As a non-profit, Ducks Unlimited GLARO has been able to leverage many funding resources to help update NWI maps in the region.
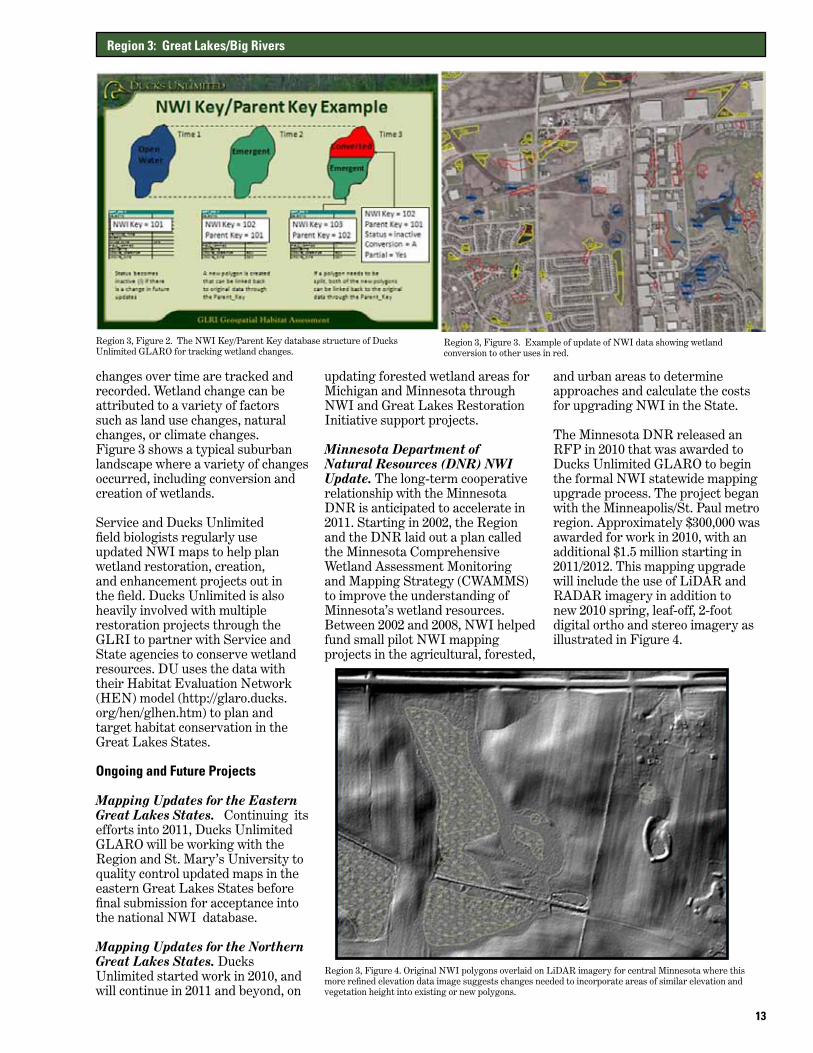
One of the unique features that Ducks Unlimited GLARO is incorporating into the NWI updates is a tracking system to assess changes over time. As illustrated in Figure 2, individual major wetland
Region 3: Great Lakes/Big Rivers
Region 3: Great Lakes/Big Rivers By Brian HubertyRegional Wetlands CoordinatorUSFWS, Region 3, Bloomington, MN
Region 3, Figure 1. Invasive Phragmites radar image map of the Lake Huron coastal zone (left) and a close-up of the Lake St. Clair area for SE Michigan just north of Detroit (right). All areas colored in red are interpreted to be Phragmites.
13
changes over time are tracked and recorded. Wetland change can be attributed to a variety of factors such as land use changes, natural changes, or climate changes. Figure 3 shows a typical suburban landscape where a variety of changes occurred, including conversion and creation of wetlands.
Service and Ducks Unlimited field biologists regularly use updated NWI maps to help plan wetland restoration, creation, and enhancement projects out in the field. Ducks Unlimited is also heavily involved with multiple restoration projects through the GLRI to partner with Service and State agencies to conserve wetland resources. DU uses the data with their Habitat Evaluation Network (HEN) model (http://glaro.ducks.org/hen/glhen.htm) to plan and target habitat conservation in the Great Lakes States.
Ongoing and Future Projects
Mapping Updates for the Eastern Great Lakes States. Continuing its efforts into 2011, Ducks Unlimited GLARO will be working with the Region and St. Mary’s University to quality control updated maps in the eastern Great Lakes States before final submission for acceptance into the national NWI database.
Mapping Updates for the Northern Great Lakes States. Ducks Unlimited started work in 2010, and will continue in 2011 and beyond, on
updating forested wetland areas for Michigan and Minnesota through NWI and Great Lakes Restoration Initiative support projects.
Minnesota Department of Natural Resources (DNR) NWI Update. The long-term cooperative relationship with the Minnesota DNR is anticipated to accelerate in 2011. Starting in 2002, the Region and the DNR laid out a plan called the Minnesota Comprehensive Wetland Assessment Monitoring and Mapping Strategy (CWAMMS) to improve the understanding of Minnesota’s wetland resources. Between 2002 and 2008, NWI helped fund small pilot NWI mapping projects in the agricultural, forested,
and urban areas to determine approaches and calculate the costs for upgrading NWI in the State.
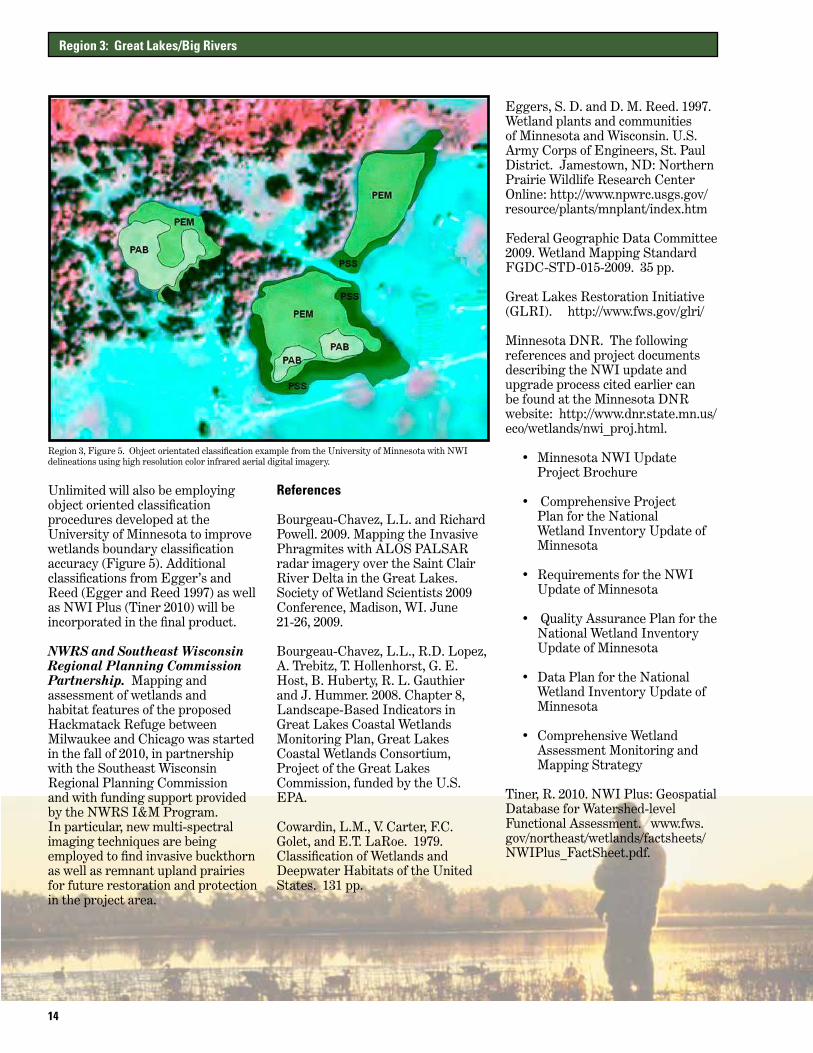
The Minnesota DNR released an RFP in 2010 that was awarded to Ducks Unlimited GLARO to begin the formal NWI statewide mapping upgrade process. The project began with the Minneapolis/St. Paul metro region. Approximately $300,000 was awarded for work in 2010, with an additional $1.5 million starting in 2011/2012. This mapping upgrade will include the use of LiDAR and RADAR imagery in addition to new 2010 spring, leaf-off, 2-foot digital ortho and stereo imagery as illustrated in Figure 4.
Region 3: Great Lakes/Big Rivers
Region 3, Figure 2. The NWI Key/Parent Key database structure of Ducks Unlimited GLARO for tracking wetland changes.
Region 3, Figure 3. Example of update of NWI data showing wetland conversion to other uses in red.
Region 3, Figure 4. Original NWI polygons overlaid on LiDAR imagery for central Minnesota where this more refined elevation data image suggests changes needed to incorporate areas of similar elevation and vegetation height into existing or new polygons.
14
Region 3: Great Lakes/Big Rivers
Region 3, Figure 5. Object orientated classification example from the University of Minnesota with NWI delineations using high resolution color infrared aerial digital imagery.
Unlimited will also be employing object oriented classification procedures developed at the University of Minnesota to improve wetlands boundary classification accuracy (Figure 5). Additional classifications from Egger’s and Reed (Egger and Reed 1997) as well as NWI Plus (Tiner 2010) will be incorporated in the final product.
NWRS and Southeast Wisconsin Regional Planning Commission Partnership. Mapping and assessment of wetlands and habitat features of the proposed Hackmatack Refuge between Milwaukee and Chicago was started in the fall of 2010, in partnership with the Southeast Wisconsin Regional Planning Commission and with funding support provided by the NWRS I&M Program. In particular, new multi-spectral imaging techniques are being employed to find invasive buckthorn as well as remnant upland prairies for future restoration and protection in the project area.
References
Bourgeau-Chavez, L.L. and Richard Powell. 2009. Mapping the Invasive Phragmites with ALOS PALSAR radar imagery over the Saint Clair River Delta in the Great Lakes. Society of Wetland Scientists 2009 Conference, Madison, WI. June 21-26, 2009.
Bourgeau-Chavez, L.L., R.D. Lopez, A. Trebitz, T. Hollenhorst, G. E. Host, B. Huberty, R. L. Gauthier and J. Hummer. 2008. Chapter 8, Landscape-Based Indicators in Great Lakes Coastal Wetlands Monitoring Plan, Great Lakes Coastal Wetlands Consortium, Project of the Great Lakes Commission, funded by the U.S. EPA.
Cowardin, L.M., V. Carter, F.C. Golet, and E.T. LaRoe. 1979. Classification of Wetlands and Deepwater Habitats of the United States. 131 pp.
Eggers, S. D. and D. M. Reed. 1997. Wetland plants and communities of Minnesota and Wisconsin. U.S. Army Corps of Engineers, St. Paul District. Jamestown, ND: Northern Prairie Wildlife Research Center Online: http://www.npwrc.usgs.gov/resource/plants/mnplant/index.htm
Federal Geographic Data Committee 2009. Wetland Mapping Standard FGDC-STD-015-2009. 35 pp.
Great Lakes Restoration Initiative (GLRI). http://www.fws.gov/glri/
Minnesota DNR. The following references and project documents describing the NWI update and upgrade process cited earlier can be found at the Minnesota DNR website: http://www.dnr.state.mn.us/eco/wetlands/nwi_proj.html.
• Minnesota NWI Update Project Brochure
• Comprehensive Project Plan for the National Wetland Inventory Update of Minnesota
• Requirements for the NWI Update of Minnesota
• Quality Assurance Plan for the National Wetland Inventory Update of Minnesota
• Data Plan for the National Wetland Inventory Update of Minnesota
• Comprehensive Wetland Assessment Monitoring and Mapping Strategy
Tiner, R. 2010. NWI Plus: Geospatial Database for Watershed-level Functional Assessment. www.fws.gov/northeast/wetlands/factsheets/NWIPlus_FactSheet.pdf.

15
Region 4: Southeast
Region 4: Southeast By John Swords Regional Wetlands Coordinator USFWS, Region 4, Atlanta, GA
Mapping Activities / Special Projects
Gulf Coast Updates for the BP Deepwater Horizon Oil Spill Incident. The crisis on the Gulf coast has required unwavering focus on the part of all Service programs upon their responses to the catastrophe. In FY 2010, NWI had funding in place to update NWRS Refuges for both the Atlantic and Gulf coasts. In Region 4, NWI completed updates for 20 Refuges with potential for oil spill impacts (Figure 1). The updated data were inserted into the Service’s oil spill mapper and sent along to Shoreline Cleanup and Assessment Technique (SCAT) teams to address oil cleanup on-the-ground. Making updated and current wetlands data available during this response has given NWI a positive and higher visibility not only within the Service, but with
other Federal and State agencies as well. NWI’s contributions to the Gulf Coast crisis response are a prime example of how NWI can work with others and respond to environmental disasters.
Other FY 2010 Projects
Refuges. Other NWI activities included updating data for Refuges in areas other than the Gulf coast. Alligator River, NC; Buck Island, VA; Cape Romain, SC; Cedar Island, NC; Currituck, NC; Mackay Island, NC; Mattamuskett, NC; Merritt Island, FL; Pea Island, NC; Pocosin Lakes, NC; Roanoke River, NC; and Swanquarter, NC had wetland updates completed this fiscal year. The updated NWI data are being used to run Sea Level Affecting Marshes Model (SLAMM) for many of the coastal Refuges.
Tennessee and Florida. Additional NWI projects occurred in western Tennessee and Cape Canaveral, FL. The Service-funded Tennessee Valley Authority (TVA) project in western Tennessee will aid in establishing baseline wetland data for an area of potential change both from development activities and climate change impacts. The Cape Canaveral project in Florida is a continuation of a partnership between the Service and Department of Defense (DOD) that has supplied wetland data on military installations across the country. DOD requested the Region to perform this update as wetlands continue to be pressured by expanding operations at Cape Canaveral Air Force Station.
Region 4, Figure 1. Gulf Coast Refuges (in yellow) with potential of impacts from oil.
16
Region 4: Southeast
Georgia. NWI relies on contributed data and, through a collaborative effort with Georgia DNR (funded by an EPA grant program), wetland updates for the Georgia coast were completed. The State of Georgia, research institutions, local governments, and private organizations will be using these updates in conservation planning, local ordinance development, wetland assessments, regulatory programs, and restoration programs. This update of Georgia’s coastal NWI maps was the first mapping project in the nation to use the new National Wetlands Mapping Standard (http://www.fgdc.gov/standards/projects/FGDC-standards-projects/wetlands-mapping/index_html).
National Status and Trends. NWI provided assistance to review national status and trends plots in Delaware, South Carolina, Florida, and Louisiana. Additional input included assistance with the national report, field work, review of documents, and GIS support.
Presentations/ Coordination
Landscape Conservation Cooperatives. In April, NWI coordinated a North Carolina wetlands working group meeting with the Raleigh Ecological Services (ES) Field Office to discuss the recent NWI Refuge updates in North Carolina and provide a synopsis of the LCC initiative. In attendance were Service employees from the Raleigh ES office, USGS, USDA, EPA, the State of North Carolina, and staff from North Carolina State University. A follow-up presentation in October included the LCC Coordinator and Science Advisor for the South Atlantic LCC. This meeting highlighted the need to have current wetlands data for sea-level rise and climate change modeling.
With a history of cooperation with many of the Water Management Districts (WMD) in the State of Florida, NWI reached out to include them in the LCC conversation. LCC presentations were given at the St. John’s and Southwest Florida
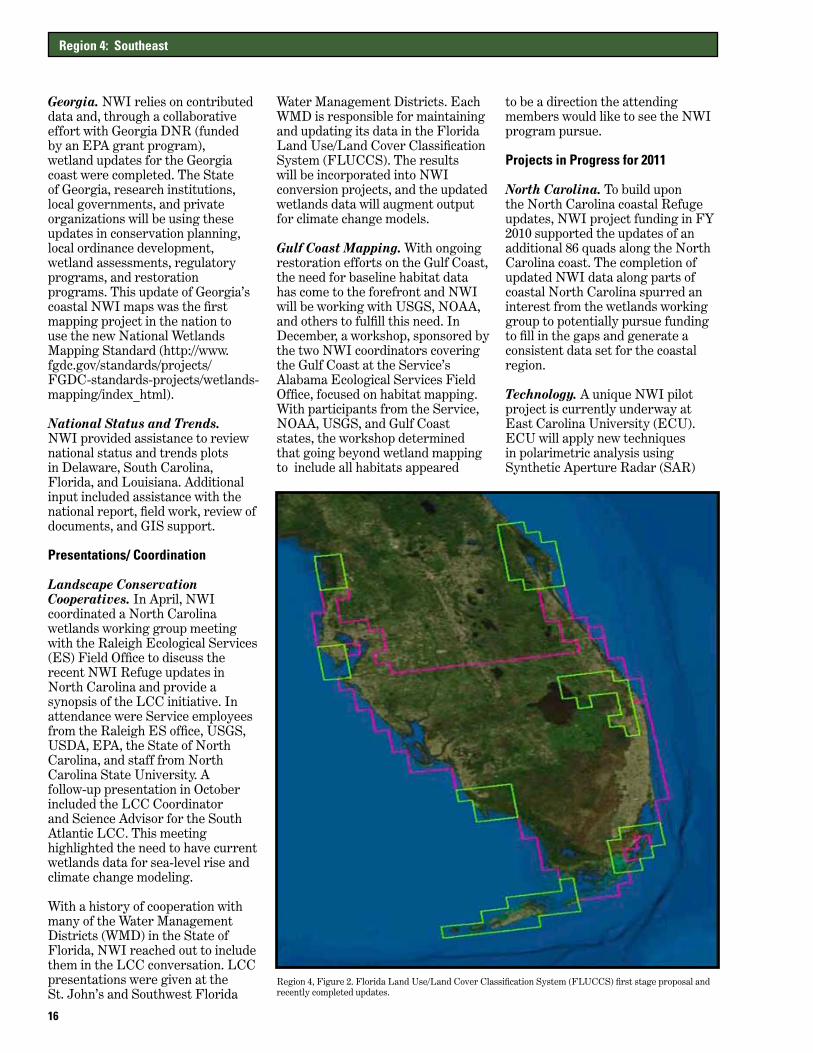
Water Management Districts. Each WMD is responsible for maintaining and updating its data in the Florida Land Use/Land Cover Classification System (FLUCCS). The results will be incorporated into NWI conversion projects, and the updated wetlands data will augment output for climate change models.
Gulf Coast Mapping. With ongoing restoration efforts on the Gulf Coast, the need for baseline habitat data has come to the forefront and NWI will be working with USGS, NOAA, and others to fulfill this need. In December, a workshop, sponsored by the two NWI coordinators covering the Gulf Coast at the Service’s Alabama Ecological Services Field Office, focused on habitat mapping. With participants from the Service, NOAA, USGS, and Gulf Coast states, the workshop determined that going beyond wetland mapping to include all habitats appeared
to be a direction the attending members would like to see the NWI program pursue.
Projects in Progress for 2011
North Carolina. To build upon the North Carolina coastal Refuge updates, NWI project funding in FY 2010 supported the updates of an additional 86 quads along the North Carolina coast. The completion of updated NWI data along parts of coastal North Carolina spurred an interest from the wetlands working group to potentially pursue funding to fill in the gaps and generate a consistent data set for the coastal region.
Technology. A unique NWI pilot project is currently underway at East Carolina University (ECU). ECU will apply new techniques in polarimetric analysis using Synthetic Aperture Radar (SAR)
Region 4, Figure 2. Florida Land Use/Land Cover Classification System (FLUCCS) first stage proposal and recently completed updates.
17
from ALOS Pulsar polarimetric 10m data that has potential to automate future wetland mapping. Other data may be incorporated into the analysis, including existing data from Airborne (NASA UAV) platforms by EPA; existing Landsat-ETM data by a class taught by the principal investigator; LiDAR data; and 4-band digital aerial imagery (NAIP 2009 and 2010 State of North Carolina DOQQs, as available). These data may be combined in the analysis to explore the extent to which such data sets could enhance the accuracy of wetland classification. A process to step down the East Carolina University pilot to aid in future mapping will be generated.
Refuge Inventory and Monitoring (I&M). With funding received from
NWRS I&M program, NWI maps will be updated for the following three Refuges within the Southeast Region covering nine topographic maps: D’Arbonne, Black Bayou, and Upper Ouchita.
Department of Defense (DOD). Another recurring funding source, DOD, funded wetland updates and a status report for the Anniston Army Depot in Anniston, Alabama.
Future Regional Goals
Landscape Conservation Cooperatives. An objective for NWI is to combine coordination efforts with LCCs and other related wetland working groups. Meetings and conference calls have occurred between the Region and the South
Atlantic, Peninsula Florida, Gulf Coastal Plains, and Ozarks LCCs. NWI is working closely with the Peninsular Florida LCC on FY 2011 NWI updates and is part of the implementation team that will provide data management.
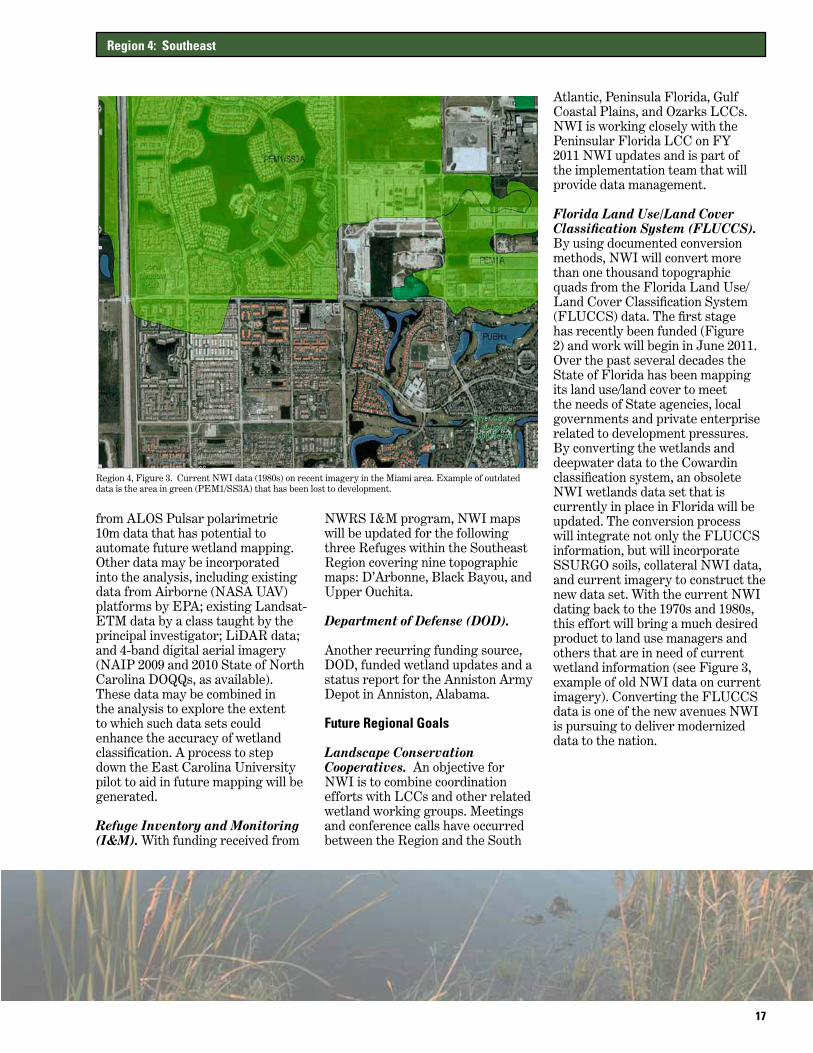
Florida Land Use/Land Cover Classification System (FLUCCS). By using documented conversion methods, NWI will convert more than one thousand topographic quads from the Florida Land Use/Land Cover Classification System (FLUCCS) data. The first stage has recently been funded (Figure 2) and work will begin in June 2011. Over the past several decades the State of Florida has been mapping its land use/land cover to meet the needs of State agencies, local governments and private enterprise related to development pressures. By converting the wetlands and deepwater data to the Cowardin classification system, an obsolete NWI wetlands data set that is currently in place in Florida will be updated. The conversion process will integrate not only the FLUCCS information, but will incorporate SSURGO soils, collateral NWI data, and current imagery to construct the new data set. With the current NWI dating back to the 1970s and 1980s, this effort will bring a much desired product to land use managers and others that are in need of current wetland information (see Figure 3, example of old NWI data on current imagery). Converting the FLUCCS data is one of the new avenues NWI is pursuing to deliver modernized data to the nation.
Region 4: Southeast
Region 4, Figure 3. Current NWI data (1980s) on recent imagery in the Miami area. Example of outdated data is the area in green (PEM1/SS3A) that has been lost to development.
18
Region 5: Northeast
Region 5: Northeast By Ralph Tiner Regional Wetlands Coordinator USFWS, Region 5, Hadley, MA
Mapping Activities
In FY 2010, the Region continued to provide technical assistance and quality control review for a number of wetland mapping projects including: the entire states of Delaware and Connecticut (in cooperation with State natural resource agencies), Long Island (New York), and several National Wildlife Refuges. Most of these projects are planned for completion in FY 2011. Long Island updates were completed, but did not meet the NWI deadline for being added to the National Wetlands Mapper in FY 2010 and will go online in early FY 2011. Regional efforts involved creating NWIPlus databases in which traditional NWI data are enhanced with the addition of abiotic descriptors (LLWW descriptors: landscape position, landform, water flow path, and waterbody type). The NWIPlus database allows for better characterization of wetland types and prediction of wetland functions at the landscape- and watershed-scales. Besides the inclusion of NWIPlus data development, NWI updating projects in the Northeast often include analyzing recent and historic wetland trends, preparing watershed-based (landscape-level) wetland functional assessments, and conducting inventories of potential wetland restoration sites. These efforts are underway for the following areas and are expected to be completed in FY 2011: States of Connecticut and Delaware, and Long Island, New York.
Partnership Projects
Refuge Wetland Mapping. The Region’s NWI Program
is cooperating with the Refuge Program to update NWI data for the following Refuges: [Presquile, James River, Back Bay, Potomac River complex, Featherstone, and Mason Neck in Virginia; Parker River and Monomoy in Massachusetts; Great Bay and Pondicherry in New Hampshire; Moosehorn in Maine; Erie in Pennsylvania; and Canaan Valley in West Virginia]. This work is funded jointly by NWI and the Region’s Refuge Program. Work will be completed in FY 2011.
Creating an NWIPlus Database and an Updated State Wetland Report for Delaware. The Region is working with the State of Delaware to create an NWIPlus database for the State, and to use this information to better characterize its wetlands, predict wetland functions statewide at the landscape-level, inventory potential wetland restoration sites, and report on recent wetland trends (including their effect on wetland functions). The Region funded work in Sussex County, while the State supported work in Kent and New Castle Counties. The work will be completed in FY 2011. The project completion report will update the previous 1985 and 2001 reports on Delaware wetlands.
Creating an NWIPlus Database and an Updated State Wetland Report for Connecticut. The State of Connecticut is providing funds to the Region to update NWI data for the State, to add LLWW descriptors and use the expanded NWIPlus Database to better characterize the State’s wetlands, and to predict wetland functions at the landscape-level for the State’s major watershed. In addition, the project
includes inventorying potential wetland restoration sites across the State by comparing NWI data with hydric soil data and current aerial imagery. The project is a multi-year effort and expected to be completed in FY 2012.
Creating NWIPlus Data for Massachusetts. The State of Massachusetts continues to update its wetland inventory but has been using its own classification that is less detailed than the national classification standard used by NWI. The State is interested in applying the Cowardin et al. classification and LLWW descriptors to its inventory. To expedite this process, NWI is in the process of converting MA types to the Cowardin system and adding LLWW descriptors for more than half of the State. The State may start applying both its classification and Cowardin to updates from 2012 and beyond.
Creating NWIPlus Data for the Lake Ontario Watershed. Largely through the Great Lakes Region’s efforts, the Service secured funding from EPA’s Great Lakes Restoration Initiative (GLRI) to update and upgrade NWI data for the Lake Ontario and other Great Lakes watersheds. To date, partial funding has been received. The Region is creating new NWI data and updating NWI data for 75 1:24K quadrangles in the Lake Ontario watershed. The project includes updated and enhanced NWI data (NWIPlus database), an inventory of potential wetland restoration sites, and application of the NWIPlus database to produce a landscape-level wetland functional assessment for the project area.
19
Region 5: Northeast
Cooperating with Southeast Region and the State of Georgia on Creating an NWIPlus Database for Georgia’s Coastal Counties. At the request of the State of Georgia, Region 5’s Regional Coordinator (RWC) led a state-sponsored workshop on the application of NWIPlus data for predicting wetland functions for coastal Georgia. The workshop was attended by more than thirty scientists from Federal, State, and local agencies, private non-profit organizations, and universities. A report “Predicting Wetland Functions at the Landscape-level for Coastal Georgia Using NWIPlus Data” is in preparation and scheduled for completion in FY 2011.
Cooperating with the Great Lakes Region, the Corps of Engineers, and the State of Wisconsin on Creating an NWIPlus Database for Wisconsin’s St. Croix Watershed. In response to a request from the State of Wisconsin and the U.S. Army Corps of Engineers, the Region participated in an interagency meeting on the application of NWIPlus data for predicting wetland functions for the St. Croix watershed. The Region also provided training in the use of LLWW descriptors during a field trip to the study area.
Special Studies
Establishing Baseline Data for Tracking Sea-level Rise in Coastal Lowlands. NWI initiated a pilot project with the Region’s Refuge Program to establish baseline conditions for tracking changes in wetland plant communities and soils along southern New Jersey coast in response to rising sea level. The pilot project was conducted at the Forsythe National Wildlife Refuge where four transects with permanent vegetation plots were established from the high marsh into adjacent lowland forests (both wetlands and nonwetlands). The University of Massachusetts is cooperating in this effort by providing soil expertise for describing baseline soil properties. Additional work is planned in 2011 or early 2012 with one or more other Refuges.
Investigation of Possible Aerobic Wetlands along Coldwater Streams in New York. The Region is working with New York City Department of Environmental Protection (NYCDEP) on a study of possible aerobic wetlands associated with coarse-textured soils in riparian wetlands along fast-flowing coldwater streams in the West of Hudson watershed. The study involved installing IRIS tubes in these wetlands and monitoring the status of iron reduction over a four- to six-month period. NWI helped design the study and worked with NYCDEP biologists to establish study sites. NYCDEP personnel conducted the monitoring and collected plant community and soil data. A joint study report is planned for preparation in FY 2011.
Presentations
The Region gave presentations at two regional conferences: New York Wetlands Forum (Buffalo, NY, April 28-29, 2010: “Update on NWI Activities in New York”) and New England Vulnerable Wetlands Conference (Plymouth, MA, April 7, 2010: “Geographically Isolated and Headwater Wetlands in Selected Areas of New England: Their Extent, Distribution, and Functions”). NWI also spoke at the NOAA-NPS National Salt Marsh Monitoring Workshop (NOAA HQ Silver Springs, MD, February 4, 2010), about the Region is monitoring activities on coastal vegetation changes expected from sea-level rise. Projects Planned for 2011
The Program will be completing updated NWI mapping, NWIPlus database construction, and summary reports on NWI findings for the states of Connecticut, Delaware, and New Jersey, as well as for central and western Massachusetts, in late FY 2011. Similar work should be completed for Maryland’s coastal region of Chesapeake Bay, and for a portion of the Lake Ontario (New York) watershed.
Publications
The Region issued three online publications during FY 2010 with drafts of other reports in various stages of review. The final publications are: 1) 2009 Eelgrass Survey for Eastern Long Island Sound, Connecticut and New York; 2) Wetlands of the Northeast: Results of the National Wetlands Inventory (summarizes NWI data for each state in the region); and 3) Wetlands of Cape Cod and the Islands, Massachusetts: Results of the National Wetlands Inventory and Landscape-level Functional Assessment. These reports are posted on the Region’s upgraded NWI website at: http://www.fws.gov/northeast/wetlands/publications.html.
Two articles by the Regional Coordinator were also published: “Northern Bayberry: Can it be a Tree?” in the Quarterly Newsletter Fall 2009 (Vol. 19(3) of the Long Island Botanical Society documenting the discovery of the national and state champion “Big Tree” of the species Morella pensylvanica” on Long Island); and “NWIPlus: Geospatial Database for Watershed-level Functional Assessment” in the National Wetlands Newsletter, Vol. 32(3) describing how enhanced NWI can be used for landscape-level assessments.
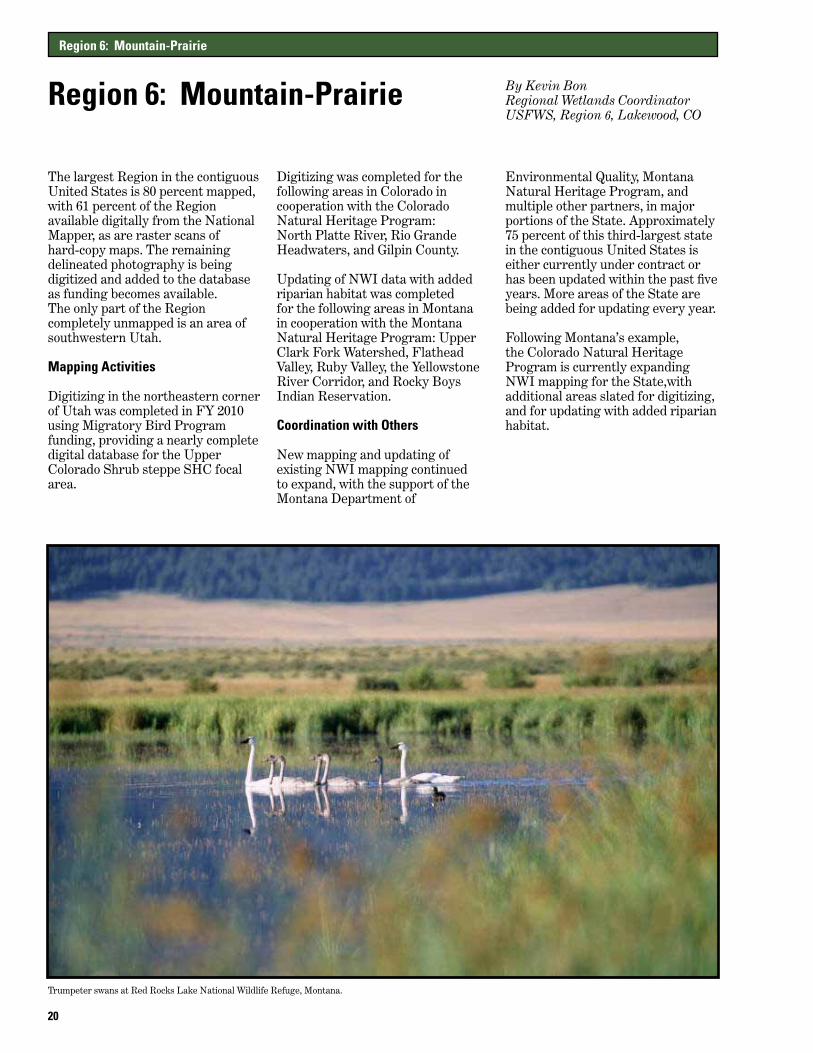
20
Region 6: Mountain-Prairie
Region 6: Mountain-Prairie By Kevin Bon Regional Wetlands Coordinator USFWS, Region 6, Lakewood, CO
The largest Region in the contiguous United States is 80 percent mapped, with 61 percent of the Region available digitally from the National Mapper, as are raster scans of hard-copy maps. The remaining delineated photography is being digitized and added to the database as funding becomes available. The only part of the Region completely unmapped is an area of southwestern Utah.
Mapping Activities
Digitizing in the northeastern corner of Utah was completed in FY 2010 using Migratory Bird Program funding, providing a nearly complete digital database for the Upper Colorado Shrub steppe SHC focal area.
Digitizing was completed for the following areas in Colorado in cooperation with the Colorado Natural Heritage Program: North Platte River, Rio Grande Headwaters, and Gilpin County.
Updating of NWI data with added riparian habitat was completed for the following areas in Montana in cooperation with the Montana Natural Heritage Program: Upper Clark Fork Watershed, Flathead Valley, Ruby Valley, the Yellowstone River Corridor, and Rocky Boys Indian Reservation.
Coordination with Others
New mapping and updating of existing NWI mapping continued to expand, with the support of the Montana Department of
Environmental Quality, Montana Natural Heritage Program, and multiple other partners, in major portions of the State. Approximately 75 percent of this third-largest state in the contiguous United States is either currently under contract or has been updated within the past five years. More areas of the State are being added for updating every year.
Following Montana’s example, the Colorado Natural Heritage Program is currently expanding NWI mapping for the State,with additional areas slated for digitizing, and for updating with added riparian habitat.
Trumpeter swans at Red Rocks Lake National Wildlife Refuge, Montana.

21
Region 6: Mountain-Prairie
Projects in Progress for 2011
Updating of Wells County, North Dakota, will be completed for the Habitat and Population Evaluation Team (HAPET) to show the current status of wetlands and possible restorable wetlands. Updating will also be completed for the Piceance Basin Energy Development Area, which includes the Roan Plateau, in Colorado.
Digital NWI mapping will be completed for the Plains and Prairie Potholes LCC in the Region. NWI updating with added riparian habitat will continue for the remainder
of the Great Northern LCC in Montana. Digital NWI mapping will be contracted out for the Flint Hills Legacy Conservation Area and the Eastern Tallgrass Prairie and Big Rivers LCC in Kansas for completion in 2012. These three projects will complete digital NWI coverage for these three LCC’s in the Region.
New mapping and updating will continue in the State of Montana with the Montana Natural Heritage Program. Digitizing and updating will continue in the State of Colorado with the Colorado Natural Heritage Program.
Other Activities
NWI maps were used in North Dakota to locate nesting sites for the endangered piping plover. The Unconsolidated Shore class (US; Cowardin 1979) found along lakes corresponds to the exact habitat preferred by this bird.
EPA and local and State partners are using our updated maps along the Wasatch Front and Great Salt Lake to identify waterfowl and shorebird feeding preferences in order to develop alternate wetland features in the rapidly expanding urban corridor around Salt Lake City.
The State of Montana and partners are using updated and new NWI maps for a number of purposes including: identifying wetlands and intermittent streams not protected under the recently reduced geographic extent of Clean Water Act jurisdiction, identifying change and ecological functions of wetlands in the Bitterroot and other valleys, and identifying wetland and riparian habitat change along the Yellowstone River.
Riparian habitat along a stream in the arid West, important for many species. Credit: USFWS
A group of buffalo in Nebraska near a river. Credit: USFWS
22
Region 7: Alaska
Region 7: Alaska By Jerry Tande, Regional Wetlands Coordinator
and Julie Michaelson, Assistant Regional Wetlands Coordinator
USFWS, Region 7, Anchorage AK
Mapping Activities
No new mapping was initiated in the Region in 2010; however, 0.199 million acres were added to the Wetlands Mapper with the completion of updates as part of a status and trends study in the Fairbanks area, Interior Alaska (see Special Projects below). In support of the Arctic Landscape Conservation Cooperative. Climate change funding was used to digitize all remaining previously mapped Arctic Coastal Plain quadrangles north of the Brooks Range and add these data to the Wetlands Mapper (2.870 million acres). These quads include the Beaufort Sea coast west of Prudhoe Bay, the Arctic National Wildlife Refuge (ANWR) coastal plain, and the central Brooks Range foothills. Upon completion of this project, the entire Coastal Plain Ecoregion will have a digital wetlands baseline dataset available for use by the Arctic LCC and partners with specific management responsibilities in this ecoregion. This database will support research into coastal change analysis, wetland gains and losses, and migratory bird habitat changes related to environmental change. The inland quads are also anticipated to be used by the Service and its partners for energy-related project reviews along Alaska’s latest proposed gasline corridors.
Special Projects
Strategic Wetland Study for Climate Change/Sea-level Rise - Arctic Coastal Change Analysis, Yukon Delta National Wildlife Refuge. A retrospective change analysis of coastal shorelines and estuarine and lacustrine wetland habitat along
the Bering Sea coast, Yukon Delta National Wildlife Refuge (YKD), was conducted using 2007-08 IKONOS, 1980s color infrared, 1984 color, and 1950s black and white imagery. The study area is located in the Western Alaska LCC and encompasses the most biologically productive portion of the western Arctic coast within the YKD. It supports one of the largest aggregations of shorebirds and waterbirds in the world, including significant portions of the Pacific and world populations of Pacific black brant, cackling Canada geese, and Emperor geese, and includes critical habitat for Threatened spectacled and Steller’s eiders. Because of its expansive low elevation coastal area, much of the Refuge and its Critical Habitats are at risk from sea-level rise and other affects of accelerated warming.
NWI funded the mapping and analysis of wetland changes to be used by the Service and its partners, including the YKD Refuge, the Migratory Bird Management Program, and the USGS-Alaska Science Center, for coastal change analysis and for assessing wetland habitat gains, losses, and changes. These partners and others anticipate further use of the data in conjunction with landscape change models to predict changes in wetland habitat and migratory bird distribution and abundance related to Arctic climate change. This successful collaborative effort is presented and expanded upon in the following pages.
Fairbanks Status and Trends Assessment. Wetlands update mapping was completed in 2010 to determine the current status of wetlands for the Greater
Fairbanks area in Interior Alaska. The city has seen considerable growth, particularly in areas that are predominantly wetland and underlain by permafrost. In order to educate local decision-makers concerning the value of conserving remaining wetlands, wetland losses needed to be quantified and the ecological implications of these losses described. To develop a technique to answer these questions, a field guide to photo interpretation, the mapping conventions, and associated plant communities was completed and reviewed for its application by NWI staff, the U.S. Army Corps of Engineers, and a Fairbanks wetlands consultant.
These methodologies were used to develop a GIS database used to conduct a wetland trends study. It has also been employed by the Service’s Fairbanks Field Office to collaborate with the USACE, the Borough, and other agencies in identifying key wetlands in need of conservation. As a major planning tool, the GIS database serves as the baseline for current wetland status and for assessing the acreage, locations, and types of wetlands lost in the Fairbanks area since 1949. This trends study is scheduled for completion in 2011. In addition to quantifying wetlands changes, an assessment of the function and fish and wildlife value of specifically impacted wetlands will accompany the final reporting. A digital archive for source materials, final reports, and geospatial products was created and an additional layer containing value-added vegetation data was edited for distribution as a regional product over the Regional NWI website.
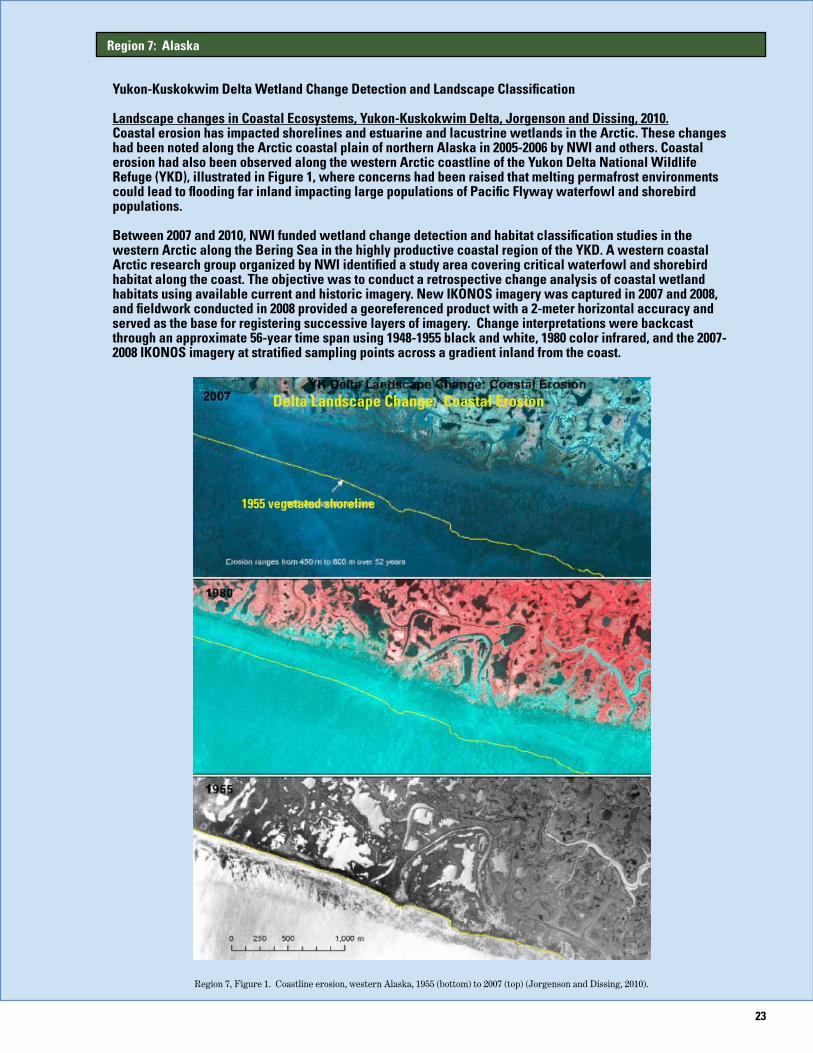
23
Yukon-Kuskokwim Delta Wetland Change Detection and Landscape Classification
Landscape changes in Coastal Ecosystems, Yukon-Kuskokwim Delta, Jorgenson and Dissing, 2010. Coastal erosion has impacted shorelines and estuarine and lacustrine wetlands in the Arctic. These changes had been noted along the Arctic coastal plain of northern Alaska in 2005-2006 by NWI and others. Coastal erosion had also been observed along the western Arctic coastline of the Yukon Delta National Wildlife Refuge (YKD), illustrated in Figure 1, where concerns had been raised that melting permafrost environments could lead to flooding far inland impacting large populations of Pacific Flyway waterfowl and shorebird populations.
Between 2007 and 2010, NWI funded wetland change detection and habitat classification studies in the western Arctic along the Bering Sea in the highly productive coastal region of the YKD. A western coastal Arctic research group organized by NWI identified a study area covering critical waterfowl and shorebird habitat along the coast. The objective was to conduct a retrospective change analysis of coastal wetland habitats using available current and historic imagery. New IKONOS imagery was captured in 2007 and 2008, and fieldwork conducted in 2008 provided a georeferenced product with a 2-meter horizontal accuracy and served as the base for registering successive layers of imagery. Change interpretations were backcast through an approximate 56-year time span using 1948-1955 black and white, 1980 color infrared, and the 2007-2008 IKONOS imagery at stratified sampling points across a gradient inland from the coast.
Region 7: Alaska
Region 7, Figure 1. Coastline erosion, western Alaska, 1955 (bottom) to 2007 (top) (Jorgenson and Dissing, 2010).
Delta Landscape Change: Coastal Erosion
1955 vegetated shoreline
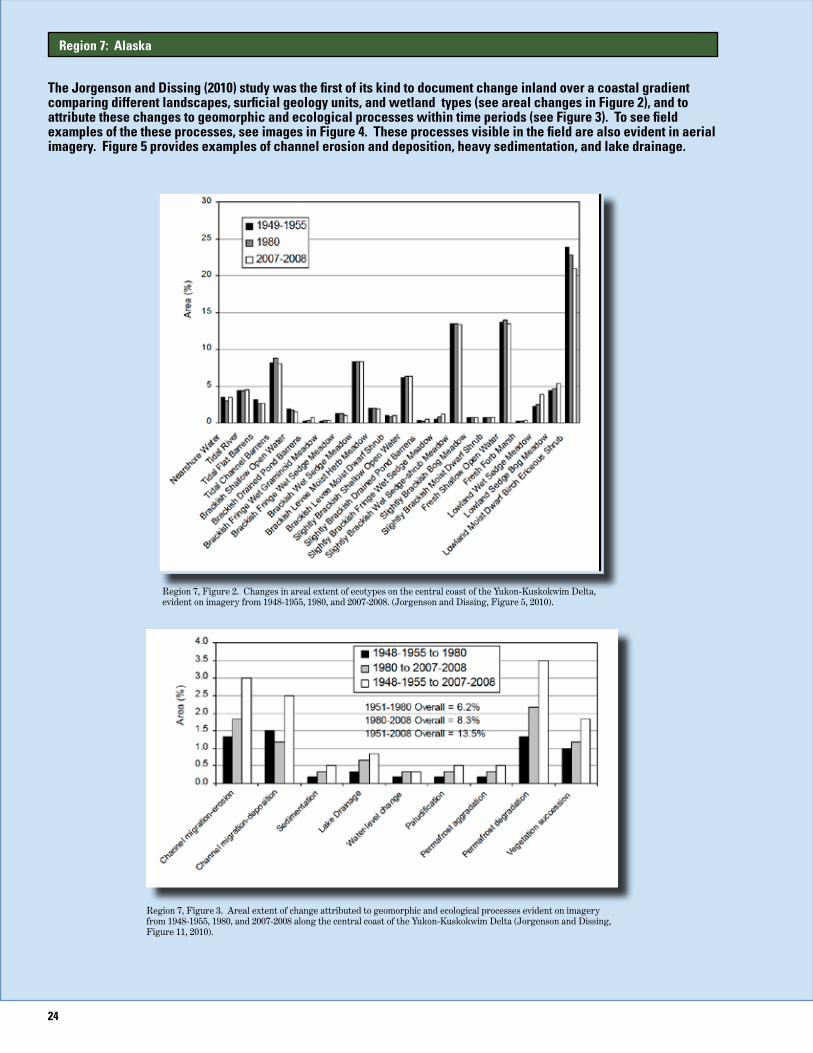
24
Region 7: Alaska
The Jorgenson and Dissing (2010) study was the first of its kind to document change inland over a coastal gradient comparing different landscapes, surficial geology units, and wetland types (see areal changes in Figure 2), and to attribute these changes to geomorphic and ecological processes within time periods (see Figure 3). To see field examples of the these processes, see images in Figure 4. These processes visible in the field are also evident in aerial imagery. Figure 5 provides examples of channel erosion and deposition, heavy sedimentation, and lake drainage.
Region 7, Figure 3. Areal extent of change attributed to geomorphic and ecological processes evident on imagery from 1948-1955, 1980, and 2007-2008 along the central coast of the Yukon-Kuskokwim Delta (Jorgenson and Dissing, Figure 11, 2010).
Region 7, Figure 2. Changes in areal extent of ecotypes on the central coast of the Yukon-Kuskokwim Delta, evident on imagery from 1948-1955, 1980, and 2007-2008. (Jorgenson and Dissing, Figure 5, 2010).
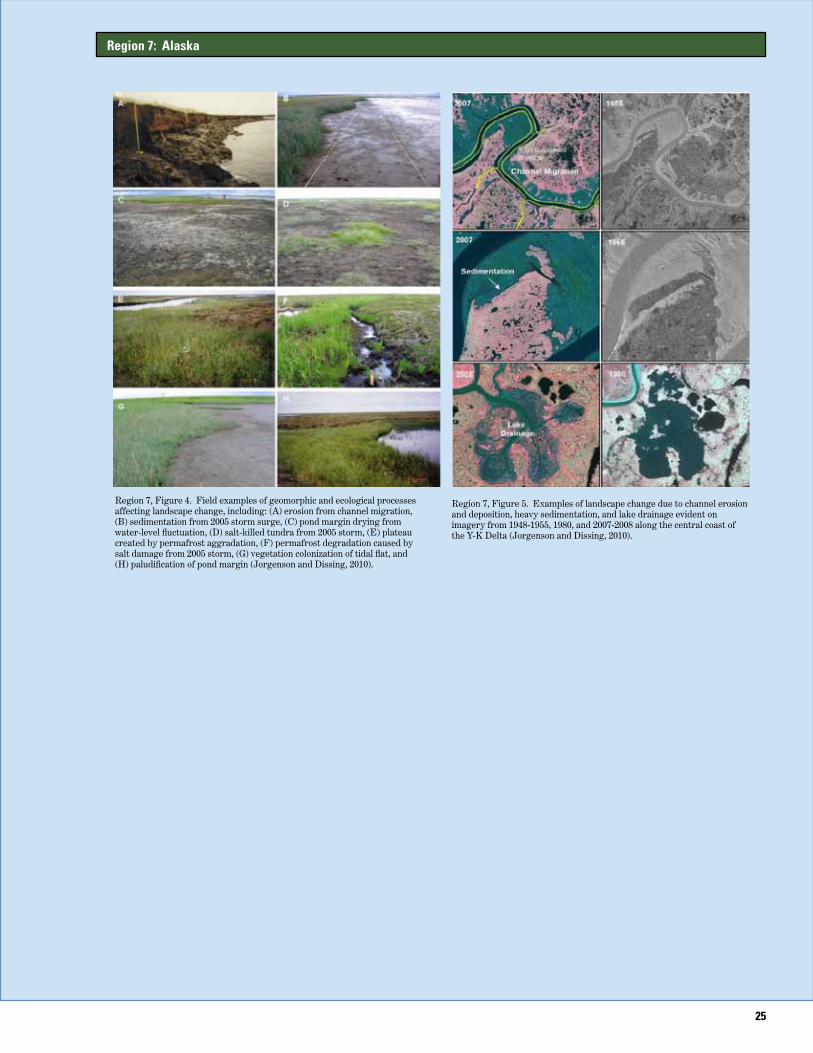
25
Region 7: Alaska
Region 7, Figure 4. Field examples of geomorphic and ecological processes affecting landscape change, including: (A) erosion from channel migration, (B) sedimentation from 2005 storm surge, (C) pond margin drying from water-level fluctuation, (D) salt-killed tundra from 2005 storm, (E) plateau created by permafrost aggradation, (F) permafrost degradation caused by salt damage from 2005 storm, (G) vegetation colonization of tidal flat, and (H) paludification of pond margin (Jorgenson and Dissing, 2010).
Region 7, Figure 5. Examples of landscape change due to channel erosion and deposition, heavy sedimentation, and lake drainage evident on imagery from 1948-1955, 1980, and 2007-2008 along the central coast of the Y-K Delta (Jorgenson and Dissing, 2010).
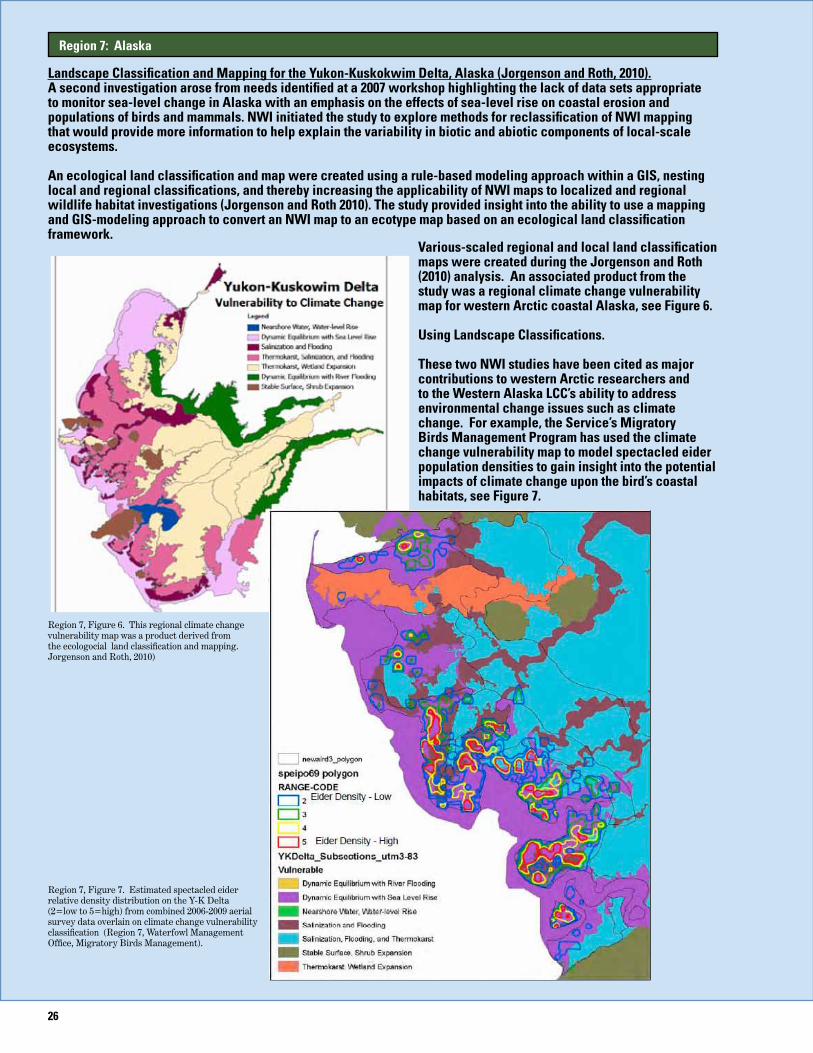
26
Landscape Classification and Mapping for the Yukon-Kuskokwim Delta, Alaska (Jorgenson and Roth, 2010). A second investigation arose from needs identified at a 2007 workshop highlighting the lack of data sets appropriate to monitor sea-level change in Alaska with an emphasis on the effects of sea-level rise on coastal erosion and populations of birds and mammals. NWI initiated the study to explore methods for reclassification of NWI mapping that would provide more information to help explain the variability in biotic and abiotic components of local-scale ecosystems.
An ecological land classification and map were created using a rule-based modeling approach within a GIS, nesting local and regional classifications, and thereby increasing the applicability of NWI maps to localized and regional wildlife habitat investigations (Jorgenson and Roth 2010). The study provided insight into the ability to use a mapping and GIS-modeling approach to convert an NWI map to an ecotype map based on an ecological land classification framework.
Region 7: Alaska
Various-scaled regional and local land classification maps were created during the Jorgenson and Roth (2010) analysis. An associated product from the study was a regional climate change vulnerability map for western Arctic coastal Alaska, see Figure 6.
Using Landscape Classifications.
These two NWI studies have been cited as major contributions to western Arctic researchers and to the Western Alaska LCC’s ability to address environmental change issues such as climate change. For example, the Service’s Migratory Birds Management Program has used the climate change vulnerability map to model spectacled eider population densities to gain insight into the potential impacts of climate change upon the bird’s coastal habitats, see Figure 7.
Region 7, Figure 6. This regional climate change vulnerability map was a product derived from the ecologocial land classification and mapping. Jorgenson and Roth, 2010)
Region 7, Figure 7. Estimated spectacled eider relative density distribution on the Y-K Delta (2=low to 5=high) from combined 2006-2009 aerial survey data overlain on climate change vulnerability classification (Region 7, Waterfowl Management Office, Migratory Birds Management).
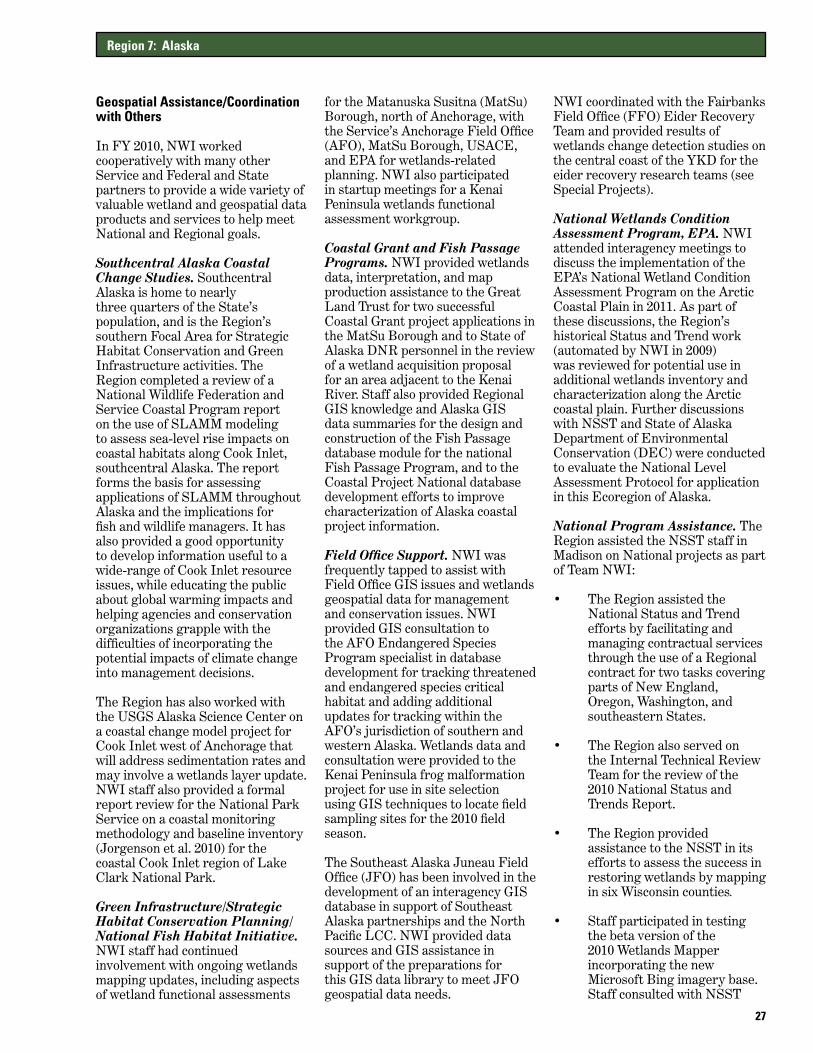
27
Geospatial Assistance/Coordination with Others
In FY 2010, NWI worked cooperatively with many other Service and Federal and State partners to provide a wide variety of valuable wetland and geospatial data products and services to help meet National and Regional goals.
Southcentral Alaska Coastal Change Studies. Southcentral Alaska is home to nearly three quarters of the State’s population, and is the Region’s southern Focal Area for Strategic Habitat Conservation and Green Infrastructure activities. The Region completed a review of a National Wildlife Federation and Service Coastal Program report on the use of SLAMM modeling to assess sea-level rise impacts on coastal habitats along Cook Inlet, southcentral Alaska. The report forms the basis for assessing applications of SLAMM throughout Alaska and the implications for fish and wildlife managers. It has also provided a good opportunity to develop information useful to a wide-range of Cook Inlet resource issues, while educating the public about global warming impacts and helping agencies and conservation organizations grapple with the difficulties of incorporating the potential impacts of climate change into management decisions.
The Region has also worked with the USGS Alaska Science Center on a coastal change model project for Cook Inlet west of Anchorage that will address sedimentation rates and may involve a wetlands layer update. NWI staff also provided a formal report review for the National Park Service on a coastal monitoring methodology and baseline inventory (Jorgenson et al. 2010) for the coastal Cook Inlet region of Lake Clark National Park.
Green Infrastructure/Strategic Habitat Conservation Planning/National Fish Habitat Initiative. NWI staff had continued involvement with ongoing wetlands mapping updates, including aspects of wetland functional assessments
for the Matanuska Susitna (MatSu) Borough, north of Anchorage, with the Service’s Anchorage Field Office (AFO), MatSu Borough, USACE, and EPA for wetlands-related planning. NWI also participated in startup meetings for a Kenai Peninsula wetlands functional assessment workgroup.
Coastal Grant and Fish Passage Programs. NWI provided wetlands data, interpretation, and map production assistance to the Great Land Trust for two successful Coastal Grant project applications in the MatSu Borough and to State of Alaska DNR personnel in the review of a wetland acquisition proposal for an area adjacent to the Kenai River. Staff also provided Regional GIS knowledge and Alaska GIS data summaries for the design and construction of the Fish Passage database module for the national Fish Passage Program, and to the Coastal Project National database development efforts to improve characterization of Alaska coastal project information.
Field Office Support. NWI was frequently tapped to assist with Field Office GIS issues and wetlands geospatial data for management and conservation issues. NWI provided GIS consultation to the AFO Endangered Species Program specialist in database development for tracking threatened and endangered species critical habitat and adding additional updates for tracking within the AFO’s jurisdiction of southern and western Alaska. Wetlands data and consultation were provided to the Kenai Peninsula frog malformation project for use in site selection using GIS techniques to locate field sampling sites for the 2010 field season.
The Southeast Alaska Juneau Field Office (JFO) has been involved in the development of an interagency GIS database in support of Southeast Alaska partnerships and the North Pacific LCC. NWI provided data sources and GIS assistance in support of the preparations for this GIS data library to meet JFO geospatial data needs.
NWI coordinated with the Fairbanks Field Office (FFO) Eider Recovery Team and provided results of wetlands change detection studies on the central coast of the YKD for the eider recovery research teams (see Special Projects).
National Wetlands Condition Assessment Program, EPA. NWI attended interagency meetings to discuss the implementation of the EPA’s National Wetland Condition Assessment Program on the Arctic Coastal Plain in 2011. As part of these discussions, the Region’s historical Status and Trend work (automated by NWI in 2009) was reviewed for potential use in additional wetlands inventory and characterization along the Arctic coastal plain. Further discussions with NSST and State of Alaska Department of Environmental Conservation (DEC) were conducted to evaluate the National Level Assessment Protocol for application in this Ecoregion of Alaska.
National Program Assistance. The Region assisted the NSST staff in Madison on National projects as part of Team NWI:
• The Region assisted the National Status and Trend efforts by facilitating and managing contractual services through the use of a Regional contract for two tasks covering parts of New England, Oregon, Washington, and southeastern States.
• The Region also served on the Internal Technical Review Team for the review of the 2010 National Status and Trends Report.
• The Region provided assistance to the NSST in its efforts to assess the success in restoring wetlands by mapping in six Wisconsin counties.
• Staff participated in testing the beta version of the 2010 Wetlands Mapper incorporating the new Microsoft Bing imagery base. Staff consulted with NSST
Region 7: Alaska
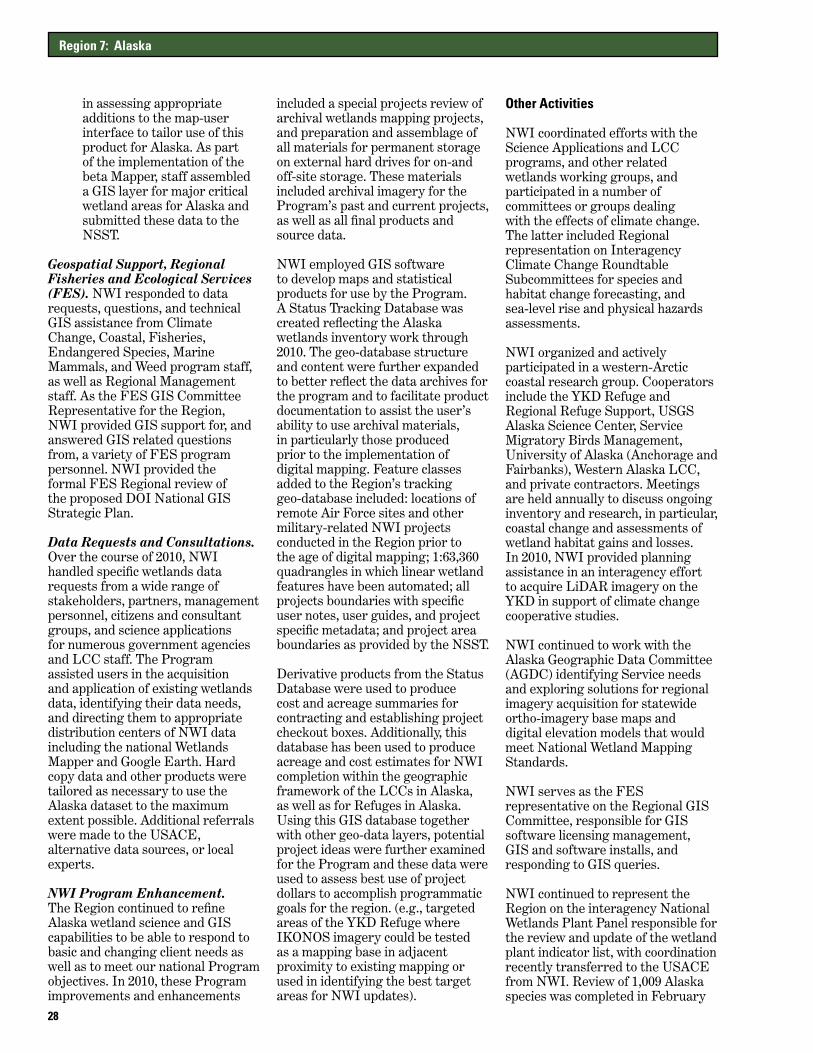
28
in assessing appropriate additions to the map-user interface to tailor use of this product for Alaska. As part of the implementation of the beta Mapper, staff assembled a GIS layer for major critical wetland areas for Alaska and submitted these data to the NSST.
Geospatial Support, Regional Fisheries and Ecological Services (FES). NWI responded to data requests, questions, and technical GIS assistance from Climate Change, Coastal, Fisheries, Endangered Species, Marine Mammals, and Weed program staff, as well as Regional Management staff. As the FES GIS Committee Representative for the Region, NWI provided GIS support for, and answered GIS related questions from, a variety of FES program personnel. NWI provided the formal FES Regional review of the proposed DOI National GIS Strategic Plan.
Data Requests and Consultations. Over the course of 2010, NWI handled specific wetlands data requests from a wide range of stakeholders, partners, management personnel, citizens and consultant groups, and science applications for numerous government agencies and LCC staff. The Program assisted users in the acquisition and application of existing wetlands data, identifying their data needs, and directing them to appropriate distribution centers of NWI data including the national Wetlands Mapper and Google Earth. Hard copy data and other products were tailored as necessary to use the Alaska dataset to the maximum extent possible. Additional referrals were made to the USACE, alternative data sources, or local experts.
NWI Program Enhancement. The Region continued to refine Alaska wetland science and GIS capabilities to be able to respond to basic and changing client needs as well as to meet our national Program objectives. In 2010, these Program improvements and enhancements
included a special projects review of archival wetlands mapping projects, and preparation and assemblage of all materials for permanent storage on external hard drives for on-and off-site storage. These materials included archival imagery for the Program’s past and current projects, as well as all final products and source data.
NWI employed GIS software to develop maps and statistical products for use by the Program. A Status Tracking Database was created reflecting the Alaska wetlands inventory work through 2010. The geo-database structure and content were further expanded to better reflect the data archives for the program and to facilitate product documentation to assist the user’s ability to use archival materials, in particularly those produced prior to the implementation of digital mapping. Feature classes added to the Region’s tracking geo-database included: locations of remote Air Force sites and other military-related NWI projects conducted in the Region prior to the age of digital mapping; 1:63,360 quadrangles in which linear wetland features have been automated; all projects boundaries with specific user notes, user guides, and project specific metadata; and project area boundaries as provided by the NSST.
Derivative products from the Status Database were used to produce cost and acreage summaries for contracting and establishing project checkout boxes. Additionally, this database has been used to produce acreage and cost estimates for NWI completion within the geographic framework of the LCCs in Alaska, as well as for Refuges in Alaska. Using this GIS database together with other geo-data layers, potential project ideas were further examined for the Program and these data were used to assess best use of project dollars to accomplish programmatic goals for the region. (e.g., targeted areas of the YKD Refuge where IKONOS imagery could be tested as a mapping base in adjacent proximity to existing mapping or used in identifying the best target areas for NWI updates).
Other Activities
NWI coordinated efforts with the Science Applications and LCC programs, and other related wetlands working groups, and participated in a number of committees or groups dealing with the effects of climate change. The latter included Regional representation on Interagency Climate Change Roundtable Subcommittees for species and habitat change forecasting, and sea-level rise and physical hazards assessments.
NWI organized and actively participated in a western-Arctic coastal research group. Cooperators include the YKD Refuge and Regional Refuge Support, USGS Alaska Science Center, Service Migratory Birds Management, University of Alaska (Anchorage and Fairbanks), Western Alaska LCC, and private contractors. Meetings are held annually to discuss ongoing inventory and research, in particular, coastal change and assessments of wetland habitat gains and losses. In 2010, NWI provided planning assistance in an interagency effort to acquire LiDAR imagery on the YKD in support of climate change cooperative studies.
NWI continued to work with the Alaska Geographic Data Committee (AGDC) identifying Service needs and exploring solutions for regional imagery acquisition for statewide ortho-imagery base maps and digital elevation models that would meet National Wetland Mapping Standards.
NWI serves as the FES representative on the Regional GIS Committee, responsible for GIS software licensing management, GIS and software installs, and responding to GIS queries.
NWI continued to represent the Region on the interagency National Wetlands Plant Panel responsible for the review and update of the wetland plant indicator list, with coordination recently transferred to the USACE from NWI. Review of 1,009 Alaska species was completed in February
Region 7: Alaska
29
and posted to the new North American Digital Flora website (https://wetland_plants.usace.army.mil ). USACE provided the national list for Federal Register posting and public review in August 2010.
Projects in Progress
Four new FY 2010 projects were begun in support of strategic wetlands mapping for the LCCs and climate change projects. Three projects provide for the scanning and attributing of existing Arctic LCC, boreal forest, and coastal NWI maps from hard-copy separates to produce digital data:
• Southern Foothills and Gasline Corridor Quads of the Arctic LCC
• Interior, Copper River Basin, and South Central Alaska Boreal Forest Quads
• Cook Inlet and Bristol Bay Coastal Quads
These projects together cover 86 1:63,360-scale quads (12.11 mil acres) and are intended to support change analysis, further the study of wetland gains or losses and migratory bird habitat changes related to climate change, and work along the proposed Alaska gasline corridor. The coastal Bristol Bay and Cook Inlet quads are anticipated to be used by the Service and its Partners for energy related project reviews along the coastline.
The fourth project is a pilot project that will extend new NWI mapping
along the southern border of previously mapped North Slope areas in the Brooks Range Foothills of the Arctic LCC (approximately 606,423 mil acres). The ability to implement these new mapping techniques is intended to provide reconnaissance-level mapping for remote areas at a cost savings to the program.
In addition to these projects, an in-house project will prepare a Southeast Alaska wetlands data layer of remaining nondigital NWI maps. Scanned data has been provided by the U.S. Forest Service through the Geographic Information Network of Alaska (GINA) for evaluation as a contributed data layer for inclusion in the Wetlands Mapper in 2011.
The Program is evaluating statewide digital products that could potentially assist in mapping wetlands at a coarser scale to provide a generalized level of wetlands information for remote and unmapped areas of Alaska. NWI has been evaluating and designing a mapping scheme that might eventually accomplish this goal. Data being examined includes a database residing within the 2008 Alaska Permafrost Map, regional landcover mapping classifications, synthetic aperture radar (SAR) wetlands mapping products, and a 2010 draft soils classification and map for the State. Various new satellite imagery solutions are also being investigated that may prove useful for Alaska wetlands mapping updating and future mapping work.
References
Jorgenson, M.T. and D. Dissing. 2010. Landscape changes in coastal ecosystems, Yukon-Kuskokwim Delta. Rpt. Prep. by ABR, Inc. Environmental Research and Services, Fairbanks, AK for National Wetlands Inventory, Region 7, U.S. Fish and Wildlife Service. 1011 East Tudor Road, Anchorage, AK. 99503. 27 pp. and Geodatabase.
Jorgenson, M.T. and J.E. Roth. 2010. Landscape classification and mapping for the Yukon-Kuskokwim Delta, Alaska. Rpt. Prep. by ABR, Inc. Environmental Research and Services, Fairbanks, AK for National Wetlands Inventory, Region 7, U.S. Fish and Wildlife Service. 1011 East Tudor Road, Anchorage, AK. 99503. 24 pp. and Geodatabase.
Jorgenson, M. T., G. V. Frost, A. E. Miller, P. Spencer, M. Shephard, B. Mangipane, C. Moore and C. Lindsay. 2010. Monitoring coastal salt marshes in the Lake Clark and Katmai National Parklands of the Southwest Alaska Network. Natural Resource Technical Report NPS/SWAN/NRTR—2010/338. National Park Service, Fort Collins, CO.
Martin, P. 2007. Preliminary assessment of coastal erosion rates on the Beaufort Sea and recommendations for coastal change studies for the National Wetlands Inventory Program, Alaska. Unpub. Rept. Region 7 National Wetlands Inventory, Anchorage AK. 16 pp.
Region 7: Alaska

30
In 2010, the Pacific Southwest Regional office requested that a Regional Wetlands Coordinator (RWC) be established and funded by the Program. This request was met and an acting coordinator was put in place for the last half of the year. Previously this region was supported by the Region 1 NWI staff. Annual reporting was done in conjunction with Region 1 for 2010. Separate accomplishment targets were set for each region for future reporting. In 2010 Region 8 did not receive any project funding or partnership funding.
Mapping Activities
Update Mapping - Salinas Valley, California. California State University Monterey Bay (CSUMB) was tasked through a CESU Agreement to map 18 quads in the Salinas Valley River Basin. Funding for the project was made available by the NWI project funds in FY 2009. This is the third Salinas Valley project; previously 41 quads were completed by CSUMB. In FY 2010, five additional quads were added to the contract. Remaining funds in the contract will allow for these to be completed in 2011.
Update Mapping - Tijuana Slough, California. Funding for the 10 quad project was made available by the NWI project fund in FY 2009. Preliminary data were available from the SCCWRP Grant, Area 10 (17 quad equivalents). Due to budget issues in California, the SCCWRP Grant was suspended so the region took the draft data developed by California State University Northridge (CSUN) and completed the project. In FY 2010, 17 quads of data were added to the national database.
New Mapping - California Desert. A pilot project to test scalable mapping in the California Desert was launched in 2010 in an
unmapped 20 quad area along the Nevada border. The goal was to do full NWI mapping on another unmapped four quad area and scalable mapping on the 20 quad area using National Hydrography Data and other collateral information. The 20 quad area was completed in 2010 and the 4 quad area will be completed in 2011. This pilot project will help develop cost estimates and methodology for future mapping in the desert areas of California and Nevada.
Contributed Data - Torres Martinez Tribe. Torrez Martinez Desert Cahuilla Indians are the largest private landowner of property in and around the Salton Sea. This is their aboriginal homeland and it must be protected for future generations. The Wetlands Department of the Torres Martinez submitted wetlands data to NWI for their Tribal lands in 2009. These data were converted to NWI standards and submitted in 2010 to the national database (Figure 1).
Contributed Data - Hoopa Valley Tribe. In 2007, the Region provided technical support on the California Hoopa Valley Tribe’s application for an Environmental Protection
Agency (EPA) Region 9 grant to inventory wetland resources on the Tribe’s reservation. In 2008, EPA awarded the grant and NWI entered into a Cooperative Agreement with the Tribe to provide training and quality control (QC) review during the interpretation and on the final data. Initial training with both the Hoopa and the Yurok Tribes was provided in April 2008. The Region anticipates the project will be completed during FY 2011.
Special Projects
National Training Modules. In FY 2010, the Washington Office (WO) initiated the project of developing web-based wetland mapping training modules. The goal of the training modules was to provide future mapping partners or contributors with information about NWI, the National Wetlands Classification and Mapping Standards, image interpretation, and how to create data that meets all national standards. The Region developed the basic modules and worked through a national workgroup to further the development. In 2011, the Region will continue to work with the national group until publication of the training modules.
Willamette Valley, Oregon, Status and Trends Report. The Region continued coordination with Region 1 for the completion of this report. For further details, refer to the Region 1 section. In addition, an article was written for publication in Environmental Law Institute (ELI) National Wetlands Newsletter.
Coordination with Others
Refuge Strategic Initiative. The purpose of this initiative was to produce contemporary digital data that would allow for more efficient project evaluation and assessment of impacts to the species of concern at each Refuge. The digital data
Region 8: Pacific Southwest
Region 8: Pacific Southwest By Elaine Blok Acting Regional Wetlands Coordinator USFWS, Region 8, Sacramento, CA
Region 8, Figure 1. Wetlands data area submitted by Torres Martinez Tribe.
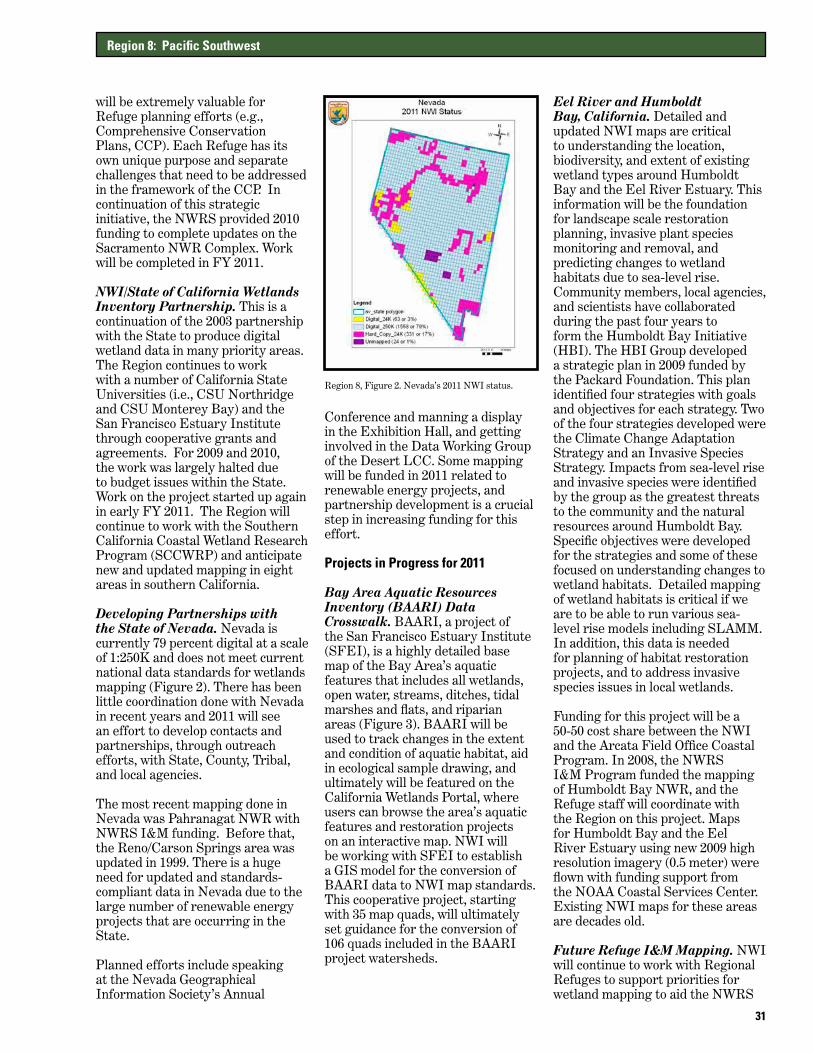
31
will be extremely valuable for Refuge planning efforts (e.g., Comprehensive Conservation Plans, CCP). Each Refuge has its own unique purpose and separate challenges that need to be addressed in the framework of the CCP. In continuation of this strategic initiative, the NWRS provided 2010 funding to complete updates on the Sacramento NWR Complex. Work will be completed in FY 2011.
NWI/State of California Wetlands Inventory Partnership. This is a continuation of the 2003 partnership with the State to produce digital wetland data in many priority areas. The Region continues to work with a number of California State Universities (i.e., CSU Northridge and CSU Monterey Bay) and the San Francisco Estuary Institute through cooperative grants and agreements. For 2009 and 2010, the work was largely halted due to budget issues within the State. Work on the project started up again in early FY 2011. The Region will continue to work with the Southern California Coastal Wetland Research Program (SCCWRP) and anticipate new and updated mapping in eight areas in southern California.
Developing Partnerships with the State of Nevada. Nevada is currently 79 percent digital at a scale of 1:250K and does not meet current national data standards for wetlands mapping (Figure 2). There has been little coordination done with Nevada in recent years and 2011 will see an effort to develop contacts and partnerships, through outreach efforts, with State, County, Tribal, and local agencies.
The most recent mapping done in Nevada was Pahranagat NWR with NWRS I&M funding. Before that, the Reno/Carson Springs area was updated in 1999. There is a huge need for updated and standards- compliant data in Nevada due to the large number of renewable energy projects that are occurring in the State.
Planned efforts include speaking at the Nevada Geographical Information Society’s Annual
Conference and manning a display in the Exhibition Hall, and getting involved in the Data Working Group of the Desert LCC. Some mapping will be funded in 2011 related to renewable energy projects, and partnership development is a crucial step in increasing funding for this effort.
Projects in Progress for 2011
Bay Area Aquatic Resources Inventory (BAARI) Data Crosswalk. BAARI, a project of the San Francisco Estuary Institute (SFEI), is a highly detailed base map of the Bay Area’s aquatic features that includes all wetlands, open water, streams, ditches, tidal marshes and flats, and riparian areas (Figure 3). BAARI will be used to track changes in the extent and condition of aquatic habitat, aid in ecological sample drawing, and ultimately will be featured on the California Wetlands Portal, where users can browse the area’s aquatic features and restoration projects on an interactive map. NWI will be working with SFEI to establish a GIS model for the conversion of BAARI data to NWI map standards. This cooperative project, starting with 35 map quads, will ultimately set guidance for the conversion of 106 quads included in the BAARI project watersheds.
Eel River and Humboldt Bay, California. Detailed and updated NWI maps are critical to understanding the location, biodiversity, and extent of existing wetland types around Humboldt Bay and the Eel River Estuary. This information will be the foundation for landscape scale restoration planning, invasive plant species monitoring and removal, and predicting changes to wetland habitats due to sea-level rise. Community members, local agencies, and scientists have collaborated during the past four years to form the Humboldt Bay Initiative (HBI). The HBI Group developed a strategic plan in 2009 funded by the Packard Foundation. This plan identified four strategies with goals and objectives for each strategy. Two of the four strategies developed were the Climate Change Adaptation Strategy and an Invasive Species Strategy. Impacts from sea-level rise and invasive species were identified by the group as the greatest threats to the community and the natural resources around Humboldt Bay. Specific objectives were developed for the strategies and some of these focused on understanding changes to wetland habitats. Detailed mapping of wetland habitats is critical if we are to be able to run various sea-level rise models including SLAMM. In addition, this data is needed for planning of habitat restoration projects, and to address invasive species issues in local wetlands.
Funding for this project will be a 50-50 cost share between the NWI and the Arcata Field Office Coastal Program. In 2008, the NWRS I&M Program funded the mapping of Humboldt Bay NWR, and the Refuge staff will coordinate with the Region on this project. Maps for Humboldt Bay and the Eel River Estuary using new 2009 high resolution imagery (0.5 meter) were flown with funding support from the NOAA Coastal Services Center. Existing NWI maps for these areas are decades old.
Future Refuge I&M Mapping. NWI will continue to work with Regional Refuges to support priorities for wetland mapping to aid the NWRS
Region 8: Pacific Southwest
Region 8, Figure 2. Nevada’s 2011 NWI status.
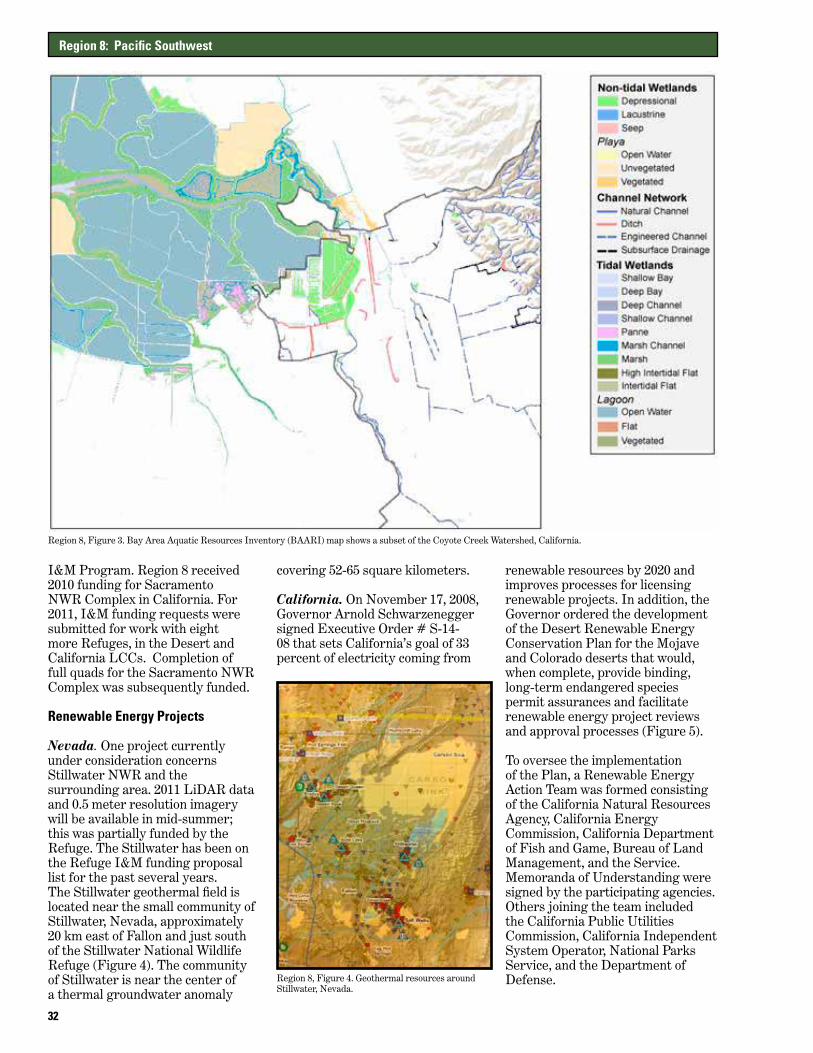
32
I&M Program. Region 8 received 2010 funding for Sacramento NWR Complex in California. For 2011, I&M funding requests were submitted for work with eight more Refuges, in the Desert and California LCCs. Completion of full quads for the Sacramento NWR Complex was subsequently funded.
Renewable Energy Projects
Nevada. One project currently under consideration concerns Stillwater NWR and the surrounding area. 2011 LiDAR data and 0.5 meter resolution imagery will be available in mid-summer; this was partially funded by the Refuge. The Stillwater has been on the Refuge I&M funding proposal list for the past several years. The Stillwater geothermal field is located near the small community of Stillwater, Nevada, approximately 20 km east of Fallon and just south of the Stillwater National Wildlife Refuge (Figure 4). The community of Stillwater is near the center of a thermal groundwater anomaly
covering 52-65 square kilometers.
California. On November 17, 2008, Governor Arnold Schwarzenegger signed Executive Order # S-14-08 that sets California’s goal of 33 percent of electricity coming from
renewable resources by 2020 and improves processes for licensing renewable projects. In addition, the Governor ordered the development of the Desert Renewable Energy Conservation Plan for the Mojave and Colorado deserts that would, when complete, provide binding, long-term endangered species permit assurances and facilitate renewable energy project reviews and approval processes (Figure 5).
To oversee the implementation of the Plan, a Renewable Energy Action Team was formed consisting of the California Natural Resources Agency, California Energy Commission, California Department of Fish and Game, Bureau of Land Management, and the Service. Memoranda of Understanding were signed by the participating agencies. Others joining the team included the California Public Utilities Commission, California Independent System Operator, National Parks Service, and the Department of Defense.
Region 8: Pacific Southwest
Region 8, Figure 3. Bay Area Aquatic Resources Inventory (BAARI) map shows a subset of the Coyote Creek Watershed, California.
Region 8, Figure 4. Geothermal resources around Stillwater, Nevada.
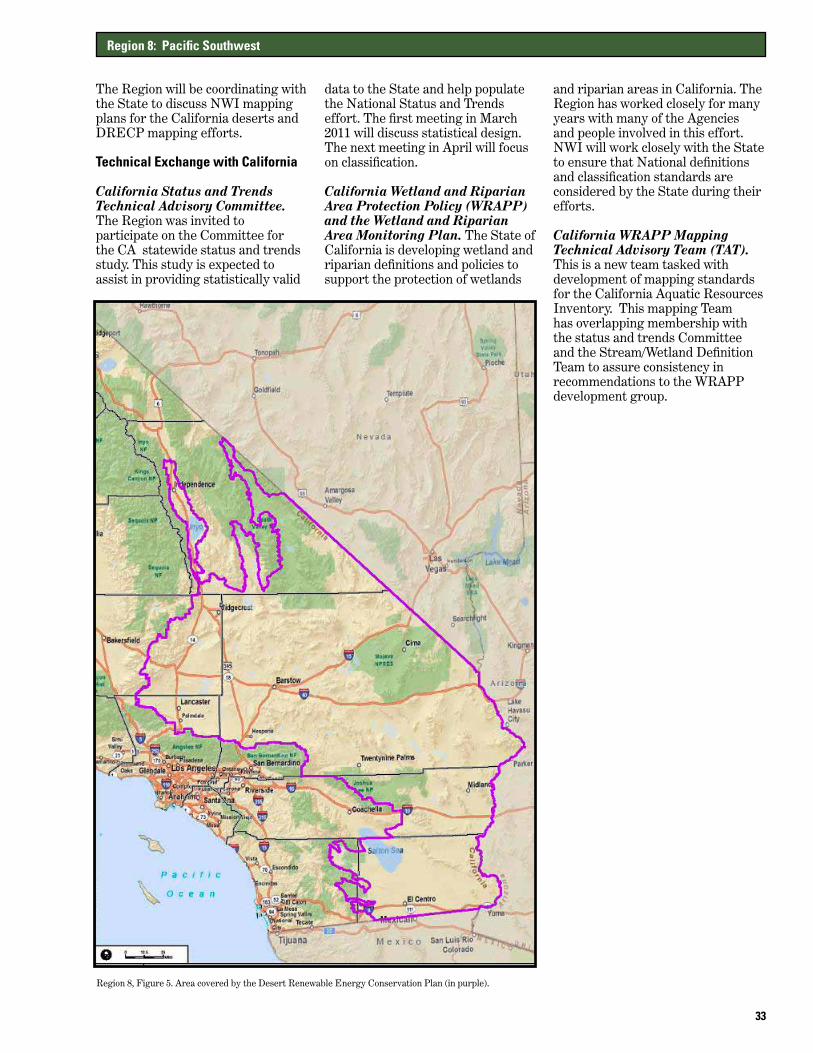
33
The Region will be coordinating with the State to discuss NWI mapping plans for the California deserts and DRECP mapping efforts.
Technical Exchange with California
California Status and Trends Technical Advisory Committee. The Region was invited to participate on the Committee for the CA statewide status and trends study. This study is expected to assist in providing statistically valid
data to the State and help populate the National Status and Trends effort. The first meeting in March 2011 will discuss statistical design. The next meeting in April will focus on classification.
California Wetland and Riparian Area Protection Policy (WRAPP) and the Wetland and Riparian Area Monitoring Plan. The State of California is developing wetland and riparian definitions and policies to support the protection of wetlands
and riparian areas in California. The Region has worked closely for many years with many of the Agencies and people involved in this effort. NWI will work closely with the State to ensure that National definitions and classification standards are considered by the State during their efforts.
California WRAPP Mapping Technical Advisory Team (TAT). This is a new team tasked with development of mapping standards for the California Aquatic Resources Inventory. This mapping Team has overlapping membership with the status and trends Committee and the Stream/Wetland Definition Team to assure consistency in recommendations to the WRAPP development group.
Region 8: Pacific Southwest
Region 8, Figure 5. Area covered by the Desert Renewable Energy Conservation Plan (in purple).
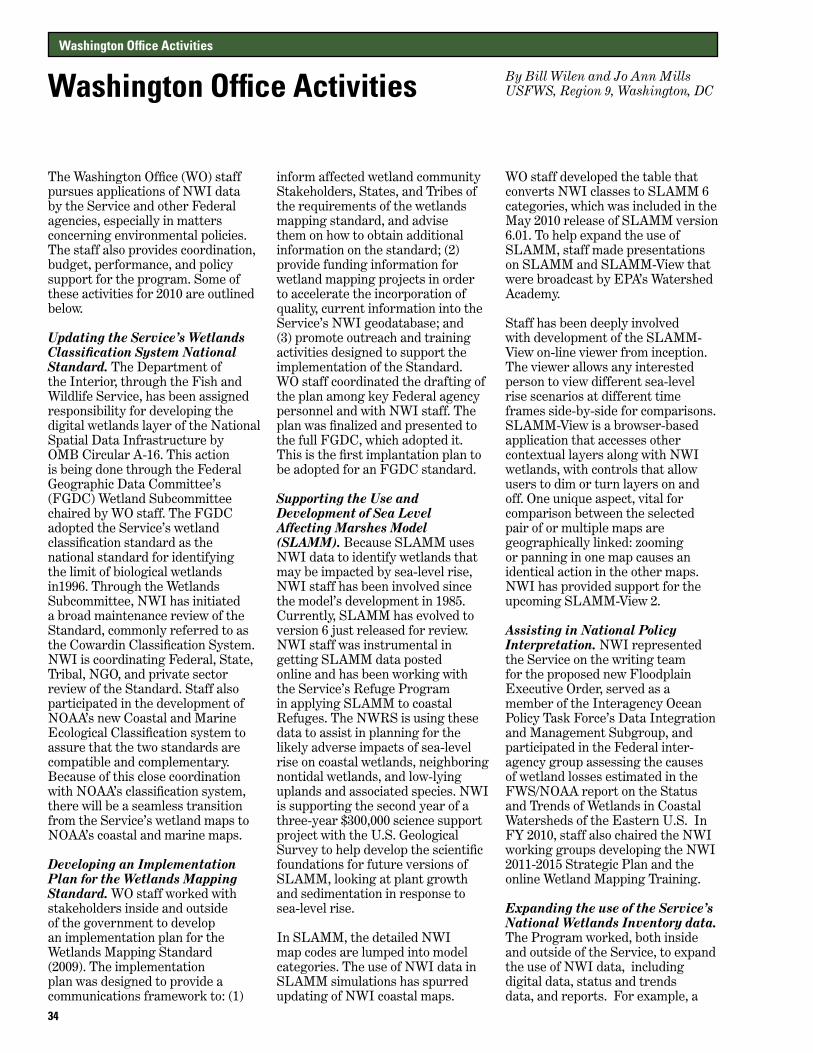
34
Washington Office Activities
Washington Office Activities By Bill Wilen and Jo Ann Mills USFWS, Region 9, Washington, DC
The Washington Office (WO) staff pursues applications of NWI data by the Service and other Federal agencies, especially in matters concerning environmental policies. The staff also provides coordination, budget, performance, and policy support for the program. Some of these activities for 2010 are outlined below.
Updating the Service’s Wetlands Classification System National Standard. The Department of the Interior, through the Fish and Wildlife Service, has been assigned responsibility for developing the digital wetlands layer of the National Spatial Data Infrastructure by OMB Circular A-16. This action is being done through the Federal Geographic Data Committee’s (FGDC) Wetland Subcommittee chaired by WO staff. The FGDC adopted the Service’s wetland classification standard as the national standard for identifying the limit of biological wetlands in1996. Through the Wetlands Subcommittee, NWI has initiated a broad maintenance review of the Standard, commonly referred to as the Cowardin Classification System. NWI is coordinating Federal, State, Tribal, NGO, and private sector review of the Standard. Staff also participated in the development of NOAA’s new Coastal and Marine Ecological Classification system to assure that the two standards are compatible and complementary. Because of this close coordination with NOAA’s classification system, there will be a seamless transition from the Service’s wetland maps to NOAA’s coastal and marine maps.
Developing an Implementation Plan for the Wetlands Mapping Standard. WO staff worked with stakeholders inside and outside of the government to develop an implementation plan for the Wetlands Mapping Standard (2009). The implementation plan was designed to provide a communications framework to: (1)
inform affected wetland community Stakeholders, States, and Tribes of the requirements of the wetlands mapping standard, and advise them on how to obtain additional information on the standard; (2) provide funding information for wetland mapping projects in order to accelerate the incorporation of quality, current information into the Service’s NWI geodatabase; and (3) promote outreach and training activities designed to support the implementation of the Standard. WO staff coordinated the drafting of the plan among key Federal agency personnel and with NWI staff. The plan was finalized and presented to the full FGDC, which adopted it. This is the first implantation plan to be adopted for an FGDC standard.
Supporting the Use and Development of Sea Level Affecting Marshes Model (SLAMM). Because SLAMM uses NWI data to identify wetlands that may be impacted by sea-level rise, NWI staff has been involved since the model’s development in 1985. Currently, SLAMM has evolved to version 6 just released for review. NWI staff was instrumental in getting SLAMM data posted online and has been working with the Service’s Refuge Program in applying SLAMM to coastal Refuges. The NWRS is using these data to assist in planning for the likely adverse impacts of sea-level rise on coastal wetlands, neighboring nontidal wetlands, and low-lying uplands and associated species. NWI is supporting the second year of a three-year $300,000 science support project with the U.S. Geological Survey to help develop the scientific foundations for future versions of SLAMM, looking at plant growth and sedimentation in response to sea-level rise.
In SLAMM, the detailed NWI map codes are lumped into model categories. The use of NWI data in SLAMM simulations has spurred updating of NWI coastal maps.
WO staff developed the table that converts NWI classes to SLAMM 6 categories, which was included in the May 2010 release of SLAMM version 6.01. To help expand the use of SLAMM, staff made presentations on SLAMM and SLAMM-View that were broadcast by EPA’s Watershed Academy.
Staff has been deeply involved with development of the SLAMM-View on-line viewer from inception. The viewer allows any interested person to view different sea-level rise scenarios at different time frames side-by-side for comparisons. SLAMM-View is a browser-based application that accesses other contextual layers along with NWI wetlands, with controls that allow users to dim or turn layers on and off. One unique aspect, vital for comparison between the selected pair of or multiple maps are geographically linked: zooming or panning in one map causes an identical action in the other maps. NWI has provided support for the upcoming SLAMM-View 2.
Assisting in National Policy Interpretation. NWI represented the Service on the writing team for the proposed new Floodplain Executive Order, served as a member of the Interagency Ocean Policy Task Force’s Data Integration and Management Subgroup, and participated in the Federal inter-agency group assessing the causes of wetland losses estimated in the FWS/NOAA report on the Status and Trends of Wetlands in Coastal Watersheds of the Eastern U.S. In FY 2010, staff also chaired the NWI working groups developing the NWI 2011-2015 Strategic Plan and the online Wetland Mapping Training.
Expanding the use of the Service’s National Wetlands Inventory data. The Program worked, both inside and outside of the Service, to expand the use of NWI data, including digital data, status and trends data, and reports. For example, a
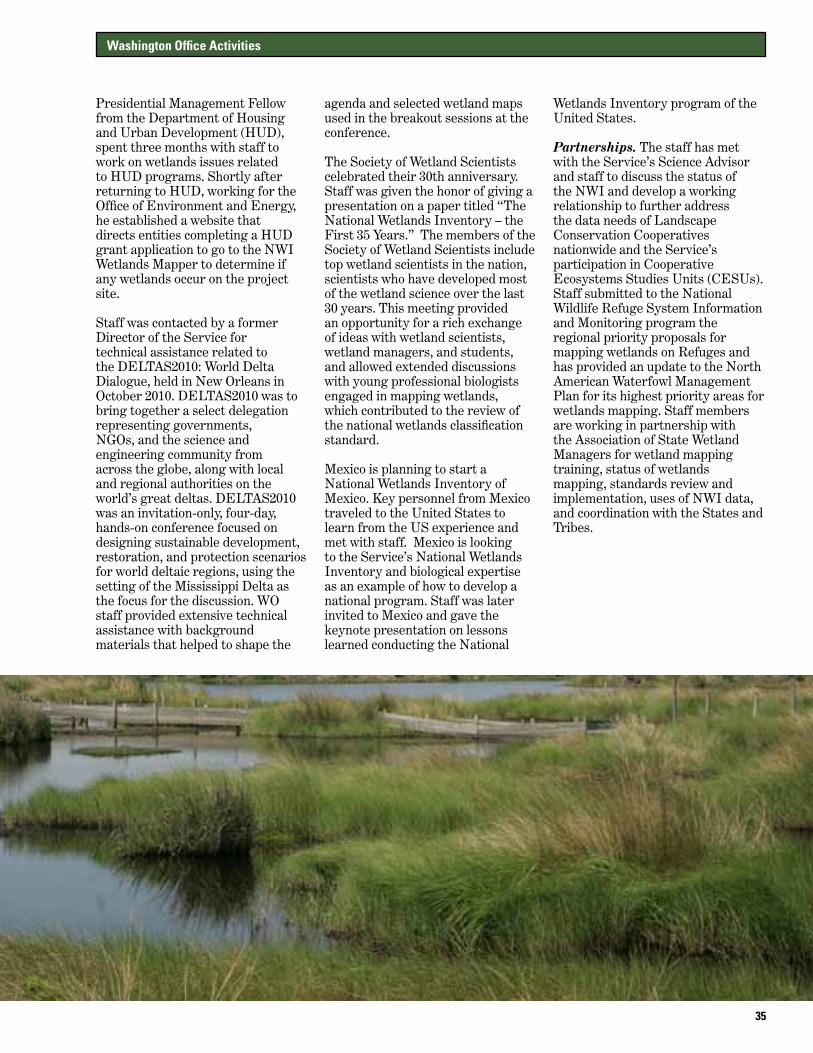
35
Presidential Management Fellow from the Department of Housing and Urban Development (HUD), spent three months with staff to work on wetlands issues related to HUD programs. Shortly after returning to HUD, working for the Office of Environment and Energy, he established a website that directs entities completing a HUD grant application to go to the NWI Wetlands Mapper to determine if any wetlands occur on the project site.
Staff was contacted by a former Director of the Service for technical assistance related to the DELTAS2010: World Delta Dialogue, held in New Orleans in October 2010. DELTAS2010 was to bring together a select delegation representing governments, NGOs, and the science and engineering community from across the globe, along with local and regional authorities on the world’s great deltas. DELTAS2010 was an invitation-only, four-day, hands-on conference focused on designing sustainable development, restoration, and protection scenarios for world deltaic regions, using the setting of the Mississippi Delta as the focus for the discussion. WO staff provided extensive technical assistance with background materials that helped to shape the
agenda and selected wetland maps used in the breakout sessions at the conference.
The Society of Wetland Scientists celebrated their 30th anniversary. Staff was given the honor of giving a presentation on a paper titled “The National Wetlands Inventory – the First 35 Years.” The members of the Society of Wetland Scientists include top wetland scientists in the nation, scientists who have developed most of the wetland science over the last 30 years. This meeting provided an opportunity for a rich exchange of ideas with wetland scientists, wetland managers, and students, and allowed extended discussions with young professional biologists engaged in mapping wetlands, which contributed to the review of the national wetlands classification standard.
Mexico is planning to start a National Wetlands Inventory of Mexico. Key personnel from Mexico traveled to the United States to learn from the US experience and met with staff. Mexico is looking to the Service’s National Wetlands Inventory and biological expertise as an example of how to develop a national program. Staff was later invited to Mexico and gave the keynote presentation on lessons learned conducting the National
Wetlands Inventory program of the United States.
Partnerships. The staff has met with the Service’s Science Advisor and staff to discuss the status of the NWI and develop a working relationship to further address the data needs of Landscape Conservation Cooperatives nationwide and the Service’s participation in Cooperative Ecosystems Studies Units (CESUs). Staff submitted to the National Wildlife Refuge System Information and Monitoring program the regional priority proposals for mapping wetlands on Refuges and has provided an update to the North American Waterfowl Management Plan for its highest priority areas for wetlands mapping. Staff members are working in partnership with the Association of State Wetland Managers for wetland mapping training, status of wetlands mapping, standards review and implementation, uses of NWI data, and coordination with the States and Tribes.
Washington Office Activities
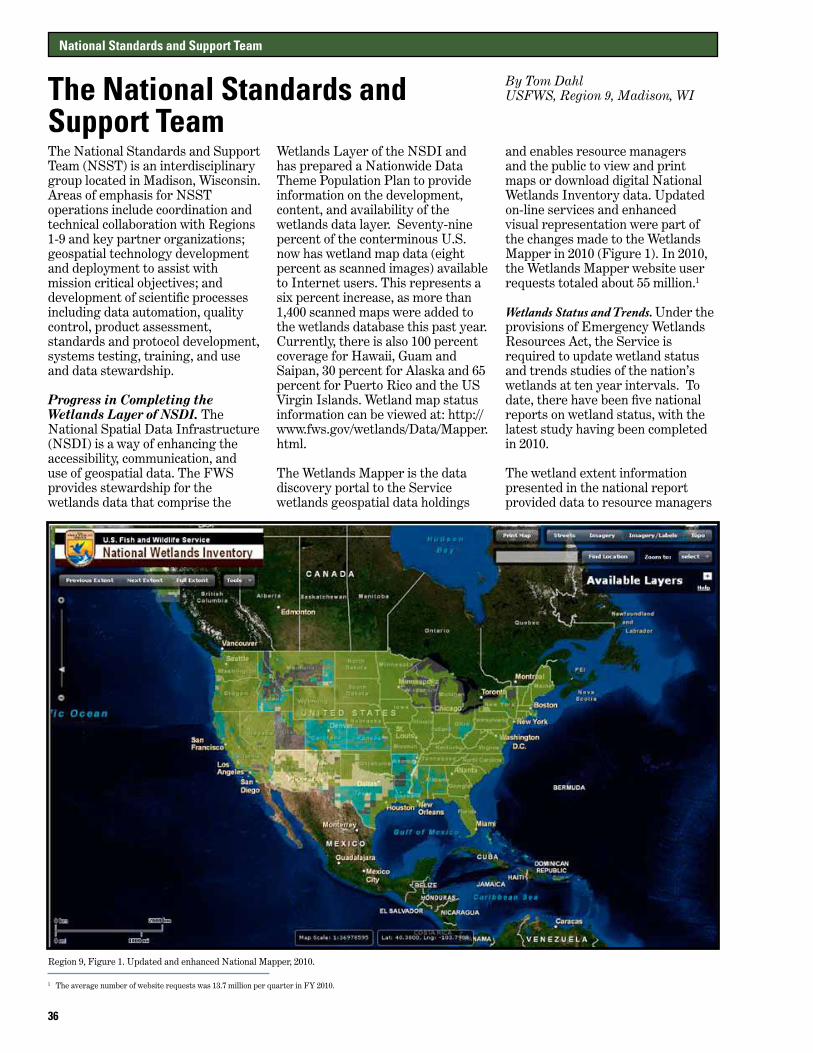
36
National Standards and Support Team
The National Standards and Support Team
By Tom Dahl USFWS, Region 9, Madison, WI
The National Standards and Support Team (NSST) is an interdisciplinary group located in Madison, Wisconsin. Areas of emphasis for NSST operations include coordination and technical collaboration with Regions 1-9 and key partner organizations; geospatial technology development and deployment to assist with mission critical objectives; and development of scientific processes including data automation, quality control, product assessment, standards and protocol development, systems testing, training, and use and data stewardship.
Progress in Completing the Wetlands Layer of NSDI. The National Spatial Data Infrastructure (NSDI) is a way of enhancing the accessibility, communication, and use of geospatial data. The FWS provides stewardship for the wetlands data that comprise the
Wetlands Layer of the NSDI and has prepared a Nationwide Data Theme Population Plan to provide information on the development, content, and availability of the wetlands data layer. Seventy-nine percent of the conterminous U.S. now has wetland map data (eight percent as scanned images) available to Internet users. This represents a six percent increase, as more than 1,400 scanned maps were added to the wetlands database this past year. Currently, there is also 100 percent coverage for Hawaii, Guam and Saipan, 30 percent for Alaska and 65 percent for Puerto Rico and the US Virgin Islands. Wetland map status information can be viewed at: http://www.fws.gov/wetlands/Data/Mapper.html.
The Wetlands Mapper is the data discovery portal to the Service wetlands geospatial data holdings
and enables resource managers and the public to view and print maps or download digital National Wetlands Inventory data. Updated on-line services and enhanced visual representation were part of the changes made to the Wetlands Mapper in 2010 (Figure 1). In 2010, the Wetlands Mapper website user requests totaled about 55 million.1
Wetlands Status and Trends. Under the provisions of Emergency Wetlands Resources Act, the Service is required to update wetland status and trends studies of the nation’s wetlands at ten year intervals. To date, there have been five national reports on wetland status, with the latest study having been completed in 2010.
The wetland extent information presented in the national report provided data to resource managers
Region 9, Figure 1. Updated and enhanced National Mapper, 2010.
1 The average number of website requests was 13.7 million per quarter in FY 2010.
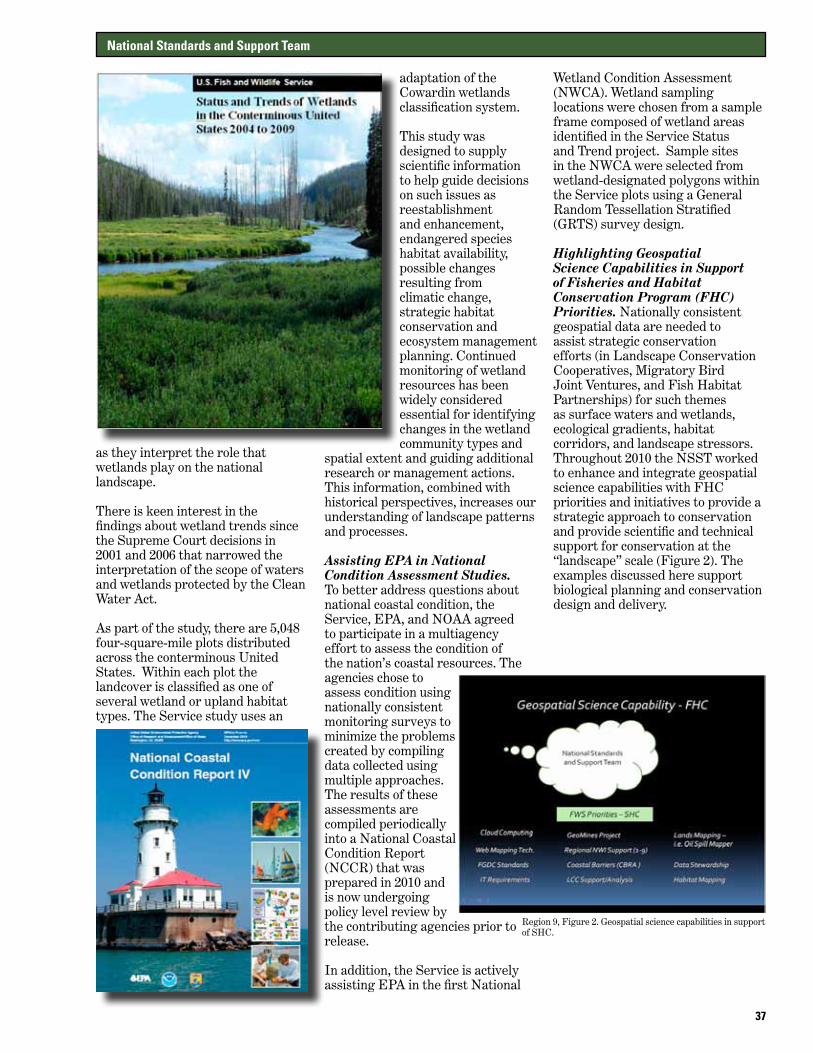
37
as they interpret the role that wetlands play on the national landscape.
There is keen interest in the findings about wetland trends since the Supreme Court decisions in 2001 and 2006 that narrowed the interpretation of the scope of waters and wetlands protected by the Clean Water Act.
As part of the study, there are 5,048 four-square-mile plots distributed across the conterminous United States. Within each plot the landcover is classified as one of several wetland or upland habitat types. The Service study uses an
adaptation of the Cowardin wetlands classification system.
This study was designed to supply scientific information to help guide decisions on such issues as reestablishment and enhancement, endangered species habitat availability, possible changes resulting from climatic change, strategic habitat conservation and ecosystem management planning. Continued monitoring of wetland resources has been widely considered essential for identifying changes in the wetland community types and
spatial extent and guiding additional research or management actions. This information, combined with historical perspectives, increases our understanding of landscape patterns and processes.
Assisting EPA in National Condition Assessment Studies. To better address questions about national coastal condition, the Service, EPA, and NOAA agreed to participate in a multiagency effort to assess the condition of the nation’s coastal resources. The agencies chose to assess condition using nationally consistent monitoring surveys to minimize the problems created by compiling data collected using multiple approaches. The results of these assessments are compiled periodically into a National Coastal Condition Report (NCCR) that was prepared in 2010 and is now undergoing policy level review by the contributing agencies prior to release.
In addition, the Service is actively assisting EPA in the first National
Wetland Condition Assessment (NWCA). Wetland sampling locations were chosen from a sample frame composed of wetland areas identified in the Service Status and Trend project. Sample sites in the NWCA were selected from wetland-designated polygons within the Service plots using a General Random Tessellation Stratified (GRTS) survey design.
Highlighting Geospatial Science Capabilities in Support of Fisheries and Habitat Conservation Program (FHC)Priorities. Nationally consistent geospatial data are needed to assist strategic conservation efforts (in Landscape Conservation Cooperatives, Migratory Bird Joint Ventures, and Fish Habitat Partnerships) for such themes as surface waters and wetlands, ecological gradients, habitat corridors, and landscape stressors. Throughout 2010 the NSST worked to enhance and integrate geospatial science capabilities with FHC priorities and initiatives to provide a strategic approach to conservation and provide scientific and technical support for conservation at the “landscape” scale (Figure 2). The examples discussed here support biological planning and conservation design and delivery.
National Standards and Support Team
Region 9, Figure 2. Geospatial science capabilities in support of SHC.
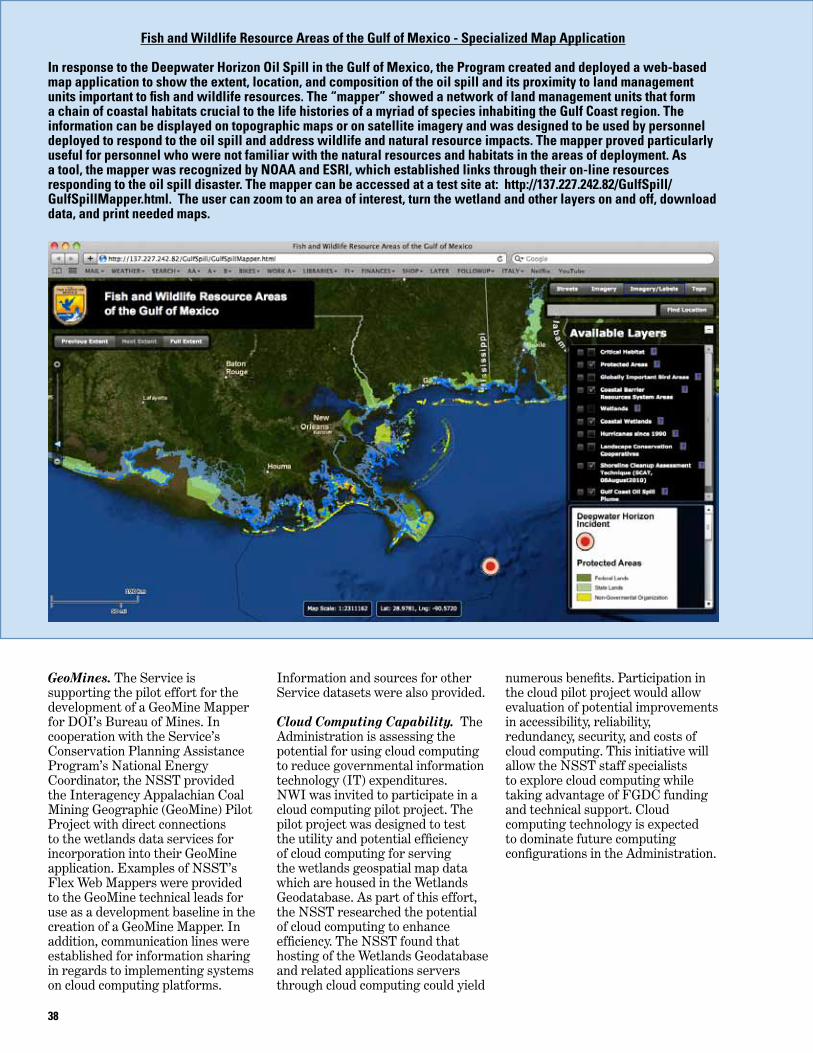
38
GeoMines. The Service is supporting the pilot effort for the development of a GeoMine Mapper for DOI’s Bureau of Mines. In cooperation with the Service’s Conservation Planning Assistance Program’s National Energy Coordinator, the NSST provided the Interagency Appalachian Coal Mining Geographic (GeoMine) Pilot Project with direct connections to the wetlands data services for incorporation into their GeoMine application. Examples of NSST’s Flex Web Mappers were provided to the GeoMine technical leads for use as a development baseline in the creation of a GeoMine Mapper. In addition, communication lines were established for information sharing in regards to implementing systems on cloud computing platforms.
Information and sources for other Service datasets were also provided.
Cloud Computing Capability. The Administration is assessing the potential for using cloud computing to reduce governmental information technology (IT) expenditures. NWI was invited to participate in a cloud computing pilot project. The pilot project was designed to test the utility and potential efficiency of cloud computing for serving the wetlands geospatial map data which are housed in the Wetlands Geodatabase. As part of this effort, the NSST researched the potential of cloud computing to enhance efficiency. The NSST found that hosting of the Wetlands Geodatabase and related applications servers through cloud computing could yield
numerous benefits. Participation in the cloud pilot project would allow evaluation of potential improvements in accessibility, reliability, redundancy, security, and costs of cloud computing. This initiative will allow the NSST staff specialists to explore cloud computing while taking advantage of FGDC funding and technical support. Cloud computing technology is expected to dominate future computing configurations in the Administration.
Fish and Wildlife Resource Areas of the Gulf of Mexico - Specialized Map Application
In response to the Deepwater Horizon Oil Spill in the Gulf of Mexico, the Program created and deployed a web-based map application to show the extent, location, and composition of the oil spill and its proximity to land management units important to fish and wildlife resources. The “mapper” showed a network of land management units that form a chain of coastal habitats crucial to the life histories of a myriad of species inhabiting the Gulf Coast region. The information can be displayed on topographic maps or on satellite imagery and was designed to be used by personnel deployed to respond to the oil spill and address wildlife and natural resource impacts. The mapper proved particularly useful for personnel who were not familiar with the natural resources and habitats in the areas of deployment. As a tool, the mapper was recognized by NOAA and ESRI, which established links through their on-line resources responding to the oil spill disaster. The mapper can be accessed at a test site at: http://137.227.242.82/GulfSpill/GulfSpillMapper.html. The user can zoom to an area of interest, turn the wetland and other layers on and off, download data, and print needed maps.
39
Appendices
APPENDIX A: List of 2010 NWI Contributors and Cooperators(Prepared by Jo Ann Mills, Washington Office)
NWI Budget 2010. The National Wetlands Inventory Congressionally-appropriated funding in FY 2010 was $5.6 million, with a Senate-directed increase from FY 2009 of $250,000. In addition, Landscape Conservation Cooperatives (LCCs) contributed $375,000 to wetlands mapping, including a project in Montana for the Plains and Prairie Pothole LLC and a project in Wisconsin for the Upper Mississippi and Great Lakes LCC. The National Wildlife Refuge System’s Information and Monitoring Program also provided $250,000 to update wetland digital data for nine Refuges, with data to be used for their Comprehensive Conservation Plans (CCPs). Appropriated funding was just above the 1985 funding level and total funding represented 38 percent of the level of peak funding available for wetlands mapping in 1993.
Partners contributed an additional $1.4 million in products or services to produce or digitize data for the wetlands layer, for a 1.8:1 external partners-to-NWI dollar leveraging for mapping projects.
FY 2010 contributing partners and cooperators* are listed below. Contributed data are noted in Appendix B.
Cooperator, Indirect Funding
Colorado Natural Heritage Program
Delaware Department of Natural Resources and Environmental Conservation
FWS Partners Program
Georgia Department of Natural Resources
Iowa Department of Natural Resources
Massachusetts Department of Environmental Protection
Minnesota Department of Natural Resources
Montana Natural Heritage Program
Navajo Nation
North Carolina Department of Natural Resources
New Mexico Environment Dept.
Oklahoma Conservation Commission
Texas Tech University
U.S. Army Corps of Engineers
USFS (TVA)
Wisconsin Department of Natural Resources
Cooperator, Direct Funding
Connecticut Department of Environmental Protection
Department of Defense (Alabama)
Department of Defense (Florida)
FWS Migratory Bird Program
FWS NWR System
FWS Plains and Prairie Potholes LCC
FWS Region 3 (EPA)
FWS Upper Mississippi and Great Lakes LCC (Wisconsin)
HAPET
Hoopa Valley
New Mexico Environment Department
Southern California Coastal Wetland Research Project
FWS Region 7 Fisheries and Ecological Services
*A more comprehensive list of contributors and cooperators over the past 30 years can be found in: Tiner, R.W. (editor). 2009. Status Report for the National Wetlands Inventory Program: 2009. U.S. Fish and Wildlife Service, Division of Habitat and Resource Conservation, Branch of Resource and Mapping Support, Arlington, VA. 48 pp.
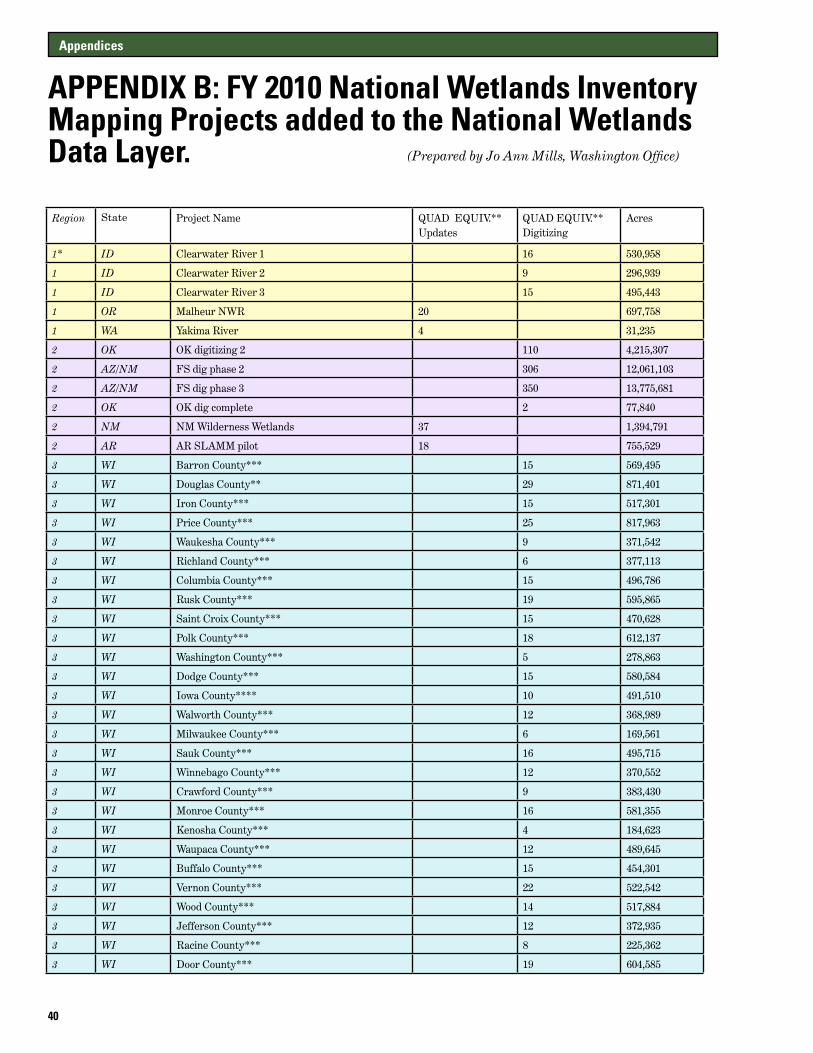
40
Appendices
APPENDIX B: FY 2010 National Wetlands Inventory Mapping Projects added to the National Wetlands Data Layer. (Prepared by Jo Ann Mills, Washington Office)
Region State Project Name QUAD EQUIV.** Updates
QUAD EQUIV.** Digitizing
Acres
1* ID Clearwater River 1 16 530,958
1 ID Clearwater River 2 9 296,939
1 ID Clearwater River 3 15 495,443
1 OR Malheur NWR 20 697,758
1 WA Yakima River 4 31,235
2 OK OK digitizing 2 110 4,215,307
2 AZ/NM FS dig phase 2 306 12,061,103
2 AZ/NM FS dig phase 3 350 13,775,681
2 OK OK dig complete 2 77,840
2 NM NM Wilderness Wetlands 37 1,394,791
2 AR AR SLAMM pilot 18 755,529
3 WI Barron County*** 15 569,495
3 WI Douglas County** 29 871,401
3 WI Iron County*** 15 517,301
3 WI Price County*** 25 817,963
3 WI Waukesha County*** 9 371,542
3 WI Richland County*** 6 377,113
3 WI Columbia County*** 15 496,786
3 WI Rusk County*** 19 595,865
3 WI Saint Croix County*** 15 470,628
3 WI Polk County*** 18 612,137
3 WI Washington County*** 5 278,863
3 WI Dodge County*** 15 580,584
3 WI Iowa County**** 10 491,510
3 WI Walworth County*** 12 368,989
3 WI Milwaukee County*** 6 169,561
3 WI Sauk County*** 16 495,715
3 WI Winnebago County*** 12 370,552
3 WI Crawford County*** 9 383,430
3 WI Monroe County*** 16 581,355
3 WI Kenosha County*** 4 184,623
3 WI Waupaca County*** 12 489,645
3 WI Buffalo County*** 15 454,301
3 WI Vernon County*** 22 522,542
3 WI Wood County*** 14 517,884
3 WI Jefferson County*** 12 372,935
3 WI Racine County*** 8 225,362
3 WI Door County*** 19 604,585

41
4 GA Georgia Coast*** 71 2,887,164
4 FL Cape Canaveral pilot 2 83,786
4 TN W TN Updates 9 351,132
4 SC South Carolina Digits 32 1,262,502
4 SC Reidville Correction 1 39,191
4 LA Breton NWR 10 391,976
4 FL FL refuge 18 778,565
4 LA Bon Secour Refuge 1 27,038
4 FL St Vincent NWR 1 34,927
4 FL Pinellas Ten Thou NWR 6 231,945
4 LA Delta NWR 4 181,113
4 FL FL refuge 2 13 589,846
4 NC/SC NC SC refuge updates 51 1,978,732
6 MT Flathead Valley new*** 59 1,881,148
6 MT Upper Clark Fork Watershed*** 43 1,420,830
6 MT Rocky Boys Res*** 11 350,393
6 UT NE Utah digitizing 235 8,596,133
6 CO North Platte FY09*** 44 1,595,546
6 CO Rio Grande FY09*** 60 2,269,338
6 CO Gilpin County*** 7 256,829
6 MT Ruby Valley*** 36 1,213,919
6 MT Swan Watershed*** 7 225,003
6 MT Yellowstone River Corridor*** 23 747,794
6 MT Yellowstone Phase 2*** 28 923,949
6 MT Yellowstone Phase 3*** 22 735,016
6 MT Yellowstone Phase 4*** 18 603,942
6 CO El Paso County*** 39 1,450,347
7 AK Fairbanks Status and Trends 5 199,078
8* CA So CA Grant Area 10 17 624,118
8 CA Humboldt Bay NWR 1 3,335
8 CA CA desert surprise 20 775,251
8 CA Salinas Correct 18 692,901
8 CA Torres Martinez 1 18,372
8 CA Salinas Phase 3 add on 5 194,134
* Regions 1 and 8 were reported together in FY 2010.
** 7.5 minute quad; 1:24,000 scale; average 35,200 acres. AK converted from 1:63,360. Updates are new or updated, modernized (finer scale) digital data. Digitized data are from existing maps (older imagery and coarser scale) that were scanned and digitized, or converted from non-standard data, but not updated or modernized.
*** Contributed data from our Partners and Cooperators (Appendix A).
Regions
Region 1: Pacific Northwest, Portland, OR Region 2: Southwest, Albuquerque, NM Region 3: Great Lakes and Big Rivers, Twin Cities, MN Region 4: Southeast, Atlanta, GA Region 5: Northeast, Hadley, MA Region 6: Mountains and Prairie, Denver, CO Region 7: Alaska, Anchorage, AK Region 8: California/Nevada, Sacramento, CA

42
APPENDIX C: Landscape Conservation Cooperatives Boundaries and Mapping Status
Appendices

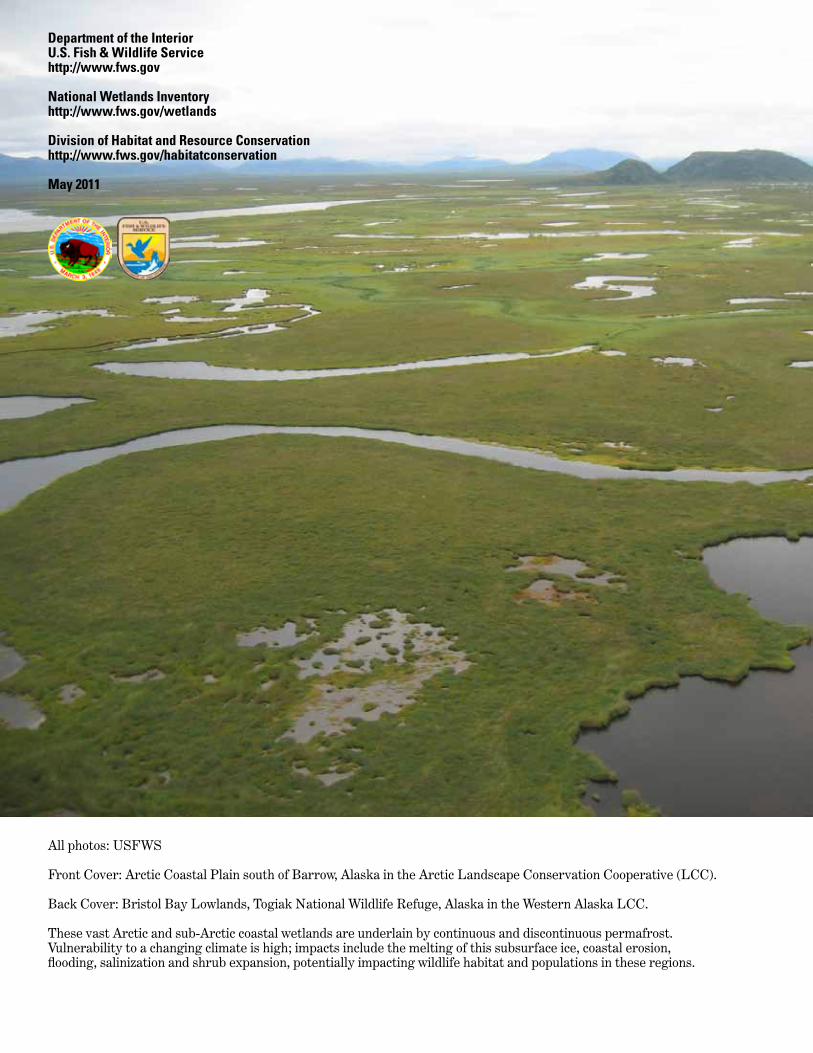
Department of the InteriorU.S. Fish & Wildlife Servicehttp://www.fws.gov
National Wetlands Inventoryhttp://www.fws.gov/wetlands
Division of Habitat and Resource Conservationhttp://www.fws.gov/habitatconservation
May 2011
All photos: USFWS
Front Cover: Arctic Coastal Plain south of Barrow, Alaska in the Arctic Landscape Conservation Cooperative (LCC).
Back Cover: Bristol Bay Lowlands, Togiak National Wildlife Refuge, Alaska in the Western Alaska LCC.
These vast Arctic and sub-Arctic coastal wetlands are underlain by continuous and discontinuous permafrost. Vulnerability to a changing climate is high; impacts include the melting of this subsurface ice, coastal erosion, flooding, salinization and shrub expansion, potentially impacting wildlife habitat and populations in these regions.