
US Family Travel Survey - NYU School of Professional...
36
US Family Travel Survey September 2015
Transcript of US Family Travel Survey - NYU School of Professional...
US Family Travel Survey
September 2015

2

3
TABLE OF CONTENTS
Introduction 4
Study Highlights 8
Survey Overview and Respondents 9
Survey Respondents 10
Travel Behavior 12
Travel Challenges 19
Travel Attitudes 27
Travel Decision-Making 30
Conclusion 32
4
INTRODuCTION
Rainer Jenss
FTA Family Travel Study 2015: Income Influences HOW American Families Travel, but WHY They Travel is a Matter of Attitude
The Family Travel Association (FTA) was founded in the fall of 2014 with one primary objec-tive: bring the travel industry together to inspire families to travel – and to travel more. After all, travel’s power to transform children and potentially change their lives is something that most of us can appreciate.
With family and multigenerational travel now one of the hottest and fastest-growing seg-ments of the entire tourism industry, accounting for over one-third of all leisure trips, some might wonder why investing in the growth of this sector is even necessary. After all, at a time when a record number of families are traveling, shouldn’t the industry focus its attention on other emerging categories?
There are several reasons why I believe that today, right now, is precisely the time to double down on family travel. Besides the not-so-inconsequential detail that America looks to be lagging behind the rest of the developed world in producing global workers, I’ve always main-tained that not enough parents in the U.S. place the same priority on the value of travel as their counterparts overseas. This is a broad generalization, of course, and yet there does seem to be a consensus among strong voices in the industry with whom I have talked about this.
But has there been any in-depth research about travel attitudes and challenges for uS families? Not really.
So to learn more about what’s really going on in this country when it comes to families and their travel habits and attitudes, we joined forces with the NYU School of Professional Studies Tisch Center for Hospitality and Tourism to take a snapshot of the market today. What we got back was new and groundbreaking research into how families make travel decisions and the barriers they face in doing so, as well as how differently parents prioritize traveling with their kids.
“We were very excited to work with the Family Travel Association on this study,” said Dr. Lynn Minnaert, clinical assistant professor at NYU School of Professional Studies. “This is an under-researched area in the tourism literature, and we hope that the study will help the travel indus-try provide better products and services for families in the future.”
What did we learn? For starters, we appear to be correct in our premise that, despite the steady increase in family/multigenerational travel, there’s still plenty of room for growth!
As we sifted through the data, three distinct profiles for groups of family travelers emerged. The first group, which we call the Hassle-Free Travelers prefers travel options that require little effort and research. They appreciate the value of travel, but are looking for travel options that can be booked and enjoyed easily. While they are not averse to international travel, they are likely to book an all-inclusive resort or go on an organized tour where the travel planning is done for them. They are less likely to value travel over material possessions, and least likely to take their children out of school to travel.

5
The second group, or Cautious Travelers, is more willing to spend time researching and pre-paring for travel, and is—at least in theory—more willing to try a wider variety of travel op-tions. In addition, most are more willing for their kids to miss school to travel. However, they worry about safety, hygiene, food options, finding appropriate activities for the children, and whether they are getting value for their money. Because of these uncertainties, they tend to revert to ‘safe bets’ such as family-friendly hotels and theme parks. But because they feel that travel strengthens family bonds and makes children better global citizens, the members of this group seem to be sold on the value of traveling with their kids, even when they are not sure where to go and what to do, or are just too nervous to leave their comfort zones.
Finally, there are the Intrepid Travelers. They tend to opt for new destinations each time they travel, are most likely to take their kids out of school for vacations, value travel over material possessions, and like to travel to different cultures and unusual destinations. And while all families want to keep their children safe while traveling, this is not the main focus for this group.
The Cautious Travelers were found to be the dominant group in this survey. What does this mean? I submit it confirms that a significant proportion of the population is very will-ing to travel—and travel more with children—but is not doing so without help. These people are struggling to find meaningful information about where to go and what to do, and need assistance finding value-for-money travel options that offer the experiences for which they are looking, and seek reassurance that their families will be safe while on the road.
I would even argue that this is great news, as it represents a tremendous opportunity for the industry. If we continue to nurture the Intrepid Travelers, help the Cautious Travelers with their concerns, and cater in new ways to the Hassle-Free Travelers, we could see an even greater acceleration in the growth of family and multigenerational travel in the years to come.
Please take a deep dive into the research and let me know what specific data points interest you. As a member of the FTA, you have complete access to all the information and we are happy to provide further analysis in the categories of your interest. After all, helping our mem-bers better understand this market also is one of our top priorities.
Best regards,
Rainer Jenss
President & Founder Family Travel Association

6
INTRODuCTION
Lynn Minnaert
Demographic vs. Psychographic Influencers in Family Travel: The ‘How’ Versus the ‘Why’
Family tourism is an under-researched subject area: only relatively recently has it received the academic attention it deserves as an important social phenomenon. This exploratory study of the travel behaviors, challenges, attitudes, and decision-making processes of U.S. families contributes to this emerging field and has examined the influence of demographic factors (for example: income, age, number of children) and psychographic factors (for example: attitudes toward travel and life) on how families in the U.S. make travel decisions.
To examine these questions, an electronic survey was developed by the Family Travel Association and the NYU School of Professional Studies Tisch Center for Hospitality and Tourism. The survey was extensively tested and then distributed by SmartyPants and Scholastic. The support of both organizations for the study has been invaluable and we greatly thank them for their involvement. Their efforts made it possible for us to collect a total of 2,614 responses.
The findings reveal that in the demographic factors, only household income plays a signifi-cant role in the way families travel. Affordability is the biggest factor in determining whether and how families choose to travel. The age and gender of the respondents; the number, gender, and age of the children; and the educational level of the respondents all have limited to no impact.
A family’s higher household income positively correlates with:
• Higher travel spend
•Lower likelihood affordability is a major challenge
•Higher likelihood to travel internationally
•Higher likelihood to have taken most trip types (except camping)
•Higher likelihood to plan most trip types in the future (except camping)
•Higher preference for resorts
•Higher preference for air travel
However, it also was found that income does not tell the whole story. While income determines in many ways HOW families travel, it does not show clear relationships with WHY people travel. The three psychographic family travel types we have discovered (Hassle-Free Travelers, Cautious Travelers, and Intrepid Travelers) span different income brackets and educational levels.

7
Psychographic factors determine:
•Which travel products families prefer
•Whether families are likely to try different destinations each time they travel
•The level of research families are willing to do before traveling
•The extent to which families worry about safety, cleanliness, and value for money
•The likelihood of families taking their children out of school to travel
•The extent to which families value travel over material possessions
It is in this complex combination of demographics and psychographics, of affordability and travel preference, that substantial further growth in family travel is possible. Currently, the information that is available about travel options and providers can be overwhelming. A tailored resource specifically directed at families and differentiating between travel options that suit different budgets and preferences is perhaps sorely lacking.
We wish to thank our respondents, collaborators, and supporters who have made this study possible. We hope you enjoy reading it.
Dr. Lynn Minnnaert
Academic Co-Chair, Clinical Assistant Professor NYu School of Professional Studies Tisch Center for Hospitality and Tourism
8
STuDY HIgHLIgHTS
In this exploratory study, the Family Travel Association and the NYU School of Professional Studies Tisch Center for Hospitality and Tourism examine the under-researched phenomenon of family travel in the U.S. The study explores the following about families:
• Travel behavior and preferences
•Travel challenges
•Travel attitudes
•Travel decision making
Key Findings
• 93% of the respondents are either ‘very likely’ or ‘likely’ to travel with their children in the next two years.
• Respondents took an average of 3.53 domestic trips and 1.25 international trips with their children in the past year.
• Families most prefer to travel with their children when the children are between 6 and 12 years of age.
• Of the respondents who had paid vacation days, over 50% did not use them all last year.
• The respondents highly value the educational and emotional benefits of travel.
• Search engines are the most important information source for many families as they research travel options but do not always provide information that is seen to be reliable and trustworthy.
• Affordability is the most prominent challenge for family travel. While this mainly affects lower income families, even higher income families raise this as a concern.
• Travel attitudes and preferences are, however, not clearly linked to demographic factors (for example, family income), pointing instead to psychographic explanations.
• Three psychographic profiles were distinguished: Hassle-Free Travelers, Cautious Travelers and Intrepid Travelers. Each profile has its own attributes and characteristics. The three psychographic profiles are not dependent on the income or educational level of the respondent, but are related to values and attitudes.

9
SuRVEY OVERVIEW AND RESPONDENTS
Survey Design and Administration
The survey presented here consisted of six survey blocks:
• Qualifiers: Only respondents who were over the age of 18 and who had children 17 years of age or younger, were eligible to take the survey.
• Travel Behavior: Questions in this block focused on the frequency of travel; the travel types respondents had participated in; the travel types in which respondents were likely to participate in the future; preferred transport and accommodation for family vacations; and preferred age for traveling with children.
• Travel Challenges: Questions in this block focused on the factors that can make family travel more difficult, and their relative prevalence. All respondents were asked to assess a core list of challenges, after which the respondents were randomly assigned three challenges to assess in further detail.
• Travel Attitudes: In this block, respondents were asked the extent to which they agreed with a series of attitudinal statements about family travel.
• Travel Decision-Making: In this block, respondents were asked to rank information sources for travel and assess the level of influence the children had in the decision-making process.
• Demographics: Respondents were asked to identify their gender, income level, state, education level, ethnic background, and the number of paid vacation days to which they have access.
The survey was designed in Qualtrics and distributed via SmartyPants and Scholastic. The survey was in the field from February 2015 through May 2015.

10
SuRVEY RESPONDENTS
Respondents by age
Respondents by number of children
63%
31%
1%
5%
18-29
30-44
45-59
60-75
2,614 respondents
Male Female
24%
43%
20%
9% 2% 2%
0%
10%
20%
30%
40%
50%
1 2 3 4 5 6 or more
Respondents by sex
10% 90%

11
Respondents by education
Respondents by ethnicity
47 States represented
Geographical spread
Respondents by household income
Less than high school diploma
High school diploma
Undergraduate degree
Masters degree or above
1%
34%
45%
20%
0% 10% 20% 30% 40% 50%
White Hispanicor Latin
Black NativeAmerican
Asian Other
82%
6% 5% 0% 5% 1%0%
20%
40%
60%
80%
100%
0%
5%
10%
15%
20%
Less than $40,000
$40,000 – $59,999
$60,000 – $79,999
$80,000 – $99,999
$100,000 –
$149,999
Over $150,000
No answer
14% 14%10% 11%
16% 16%18%

12
TRAVEL BEHAVIOR
u.S. families love to travel! 93% of the respondent were either “very likely” or “likely” to travel with their children in the next two years. Only 2% were “unlikely” or “very unlikely” to travel with their children.
How likely are you to travel with your children in the next 2 years?
79%
14%
5% 1% 1%
0%
10%
20%
30%
40%
50%
60%
70%
80%
Very Likely Likely Undecided Unlikely Very Unlikely
Average number of trips per household in the past 12 months
Domestic with children
Domestic without children
International with children
International without children
Average 3.53 1.94 1.25 1.25

13
Over half of the respondents spend between $1,000 and $4,999 on travel each year.
How much would you estimate you spent on family travel last year?
13% 14%
23%28%
16%
4%
0%
5%
10%
15%
20%
25%
30%
Household income and travel spending are clearly linked.
Household income vs. travel spending
0%
10%
20%
30%
40%
50%
Less than $500
$500 to $1.000
$1,000 to $2,500
$2,500 to $5,000
$5,000 to $10,000
Over $10,000
Less than $40,000 $40,000 to $59,000
$60,000 to $79,999 $80,000 to $99,999
$100,000 to $149,999 Over $150,000

14
Travel Behaviors and Preferences
Taken in the past Likely to take in the future
Day trip 83% 81%
Theme park 78% 79%
Weekend getaway 77% 80%
Multi-day vacation in U.S. 77% 82%
Trip to see relatives 77% 77%
Museum or cultural attraction 74% 77%
Family road trip 72% 78%
Beach vacation 72% 80%
City vacation 61% 70%
Attending sport events 52% 58%
Visit to national park 52% 75%
Camping trip 48% 56%
Family reunion 42% 51%
Competing in sports events 28% 38%
Multi-day vacation international 24% 44%
Cruise 22% 49%
Safari or wildlife viewing 21% 42%
Ski or snowboard 17% 31%
RV trip 11% 28%
Volunteer or mission trip 10% 29%
Some noteworthy findings are:
• Volunteer trips, RV trips, ski and snowboard trips, safaris, and cruises emerge as relatively niche products for family travel.
• Less than a quarter of the respondents have been on a multi-day international vacation, and less than half are planning to take one in the future.
• National parks have great potential in the family travel market. This category shows the greatest difference between past activity (52%) and future plans (75%).

15
Loyalty
Respondents who have taken a certain type of trip in the past are likely to take the same type in the future. Multi-day vacations in the U.S. have the highest loyalty at 91%; RV trips have the lowest loyalty at 66%.
Will take again Will not take again
Multi-day vacation in U.S. 91% 9%
Day trip 89% 11%
Weekend getaway 89% 11%
Trip to see relatives 89% 11%
Family road trip 88% 12%
Beach vacation 88% 12%
Theme park 87% 13%
Visit to national park 87% 13%
City vacation 87% 13%
Museum or cultural attraction 87% 13%
Attending sport events 84% 16%
Family reunion 83% 17%
Multi-day vacation international 82% 18%
Safari or wildlife viewing 80% 20%
Camping trip 79% 21%
Cruise 78% 22%
Competing in sports events 77% 23%
Ski or snowboard 74% 26%
Volunteer or mission trip 72% 28%
RV trip 66% 34%

16
Findings per trip type
The table below examines the past and future travel preferences per category, omitting non-responses. Findings to note are:
• 51% of respondents who have not taken a multi-day international vacation in the past are unlikely to do so in the future. Higher income respondents are more likely to take an international trip in the future.
• Of the respondents who have not taken a cruise, 33% are planning to take one in the future, while 44% are not. Higher income respondents are more likely to plan taking cruises in the future.
• Cruises and visits to national parks are most appealing to those who have not experi-enced them in the past (scores over 30%).
• Volunteer trips, RV trips, and ski or snowboard trips are least attractive to those who have not taken them in the past (scores over 60%).
Taken in past and planning to take
again
Taken in past and not planning to
take again
Not taken in past and planning to take in future
Not taken in past and not planningto take in future
Day trip 75% 10% 8% 7%
Multi-day vacation in U.S. 71% 8% 13% 8%
Weekend getaway 70% 9% 13% 8%
Trip to see relatives 70% 9% 8% 13%
Theme park 69% 11% 12% 8%
Family road trip 65% 9% 14% 12%
Beach vacation 65% 9% 16% 10%
Museum or cultural attraction 65% 10% 13% 12%
City vacation 54% 8% 17% 21%
Visit to national park 46% 7% 30% 17%
Attending sport events 44% 9% 13% 33%
Camping trip 40% 11% 18% 31%
Family reunion 35% 7% 17% 41%
Competing in sports events 21% 7% 17% 55%
Multi-day vacation international 20% 5% 24% 51%
Cruise 18% 5% 33% 44%
Safari or wildlife viewing 16% 4% 27% 53%
Ski or snowboard 13% 5% 18% 64%
RV trip 8% 4% 21% 67%
Volunteer or mission trip 8% 3% 22% 67%

17
Transport preferences
Overall, respondents prefer to travel by car. There is, however, a greater preference for air travel as income goes up: planes are the top choice for highest income category (household income over $150,000).
What is your favorite way to travel on a family vacation?
31%
2%
63%
3% 1% 0%
10%
20%
30%
40%
50%
60%
70%
Plane Train Car RV Other
Accommodation preferences
Overall, respondents prefer to stay in hotels. There is, however, a greater preference for resorts as income goes up: resorts are the top choice for the highest two income categories. Hotels are the most popular choice for families with household incomes up to $100,000.
What is your favorite type of accommodation for a family vacation?
29%
41%
4%
15%
6% 3% 2%
0%
5%
10%
15%
20%
25%
30%
35%
40%
45%
Resort Hotel Motel Vacation rental
Campsite Time share Other
18
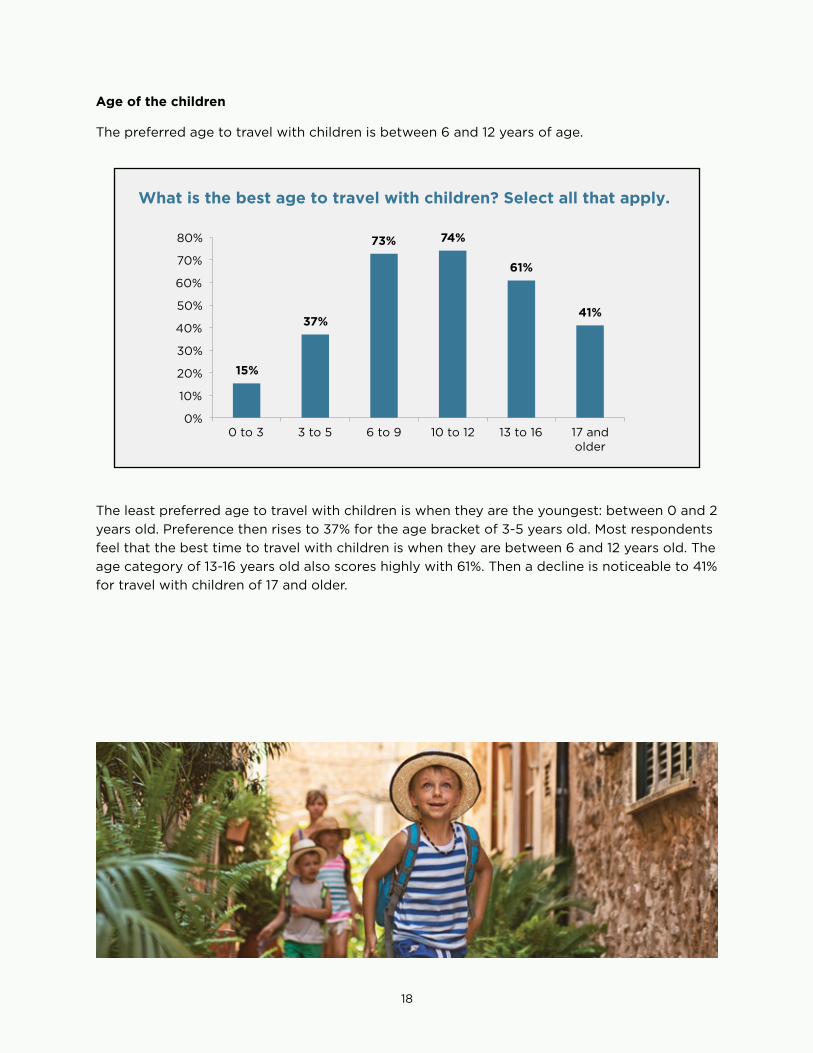
Age of the children
The preferred age to travel with children is between 6 and 12 years of age.
What is the best age to travel with children? Select all that apply.
15%
37%
73% 74%
61%
41%
0%
10%
20%
30%
40%
50%
60%
70%
80%
0 to 3 3 to 5 6 to 9 10 to 12 13 to 16 17 and older
The least preferred age to travel with children is when they are the youngest: between 0 and 2 years old. Preference then rises to 37% for the age bracket of 3-5 years old. Most respondents feel that the best time to travel with children is when they are between 6 and 12 years old. The age category of 13-16 years old also scores highly with 61%. Then a decline is noticeable to 41% for travel with children of 17 and older.

19
TRAVEL CHALLENgES
Respondents were asked to rank challenges that can make family travel more difficult on a scale of 1 to 5.
1) no challenge – 2) small challenge – 3) somewhat of a challenge – 4) big challenge – 5) biggest challenge.
‘Affordability’ received the highest score, followed by ‘timing of school breaks’ and ‘finding adult time while traveling with children’.
Average Median
Affordability 3.42 3
Timing of school breaks 2.61 3
Finding adult time while traveling with children 2.60 3
Available vacation time 2.58 2
Finding a destination or activities everyone will enjoy 2.29 2
Choosing accommodations 2.28 2
Planning the trip 2.26 2
Flying with children 2.24 2
Traveling by car with children 2.21 2
Packing for the trip 2.20 2
Dining out while traveling 2.16 2
Keeping children safe and healthy 2.15 2
Airport security 2.06 2
Passport and visa requirements 2.06 2
Family members getting along 2.05 2
Age(s) of children 1.99 2
Health and physical limitations 1.62 1

20
Affordability
Affordability is the biggest challenge for family travel, especially for families with an income under $60,000. It is the least challenging for families with an income over $150,000. It is interesting to note that families with incomes between $60,000 and $149,999 show marked similarities in their perception of affordability as a challenge, despite the considerable differ-ence in household income. Moreover, in the highest income category (family incomes over $150,000) 10% of respondents ‘agree somewhat’ that they can’t afford to travel.
Income vs. a�ordability challenge
0%
5%
10%
15%
20%
25%
30%
35%
40%
45%
No challenge
Small challenge
Somewhat of a challenge
Big challenge
Major challenge
Less than $40,000
$40,000 to $59,000
$60,000 to $79,999
$80,000 to $99,999
$100,000 to $149,999
Over $150,000

21
In the randomized blocks of follow-up questions, 726 respondents provided further insights into the extent to which they perceive affordability as a challenge. The answer scale was as follows:
1) do not agree at all – 2) disagree somewhat – 3) neither agree nor disagree – 4) agree somewhat – 5) fully agree.
Average Median
It is hard to find travel options that are affordable 3.51 4
We choose destinations close by to reduce the cost of family trips 3.42 4
We cannot afford to travel 2.87 3
I don’t think family trips offer value for money 2.37 2
In the qualitative answers, the cost of renting several rooms is often highlighted as a challenge. Respondents are looking for affordable and comfortable options, and many remark that destinations offer low value for the money. Theme parks are often pointed out as the most expensive, but also as aspirational destinations: “These are the kind of places parents want to experience with their children.” The same is true for international travel: “We would like to travel internationally, but it would end up costing about the same as a small car!”
Choosing Accommodations
In the randomized blocks of follow-up questions, 714 respondents provided further insights into the extent to which they perceive choosing accommodations as a challenge. The answer scale was as follows:
1) do not agree at all – 2) disagree somewhat – 3) neither agree nor disagree – 4) agree somewhat – 5) fully agree.
Average Median
Most lodging options are too expensive 3.58 4
It is difficult to find lodging options with an odd number of children 2.76 3
I don’t know where to find the best lodging options 2.57 2
Most lodging options are not child friendly 2.47 2
The high mean score for ‘most lodging options are too expensive’ resonates with affordability being seen as the biggest challenge in family travel. From the qualitative results, it can be understood that many respondents have high expectations of accommodations. Common requirements are that the hotels should have continental breakfast, the accommodations should be 4-star, or there should be a pool. Many respondents indicate that it is challenging to know which sources of information to trust about accommodation options.
22
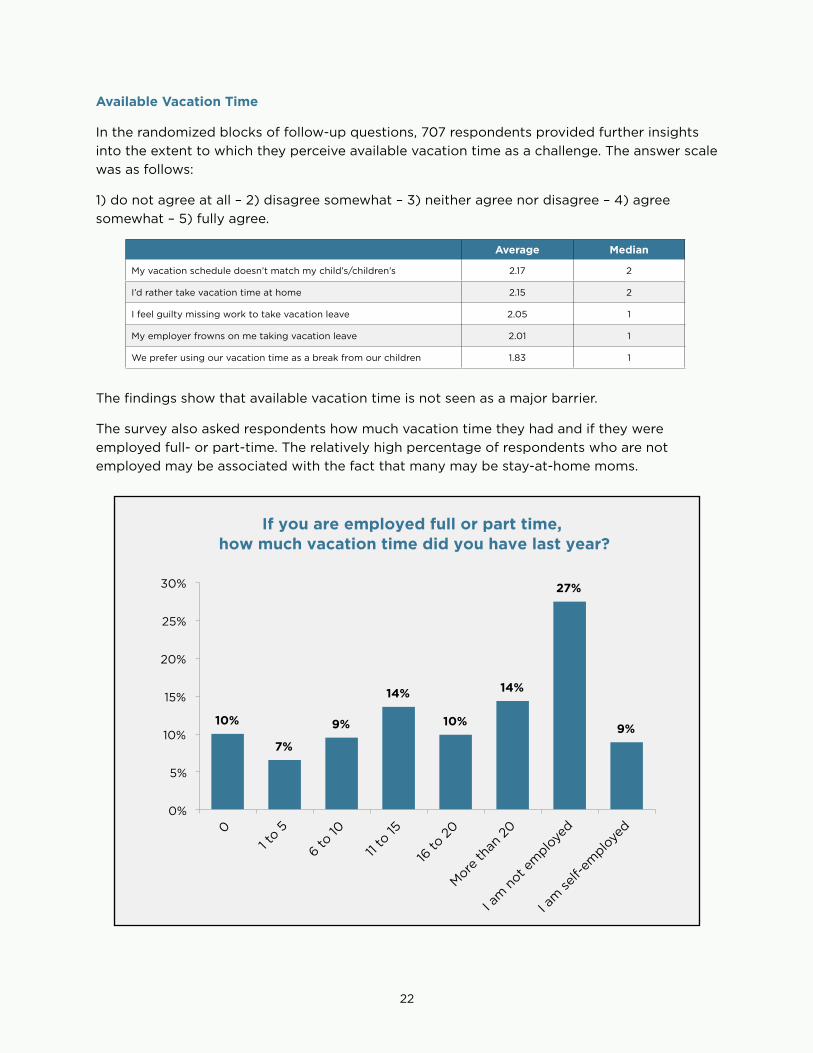
Available Vacation Time
In the randomized blocks of follow-up questions, 707 respondents provided further insights into the extent to which they perceive available vacation time as a challenge. The answer scale was as follows:
1) do not agree at all – 2) disagree somewhat – 3) neither agree nor disagree – 4) agree somewhat – 5) fully agree.
Average Median
My vacation schedule doesn’t match my child’s/children’s 2.17 2
I’d rather take vacation time at home 2.15 2
I feel guilty missing work to take vacation leave 2.05 1
My employer frowns on me taking vacation leave 2.01 1
We prefer using our vacation time as a break from our children 1.83 1
The findings show that available vacation time is not seen as a major barrier.
The survey also asked respondents how much vacation time they had and if they were employed full- or part-time. The relatively high percentage of respondents who are not employed may be associated with the fact that many may be stay-at-home moms.
If you are employed full or part time, how much vacation time did you have last year?
10%
7%
9%
14%
10%
14%
27%
9%
0%
5%
10%
15%
20%
25%
30%
23
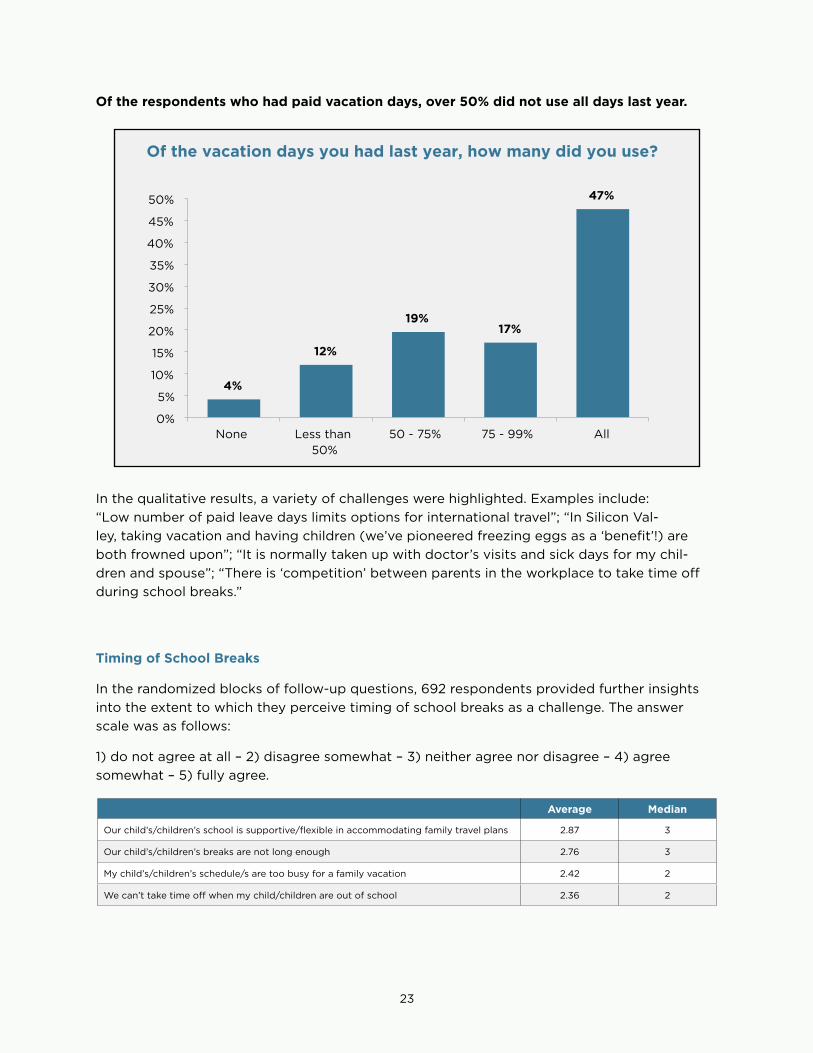
Of the respondents who had paid vacation days, over 50% did not use all days last year.
Of the vacation days you had last year, how many did you use?
4%
12%
19% 17%
47%
0%
5%
10%
15%
20%
25%
30%
35%
40%
45%
50%
None Less than 50%
50 - 75% 75 - 99% All
In the qualitative results, a variety of challenges were highlighted. Examples include: “Low number of paid leave days limits options for international travel”; “In Silicon Val-ley, taking vacation and having children (we’ve pioneered freezing eggs as a ‘benefit’!) are both frowned upon”; “It is normally taken up with doctor’s visits and sick days for my chil-dren and spouse”; “There is ‘competition’ between parents in the workplace to take time off during school breaks.”
Timing of School Breaks
In the randomized blocks of follow-up questions, 692 respondents provided further insights into the extent to which they perceive timing of school breaks as a challenge. The answer scale was as follows:
1) do not agree at all – 2) disagree somewhat – 3) neither agree nor disagree – 4) agree somewhat – 5) fully agree.
Average Median
Our child’s/children’s school is supportive/flexible in accommodating family travel plans 2.87 3
Our child’s/children’s breaks are not long enough 2.76 3
My child’s/children’s schedule/s are too busy for a family vacation 2.42 2
We can’t take time off when my child/children are out of school 2.36 2

24
Age of the Children
In the randomized blocks of follow-up questions, 704 respondents provided further insights into the extent to which they perceive the age of their children as a challenge. 72% of the respondents highlight that the age of the children does not influence their travel decisions very much.
Please select the option that describes best why the age of the children is a challenge.
5%
13%
6%
72%
4%
0%
10%
20%
30%
40%
50%
60%
70%
80%
My child/children is too young
to travel
We can't take time o� during school breaks
The age gap between the
children is too large
Age does not influence
travel decisions much
Other
Family Members getting Along
In the randomized blocks of follow-up questions, 720 respondents provided further insights into the extent to which they perceive family members getting along as a challenge. The answer scale was as follows:
1) do not agree at all – 2) disagree somewhat – 3) neither agree nor disagree – 4) agree somewhat – 5) fully agree.
Average Median
It is hard to find an itinerary that will keep everyone happy 2.48 2
Travel puts too much strain on family relations 2.00 2
My children don’t get along 1.99 2
My child/children doesn’t want to travel with me/us 1.56 1

25
Trip Planning
In the randomized blocks of follow-up questions, 703 respondents provided further insights into the extent to which they perceive trip panning as a challenge. The answer scale was as follows:
1) do not agree at all – 2) disagree somewhat – 3) neither agree nor disagree – 4) agree somewhat – 5) fully agree.
Average Median
Planning an itinerary that will keep everyone happy is challenging 2.91 3
It’s hard to figure out if a new destination will be family friendly 2.72 3
I don’t know whose advice and information I can trust 2.70 3
I prefer package tours where the planning is done for me 2.49 3
Planning a trip is too complicated 2.34 2
I don’t have time to plan a family trip 2.19 2
Flying With Children
In the randomized blocks of follow-up questions, 707 respondents provided further insights into the extent to which they perceive flying with children as a challenge. The answer scale was as follows:
1) do not agree at all – 2) disagree somewhat – 3) neither agree nor disagree – 4) agree somewhat – 5) fully agree.
Average Median
The extra airfare is too expensive 3.87 3
Airports are too stressful with children 2.96 3
I worry my child/children will misbehave on the airplane 2.61 3
I worry my child/children will get airsick 2.48 2
The high mean score for ‘the extra airfare is too expensive’ resonates with affordability being seen as the biggest challenge in family travel.
Traveling by Car With Children
In the randomized blocks of follow-up questions, 712 respondents provided further insights into the extent to which they perceive traveling by car with children as a challenge. The answer scale was as follows:
1) do not agree at all – 2) disagree somewhat – 3) neither agree nor disagree – 4) agree somewhat – 5) fully agree.
Average Median
My child/children get/s bored on long car rides 3.48 4
My child/children misbehave/s on long car rides 2.53 2
My child/children get/s carsick 2.02 1

26
Dining Out With Children
In the randomized blocks of follow-up questions, 713 respondents provided further insights into the extent to which they perceive dining out with children to be a challenge. The answer scale was as follows:
1) do not agree at all – 2) disagree somewhat – 3) neither agree nor disagree – 4) agree somewhat – 5) fully agree.
Average Median
Dining out while traveling with children is too expensive 3.56 4
I prefer accommodations where we can eat in the room or prepare our own meals 3.20 3
It’s hard to find dining options to please the whole family 2.62 2
Dining out with children while traveling is a hassle 2.51 2
We don’t like the dining options when traveling with our children 2.33 2
The high mean score for ‘dining out while traveling with children is too expensive’ resonates with affordability being seen as the biggest challenge in family travel. The qualitative results show that many respondents find it challenging to identify affordable and healthy dining op-tions. Food allergies also are regularly mentioned.
Keeping Children Safe and Healthy
In the randomized blocks of follow-up questions, 720 respondents provided further insights into the extent to which they perceive keeping children safe and healthy a challenge. The answer scale was as follows:
1) do not agree at all – 2) disagree somewhat – 3) neither agree nor disagree – 4) agree somewhat – 5) fully agree.
Average Median
I worry about safety in unfamiliar destinations 3.50 4
I am worried my child/children will get sick while traveling 2.94 3
I am worried about healthcare options while traveling 2.93 3
I am worried my child/children will get injured while traveling 2.68 3
The high mean for ‘I worry about safety in unfamiliar destinations’ is noteworthy. In the qualitative results, safety and cleanliness are mentioned as worries. Other frequent concerns are that children may run off in crowded places and the abundance of unhealthy food in many destinations.

27
TRAVEL ATTITuDES
In this section of the survey, respondents were presented with a number of attitudinal statements about family travel. The answer scale was as follows:
1) do not agree at all – 2) disagree somewhat – 3) neither agree nor disagree – 4) agree somewhat – 5) fully agree.
The first question block focused on attitudes toward different trip types.
Average Median
We like to make our own travel arrangements 4.15 4
We usually travel on all-inclusive vacations 3.35 3
We prefer to go on a cruise 2.89 3
We prefer to go on organized group tour 2.75 3
We prefer a new destination each time we travel 2.46 3
We prefer staying home over traveling 2.38 2
We prefer to stay at properties with kids’ clubs 2.14 2
We prefer to stay at vacation rentals 2.11 2
The second block focused on attitudes toward destinations and activities.
Average Median
Once we find a destination we like, we tend to return to it 3.68 4
We travel to experience a new and different culture 3.37 3
I would consider having my child/children miss school to travel 3.27 4
We like to travel to unusual and off-the-beaten-path destinations 3.09 3
Figuring out if an activity or attraction is appropriate for the child/children’s age is hard 2.55 2
Many destinations are unsafe for family travel 2.46 2
Travel with children is more trouble than it’s worth 1.83 1
The third block focused on attitudes toward the educational/emotional value placed on travel.
Average Median
Family vacations enrich a child’s education 4.37 5
Travel brings us closer together as a family 4.30 4
I believe travel makes children better global citizens 4.09 4
Traveling with my child/children makes me a better parent 3.84 4
I prioritize travel experiences over material possessions 3.67 4

28
It’s Not About Income, It’s Attitude
Correlations between the different attitude statements, combined with qualitative data from the survey, highlight that three different family travel profiles can be distinguished. They are presented below, along with their main attributes (note: the principal characteristic is listed first). Although some attributes overlap between the different profiles, they each have their distinct characteristics.
Cautious Travelers
The Cautious Travelers are families who value travel and often put great effort into researching and planning family trips. They are attracted by many different travel products and destinations. However, they tend to stick to trips that are traditionally seen as ‘family friendly,’ such as theme parks and family-friendly hotels and resorts, because these products are regarded as ‘safe bets.’ Their travel decisions are greatly influenced by worry and uncertainty: they worry about safety, hygiene, whether a destination offers value for the money, whether a child will get sick, and whether activities are appropriate for children. They believe more strongly In the value of travel for children and would consider taking their children out of school, but they are generally too worried about all the uncertainties associated with travel to go far off the beaten track.
More likely to worry about safety
Tend to prefer theme parks, hotels, and resorts
More likely to find it hard to identify activities appropriate for children
Like trying new places, but also return to destinations they enjoy
Feel that travel strengthens family bonds and makes children better global citizens
Still may travel to experience different cultures
More likely to take children out of school to travel
The Cautious Travelers are the most prominent group in this survey, which can be linked to the following pronounced themes in the qualitative results:
Concerns about affordability and value—travel is a considerable expense for families and they want to make sure they make the right choices
Concerns about which information to trust
Concerns about cleanliness, safety, healthcare, and security in unfamiliar destinations
Concerns about the safety of children in crowded places
Concerns about maintaining healthy diets on vacation, as well as worries about food allergies
Concerns about providing children with experiences that are iconic (e.g. famous theme parks)
Concerns about children being bored, as expressed in preferences for destinations that offer a lot of on-site activities (e.g. entertainment, pools)

29
Hassle-Free Travelers
The Hassle-Free Travelers are families who see travel as time for relaxation and indulgence. They seek comfort and do not want to spend much time planning the trip. Just like the Cautious Travelers, they are attracted to theme parks and family-friendly hotels/all-inclusive resorts, but their motivations are different: whereas the Cautious Travelers worry about safety and value, and tend to research travel options carefully, the Hassle-Free Travelers look for options that allow the whole family to effortlessly relax. Hassle-Free Travelers are more likely to visit off-the-beaten-path destinations; however, they are likely to stay in all-inclusive resorts or take organized tours, as opposed to the Intrepid Travelers. Hassle-Free Travelers are more likely to prefer staying at home instead of traveling. They also tend to place greater value on material possessions than travel experiences.
More likely to prefer cruises, all-inclusive resorts, and organized tours
Least likely to take children out of school to travel
More likely to think travel with children is a hassle
More likely to return to the same destination
Still place value on the educational value of travel
More likely to place more value on material possessions
More likely to stay at home during vacations
Intrepid Travelers
The Intrepid Travelers are families that greatly value travel and are confident, independent, and often experienced travelers. They emphasize their interest in exploring new cultures, are likely to travel to off-the-beaten-path destinations, and often express disinterest in all-inclusive and packaged products. They have an interest in many different travel products and accommodation options, although the majority prefer hotel stays. Just like the Cautious Travelers, they are more likely to take their children out of school to travel.
Tend to prefer new destinations every time they travel
Tend to travel to experience different cultures
Tend to worry less about safety
More likely to travel to unusual destinations
More likely to take children out of school to travel
Tend to value travel over material possessions

30
TRAVEL DECISION MAKINg
This section of the survey examined the information sources the respondents use when making travel decisions. In the first question, respondents were asked to check any information source they are likely to use when planning a trip.
Search engine (e.g. Google, Bing) 73%
Recommendations of family and friends 71%
Online booking site (e.g. Expedia, Travelocity, Kayak) 61%
Travel review websites (e.g. TripAdvisor, Yelp) 55%
Travel supplier website (e.g. hotel, cruise line, airline) 41%
Social media 37%
Magazines 32%
Guidebook 29%
Travel club (e.g. AAA) 25%
Travel blogs 24%
Tourist office website 22%
Travel agent 15%
Newspapers 12%
Tourist office - in person or via phone 11%
Tour operator website or brochure (e.g. Globus, Collette) 10%
Other 2%

31
They were then asked to identify their most important information choice among the options they had checked.
Search engine (e.g. Google, Bing) 30%
Recommendations of family and friends 19%
Travel review websites (e.g. TripAdvisor, Yelp) 15%
Online booking site (e.g. Expedia, Travelocity, Kayak) 13%
Travel supplier website (e.g. hotel, cruise line, airline) 6%
Travel club (e.g. AAA) 4%
Guidebook 2%
Tourist office website 2%
Social media 2%
Travel blogs 2%
Travel agent 2%
Magazines 2%
Other 1%
Newspapers 1%
Tour operator website or brochure (e.g. Globus, Collette) 0%
Tourist office - in person or over the phone 0%
The dominant use of search engines is clear in both questions. Findings in previous questions have highlighted that it can be challenging to identify a trustworthy source of information for family travel. This could be linked to the fact that most families are faced with an overwhelming number of choices when relying on search engines. This also validates the potential demand for a central information source specific to family travel.
Role of the Children
Respondents were asked to assess the level of influence the children have in travel decision-making. They were asked to evaluate the statements below on a scale of 1 to 3
1) none – 2) a little – 3) a lot.
Average Median
Selecting activities to do while away 2.31 2
Choosing the destinations to go to 2.09 2
Deciding whether or not to go on a trip 1.80 2
Collecting information about the chosen destination 1.75 2
Choosing accommodations 1.62 1
Choosing a specific travel supplier or brand (e.g. hotel, airline, cruise line, tour operator) 1.43 1
The results show that children have the most influence in choosing activities to do while away, and the least influence when it comes to choosing a specific travel supplier or brand.

32
CONCLuSION
This survey has examined U.S. families’
•Travel behavior and preferences
•Travel challenges
•Travel attitudes
•Travel decision making
An important finding of the study is that while some aspects of travel are influenced by demographic factors (most notably income levels), others are influenced by psychographic factors (attitudes).
In this study, household income has emerged as the key demographic factor that influences certain aspects of travel behavior and travel challenges. Higher household income positively correlates with:
•Higher travel spend
•Lower likelihood affordability is a major challenge
•Likelihood to have taken most trip types (except camping)
•Likelihood to plan most trip types in the future (except camping)
•Preference for resorts
•Preference for air travel
However, there is often no clear correlation between income and travel attitudes. For example, there is no correlation between income level and the desire to experience different cultures; or between income level and the perception of vacations and trips as educationally or emo-tionally beneficial activities. Even the link between income and the challenge of affordability is not as pronounced as could be expected. This points to psychographic factors underlying these differences.
This exploratory study has proposed a hypothesis of three psychographic profiles in family travel: Cautious Travelers, Hassle-Free Travelers, and Intrepid Travelers. Families, just like other travelers, are not a cohesive market segment and each segment is identified by its own behaviors, challenges, and attitudes. Cautious Travelers are the most prominent segment identified in this study: this points to a potential future role of the Family Travel Association as a trusted information source, which can help reduce the uncertainty associated with more off-the-beaten-track travel options. Further exploration of the different psychographic profiles also will aid the tourism sector in better serving each segment.

33
ABOuT
The NYu School of Professional Studies Tisch Center for Hospitality and Tourism
The NYU School of Professional Studies Tisch Center for Hospitality and Tourism, now celebrating 20 years of academic excellence, is a leading center for the study of these fields. Founded in 1995, the Tisch Center for Hospitality and Tourism was established in response to the growing need for hospitality and tourism undergraduate and graduate education.
The Tisch Center’s cutting-edge curriculum attracts bright, motivated students who seek to become leaders in their fields. Through its undergraduate degree in hotel and tourism management, its graduate degrees and certificates in hospitality industry studies and tourism management, Career Advancement Courses and Diploma Programs, as well as its world-renowned conference, students gain the knowledge and the skill sets that enable them to manage change, to communicate, to thrive in complex work environments, and to advance the businesses of hospitality and tourism. For additional information on the Tisch Center, visit sps.nyu.edu/tischcenter.
The Family Travel Association
The Family Travel Association was founded in 2014 to create a single and collective voice on behalf of the travel industry and those companies that serve traveling families. As a coalition of the leading family travel suppliers, resources, and experts, it’s mission is to inspire families to travel—and travel more—while advocating travel be an essential part of every child’s education. For additional information on the Family Travel Association, visit www.familytravel.org.

34
NOTES

35

©2015 NYU School of Professional Studies


![Space Communications Protocol Specification (SCPS ... › sis › docs › Work Completed (Closed WGs) › Ci… · [11] Space Communications Protocol Specification (SCPS)—Security](https://static.fdocuments.in/doc/165x107/5f182034419697273f4c8f13/space-communications-protocol-specification-scps-a-sis-a-docs-a-work.jpg)


