US EPA Environmental Technologies Initiative
25
US EPA Environmental Technology Initiative Onsite Wastewater Technology Testing Report Massachusetts Alternative Septic System Test Center Air Station Cape Cod, Massachusetts 02542 Telephone: 508-563-6757 [email protected] -- August, 2004 -- MicroFAST® Technology Vendor Bio-Microbics, Inc. 8450 Cole Parkway Shawnee, KS 66227 Telephone: 913-422-0707 or 800-753-FAST Facsimile: 913-422-0808 http://www.biomicrobics.com The Massachusetts Alternative Septic System Test Center (MASSTC) is operated by the Barnstable County Department of Health and the Environment (BCDHE) with support from the United States Environmental Protection Agency (USEPA), The Massachusetts Department of Environmental Protection (MDEP) and Barnstable County. The mention of any products or proprietary methods within this document does not constitute an endorsement of same by these agencies. Opinions expressed herein do not necessarily reflect those of the supporting agencies. The Test Center can be contacted through George Heufelder, Barnstable County Department of Health and the Environment, Box 427, Barnstable, Massachusetts 02630 – Phone 508-375-6616, or visit the websit http://www.buzzardsbay.org/etimain.htm. e at M assachusetts A lternative S eptic S ystem T est C enter
Transcript of US EPA Environmental Technologies Initiative

US EPA Environmental Technology Initiative
Onsite Wastewater Technology Testing Report
Massachusetts Alternative Septic System Test Center Air Station Cape Cod, Massachusetts 02542
Telephone: 508-563-6757 [email protected]
-- August, 2004 --
Massachusetts
Alternative
Septic
System
Test
MicroFAST®
Technology Vendor
Bio-Microbics, Inc. 8450 Cole Parkway Shawnee, KS 66227
Telephone: 913-422-0707 or 800-753-FAST Facsimile: 913-422-0808
http://www.biomicrobics.com
The Massachusetts Alternative Septic System Test Center (MASSTC) is operated by the Barnstable County Department of Health and the Environment (BCDHE) with support from the United States Environmental Protection Agency (USEPA), The Massachusetts Department of Environmental Protection (MDEP) and Barnstable County. The mention of any products or proprietary methods within this document does not constitute an endorsement of same by these agencies. Opinions expressed herein do not necessarily reflect those of the supporting agencies. The Test Center can be contacted through George Heufelder, Barnstable County Department of Health and the Environment, Box 427, Barnstable, Massachusetts 02630 – Phone 508-375-6616, or visit the websithttp://www.buzzardsbay.org/etimain.htm.
e at
Center
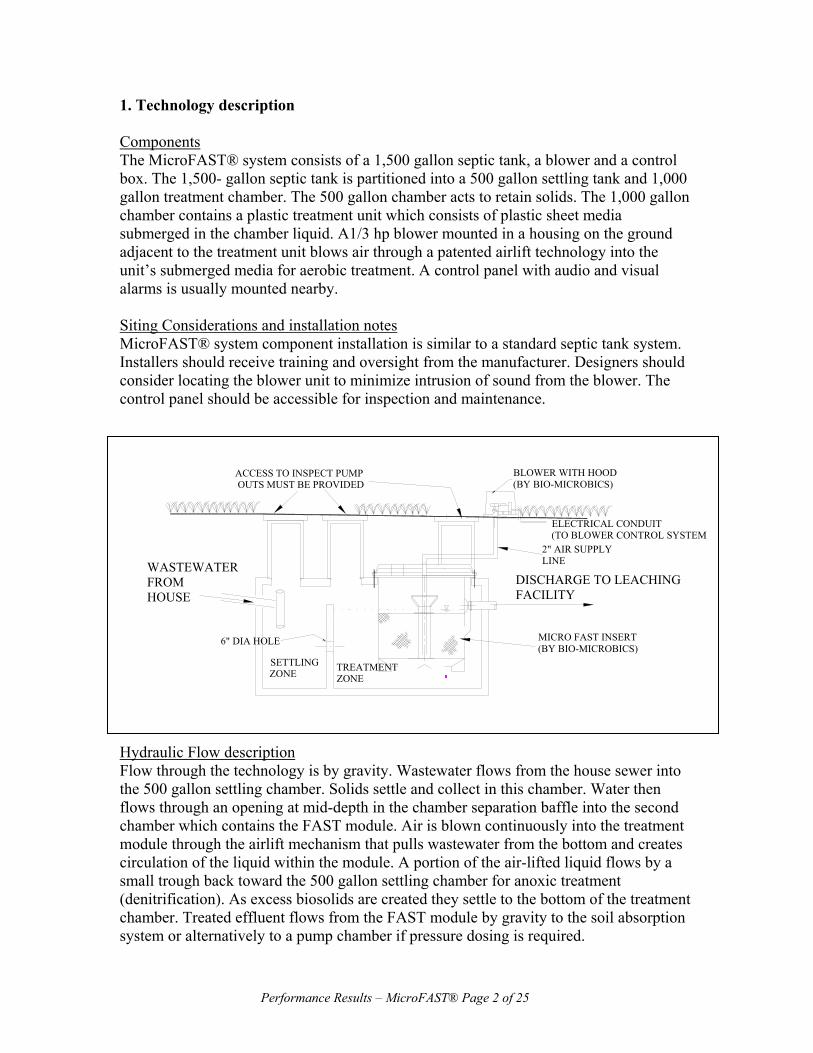
1. Technology description Components The MicroFAST® system consists of a 1,500 gallon septic tank, a blower and a control box. The 1,500- gallon septic tank is partitioned into a 500 gallon settling tank and 1,000 gallon treatment chamber. The 500 gallon chamber acts to retain solids. The 1,000 gallon chamber contains a plastic treatment unit which consists of plastic sheet media submerged in the chamber liquid. A1/3 hp blower mounted in a housing on the ground adjacent to the treatment unit blows air through a patented airlift technology into the unit’s submerged media for aerobic treatment. A control panel with audio and visual alarms is usually mounted nearby. Siting Considerations and installation notes MicroFAST® system component installation is similar to a standard septic tank system. Installers should receive training and oversight from the manufacturer. Designers should consider locating the blower unit to minimize intrusion of sound from the blower. The control panel should be accessible for inspection and maintenance.
Hydraulic Flow description Flow through the technology is by gravity. Wastewater flows from the house sewer into the 500 gallon settling chamber. Solids settle and collect in this chamber. Water then flows through an opening at mid-depth in the chamber separation baffle into the second chamber which contains the FAST module. Air is blown continuously into the treatment module through the airlift mechanism that pulls wastewater from the bottom and creates circulation of the liquid within the module. A portion of the air-lifted liquid flows by a small trough back toward the 500 gallon settling chamber for anoxic treatment (denitrification). As excess biosolids are created they settle to the bottom of the treatment chamber. Treated effluent flows from the FAST module by gravity to the soil absorption system or alternatively to a pump chamber if pressure dosing is required.
TREATMENT ZONE
SETTLING ZONE
MICRO FAST INSERT (BY BIO-MICROBICS)
6" DIA HOLE
ELECTRICAL CONDUIT(TO BLOWER CONTROL SYSTEM)
BLOWER WITH HOOD(BY BIO-MICROBICS)
ACCESS TO INSPECT PUMP OUTS MUST BE PROVIDED
DISCHARGE TO LEACHINGFACILITY
WASTEWATERFROMHOUSE
2" AIR SUPPLYLINE
Performance Results – MicroFAST® Page 2 of 25
Theory of operation FAST is an acronym for Fixed Activated Sludge Treatment, an aerobic method that injects air into the wastewater to sustain both suspended and attached microbial populations. Biological organisms remove organic contaminants and also nitrify ammonium (NH4) to nitrate (NO3) in the wastewater. A portion of the liquid in the FAST module is lifted to a collection trough that leads back toward the initial chamber to an area that is designed to remain anoxic. The nitrate is reduced to nitrogen gas (de-nitrification) that is released harmlessly to the atmosphere. 2. Costs Installation The manufacturer’s suggested retail costs for the components of MicroFAST 0.5 total $2995. The manufacturer estimates that the components plus installation are $3,500 more than a conventional system. Readers should use the above estimates as approximations of average costs, because the cost of installation for any treatment technology are very dependent upon the particular site conditions. Design and permitting costs vary with the site conditions and local permitting requirements. Electric usage Average electric usage by the three units for the period 5/10/99 to 9/20/00, (9/20/00 was when Unit 2 was changed to a blower with a timed on-off cycle) was 8.58 kW per day per unit or about $.85 per day at $.10 per kW; monthly this comes to $25.62 per month, and $307.44 per year. Maintenance Massachusetts requires that all alternative technologies have a service contract in force for the life of the installation. Costs for this service vary but are approximately $400 per year. The service includes inspection of blower, alarms and septic tank residuals depth. Septic tanks are pumped to remove accumulated residuals at a frequency based on usage, but an approximate cost for this unit is $60 - $90 per annum assuming a 2-3 year pump out cycle. This technology required pumping after 12 months due to sludge accumulation (refer to Section 6, below). Replacement parts Blowers carry a two-year warranty and replacement cost is ($450). An extended ten-year warranty is available at additional cost. FAST systems are UL-CE-CSA certified for electrical safety. Other costs Quarterly effluent quality monitoring is required for some permits at a cost of $300 or more annually. Following an initial period specified in the approval letter, monitoring may be reduced by requesting a reduction from MA DEP and/or the local approving authority.
Performance Results – MicroFAST® Page 3 of 25
3. ETI Testing Protocol Synopsis Technology operation The testing duration was for two years. The technology was installed in triplicate, with identical components. The MicroFAST® received wastewater at the rate of 330 gallons per day, throughout the two-year testing period. The 330 gallon per day volume is the Massachusetts Department of Environmental Protection (MA DEP) minimum design flow for a new residential house of three bedrooms or less. Delivery of the wastewater was apportioned into fifteen equal doses of 22 gallons each, on a schedule which was designed to mimic the pattern of wastewater use in a typical residence (35% of flow in the morning; 25% flow during midday; 40% in the evening; see ETI QAPP and NSFI/AINSI Standard 40). Periodic calibration of dose volumes delivered to each technology ensured equal dosing to each replicate and to different technologies. Effluent from the technology flowed to a distribution box with four outlets. Three of the four outlets directed effluent to a facility sewer, and the fourth conveyed treated effluent to a one-quarter sized soil absorption system (SAS), designed to loading limits of MA DEP Title 5 rules. Lysimeters were installed at depths of one, two and five feet beneath the SAS to collect leachate for analysis. A polyethylene liner with sump collected all leachate from the three technology replicates. Technology Monitoring The technologies were sampled of at two-week intervals. During each sampling event, technology influent wastewater was sampled at the common source. Technology effluent was sampled at the distribution box. Influent wastewater and technology effluent were sampled using automated samplers, programmed to obtain fifteen flow-weighted samples composited over a twenty-four hour period. Initiation of the individual samples was timed to coincide with the discharge for each technology.
Composite samples were kept refrigerated at 4 degrees centigrade either by ice packed in the sampler or by use of a refrigerated sampler. Analysis for pH and specific conductance were conducted at MAASTC during sample processing. Subsamples for BOD5 and fecal coliform were sent to the Barnstable County Department of Health and the Environment laboratory. Subsamples for nitrogen and phosphorus analysis: ammonium (NH4), nitrate plus nitrite (NOx), dissolved organic nitrogen, (DON), particulate organic nitrogen (PON), alkalinity, orthophosphate (PO4) and total phosphorus (TP); were sent to the Coastal Systems Laboratory at the School for Marine Science University of Massachusetts, Dartmouth (SMAST).
Electrical usage was measured by a single electric meter for all three units and recorded monthly. Kilowatt usage was then divided by three to calculate individual unit use.
Performance Results – MicroFAST® Page 4 of 25
Mechanical and other non-quantitative performance monitoring Alarms, mechanical failures, unusual sounds, and smells were recorded in a logbook as they occurred. Restorative measures taken by the technology vendor to address non-normal conditions were also recorded and appear in Section 6 “Operation and Maintenance” section of this report. 4. Testing Objectives The MicroFAST® was tested to demonstrate nitrogen removal for use in Massachusetts watersheds which are nitrogen sensitive. Technologies must be able to demonstrate reduction of average total nitrogen levels to below 19 mg/l. 5. Contaminant Removal Performance Summary for the MicroFAST® Note: Technologies were allowed a start-up period, when measures of removal performance would be excluded from the test period. We define the start-up period as ending when the technology attains effluent levels below 30 mg/l BOD5; 30 mg/l TSS; and 19 mg/l TN. These levels are performance thresholds for alternative systems set by MA DEP. The data from all three MicroFAST® units from start-up at 5/10/99 until the 6/09/99 sample event was excluded under the start-up period rules. Data from the final sample event from Unit 3 was also excluded due to the blower shutting down because of a loose wire shortly before the last sampling event. Technology operating history The three MicroFAST® units were started up on 5/10/99. Units 1 and 3 were operated continuously for the two-year test period with a last sampling date of 5/08/01. Unit 2 ran as a replicate until 9/21/00, when the blower was put on a timer control to reduce the air supply on time from continuous operation to a cycle of 30 minutes on, 30 minutes off schedule. Unit 2 was also monitored until 5/08/01. Biochemical Oxygen Demand (BOD5 ) removal BOD5 measured in the technology effluent averaged 22.6 mg/l (median, 21.0 mg/l) over the monitoring period, versus 168 mg/l for influent wastewater, representing a removal rate of 86.7 per cent (Table 1). For comparison the regulatory threshold for BOD5 is 30 mg/l. Unit 3 had the highest number of excursions above 30 mg/l: 12 while Units 1 & 2 had 9 and 7 instances, respectively. Standard deviation, a reflection of the variability of the performance was moderate but similar for all three replicates. The similarity between replicate units suggests that the range of the majority of the performance data, between 10 mg/l and about 32 mg/l, was descriptive of this design’s performance. Discounting the one measurement (250 mg/l, 5/08/01) on Unit 3 that occurred after the blower for that unit had shut down; maximum values were similar in the three replicates, 75 mg/l, 63 mg/l and 80 mg/l (Table 1).
Performance Results – MicroFAST® Page 5 of 25

Table 1. Biochemical Oxygen Demand (5-day) removal performance of the MicroFAST® system during testing at the Massachusetts Alternative Septic System Test Center – May, 1999- May 2001. BOD (mg/l) Replicate 1 Replicate 2 Replicate 3 Influent Mean %RemovalAverage 21.9 22.2 25.0 171.5 23.2 86.5%Median 21.0 19.0 22.0 165.0 Standard Deviation 12.7 13.6 13.1 55.4 Maximum 75.0 63.0 80.0 326.0 Minimum 4.0 4.0 4.0 96.0 Count 44 28 43 44 Count > 30 mg/l 8 6 13 Avg. to 6/14/00 14.6 18.0 18.5 173.6 17.0 90.2% Avg after 6/14/00 28.6 34.9 31.3 169.7 30.6 82.0%
BOD removal performance over the two-year test period was better in the first 12 months than the second (Table 1, bottom), the aggregate removal performance dropped from 90.2% to 82.0% even though the strength of the influent BOD was somewhat lower in the second year (174 mg/l versus 170 mg/l). The second year average for Units 2 & 3 exceeded the 30 mg/l limit. This deterioration of removal performance is likely due to sludge buildup within the septic tank, which began to affect performance about 6/00. Sludge was removed from all three systems on 9/21/00 (see note below on sludge accretion and removal) by pumping 1,000 gallons from each unit. Sludge build up appeared to affect the TSS more sharply than BOD. Total Suspended Solids (TSS) removal TSS measured in the technology effluent averaged 18.2 mg/l over the monitoring period, versus 161 mg/l for influent wastewater, representing a removal rate of 88.7 per cent (Table 2). The regulatory threshold is 30 mg/l. Performance for the first 12 months was more than twice as good during the first year when compared with the second year, 10.4 mg/l versus 27.7 mg/l (Table 2, bottom). This decline may be due to the residuals build up mentioned above but also may reflect the 44 percent increase in influent wastewater TSS levels for year two (132 mg/l, year one 190 mg/l, year two).Considering all three units, the number of times TSS measurements exceeded the threshold 30 mg/l level was 15 or 13 percent (15/115). The maximum values for Units 2 & 3 occurred during the period when residuals levels in the septic tank had built up to the point where solids were entering the second chamber and exiting in the technology effluent. Our data indicate that as the unit reaches its maximum design load, annual pumping may be necessary to maintain an acceptable level of performance.
Performance Results – MicroFAST® Page 6 of 25

Table 2. Total Suspended Solids (TSS) removal performance of the MicroFAST® system during testing at the Massachusetts Alternative Septic System Test Center – May, 1999- May 2001.
TSS (mg/l) Replicate 1 Replicate 2 Replicate 3 Influent Mean %Removal Average 16.5 21.9 17.7 161 18.2 88.7% Median 16.3 11.0 12.0 160 Standard Deviation 9.2 25.0 17.7 60.6 Maximum 42.0 122.0 98.0 330 Minimum 4.0 4.0 3.3 49 Count 44 28 43 43 Count > 30 mg/l 3 7 5 Avg. to 6/14/00 10.6 11.9 8.8 132 10.4 92.1% Avg after 6/14/00 21.8 52.0 26.1 190 27.7 85.4%
Nitrogen removal Total nitrogen (TN) measured in the technology effluent averaged 17.4 mg/l over the monitoring period (median, 17.2 mg/l) versus 35.5 mg/l for influent wastewater, representing a removal rate of 51.5 percent (Table 3). For reference, the regulatory benchmark in Massachusetts is 19 mg/l. Average removal was very similar for all three units, however Unit 1 exceeded 19 mg/l more frequently than Units 2&3: 21, 7, 15 times, respectively. A reduction in the treatment of this unit for nitrogen appeared to coincide with reductions in performance for BOD and TSS. Again, these reductions in performance appear related to the buildup of residuals in the tanks. Separately analyzing data collected before June 14, 2000 and after show nearly a 10% higher performance prior to the buildup of residuals.
Table 3. Total Nitrogen removal performance of the MicroFAST® system during testing at the Massachusetts Alternative Septic System Test Center – May, 1999- May 2001.
Total Nitrogen(mg/l) Replicate 1 Replicate 2 Replicate 3 Influent Mean %Removal Average 17.6 16.3 17.8 35.5 17.4 51.0% Median 18.7 16.4 17.0 34.5 Standard Deviation 4.3 4.6 5.0 3.6 Maximum 28.5 25.6 36.5 43.8 Minimum 10.4 9.0 9.2 28.6 Count 45 29 45 45 Count > 19 mg/l 20 7 15 Avg. to 6/14/00 16.1 15.0 15.7 34.5 15.6 54.8% Avg after 6/14/00 19.0 20.5 19.8 36.4 19.9 45.2%
Performance Results – MicroFAST® Page 7 of 25

Pathogen removal Reduction of fecal coliform organisms by the treatment technology is used as an indicator of pathogen removal performance. Fecal coliform in the influent averaged (geometric mean) 2.7 x 10⁶ colonies per 100 ml (Table 5). Effluent from the FAST® units averaged 6.6 x 10⁴ colonies per 100 ml, amounting to a reduction of 98 per cent. Additional reductions in pathogens can be obtained by vendors of alternative onsite technologies by post treatment with ultraviolet light, ozonation or chlorination.
Table 4. Fecal Coliform removal performance of the MicroFAST® system during testing at the Massachusetts Alternative Septic System Test Center – May, 1999- May 2001.
Fecal Coliform CFU/100 ml Replicate 1 Replicate 2 Replicate 3 Influent Mean %Removal Log Mean 6.9E+04 4.9E+04 8.7E+04 2.7E+06 6.6E+04 98 Maximum 1.3E+06 3.3E+05 1.4E+06 2.2E+07 Minimum 1.0E+04 9.0E+03 5.0E+03 1.0E+05
6. Operation and Maintenance Monitoring – MicroFAST® MicroFAST® Mechanical Components The blower on Unit 3 failed in the last week of testing due to a loose wire. The control/alarm panel on Unit 2 did not function properly in the first week of operation and was replaced. The timer unit for the blower installed on Unit 2 failed in the first week of operation. Noise The primary source of noise from the system is the blower. Noise levels were measured on 2/27/00 using a Quest Model 2700 Sound Level Meter calibrated by factor on 2/23/00 (NIST Traceable) using slow response and A weighting. Levels were recorded 20 feet from the unit 4 feet above grade. Recorded levels averaged 46 db. These levels compare to background levels at the site on that date of about 39 db. Ease of maintenance The blower unit is above ground and easy to access by removing the housing cover. Solids removal Frequency of pumping septic tank solids is dependent upon the rate of wastewater use in the residence. At MASSTC the wastewater flow to the MicroFAST units was 330 gallons
Performance Results – MicroFAST® Page 8 of 25

per day. At that loading rate, solids accumulation in both the initial and secondary chambers of the septic tank began to interfere with treatment performance after 13 months of operation. We would suggest a one-year solids pumping interval for these units at that loading rate. Households with lower loading rates would have longer intervals between pumping events. The frequency for residuals removal in any situation should be determined by regular measurement of the residuals buildup in the tank. 8. Vendor’s Comments The vendor wished to distinguish between a failure of equipment and the occurrence of a loose wire which was the reason for the blower ceasing on Unit 3 near the end of the test. Additionally, the vendor comments that the failure of the control/alarm panel noted for unit 2 would have been covered under the warranty.
Performance Results – MicroFAST® Page 9 of 25

APPENDIX 1
Graphs of Major Wastewater Constituents At Discharge
MicroFAST®
Technology Vendor
Bio-Microbics, Inc. 8450 Cole Parkway Shawnee, KS 66227
Performance Results – MicroFAST® Page 10 of 25

BOD(5day) Concentrations of MicroFAST Discharge vs. Influent During Testing at the Massachusetts Alternative Septic System Test Center May 10, 1999 - May 8, 2001. D1 DB, D2 DB, D3 DB = Replicates 1-3 respectively, DCEAST = Influent
0
50
100
150
200
250
300
350
5/19
/199
9
6/19
/199
9
7/19
/199
9
8/19
/199
9
9/19
/199
9
10/1
9/19
99
11/1
9/19
99
12/1
9/19
99
1/19
/200
0
2/19
/200
0
3/19
/200
0
4/19
/200
0
5/19
/200
0
6/19
/200
0
7/19
/200
0
8/19
/200
0
9/19
/200
0
10/1
9/20
00
11/1
9/20
00
12/1
9/20
00
1/19
/200
1
2/19
/200
1
3/19
/200
1
4/19
/200
1
Sampling Date
Bio
logi
cal O
xyge
n D
eman
d (m
g/l)
D1 DBD2 DBD3 DBDC EAST
Total Suspended Solids(TSS) Concentrations of MicroFAST Discharge vs. Influent During Testing at the Massachusetts Alternative Septic System Test Center May 10, 1999 - May 8, 2001. D1 DB, D2 DB, D3 DB = Replicates 1-3 respectively, DCEAST = Influent
0
50
100
150
200
250
300
350
5/19
/199
9
6/19
/199
9
7/19
/199
9
8/19
/199
9
9/19
/199
9
10/1
9/19
99
11/1
9/19
99
12/1
9/19
99
1/19
/200
0
2/19
/200
0
3/19
/200
0
4/19
/200
0
5/19
/200
0
6/19
/200
0
7/19
/200
0
8/19
/200
0
9/19
/200
0
10/1
9/20
00
11/1
9/20
00
12/1
9/20
00
1/19
/200
1
2/19
/200
1
3/19
/200
1
4/19
/200
1
Sampling Date
Tota
l Sus
pend
ed S
olid
s (m
g/)
D1 DBD2 DBD3 DBDC EAST
Performance Results – MicroFAST® Page 11 of 25

Total Nitrogen Concentrations of MicroFAST Discharge vs. Influent During Testing at the Massachusetts Alternative Septic System Test Center May 10, 1999 - May 8, 2001. D1 DB, D2 DB, D3 DB = Replicates 1-3 respectively, DCEAST = Influent
0.00
5.00
10.00
15.00
20.00
25.00
30.00
35.00
40.00
45.00
50.006/
9/19
99
7/9/
1999
8/9/
1999
9/9/
1999
10/9
/199
9
11/9
/199
9
12/9
/199
9
1/9/
2000
2/9/
2000
3/9/
2000
4/9/
2000
5/9/
2000
6/9/
2000
7/9/
2000
8/9/
2000
9/9/
2000
10/9
/200
0
11/9
/200
0
12/9
/200
0
1/9/
2001
2/9/
2001
3/9/
2001
4/9/
2001
5/9/
2001
Sampling Date
Tota
l Nitr
ogen
(mg/
l)
D1 DBD2 DBD3 DBDC EAST
Fecal Coliform Densities in MicroFAST Discharge vs. Influent During Testing at the Massachusetts Alternative Septic System Test Center May 10, 1999 - May 8, 2001. D1 DB, D2 DB, D3 DB = Replicates 1-3 respectively, DCEAST = Influent
1
10
100
1000
10000
100000
1000000
10000000
100000000
5/19
/199
9
6/19
/199
9
7/19
/199
9
8/19
/199
9
9/19
/199
9
10/1
9/19
99
11/1
9/19
99
12/1
9/19
99
1/19
/200
0
2/19
/200
0
3/19
/200
0
4/19
/200
0
5/19
/200
0
6/19
/200
0
7/19
/200
0
8/19
/200
0
9/19
/200
0
10/1
9/20
00
11/1
9/20
00
12/1
9/20
00
1/19
/200
1
2/19
/200
1
3/19
/200
1
4/19
/200
1
5/19
/200
1
Sampling Date
Log
of F
ecal
Col
iform
Col
onie
s per
100
ml
D1 DBD2 DBD3 DBDC EAST
Performance Results – MicroFAST® Page 12 of 25

APPENDIX 2
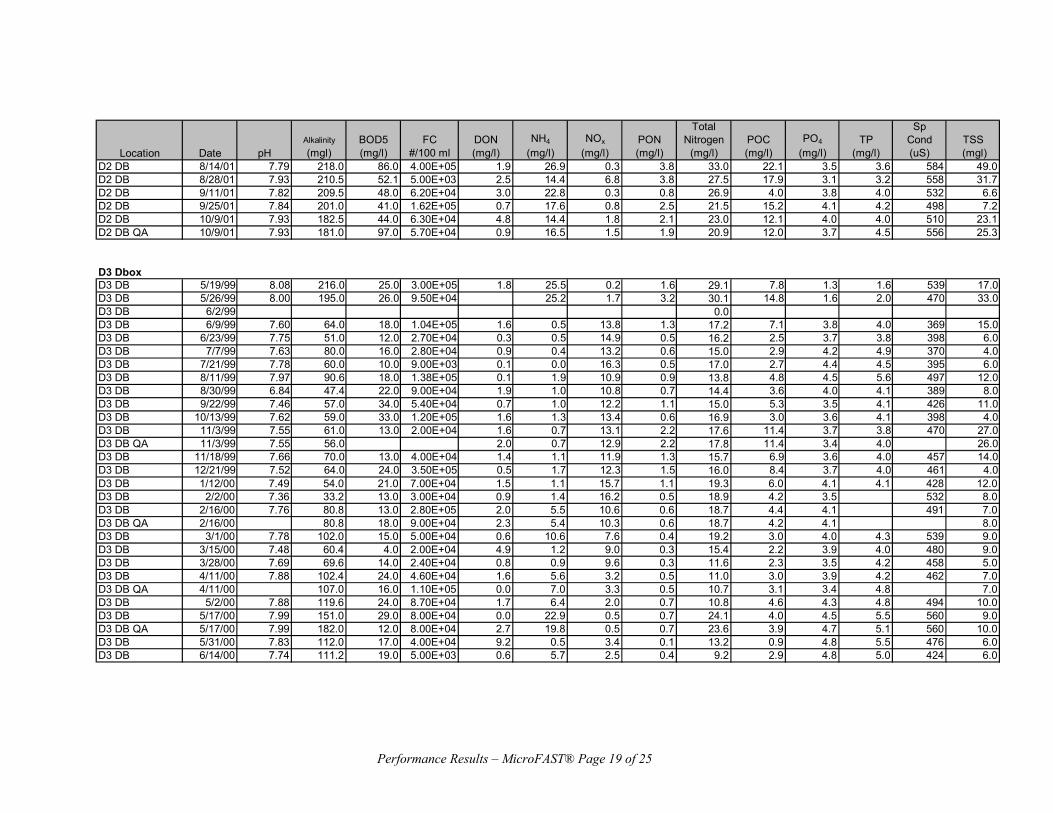
Tables of All Wastewater Constituents Monitored in Conjunction with Testing
MicroFAST®
Technology Vendor
Bio-Microbics, Inc. 8450 Cole Parkway Shawnee, KS 66227
Key: D1DB, D2DB, and D3DB represent the discharges of units #1-3 accordingly DSU = Sump data – a composite collection in a sump situated beneath all three soil absorption systems. D1 1 FT, D1 2 FT, D1 5 FT – Pan lysimeters collections beneath the D1 soil absorption system at 1 ft, 2 ft, and 5 ft respectively. Similar for system D2 and D3. DCEAST – samples at the relevant influent location.
Performance Results – MicroFAST® Page 13 of 25

Location Date pHAlkalinity(mgl)
BOD5(mg/l)
FC#/100 ml
DON(mg/l)
NH4
(mg/l)NOx
(mg/l)PON(mg/l)
TotalNitrogen
(mg/l)POC(mg/l)
PO4
(mg/l)TP
(mg/l)
SpCond(uS)
TSS (mgl)
DC EAST 6/9/99 7.40 185.0 176.0 1.80E+06 0.3 27.5 0.00 6.4 34.2 62.2 3.5 5.4 509 131.0DC EAST 6/23/99 7.32 187.0 163.0 6.00E+06 2.4 29.0 0.02 7.3 38.7 59.3 3.6 5.1 492 134.0DC EAST 7/7/99 7.18 169.0 238.0 4.80E+06 0.5 23.5 0.05 7.7 31.8 75.4 3.8 4.9 431 131.0DC EAST 7/21/99 7.47 193.0 176.0 2.10E+06 0.7 28.5 0.08 5.9 35.1 57.7 3.9 5.5 602 128.0DC EAST 8/11/99 7.33 201.0 143.0 5.80E+06 1.5 31.5 0.08 6.5 39.6 57.8 4.5 5.7 570 128.0DC EAST 8/30/99 7.36 172.0 110.0 2.00E+06 1.6 25.0 0.18 5.5 32.2 47.7 3.6 6.0 537 103.0DC EAST 9/22/99 7.42 158.0 167.0 3.10E+06 1.2 27.4 0.00 8.8 37.4 74.8 3.2 5.1 534 168.0DC EAST 10/13/99 7.25 184.0 186.0 2.80E+06 0.5 25.0 0.00 3.1 28.6 28.1 3.2 4.9 460 56.0DC EAST 11/3/99 7.30 179.0 274.0 2.20E+06 2.5 23.8 0.06 8.1 34.5 83.1 3.1 4.2 550 184.0DC EAST 11/18/99 7.36 185.0 117.0 3.70E+06 1.5 26.2 0.05 6.0 33.8 57.3 3.2 5.1 579 118.0DC EAST 12/14/99 7.33 168.0 192.0 2.50E+06 0.2 27.1 0.04 7.8 35.2 71.2 3.5 4.9 531 175.0DC EAST 12/21/99 7.39 242.0 212.0 2.30E+06 2.2 27.2 0.10 3.8 33.2 34.6 3.7 5.7 556 77.0DC EAST 1/12/00 7.42 183.0 152.0 2.10E+06 0.6 28.0 0.04 3.5 32.1 27.4 3.8 5.3 588 49.0DC EAST 2/2/00 7.30 152.0 179.0 2.60E+06 5.3 23.4 0.03 3.9 32.6 40.4 3.5 514 86.0DC EAST 2/16/00 7.52 162.0 135.0 3.40E+06 2.7 23.1 0.05 7.6 33.5 75.8 2.9 532 144.0DC EAST 2/23/00 165.0 129.0 5.00E+05 3.5 21.7 0.03 5.4 30.6 50.3 2.8 107.0DC EAST 3/1/00 7.45 147.0 106.0 1.80E+06 3.7 22.9 0.04 7.0 33.7 69.5 3.0 5.3 572 80.0DC EAST 3/8/00 7.17 168.0 187.0 3.50E+06 2.7 24.9 0.02 8.4 36.1 88.1 3.9 5.6 563 182.0DC EAST 3/15/00 7.27 209.0 150.0 2.80E+06 2.5 23.8 0.04 9.9 36.3 92.6 3.4 570 184.0DC EAST QA 3/15/00 7.32 176.0 145.0 1.46E+06 3.6 23.2 0.06 7.2 34.0 59.3 3.5 6.0 600 130.0DC EAST 3/28/00 7.55 159.0 140.0 8.00E+05 2.3 22.4 0.08 5.0 29.7 36.0 3.1 5.3 531 81.0DC EAST 4/11/00 7.49 168.0 103.0 7.00E+05 3.5 22.9 0.01 7.9 34.3 70.8 3.1 5.2 584 169.0DC EAST 4/19/00 7.78 162.0 297.0 6.00E+05 4.4 23.5 0.04 7.4 35.3 76.2 3.6 556 189.0DC EAST 5/2/00 7.38 162.0 201.0 1.20E+06 4.4 26.5 0.04 7.4 38.3 76.2 3.6 7.4 552 164.0DC EAST 5/11/00 7.33 150.0 205.0 3.50E+06 2.7 21.4 0.01 2.6 4.0 531 216.0DC EAST 5/17/00 7.42 161.0 206.0 2.20E+06 3.7 21.6 0.09 12.1 37.5 102.3 2.8 5.2 570 222.0DC EAST 5/31/00 7.37 170.0 170.0 1.30E+06 4.8 20.7 0.17 7.3 32.9 70.6 2.7 5.0 564 160.0DC EAST 6/14/00 7.09 130.0 317.0 1.00E+05 0.9 30.1 0.12 8.7 39.7 93.1 3.9 5.7 600 198.0DC EAST QA 6/14/00 7.09 51.2 365.0 2.00E+05 1.3 28.6 0.19 8.3 38.3 79.2 3.7 5.7 600 169.0DC EAST 6/28/00 7.28 158.0 219.0 2.40E+06 5.9 25.0 0.13 12.6 43.6 164.4 3.3 4.3 657 330.0DC EAST 7/12/00 7.02 58.8 180.0 3.60E+06 1.7 23.8 0.09 10.5 36.1 105.1 2.8 3.9 532 224.0DC EAST 7/26/00 7.39 192.0 263.0 3.20E+06 5.0 28.6 0.03 6.6 40.2 54.9 4.2 5.9 675 168.0DC EAST 8/9/00 7.25 168.0 326.0 6.00E+05 4.4 21.1 0.08 15.8 41.3 366.0 3.2 608DC EAST 8/23/00 7.25 150.0 215.0 1.24E+07 1.6 23.3 0.03 11.7 36.7 143.2 3.2 4.9 638 292.0DC EAST 9/6/00 7.45 140.0 120.0 5.50E+06 1.4 21.8 0.03 10.8 34.0 81.0 3.0 3.8 599 178.0DC EAST 9/20/00 7.41 138.0 96.0 4.20E+06 1.8 22.0 0.02 8.9 32.8 72.9 3.2 5.3 547 155.0DC EAST QA 9/20/00 7.38 136.0 97.0 2.13E+06 1.2 22.4 0.03 11.3 35.0 99.9 3.4 5.1 545 209.0DC EAST 10/3/00 7.28 141.0 160.0 1.21E+07 1.1 24.0 0.03 7.8 32.9 89.0 3.6 4.9 607 185.0DC EAST 10/17/00 7.28 178.0 100.0 2.09E+07 1.4 19.3 0.16 9.2 30.0 89.8 2.6 4.7 525 198.0

Location Date pHAlkalinity(mgl)
BOD5(mg/l)
FC#/100 ml
DON(mg/l)
NH4
(mg/l)NOx
(mg/l)PON(mg/l)
TotalNitrogen
(mg/l)POC(mg/l)
PO4
(mg/l)TP
(mg/l)
SpCond(uS)
TSS (mgl)
DC EAST 10/30/00 7.35 155.5 174.0 1.05E+07 3.8 20.6 0.04 7.3 31.7 69.7 2.8 3.4 461 156.0DC EAST 11/14/00 7.66 163.0 128.0 1.00E+07 1.9 25.9 0.03 7.5 35.4 59.8 3.1 5.2 482 126.0DC EAST 11/28/00 7.49 183.5 200.0 1.10E+07 4.2 25.2 0.01 9.7 39.1 145.8 3.2 5.2 550 275.0DC EAST 12/12/00 7.51 182.0 96.0 6.00E+06 1.3 26.6 0.05 6.4 34.4 62.3 3.0 4.3 569 126.0DC EAST 12/26/00 7.42 183.0 231.0 2.20E+07 0.6 30.5 0.01 12.0 43.1 104.7 3.6 6.1 547 232.0DC EAST 1/9/01 7.63 181.0 140.0 3.00E+06 5.5 21.5 0.07 7.6 34.7 73.8 3.8 5.6 561 171.0DC EAST 1/23/01 7.47 185.0 120.0 1.00E+06 28.4 0.04 6.5 35.0 61.9 3.7 4.8 523 87.5DC EAST 2/6/01 7.49 181.5 133.0 2.20E+06 3.4 23.5 0.07 6.8 33.8 73.4 3.4 5.0 785 140.5DC EAST 2/20/01 7.42 185.5 124.0 9.00E+05 3.6 24.3 0.07 9.5 37.5 140.6 3.4 4.9 517 278.2DC EAST QA 2/20/01 7.43 186.0 151.0 1.00E+06 5.2 23.7 0.05 7.9 36.9 85.9 3.6 5.2 519 197.2DC EAST 3/13/01 7.39 168.0 93.0 1.30E+06 2.7 23.1 0.14 8.4 34.4 82.4 3.6 5.6 972 178.5DC EAST 3/27/01 7.50 177.0 122.0 2.30E+06 5.5 29.3 0.01 9.0 43.8 82.0 3.6 5.5 821 165.0DC EAST QA 3/27/01 7.51 177.0 122.0 9.00E+05 4.2 29.2 0.06 8.9 42.3 82.8 3.5 5.6 830 118.5DC EAST 4/10/01 7.58 182.5 189.0 5.00E+05 4.1 25.2 0.06 7.1 36.4 74.5 3.9 5.0 499 152.0DC EAST 4/24/01 7.48 192.0 178.0 1.30E+06 1.9 26.3 0.05 7.5 35.7 73.9 3.3 4.2 546 178.5DC EAST 5/8/01 7.44 173.5 210.0 2.80E+06 1.5 24.6 0.06 5.2 31.4 52.3 3.3 4.8 516 110.3DC EAST 5/22/01 7.41 173.0 140.0 2.80E+06 2.9 26.7 0.05 8.0 37.6 73.8 3.9 4.1 499 170.3DC EAST 6/5/01 7.44 183.5 270.0 1.20E+06 1.2 26.5 0.01 5.5 33.2 41.1 3.3 4.8 536 91.3DC EAST 6/19/01 7.43 185.0 185.0 9.20E+06 1.5 29.4 0.05 6.7 37.7 60.2 3.3 3.5 525 126.7DC EAST 7/2/01 7.39 180.5 256.0 1.27E+07 2.5 22.4 0.07 10.2 35.1 117.3 3.2 4.7 550 258.4DC EAST 7/17/01 7.31 188.0 302.0 4.00E+06 2.2 24.6 0.03 12.8 39.5 152.7 3.5 4.2 536 328.7DC EAST 7/31/01 7.39 166.5 122.0 4.30E+06 1.1 22.6 0.08 5.8 29.6 44.4 2.8 3.7 474 98.7DC EAST 8/14/01 7.25 178.5 260.0 5.60E+06 0.7 24.8 0.13 3.4 3.8 540 132.0DC EAST QA 8/14/01 7.28 180.0 238.0 1.00E+07 0.0 24.8 0.06 9.2 34.1 89.3 3.2 3.4 534 199.8DC EAST 8/28/01 7.57 180.0 278.0 1.27E+07 3.0 18.1 0.23 7.4 28.7 63.2 2.8 3.3 500 109.4DC EAST QA 8/28/01 179.5 260.0 5.00E+06 2.0 18.9 0.28 9.2 30.4 112.9 3.0 3.2 227.7DC EAST 9/11/01 7.35 191.5 251.0 2.90E+06 4.8 21.9 0.13 6.6 33.4 59.9 3.3 4.3 521 134.0DC EAST 9/25/01 7.10 183.0 255.0 5.10E+06 2.1 20.8 0.09 5.3 28.2 66.0 3.4 4.7 505 150.5DC EAST 10/9/01 7.25 184.0 243.0 5.80E+06 7.1 16.0 0.10 4.2 27.3 55.0 3.8 4.8 540 178.5
Performance Results – MicroFAST® Page 15 of 25

Location Date pHAlkalinity(mgl)
BOD5(mg/l)
FC#/100 ml
DON(mg/l)
NH4
(mg/l)NOx
(mg/l)PON(mg/l)
TotalNitrogen
(mg/l)POC(mg/l)
PO4
(mg/l)TP
(mg/l)
SpCond(uS)
TSS (mgl)
D1 DB 5/19/99 7.90 213.0 24.0 5.00E+04 0.2 24.3 0.2 0.9 25.6 4.4 1.2 1.4 539 9.0D1 DB 5/26/99 8.10 213.0 28.0 5.00E+04 0.0 27.2 0.6 1.3 29.1 7.7 1.5 1.8 879 19.0D1 DB 6/2/99 7.54 36.0 7.80E+04 2.1 13.3 10.2 0.9 26.5 4.5 3.2 3.7 458 12.0D1 DB 6/9/99 7.60 50.0 31.0 1.07E+05 1.6 0.6 15.1 1.3 18.6 7.5 3.7 3.9 416 14.0D1 DB 6/23/99 7.45 46.0 8.0 4.80E+04 0.0 0.4 18.7 0.3 19.4 1.6 3.6 3.7 410 4.0D1 DB 7/7/99 7.48 72.0 10.0 1.80E+04 0.6 0.4 12.4 0.6 13.9 3.1 4.1 4.2 375 7.0D1 DB 7/21/99 7.24 53.0 11.0 6.30E+04 0.0 0.5 14.5 0.5 15.5 2.7 3.9 385 5.0D1 DB QA 7/21/99 7.44 60.0 6.0 3.20E+04 0.5 0.5 14.4 0.5 15.8 2.7 3.9 4.0 375 6.0D1 DB 8/11/99 7.58 58.4 11.0 2.30E+04 0.8 0.8 14.7 0.9 17.2 4.2 3.9 4.1 455 9.0D1 DB 8/30/99 7.61 65.9 13.0 2.70E+04 1.6 0.6 11.0 0.6 13.9 3.5 4.2 5.4 405 8.0D1 DB 9/22/99 7.55 54.0 28.0 3.00E+04 1.1 3.0 17.6 0.9 22.6 4.7 3.6 4.1 467 12.0D1 DB 10/13/99 7.44 52.0 16.0 7.10E+04 0.7 0.5 16.0 1.6 18.8 7.6 3.6 4.1 404 17.0D1 DB 11/3/99 7.41 50.0 16.0 2.40E+04 2.2 0.7 17.8 1.8 22.4 9.1 3.6 3.7 482 21.0D1 DB 11/18/99 7.56 48.0 4.0 8.90E+04 0.9 0.7 17.2 0.8 19.6 4.2 3.6 3.7 482 9.0D1 DB 12/21/99 7.35 49.0 25.0 6.70E+04 1.2 1.0 18.4 0.8 21.4 4.6 3.8 4.3 475 8.0D1 DB 1/12/00 7.42 46.0 21.0 4.70E+04 1.2 0.1 17.7 2.0 21.0 9.5 4.2 4.2 436 20.0D1 DB 2/2/00 7.58 56.0 14.0 8.20E+04 2.2 4.3 10.6 1.7 18.7 12.5 3.5 479 13.0D1 DB 2/16/00 7.84 105.6 11.0 1.70E+05 1.1 9.8 5.7 0.5 17.2 3.5 4.3 517 13.0D1 DB 3/1/00 7.70 91.2 16.0 8.00E+04 0.6 7.3 7.5 0.4 15.9 3.2 3.7 4.4 507 7.0D1 DB 3/15/00 7.46 72.0 6.0 2.40E+05 0.4 1.0 10.1 0.3 11.8 1.9 4.0 4.4 435 4.0D1 DB 3/28/00 7.77 68.8 6.0 4.00E+04 0.8 0.8 9.4 0.2 11.3 1.5 3.7 4.4 473 5.0D1 DB 4/11/00 7.65 74.8 14.0 3.00E+04 1.3 1.1 7.9 0.3 10.6 2.1 3.7 4.5 459 5.0D1 DB QA 4/11/00 73.2 6.00E+04 0.1 2.3 7.9 0.4 10.7 2.5 3.3 3.8 6.0D1 DB 5/2/00 7.68 78.0 13.0 1.80E+05 1.6 1.4 6.6 0.9 10.4 5.4 4.3 4.8 447 11.0D1 DB 5/17/00 7.75 104.0 17.0 3.00E+04 0.8 6.8 3.1 1.4 12.1 7.3 3.8 4.7 474 18.0D1 DB 5/31/00 7.78 133.2 23.0 1.10E+05 2.6 6.2 2.0 0.6 11.5 3.4 4.7 5.2 501 7.0D1 DB 6/14/00 7.48 81.2 24.0 3.00E+04 0.9 1.4 7.1 1.6 11.0 8.3 4.7 5.1 448 19.0D1 DB 6/28/00 7.58 94.8 27.0 2.80E+04 2.3 4.2 4.4 1.5 12.4 8.7 5.1 5.9 510 20.0D1 DB 7/12/00 7.24 77.6 32.0 6.10E+04 4.4 3.4 4.5 1.4 13.7 8.3 4.4 5.0 448 17.0D1 DB 7/26/00 7.63 116.4 38.0 1.20E+05 1.5 7.3 5.8 1.5 16.0 9.6 4.6 4.6 511 23.0D1 DB 8/9/00 7.92 107.2 43.0 2.00E+04 6.4 0.1 10.0 2.8 19.4 16.5 3.9 538 37.0D1 DB 8/23/00 7.49 65.0 40.0 4.80E+04 4.6 1.6 11.5 3.4 21.1 18.5 3.4 4.2 516 42.0D1 DB 9/6/00 8.00 94.8 22.0 4.70E+04 0.3 0.4 12.4 1.2 14.3 5.3 4.4 4.5 525 11.0D1 DB 9/20/00 7.45 69.2 24.0 4.00E+04 1.0 1.0 16.3 2.7 21.0 12.0 3.4 3.8 474 26.0D1 DB 10/3/00 7.32 65.6 24.0 2.30E+05 9.6 1.1 8.3 2.8 21.9 14.4 3.4 3.9 495 30.0D1 DB 10/17/00 7.72 70.8 26.0 1.70E+05 0.6 1.0 16.4 2.7 20.7 12.6 3.1 3.5 473 30.0D1 DB 10/30/00 7.51 70.5 32.0 3.70E+05 2.4 3.6 11.9 2.3 20.2 12.5 2.9 3.1 405 30.0D1 DB 11/14/00 7.26 43.5 28.0 2.70E+05 1.5 1.3 15.6 1.4 19.7 6.8 2.7 3.3 383 15.0D1 DB 11/28/00 7.41 51.0 26.0 9.20E+05 1.7 0.9 14.8 1.7 19.1 7.9 3.1 3.7 407 17.0
Performance Results – MicroFAST® Page 16 of 25

Performance Results – MicroFAST® Page 17 of 25
D2 DB 3/28/00 7.91 67.6 13.0 1.00E+04 1.5 0.1 9.0 0.5 11.0 3.3 4.2 4.3 515 5.0D2 DB 4/11/00 7.73 76.0 18.0 4.10E+04 0.8 1.4 7.5 0.6 10.4 4.3 3.5 3.8 416 10.0D2 DB 5/2/00 7.66 74.8 9.0 6.90E+04 1.2 0.8 9.4 0.5 11.9 2.9 4.2 4.7 447 6.0
Location Date pHAlkalinity(mgl)
BOD5(mg/l)
FC#/100 ml
DON(mg/l)
NH4
(mg/l)NOx
(mg/l)PON(mg/l)
TotalNitrogen
(mg/l)POC(mg/l)
PO4
(mg/l)TP
(mg/l)
SpCond(uS)
TSS (mgl)
D1 DB QA 11/28/00 7.46 46.5 20.0 2.30E+05 1.4 0.9 14.8 1.7 18.8 8.5 3.2 3.7 405 18.0D1 DB 12/12/00 7.54 51.0 16.0 7.00E+04 2.4 0.4 17.0 0.6 20.5 3.9 3.8 3.9 465 9.0D1 DB 12/26/00 7.46 62.0 20.0 1.32E+06 3.5 1.4 14.9 3.0 22.8 12.8 3.4 4.0 435 25.0D1 DB 1/9/01 7.28 37.5 18.0 7.00E+04 1.6 1.8 16.4 4.0 23.7 18.0 3.6 4.6 438 31.5D1 DB 1/23/01 7.31 180.5 20.0 1.00E+04 0.7 3.2 14.0 2.2 20.2 12.1 3.7 4.1 437 17.0D1 DB 2/6/01 7.29 52.5 21.0 2.00E+04 4.0 1.8 20.9 1.8 28.5 10.4 3.5 3.7 454 16.0D1 DB 2/20/01 7.67 83.5 24.0 1.70E+05 2.5 4.0 10.0 0.8 17.4 6.0 3.6 3.7 433 13.3D1 DB 3/13/01 7.71 100.5 5.0 3.00E+04 0.8 11.9 7.2 1.0 20.9 6.0 3.9 4.0 616 11.6D1 DB 3/27/01 7.78 112.5 39.0 1.10E+05 4.1 11.1 6.0 1.3 22.6 8.2 3.5 4.0 434 16.6D1 DB 4/10/01 7.76 87.0 75.0 1.00E+04 2.1 2.1 11.8 4.0 4.0 418 23.2D1 DB 4/24/01 7.68 77.0 21.0 1.50E+05 0.1 0.7 9.5 0.9 11.2 5.2 3.7 4.3 414 17.7D1 DB 5/8/01 7.48 83.0 36.0 9.00E+04 1.3 3.9 7.2 1.9 14.4 10.2 4.1 4.2 400 23.1D1 DB 5/22/01 7.53 69.5 38.0 1.20E+05 0.4 0.6 9.0 5.4 15.4 31.5 4.5 5.6 378 78.7
D2 DboxD2 DB 5/19/99 7.83 212.0 32.0 5.00E+04 0.0 23.4 0.2 0.3 23.9 1.7 1.2 1.5 540 1.0D2 DB 5/26/99 8.02 204.0 42.0 9.40E+04 0.9 26.2 1.0 2.9 31.0 13.6 1.6 1.9 480 29.0D2 DB 6/2/99 7.59 48.0 9.00E+03 1.1 15.9 9.1 1.4 27.5 7.3 3.4 4.5 460 17.0D2 DB 6/9/99 7.50 61.0 26.0 1.29E+05 1.9 1.1 15.1 1.7 19.8 9.3 3.7 4.3 403 19.0D2 DB 6/23/99 7.54 41.0 12.0 3.00E+04 1.3 0.5 15.7 0.3 17.9 1.6 4.0 4.1 392 5.0D2 DB 7/7/99 7.09 74.0 13.0 2.10E+04 1.1 0.4 12.1 0.5 14.1 2.8 4.0 4.1 373 6.0D2 DB QA 7/7/99 7.51 75.0 12.0 8.00E+04 0.5 0.4 12.0 0.7 13.6 3.5 4.1 4.2 364 8.0D2 DB 7/21/99 7.58 67.0 20.0 8.80E+04 0.1 0.7 12.7 0.8 14.3 4.2 3.7 3.9 373 9.0D2 DB 8/11/99 7.44 54.5 18.0 4.20E+04 0.8 0.9 13.6 1.0 16.4 5.1 3.9 4.1 432 12.0D2 DB 8/30/99 7.48 62.5 8.0 1.50E+04 1.1 1.3 11.7 0.3 14.4 1.9 4.3 4.4 413 4.0D2 DB 9/22/99 7.64 78.0 63.0 4.20E+04 1.1 9.9 11.3 1.5 23.8 8.6 3.8 5.0 495 19.0D2 DB 10/13/99 7.65 68.0 16.0 9.80E+04 1.2 0.6 9.3 0.7 11.8 3.7 3.6 4.0 381 8.0D2 DB 11/3/99 7.55 67.0 17.0 2.00E+04 2.0 0.4 9.9 2.4 14.7 12.4 3.7 4.0 456 30.0D2 DB 11/18/99 7.74 69.2 4.0 7.10E+04 1.2 0.7 8.3 1.1 11.3 6.1 3.7 3.7 442 9.0D2 DB 12/21/99 7.64 79.0 24.0 9.20E+04 0.7 4.2 10.0 0.5 15.4 3.0 4.0 4.5 470 5.0D2 DB 1/12/00 7.69 88.4 10.0 2.90E+04 1.5 7.8 9.1 18.4 4.5 4.7 456 6.0D2 DB QA 1/12/00 7.71 96.0 100.0 2.00E+04 0.4 7.6 9.4 0.4 17.7 2.2 4.4 4.8 438 5.0D2 DB 2/2/00 7.65 82.8 24.0 1.05E+05 1.4 11.9 5.5 1.7 20.4 14.3 3.4 3.5 482 16.0D2 DB 2/16/00 7.94 152.0 23.0 2.50E+05 0.4 20.9 0.7 1.1 23.0 7.7 3.9 534 15.0D2 DB 3/1/00 7.65 87.2 24.0 3.30E+05 1.2 7.0 8.0 0.7 16.8 4.4 4.0 4.5 511 29.0D2 DB 3/15/00 7.48 64.0 8.0 8.00E+04 1.0 1.0 11.0 1.0 14.0 2.5 3.9 4.1 432 5.0

Location Date pHAlkalinity(mgl)
BOD5(mg/l)
FC#/100 ml
DON(mg/l)
NH4
(mg/l)NOx
(mg/l)PON(mg/l)
TotalNitrogen
(mg/l)POC(mg/l)
PO4
(mg/l)TP
(mg/l)
SpCond(uS)
TSS (mgl)
D2 DB 5/17/00 7.85 69.6 13.0 4.00E+04 2.2 6.4 1.1 0.5 10.2 2.8 4.1 5.1 477 7.D2 DB 5/31/00 7.61 80.0 12.0 5.00E+04 1.8 1.0 6.0 0.3 9.0 1.8 4.7 5.6 429 5.D2 DB 6/14/00 7.60 92.4 29.0 1.00E+04 1.8 2.2 4.8 2.3 11.1 15.3 5.2 5.3 455 38.D2 DB 6/28/00 7.78 130.8 28.0 2.60E+04 4.0 13.3 4.6 3.8 25.6 23.6 5.1 5.6 602 56.D2 DB 7/12/00 7.46 101.6 32.0 5.70E+04 1.9 10.2 4.5 1.5 18.1 8.5 4.4 5.2 503 20.D2 DB 7/26/00 7.78 126.0 51.0 3.00E+04 1.1 10.5 7.9 3.7 23.2 20.7 4.1 4.8 543 49.D2 DB QA 7/26/00 132.0 47.0 4.20E+04 11.1 7.8 2.9 21.8 16.1 4.3 4.9 38.D2 DB 8/9/00 7.72 95.6 36.0 7.50E+04 3.7 0.2 10.9 3.0 17.8 19.5 3.3 527 48.D2 DB 8/23/00 7.58 71.0 31.0 2.10E+05 1.2 1.5 11.5 3.0 17.2 15.6 3.3 4.1 520 38.D2 DB 9/6/00 7.75 80.4 42.0 7.00E+04 0.2 1.0 13.4 7.3 21.8 26.6 3.3 4.4 500 122.D2 DB 9/20/00 7.68 78.0 24.0 2.00E+04 1.2 0.9 14.3 3.5 19.9 16.5 3.4 4.1 469 31.D2 DB 10/3/00 7.65 94.4 46.0 3.20E+05 4.2 6.0 3.6 3.5 17.3 17.4 3.4 4.1 508 36.D2 DB 10/17/00 7.62 88.8 18.0 3.60E+05 0.7 1.4 9.6 2.3 14.0 10.8 3.1 3.3 463 32.D2 DB QA 10/17/00 7.61 90.8 21.0 2.00E+04 0.7 1.3 9.4 2.2 13.6 11.0 2.8 3.8 465 25.D2 DB 10/30/00 7.59 76.5 18.0 2.00E+05 1.3 0.8 8.0 1.2 11.3 6.9 3.4 3.5 398 14.D2 DB 11/14/00 7.54 65.0 17.0 1.90E+05 1.0 1.0 9.1 1.9 13.1 10.6 2.5 3.3 337 23.D2 DB QA 11/14/00 7.41 65.5 15.0 8.90E+04 1.3 1.0 9.2 1.3 12.8 7.1 2.7 3.6 372 15.D2 DB 11/28/00 7.55 79.5 22.0 5.20E+05 0.9 2.3 8.8 1.7 13.7 8.6 2.8 3.4 401 18.D2 DB 12/12/00 7.83 121.5 10.0 5.00E+04 4.6 1.5 6.1 9.0 3.3 3.5 509 15.D2 DB 12/26/00 7.75 175.0 21.0 1.60E+05 0.8 22.1 1.0 2.8 26.7 14.1 3.6 4.5 530 30.D2 DB 1/9/01 7.84 185.5 23.0 1.13E+06 5.7 21.1 0.3 4.2 31.4 19.4 3.4 4.7 571 45.D2 DB 1/23/01 7.89 177.5 17.0 1.10E+05 25.8 0.2 2.3 28.3 13.0 3.9 4.3 547 19.D2 DB 2/6/01 7.87 173.0 24.0 2.00E+04 4.4 21.0 0.8 2.3 28.5 12.9 3.6 3.8 541 20.D2 DB 2/20/01 7.92 162.0 14.0 1.40E+04 3.4 17.8 3.4 0.3 24.9 1.6 3.8 4.1 588 2.D2 DB 3/13/01 7.88 160.5 1.0 2.10E+05 1.5 19.0 0.8 3.0 24.2 15.8 3.5 4.0 672 35.D2 DB 3/27/01 7.90 170.0 16.0 4.00E+04 3.0 22.6 0.8 2.6 29.0 13.9 3.7 4.2 505 28.D2 DB 4/10/01 8.05 180.0 18.0 2.00E+04 2.7 22.5 0.1 0.3 25.6 2.4 4.1 4.2 509 3.D2 DB 4/24/01 7.86 123.0 8.0 3.00E+04 1.1 7.0 2.6 0.2 10.8 1.2 3.9 4.2 444 2.D2 DB 5/8/01 7.89 152.0 19.0 7.00E+04 4.0 13.3 0.7 0.4 18.4 2.1 4.9 4.9 481 4.D2 DB 5/22/01 7.88 198.5 60.0 8.00E+04 7.8 29.4 0.3 1.6 39.1 8.8 4.3 4.7 517 20.D2 DB QA 5/22/01 7.89 198.5 51.0 4.60E+04 1.5 28.4 0.1 0.8 30.7 4.0 4.3 4.8 526 8.D2 DB 6/5/01 8.13 210.5 35.0 1.40E+05 1.0 30.0 1.4 1.4 33.9 7.1 4.8 5.3 583 17.D2 DB 6/19/01 7.93 209.5 58.0 1.18E+06 0.0 33.2 0.1 3.1 36.4 15.6 3.8 3.9 537 34.D2 DB 7/2/01 7.68 218.0 89.0 1.76E+06 19.1 10.9 0.2 6.2 36.5 28.4 3.7 5.3 590 74.D2 DB 7/17/01 7.77 223.0 49.8 5.60E+05 0.6 31.1 0.5 6.3 38.5 28.7 3.9 5.3 599 67.D2 DB 7/31/01 8.02 191.5 34.0 2.40E+05 0.8 27.4 0.8 1.8 30.8 9.0 3.7 4.1 526 19.D2 DB QA 7/31/01 8.04 193.5 51.0 1.22E+05 0.4 28.6 0.7 2.0 31.6 10.4 3.8 4.4 527 23.
0000000000000000000088757080096134525
Performance Results – MicroFAST® Page 18 of 25
Location Date pHAlkalinity(mgl)
BOD5(mg/l)
FC#/100 ml
DON(mg/l)
NH4
(mg/l)NOx
(mg/l)PON(mg/l)
TotalNitrogen
(mg/l)POC(mg/l)
PO4
(mg/l)TP
(mg/l)
SpCond(uS)
TSS (mgl)
D2 DB 8/14/01 7.79 218.0 86.0 4.00E+05 1.9 26.9 0.3 3.8 33.0 22.1 3.5 3.6 584 49.0D2 DB 8/28/01 7.93 210.5 52.1 5.00E+03 2.5 14.4 6.8 3.8 27.5 17.9 3.1 3.2 558 31.7D2 DB 9/11/01 7.82 209.5 48.0 6.20E+04 3.0 22.8 0.3 0.8 26.9 4.0 3.8 4.0 532 6.6D2 DB 9/25/01 7.84 201.0 41.0 1.62E+05 0.7 17.6 0.8 2.5 21.5 15.2 4.1 4.2 498 7.2D2 DB 10/9/01 7.93 182.5 44.0 6.30E+04 4.8 14.4 1.8 2.1 23.0 12.1 4.0 4.0 510 23.1D2 DB QA 10/9/01 7.93 181.0 97.0 5.70E+04 0.9 16.5 1.5 1.9 20.9 12.0 3.7 4.5 556 25.3
D3 DboxD3 DB 5/19/99 8.08 216.0 25.0 3.00E+05 1.8 25.5 0.2 1.6 29.1 7.8 1.3 1.6 539 17.0D3 DB 5/26/99 8.00 195.0 26.0 9.50E+04 25.2 1.7 3.2 30.1 14.8 1.6 2.0 470 33.0D3 DB 6/2/99 0.0D3 DB 6/9/99 7.60 64.0 18.0 1.04E+05 1.6 0.5 13.8 1.3 17.2 7.1 3.8 4.0 369 15.0D3 DB 6/23/99 7.75 51.0 12.0 2.70E+04 0.3 0.5 14.9 0.5 16.2 2.5 3.7 3.8 398 6.0D3 DB 7/7/99 7.63 80.0 16.0 2.80E+04 0.9 0.4 13.2 0.6 15.0 2.9 4.2 4.9 370 4.0D3 DB 7/21/99 7.78 60.0 10.0 9.00E+03 0.1 0.0 16.3 0.5 17.0 2.7 4.4 4.5 395 6.0D3 DB 8/11/99 7.97 90.6 18.0 1.38E+05 0.1 1.9 10.9 0.9 13.8 4.8 4.5 5.6 497 12.0D3 DB 8/30/99 6.84 47.4 22.0 9.00E+04 1.9 1.0 10.8 0.7 14.4 3.6 4.0 4.1 389 8.0D3 DB 9/22/99 7.46 57.0 34.0 5.40E+04 0.7 1.0 12.2 1.1 15.0 5.3 3.5 4.1 426 11.0D3 DB 10/13/99 7.62 59.0 33.0 1.20E+05 1.6 1.3 13.4 0.6 16.9 3.0 3.6 4.1 398 4.0D3 DB 11/3/99 7.55 61.0 13.0 2.00E+04 1.6 0.7 13.1 2.2 17.6 11.4 3.7 3.8 470 27.0D3 DB QA 11/3/99 7.55 56.0 2.0 0.7 12.9 2.2 17.8 11.4 3.4 4.0 26.0D3 DB 11/18/99 7.66 70.0 13.0 4.00E+04 1.4 1.1 11.9 1.3 15.7 6.9 3.6 4.0 457 14.0D3 DB 12/21/99 7.52 64.0 24.0 3.50E+05 0.5 1.7 12.3 1.5 16.0 8.4 3.7 4.0 461 4.0D3 DB 1/12/00 7.49 54.0 21.0 7.00E+04 1.5 1.1 15.7 1.1 19.3 6.0 4.1 4.1 428 12.0D3 DB 2/2/00 7.36 33.2 13.0 3.00E+04 0.9 1.4 16.2 0.5 18.9 4.2 3.5 532 8.0D3 DB 2/16/00 7.76 80.8 13.0 2.80E+05 2.0 5.5 10.6 0.6 18.7 4.4 4.1 491 7.0D3 DB QA 2/16/00 80.8 18.0 9.00E+04 2.3 5.4 10.3 0.6 18.7 4.2 4.1 8.0D3 DB 3/1/00 7.78 102.0 15.0 5.00E+04 0.6 10.6 7.6 0.4 19.2 3.0 4.0 4.3 539 9.0D3 DB 3/15/00 7.48 60.4 4.0 2.00E+04 4.9 1.2 9.0 0.3 15.4 2.2 3.9 4.0 480 9.0D3 DB 3/28/00 7.69 69.6 14.0 2.40E+04 0.8 0.9 9.6 0.3 11.6 2.3 3.5 4.2 458 5.0D3 DB 4/11/00 7.88 102.4 24.0 4.60E+04 1.6 5.6 3.2 0.5 11.0 3.0 3.9 4.2 462 7.0D3 DB QA 4/11/00 107.0 16.0 1.10E+05 0.0 7.0 3.3 0.5 10.7 3.1 3.4 4.8 7.0D3 DB 5/2/00 7.88 119.6 24.0 8.70E+04 1.7 6.4 2.0 0.7 10.8 4.6 4.3 4.8 494 10.0D3 DB 5/17/00 7.99 151.0 29.0 8.00E+04 0.0 22.9 0.5 0.7 24.1 4.0 4.5 5.5 560 9.0D3 DB QA 5/17/00 7.99 182.0 12.0 8.00E+04 2.7 19.8 0.5 0.7 23.6 3.9 4.7 5.1 560 10.0D3 DB 5/31/00 7.83 112.0 17.0 4.00E+04 9.2 0.5 3.4 0.1 13.2 0.9 4.8 5.5 476 6.0D3 DB 6/14/00 7.74 111.2 19.0 5.00E+03 0.6 5.7 2.5 0.4 9.2 2.9 4.8 5.0 424 6.0
Performance Results – MicroFAST® Page 19 of 25

Location Date pHAlkalinity(mgl)
BOD5(mg/l)
FC#/100 ml
DON(mg/l)
NH4
(mg/l)NOx
(mg/l)PON(mg/l)
TotalNitrogen
(mg/l)POC(mg/l)
PO4
(mg/l)TP
(mg/l)
SpCond(uS)
TSS (mgl)
D3 DB 6/28/00 7.84 142.8 38.0 1.50E+04 1.5 14.9 1.0 2.0 19.3 10.7 5.0 5.2 588 26.0D3 DB 7/12/00 7.53 141.0 27.0 8.00E+04 0.9 21.8 2.1 1.6 26.4 8.5 5.5 6.3 541 18.0D3 DB 7/26/00 7.73 133.0 45.0 9.00E+04 1.4 15.6 6.3 4.2 27.4 24.8 4.2 5.8 567 59.0D3 DB 8/9/00 7.81 113.0 44.0 5.20E+04 7.5 0.1 9.6 6.7 24.0 40.5 3.1 543 98.0D3 DB 8/23/00 7.58 73.0 34.0 2.48E+05 1.5 1.2 12.2 4.2 19.1 22.7 3.0 4.1 513 51.0D3 DB 9/6/00 7.84 75.0 27.0 4.00E+04 0.7 0.7 9.9 2.4 13.7 14.2 3.2 3.4 501 33.0D3 DB 9/20/00 7.67 69.0 19.0 8.00E+04 0.9 0.9 12.2 1.3 15.3 8.1 3.2 3.5 474 18.0D3 DB 10/3/00 7.69 66.0 12.0 2.70E+05 0.7 0.5 10.2 1.5 12.9 9.1 3.7 3.7 471 17.0D3 DB 10/17/00 7.64 84.0 22.0 4.70E+05 0.4 0.7 10.7 1.9 13.7 9.8 3.1 3.7 451 25.0D3 DB 10/30/00 7.65 76.5 39.0 7.50E+05 1.3 2.8 9.4 1.6 15.2 9.4 3.3 3.4 398 21.0D3 DB 11/14/00 7.51 61.5 30.0 7.40E+05 1.4 2.2 10.8 0.9 15.3 5.2 2.6 3.3 384 11.0D3 DB 11/28/00 7.75 66.5 21.0 8.90E+05 1.2 0.7 12.3 0.9 15.2 4.8 3.4 3.7 412 10.0D3 DB 12/12/00 7.60 69.0 29.0 8.00E+04 2.1 3.6 13.0 1.6 20.2 5.9 3.3 3.7 490 13.0D3 DB 12/26/00 7.54 73.0 18.0 2.10E+05 2.7 3.9 14.2 2.5 23.2 11.9 3.6 4.1 450 25.0D3 DB 1/9/01 7.77 99.0 38.0 1.36E+06 1.3 10.9 7.8 2.7 22.7 12.1 3.5 4.5 496 25.8D3 DB 1/23/01 7.50 63.0 24.0 2.80E+04 0.8 4.1 13.6 0.1 18.6 0.5 3.9 3.9 451 3.3D3 DB 2/6/01 7.54 63.0 18.0 1.00E+04 3.5 2.5 17.8 1.2 25.0 7.1 3.6 3.8 445 10.0D3 DB 2/20/01 7.58 71.5 19.0 4.10E+05 2.7 2.2 11.2 1.4 17.6 8.4 3.5 4.1 439 15.3D3 DB 3/13/01 7.78 111.0 33.0 5.00E+04 0.5 13.0 6.0 1.2 20.8 7.2 3.8 4.2 639 14.2D3 DB 3/27/01 7.71 86.0 34.0 1.00E+05 2.0 6.1 9.6 1.1 18.7 6.6 4.0 4.4 417 12.5D3 DB 4/10/01 7.70 82.5 38.0 1.00E+04 1.8 3.3 8.8 1.8 15.8 12.1 4.0 4.3 416 23.6D3 DB 4/24/01 7.38 168.5 80.0 7.80E+05 0.1 15.2 0.0 4.3 19.6 25.6 4.6 5.3 470 45.3D3 DB 5/8/01 7.17 209.5 250.0 1.00E+06 4.1 31.9 0.1 0.4 36.5 2.8 5.1 5.3 591 1.3
Performance Results – MicroFAST® Page 20 of 25

Location Date pHFC
#/100 mlDON(mg/l)
NH4
(mg/l)NOx
(mg/l)
TotalNitrogen
(mg/l)PO4
(mg/l)TDP
(mg/l)
SpCond(uS)
D1 1FT 2/2/00 5.00E+00 0.3 0.1 0.6 1.0 0.2D1 1FT 2/16/00 7.75 5.00E+00 0.5 0.0 0.7 1.1 0.2 116D1 1FT 3/15/00 6.97 1.00E+02 0.3 0.1 1.0 1.3 0.0 120D1 1FT 11/28/00 6.77 1.00E+02 55D1 1FT 12/12/00 7.21 2.00E+01 0.8 0.0 16.8 17.6 3.5 407D1 1FT 12/26/00 7.46 5.00E+00 0.0 414D1 1FT 1/9/01 6.81 5.00E+00 0.4 0.0 0.2 0.7 0.6 64D1 1FT 1/23/01 6.92 5.00E+00 0.6 0.1 0.3 1.0 0.2 72D1 1FT 4/10/01 6.63 5.00E+00 0.3 0.0 0.4 0.6 0.0 41D1 1FT 4/24/01 6.78 5.00E+00 84D1 1FT 5/22/01 6.88 3.90E+02 0.7 0.5 10.7 12.0 3.4 375
D1 2FT
Location Date pHFC
#/100 mlDON(mg/l)
NH4
(mg/l)NOx
(mg/l)
TotalNitrogen
(mg/l)PO4
(mg/l)TDP
(mg/l)
SpCond(uS)
D1 2FT 6/14/00 7.96 5.00E+00 2.1 0.0 0.1 2.2 0.0 767D1 2FT 2/6/01 7.29 5.00E+00 3.0 0.0 15.0 17.9 3.3 3.4 441D1 2FT 2/20/01 7.27 5.00E+00 1.9 0.0 14.9 16.8 3.2 409D1 2FT 4/10/01 6.89 1.10E+02 0.3 0.3 3.4 3.6 421D1 2FT 4/24/01 6.98 2.00E+01 480D1 2FT 5/8/01 6.77 2.80E+02 419D1 2FT 5/22/01 7.27 3.00E+01 0.1 0.0 11.4 11.5 4.2 4.3 404
D1 5FT
Location Date pHFC
#/100 mlDON(mg/l)
NH4
(mg/l)NOx
(mg/l)
TotalNitrogen
(mg/l)PO4
(mg/l)TDP
(mg/l)
SpCond(uS)
D1 5FT 2/2/00 5.00E+00 0.0 0.8 0.8 0.1D1 5FT 2/16/00 5.00E+00 3.4 0.1 2.2 5.7 0.2D1 5FT 1/23/01 7.01 5.00E+00 0.2 20.0 20.2 3.2 432D1 5FT 2/20/01 5.00E+00 D1 5FT 4/10/01 6.71 5.00E+00 1.2 0.5 10.1 11.8 3.6 3.8 360D1 5FT 4/24/01 6.98 5.00E+00 397D1 5FT 5/8/01 7.01 5.00E+00 422D1 5FT 5/22/01 7.20 1.00E+01 0.0 0.0 12.4 12.5 4.1 4.2 395
D2 1FT
Location Date pHFC
#/100 mlDON(mg/l)
NH4
(mg/l)NOx
(mg/l)
TotalNitrogen
(mg/l)PO4
(mg/l)TDP
(mg/l)
SpCond(uS)
D2 1FT 10/13/99 6.91 0.4 0.0 16.6 17.0 4.0D2 1FT 2/2/00 5.00E+00 0.0 3.0 3.0 0.1D2 1FT 6/14/00 7.66 3.70E+02 0.0 1.1 6.5 7.6 4.4 4.5 394D2 1FT 6/28/00 6.77 2.90E+02 0.3 0.1 19.0 19.4 5.3 5.3 469D2 1FT 7/12/00 6.58 1.00E+01 0.6 0.6 17.9 19.2 5.5 5.6 476D2 1FT 8/9/00 7.21 2.00E+03 7.5 0.0 7.5 15.0 3.7 3.8 537D2 1FT 8/23/00 7.08 2.00E+03 0.3 0.0 14.4 14.7 3.9 4.1 506D2 1FT 9/6/00 7.27 4.00E+02 0.1 0.0 14.4 14.5 3.7 3.8 492D2 1FT 10/3/00 7.37 1.50E+03 0.0 0.0 13.2 13.3 3.4 3.6 465D2 1FT 1/23/01 7.33 1.00E+03 0.2 0.0 7.9 8.1 1.8 369D2 1FT 2/20/01 5.00E+02 D2 1FT 3/13/01 5.00E+01

D2 1FT
Location Date pHFC
#/100 mlDON(mg/l)
NH4
(mg/l)NOx
(mg/l)
TotalNitrogen
(mg/l)PO4
(mg/l)TDP
(mg/l)
SpCond(uS)
D2 1FT 3/27/01 6.81 1.30E+02 16.5 0.2 5.4 22.2 3.2 335D2 1FT 4/10/01 6.33 5.00E+00 3.8 0.1 15.1 18.9 3.6 360D2 1FT 4/24/01 7.06 3.10E+02 0.8 0.0 9.7 10.6 3.8 416D2 1FT 5/8/01 7.05 8.00E+01 0.8 0.0 7.0 7.8 4.7 412D2 1FT 5/22/01 6.28 3.30E+02 0.4 0.8 23.9 25.1 4.7 453D2 1FT 6/5/01 5.35 6.65E+03 0.7 1.7 30.9 33.2 3.7 523D2 1FT 6/19/01 4.76 4.00E+02 1.2 0.9 19.4 21.6 3.9 448D2 1FT 7/2/01 5.30 5.00E+01 2.0 1.8 33.2 37.0 3.9 464D2 1FT 7/31/01 4.97 9.00E+02 7.6 1.2 17.0 25.8 4.6 410D2 1FT 9/11/01 5.00E+01
D2 2FT
Location Date pHFC
#/100 mlDON(mg/l)
NH4
(mg/l)NOx
(mg/l)
TotalNitrogen
(mg/l)PO4
(mg/l)TDP
(mg/l)
SpCond(uS)
D2 2FT 1/9/01 6.96 3.21E+04 0.7 9.7 10.4 3.9 4.0 580D2 2FT 1/23/01 6.57 5.00E+02 20.0 0.7 16.3 37.0 3.9 4.2 548D2 2FT 2/6/01 6.67 1.30E+03 4.7 10.9 18.0 33.6 4.2 4.2 519D2 2FT 2/20/01 6.41 6.00E+02 4.1 7.9 23.7 35.8 5.7 6.0 539D2 2FT 3/13/01 6.54 1.20E+03 1.3 5.0 14.1 20.4 3.5 3.7 493D2 2FT 3/27/01 5.86 2.00E+02 23.0 1.1 7.7 31.8 4.2 4.4 369D2 2FT 4/10/01 5.82 2.00E+02 2.9 0.0 26.5 29.4 3.8 4.0 458D2 2FT 4/24/01 5.72 3.00E+01 0.1 0.1 33.5 33.7 4.2 5.0 499D2 2FT 5/8/01 6.76 5.00E+01 1.7 0.0 11.8 13.5 5.2 5.2 428D2 2FT 5/22/01 5.96 1.40E+03 2.3 8.7 35.6 46.5 5.2 5.2 559D2 2FT 6/5/01 6.17 2.81E+04 1.8 12.9 23.2 37.9 4.4 5.0 554D2 2FT 6/19/01 5.60 2.60E+03 4.7 7.8 33.9 46.4 4.2 547D2 2FT 7/2/01 5.24 3.02E+04 0.4 4.3 43.3 48.0 4.5 5.0 544D2 2FT 7/17/01 5.73 8.70E+03 0.2 4.8 53.5 58.5 4.8 5.2 618D2 2FT 7/31/01 5.50 1.10E+03 0.9 0.6 36.1 37.6 4.5 4.8 469D2 2FT 8/14/01 6.04 1.54E+04 0.2 3.8 30.6 34.6 4.1 4.2 564D2 2FT 8/28/01 6.01 7.90E+03 9.1 3.1 23.2 35.3 3.7 4.0 487D2 2FT 9/11/01 5.99 9.00E+02 0.9 1.4 26.7 29.0 3.9 3.9 480D2 2FT 9/25/01 5.57 6.00E+02 0.9 0.1 31.2 32.1 4.2 4.2 474D2 2FT 10/9/01 6.05 2.00E+02 2.2 0.0 30.8 33.0 4.2 4.2 435
D2 5FT
Location Date pHFC
#/100 mlDON(mg/l)
NH4
(mg/l)NOx
(mg/l)
TotalNitrogen
(mg/l)PO4
(mg/l)TDP
(mg/l)
SpCond(uS)
D2 5FT 6/14/00 7.37 1.00E+01 0.8 0.0 5.3 6.2 2.4 2.6 401D2 5FT 7/12/00 6.83 2.2 0.0 14.2 16.4 5.1 5.2 427D2 5FT 7/26/00 5.00E+00 0.0 493D2 5FT 8/9/00 7.18 2.10E+02 0.5 0.0 14.3 14.8 3.4 3.6 498D2 5FT 1/9/01 7.07 3.13E+03 1.2 6.9 10.8 19.0 3.6 3.6 508D2 5FT 1/23/01 7.12 3.00E+02 9.0 9.1 18.1 3.1 393D2 5FT 2/6/01 7.07 5.00E+01 440
Performance Results – MicroFAST® Page 22 of 25

D2 5FT
Location Date pHFC
#/100 mlDON(mg/l)
NH4
(mg/l)NOx
(mg/l)
TotalNitrogen
(mg/l)PO4
(mg/l)TDP
(mg/l)
SpCond(uS)
D2 5FT 2/20/01 6.80 5.00E+01 1.9 3.9 19.0 24.7 3.6 3.8 476D2 5FT 3/13/01 6.41 4.70E+02 1.9 0.0 18.4 20.4 3.4 3.5 462D2 5FT 3/27/01 6.07 2.10E+02 22.1 0.0 6.6 28.8 3.5 3.7 367D2 5FT 4/10/01 5.99 1.00E+01 5.0 0.2 20.1 25.3 3.4 3.5 426D2 5FT 4/24/01 6.29 5.00E+00 0.0 0.0 23.5 23.5 3.4 413D2 5FT 5/8/01 6.29 1.00E+01 1.4 0.0 13.6 14.9 4.9 5.0 399D2 5FT 5/22/01 6.05 1.60E+03 0.4 0.5 30.5 31.4 4.5 4.5 509D2 5FT 6/5/01 5.56 7.10E+03 7.8 1.0 37.3 46.1 3.3 486D2 5FT 6/19/01 4.73 3.00E+03 2.7 1.5 13.1 17.4 3.2 470D2 5FT 7/2/01 4.93 2.00E+02 1.7 0.1 46.1 48.0 2.1 2.4 533D2 5FT 7/17/01 4.81 5.00E+01 0.3 0.2 37.1 37.6 3.6 3.9 497D2 5FT 7/31/01 4.75 5.00E+01 1.5 0.2 32.4 34.1 3.9 4.3 432D2 5FT 8/14/01 5.48 1.00E+03 0.5 0.1 30.9 31.5 3.7 3.8 506D2 5FT 8/28/01 5.62 6.00E+02 2.0 0.0 29.4 31.4 3.9 4.0 432D2 5FT 9/11/01 5.90 6.00E+02 0.5 0.0 26.5 27.0 3.8 4.0 421D2 5FT 9/25/01 5.77 5.00E+01 0.8 0.0 26.0 26.8 4.1 4.2 437D2 5FT 10/9/01 6.29 3.30E+02 1.5 0.0 20.6 22.2 4.1 4.1 393
D3 1FT
Location Date pHFC
#/100 mlDON(mg/l)
NH4
(mg/l)NOx
(mg/l)
TotalNitrogen
(mg/l)PO4
(mg/l)TDP
(mg/l)
SpCond(uS)
D3 1FT 8/30/99 7.13 2.00E+02 0.1 0.0 14.1 14.3 4.2 429D3 1FT 9/22/99 7.08 0.1 0.4 13.7 14.2 3.8D3 1FT 10/13/99 5.00E+02 D3 1FT 11/3/99 5.00E+02 D3 1FT 11/18/99 6.93 6.00E+02 0.8 0.0 14.8 15.6 3.9 462D3 1FT 12/21/99 6.89 4.10E+03 0.4 0.0 14.9 15.2 3.8 393D3 1FT 1/12/00 6.76 2.30E+03 0.0 0.0 17.5 17.5 4.3 464D3 1FT 2/2/00 6.74 4.30E+02 1.4 0.0 18.6 20.0 3.4 458D3 1FT 2/16/00 7.01 4.60E+02 1.2 0.7 18.4 20.4 4.1 521D3 1FT 3/1/00 6.55 2.10E+02 1.2 1.3 16.3 18.8 4.0 572D3 1FT 3/15/00 6.47 5.00E+01 0.0 0.2 15.7 15.9 3.9 435D3 1FT 3/28/00 6.84 1.00E+01 0.1 0.0 15.3 15.4 3.4 497D3 1FT 4/11/00 6.99 5.00E+00 0.1 0.0 10.5 10.6 3.7 452D3 1FT 5/2/00 4.40E+02 1.2 0.0 4.4 5.6 4.8D3 1FT 5/31/00 6.75 3.00E+01 2.0 1.3 21.6 24.9 5.4 5.7 480D3 1FT 6/14/00 7.18 5.00E+01 0.2 0.0 7.1 7.3 4.5 4.6 444D3 1FT 6/28/00 3.00E+01 D3 1FT 11/14/00 7.12 3.80E+03 0.9 0.0 11.0 11.9 3.1 338D3 1FT 11/28/00 7.27 5.00E+01 0.2 0.0 13.4 13.5 3.2 362D3 1FT 12/12/00 5.00E+00
Performance Results – MicroFAST® Page 23 of 25

D3 2FT
Location Date pHFC
#/100 mlDON(mg/l)
NH4
(mg/l)NOx
(mg/l)
TotalNitrogen
(mg/l)PO4
(mg/l)TDP
(mg/l)
SpCond(uS)
D3 2FT 1/23/01 6.71 1.00E+02 1.3 20.1 21.4 3.7 4.1 456D3 2FT 2/6/01 6.79 7.00E+02 3.3 0.0 14.7 18.0 3.6 3.7 423D3 2FT 2/20/01 6.96 3.60E+03 0.0 0.0 16.8 16.9 3.7 3.8 445D3 2FT 3/13/01 6.84 1.30E+03 1.4 7.8 12.6 21.7 3.9 3.9 511D3 2FT 3/27/01 6.59 1.00E+02 14.9 2.8 4.7 22.4 4.1 4.2 360D3 2FT 4/10/01 6.79 8.00E+01 4.6 0.0 9.5 14.1 3.9 4.0 383D3 2FT 4/24/01 7.14 4.50E+02 0.2 0.0 9.6 9.8 3.6 4.1 422D3 2FT 5/8/01 6.27 3.60E+03 0.1 0.0 11.0 11.1 4.5 4.5 507D3 2FT 5/22/01 5.93 1.80E+04 2.0 0.7 22.3 25.0 4.5 4.7 477
D3 5FT
Location Date pHFC
#/100 mlDON(mg/l)
NH4
(mg/l)NOx
(mg/l)
TotalNitrogen
(mg/l)PO4
(mg/l)TDP
(mg/l)
SpCond(uS)
D3 5FT 1/12/00 7.00 4.00E+01 0.4 0.0 17.1 17.5 4.2 460D3 5FT 2/2/00 7.03 5.00E+00 0.0 0.0 18.0 18.1 3.6 476D3 5FT 2/16/00 7.16 5.00E+00 0.7 0.5 16.4 17.6 3.9 511D3 5FT 3/1/00 6.82 5.00E+00 0.4 1.1 15.7 17.2 3.8 572D3 5FT 3/28/00 6.95 5.00E+00 0.1 0.0 14.4 14.5 3.4 488D3 5FT 4/11/00 7.21 5.00E+00 0.7 0.0 8.8 9.5 3.9 435D3 5FT 5/17/00 6.68 1.00E+01 0.8 0.1 21.7 22.6 4.3 4.5 508D3 5FT 5/31/00 6.66 5.00E+00 0.0 0.0 21.3 21.3 5.0 5.7 458D3 5FT 6/14/00 7.31 2.00E+01 0.5 0.0 8.0 8.5 4.7 430D3 5FT 6/28/00 6.98 2.20E+02 0.2 0.0 14.6 14.8 4.8 4.8 463D3 5FT 7/12/00 6.59 6.00E+01 1.7 0.0 23.8 25.6 6.0 6.2 486D3 5FT 7/26/00 6.46 1.00E+01 1.6 0.0 21.8 23.3 5.9 6.0 492D3 5FT 4/10/01 5.00E+00 D3 5FT 4/24/01 7.03 5.00E+00 503
D SUMP
Location Date pHFC
#/100 mlDON(mg/l)
NH4
(mg/l)NOx
(mg/l)
TotalNitrogen
(mg/l)PO4
(mg/l)TDP
(mg/l)
SpCond(uS)
D SU 9/22/99 6.86 5.00E+00 0.7 0.0 14.2 14.9 1.9 391D SU 10/13/99 6.79 0.1 0.0 13.9 14.0 2.6D SU 11/3/99 6.98 5.00E+00 0.6 0.0 12.4 13.0 2.0D SU 11/18/99 6.96 5.00E+00 0.0 12.2 12.2 2.4D SU 12/21/99 6.94 5.00E+00 0.3 0.0 10.2 10.6 2.0 298D SU 1/12/00 6.79 5.00E+00 1.5 0.0 10.3 11.8 2.3 326D SU 2/2/00 7.02 4.10E+02 0.7 0.1 13.1 13.9 2.8 465D SU 2/16/00 7.28 5.10E+02 0.1 9.0 9.2 18.3 3.2 483D SU 3/1/00 6.37 1.00E+01 0.1 0.4 13.3 13.7 2.4 438D SU 3/15/00 6.31 5.10E+02 0.5 0.0 13.6 14.1 2.8 395D SU 3/28/00 6.61 5.00E+00 0.2 0.0 7.4 7.7 1.6 281D SU 4/11/00 6.98 5.00E+00 0.8 0.0 9.1 9.9 2.6 406D SU 5/2/00 7.02 5.00E+00 0.5 0.0 6.6 7.1 2.3 329D SU 5/17/00 6.97 5.00E+00 0.0 0.0 10.1 10.1 2.6 2.7 380D SU 5/31/00 6.91 5.00E+00 0.2 0.0 13.3 13.5 3.4 3.5 401
Performance Results – MicroFAST® Page 24 of 25

D SUMP
Location Date pHFC
#/100 mlDON(mg/l)
NH4
(mg/l)NOx
(mg/l)
TotalNitrogen
(mg/l)PO4
(mg/l)TDP
(mg/l)
SpCond(uS)
D SU 6/14/00 6.99 9.00E+01 0.0 0.0 3.1 397D SU 6/28/00 6.64 0.00E+00 0.4 0.0 10.7 11.1 2.6 2.6 440D SU 7/12/00 6.80 4.70E+02 2.2 0.0 14.4 16.6 3.4 3.6 426D SU 7/26/00 6.67 3.00E+01 2.3 0.0 17.4 19.7 3.0 3.0 482D SU 8/9/00 6.79 1.00E+01 0.2 0.0 16.2 16.4 2.4 3.0 468D SU 8/23/00 6.83 5.00E+00 2.6 0.0 13.7 16.2 2.5 2.8 431D SU 9/6/00 7.09 5.00E+00 0.9 0.0 13.4 14.3 2.9 3.0 442D SU 9/20/00 7.01 1.00E+01 0.6 0.0 14.6 15.2 2.9 436D SU 10/3/00 7.08 1.00E+01 0.5 0.0 13.7 14.1 2.9 3.0 438D SU 10/17/00 7.07 2.10E+01 0.4 0.0 13.1 13.5 2.7 415D SU 10/30/00 7.07 4.00E+01 0.3 0.0 14.2 14.5 2.9 3.0 400D SU 11/14/00 7.02 1.00E+01 0.4 0.0 11.6 12.1 2.3 3.0 336D SU 11/28/00 7.05 5.00E+00 0.0 0.0 11.1 11.1 2.2 2.8 334D SU 12/12/00 6.96 5.00E+00 0.6 0.0 15.4 16.0 2.9 3.0 405D SU 12/26/00 6.95 5.00E+00 1.6 0.0 14.6 16.2 2.8 2.9 378D SU 1/9/01 6.56 7.10E+02 0.2 0.0 17.9 18.1 2.7 2.7 434D SU 1/23/01 6.14 2.00E+01 11.1 0.9 11.1 23.1 2.9 3.1 414D SU 2/6/01 6.33 1.00E+01 0.2 0.2 22.1 22.4 2.5 2.5 360D SU 2/20/01 6.51 7.00E+01 1.2 0.0 17.1 18.3 3.0 3.0 422D SU 3/13/01 6.55 5.00E+00 4.5 0.0 9.2 13.7 2.6 2.7 380D SU 3/27/01 6.43 5.00E+00 0.7 0.0 16.2 17.0 2.3 2.4 258D SU 4/10/01 6.42 2.00E+00 0.0 7.1 7.1 2.3 2.4 306D SU 4/24/01 6.69 1.00E+00 1.6 0.0 9.8 11.4 2.5 2.7 348D SU 5/8/01 6.32 6.80E+01 1.1 0.0 14.0 15.0 3.8 3.9 417D SU 5/22/01 6.24 8.20E+01 3.4 0.0 11.8 15.2 3.4 3.6 466D SU 6/5/01 5.93 7.20E+01 1.7 0.0 20.0 21.8 2.8 3.2 453D SU 7/2/01 5.84 2.00E+02 6.0 0.1 22.5 28.6 1.9 2.2 447D SU 7/17/01 5.87 5.00E+00 8.5 0.0 22.3 30.8 2.2 2.2 436D SU 7/31/01 5.87 5.00E+00 7.5 0.1 20.7 28.2 2.4 2.4 393D SU 8/14/01 5.83 5.00E+00 0.8 0.0 25.4 26.2 2.4 2.5 444D SU 8/28/01 5.76 1.00E+01 9.0 0.0 13.2 22.3 2.5 2.5 359D SU 9/11/01 5.75 5.00E+00 0.3 0.0 22.7 23.1 2.8 2.9 373D SU 9/25/01 5.71 5.00E+00 5.3 0.0 16.5 21.8 2.9 2.9 387D SU 10/9/01 5.94 5.00E+00 0.5 0.0 20.9 21.5 3.8 3.8 361
Performance Results – MicroFAST® Page 25 of 25