
US EPA Assigning Values to Non-Detected/Non-Quantified Pesticide Residues in Human ... · ·...
34
Transcript of US EPA Assigning Values to Non-Detected/Non-Quantified Pesticide Residues in Human ... · ·...


Fax-On-DemandFax Number: (202) 401-0527Item: 6047
ASSIGNING VALUES TO NON-DETECTED/NON-QUANTIFIED
PESTICIDE RESIDUES IN HUMANHEALTH FOOD EXPOSURE
ASSESSMENTS
Office of Pesticide ProgramsU.S. Environmental Protection Agency
Washington, DC 20460
March 23, 2000
List of Acronyms
ARs Anticipated Residues
CFR Code of Federal Regulations
FDA Food and Drug Administration
FQPA Food Quality Protection Act
FR Federal Register
IR-4 Interregional Project #4
HED Health Effects Division
LLMV Lower Limit of Method Validation
LOD Limit of Detection
LOQ Limit of Quantitation
MAFF Ministry of Agriculture, Fisheries, and Food
MLE Maximum Likelihood Estimation
NDs Nondetects
OPP Office of Pesticide Programs
OPPTS Office of Prevention, Pesticides, and Toxic Substances
PDP Pesticide Data Program
PHIs Preharvest Intervals
RDF Residue Distribution File
SRD Successive Random Dilutions
USDA United States Department of Agriculture
Table of Contents
EXECUTIVE SUMMARY . . . . . . . . . . . . . . . . . . . . . . . . . . . . . . . . . . . . . . . . . . . . . . . . . . . 4
I. Introduction . . . . . . . . . . . . . . . . . . . . . . . . . . . . . . . . . . . . . . . . . . . . . . . . . . . . . . . . . . . . 6
II. Assigning Values to Non-Detected/Non-Quantified Pesticide Residues . . . . . . . . . . . . . 8A. Definitions . . . . . . . . . . . . . . . . . . . . . . . . . . . . . . . . . . . . . . . . . . . . . . . 8
Limit of Detection (LOD) . . . . . . . . . . . . . . . . . . . . . . . . . . . . . . . . . . . 8Limit of Quantitation (LOQ) . . . . . . . . . . . . . . . . . . . . . . . . . . . . . . . . 8Lower Limit of Method Validation (LLMV). . . . . . . . . . . . . . . . . . . . 8
B. Refining Anticipated Residue Estimates Using ½ LOD or ½ LOQ forNon-detected Residues . . . . . . . . . . . . . . . . . . . . . . . . . . . . . . . . . . . . . 9(1) Policy for NDs When a LOD Has Been Properly Determined. . . . . . . . . . . . . . . . . . . . . . . . . . . . . . . . . . . . . . . . . . . . . . . . . . . . . . . 11
(2) Policy for NDs When Only An LOQ Has Been ProperlyDetermined. . . . . . . . . . . . . . . . . . . . . . . . . . . . . . . . . . . . . . . . . . . . . . . . . . . . . . . 12
(3) Policy When Neither a LOD Nor LOQ Has Been ProperlyDetermined . . . . . . . . . . . . . . . . . . . . . . . . . . . . . . . . . . . . . . . . . . . . . 12
C. Sensitivity Analysis . . . . . . . . . . . . . . . . . . . . . . . . . . . . . . . . . . . . . . 13D. Use of Percent of Crop Treated . . . . . . . . . . . . . . . . . . . . . . . . . . . . . 13E. Considerations Related to Pesticides Having Analytes of Concern
. . . . . . . . . . . . . . . . . . . . . . . . . . . . . . . . . . . . . . . . . . . . . . . . . . . . . . . 14F. Essentially Zero Residues : Use of Zero (or Near Zero) Residue
Concentrations in Risk Assessments . . . . . . . . . . . . . . . . . . . . . . . . . 15
III. A Statistical Method for Incorporating Non-Detected Pesticide Residues . . . . . . . 16A. Cohen’s Method . . . . . . . . . . . . . . . . . . . . . . . . . . . . . . . . . . . . . . . . . 17B. Estimation of Specific Values That Lie Below the Detection Limit
. . . . . . . . . . . . . . . . . . . . . . . . . . . . . . . . . . . . . . . . . . . . . . . . . . . . . . . 20
IV. References . . . . . . . . . . . . . . . . . . . . . . . . . . . . . . . . . . . . . . . . . . . . . . . . . . . . . . . . . . . . 24
Appendix . . . . . . . . . . . . . . . . . . . . . . . . . . . . . . . . . . . . . . . . . . . . . . . . . . . . . . . . . . . . . . . A-1
4
ASSIGNING VALUES TO NON-DETECTED/NON-QUANTIFIEDPESTICIDE RESIDUES
EXECUTIVE SUMMARY
Residue data are used by the EPA’s Office of Pesticide Programs (OPP) to support theestablishment or reassessment of a pesticide tolerance associated with a particular food use. Insome cases, a portion of the measurements of the levels of pesticide residue present on foodshows no detection of residues. These “nondetects” (NDs) do not necessarily mean that thepesticide is not present at any level, but simply that any amount of pesticide present is below thelevel that could be detected or reliably quantified using a particular analytical method.
The primary science policy issue concerning NDs is what value the OPP should assign tothem when estimating exposure and risk from a pesticide in food. The reason this is an importantissue stems from the new requirements that the Food Quality Protection Act of 1996 (FQPA)impose on EPA. Among other things, FQPA established a stringent health-based standard ("areasonable certainty of no harm") for pesticide residues in foods to assure protection of the publichealth, including sensitive populations such as infants and children, from unacceptable pesticideexposure and risks. OPP’s goal is to make exposure and risk assessments as accurate and realisticas possible while not underestimating exposure or risk, so that all humans, including infants andchildren, are fully protected. The specific issues addressed in this paper concern the values theAgency should assign to NDs in order to meet this goal.
In general, the Office of Pesticide Programs recommends use of a default value of ½ theLimit of Detection (LOD) or ½ the Limit of Quantitation (LOQ) for commodities which havebeen treated but for which no detectable residues are measured. This paper also describes OPP’spolicy of performing a “sensitivity analysis” to determine the impact of using differentassumptions (e.g., assuming NDs = full LOD or full LOQ vs NDs = zero), on the OPP’s riskassessment for the pesticide under evaluation. If it is demonstrated through the sensitivity analysisthat the default assumptions have no effect on the final OPP risk decision, then there is littlereason for OPP to attempt to further refine these default assignments.
If OPP finds that these default assignments do have a significant effect on the risk estimateor risk decision or decides that a more refined risk estimate is needed, a second, more accurate setof statistical methods can be used instead to determine the values or distribution of values forNDs. These statistical methods provide a more accurate way of estimating food exposure andrisk than assuming that, for NDs, exposure occurs at ½ LOD or some other single, finite value
5
and allowing risk assessors to impute a series of values which represent concentrations below thestated detection limit. These methods would generally be used only in situations where the NDscomprise a significant (but less than half) portion of the data set and the rest of the data arenormally or lognormally distributed, but exceptions can be considered on a case-by-case basis.
This document was developed from two previous versions entitled Assigning Values ToNondetected/Nonquantified Pesticide Residues into Human Health Dietary ExposureAssessments and A Statistical Method for Incorporating Nondetected Pesticide Residues intoHuman Health Dietary Exposure Assessments that were released for public comment inDecember of 1998 (63 FR 67063-67066 ). The Agency received comments from variousorganizations. Each of the commenters offered recommendations for improving the sciencepolicy. All comments were extensively evaluated and considered by the Agency. This revisedversion embodies many of the sentiments and recommendations of the commenters. The publiccomments, as well as a detailed summary of the Agency’s response to the comments are beingmade available in the Federal Register.
This document was drafted for the purpose of providing non-binding guidance tointerested stakeholders regarding the evaluation of non-detects in pesticide risk assessments. Itcontains OPP’s view concerning a reasonable way of addressing this issue. Although OPP willconsider this guidance in evaluating risk assessments, this guidance does not bind OPPdecisionmakers. Stakeholders remain free to comment on the application of the policy toindividual pesticides or on the appropriateness of the policy itself. OPP will carefully take intoaccount all comments that are received.
6
I. Introduction
Pesticide manufacturers (i.e., registrants) who petition EPA to establish a tolerance arerequired to submit data on the level of pesticide residues that remain in or on food. Data on thelevels of pesticide residues in food are also available from a number of other sources. Often,instrumentation in the laboratory is not able to detect any residue below the limit of detection(LOD). However, even though the laboratory instrumentation cannot detect a residue, a residuemay be present at some level below the LOD, and may still present a potential concern to humanhealth. This paper describes the OPP’s policy for assigning values for use in human healthexposure and risk assessment to non-detected/non-quantified pesticide residues in food. Ingeneral, and as described more fully later in the document, EPA recommends use of a value of ½the analytical Limit of Detection (LOD), ½ the Limit of Quantitation (LOQ), the (full) LowerLimit of Method Validation (LLMV), or true zero for these non-detected residues.
This document was developed from two previous versions entitled Assigning Values ToNondetected/Nonquantified Pesticide Residues into Human Health Dietary ExposureAssessments and A Statistical Method for Incorporating Nondetected Pesticide Residues intoHuman Health Dietary Exposure Assessments that were released for public comment inDecember of 1998 (63 FR 67063-67066). The Agency received comments from variousorganizations. Each of the commenters offered recommendations for improving the sciencepolicy. All comments were extensively evaluated and considered by the Agency. This revisedversion embodies many of the sentiments and recommendations of the commenters. The publiccomments, as well as a detailed summary of the Agency’s response to the comments are beingmade available in the Federal Register.
One issue that arises from use of the aforementioned default assumptions of ½ LOD, ½LOQ, etc. is whether the Agency’s method for assigning finite values to non-detects (NDs) in itsrisk assessments may either overestimate or underestimate risk depending on the actualdistribution of data below the LOD. Specifically, the question arises as to whether OPP’s defaultassumptions regarding the residue values to associate with non-detected or non-quantifiableresidues are a significant factor in controlling the risk decision per se.
Should there be concern about the effect of OPP’s default procedure of assigning one-halfthe limit of detection/quantification values to treated commodities with non-detected residues onthe risk estimate or risk decision, this paper also describes OPP’s policy of performing a“sensitivity analysis” to determine the impact of different assumptions (e.g., assuming NDs =LOQ or NDs = zero) on the Agency’s risk assessment for the pesticide under evaluation. If it isdemonstrated through the sensitivity analysis that the risk estimate or final risk decision isunaffected by the default assumptions, OPP will conclude that the relevant risk estimate issufficiently “robust” so as not to warrant a more refined estimate of exposure and risk.
In those instances in which the default assignment is critical or decisive in determining

7
OPP risk management action or it is simply desired that a more refined risk and exposure estimatewhich relies to a lesser extent on default assumptions be developed, one of a series of moreaccurate statistical methods can be used to estimate the values or distribution of values associatedwith the ND values. Such statistical methods provide a more accurate way of estimatingexposure and risk from pesticides in food than assuming that exposure through the ND’s occursat ½ LOD or some other single, finite concentration. These methods are fully described in EPA’sGuidance for Data Quality Assessment: Practical Methods for Data Analysis originally issued inJuly, 1996 (EPA/600/R-96-084), which has been peer reviewed by EPA program offices, regionaloffices, and laboratories (US EPA 1998a. In general, these methods would be used only insituations where the NDs compromise less than half the data set and the rest of the data arenormally or lognormally distributed, but exceptions will be considered on a case-by-case basis. Itis expected that many of the ND values obtained from this method would be less than ½ the LODor LOQ but greater than zero.
The policy for assigning values to non-detectable residues is intended to avoidunderestimating exposure to potentially sensitive or highly exposed groups such as infants andchildren while attempting to approximate actual residue concentrations as closely as possible. Both biological information and empirical residue measurements support EPA’s belief that thesescience policies are consistent with these goals.
The policy paper is divided into several sections. Section I is this introduction. Section II,entitled “Assigning Values to Non-Detected/Non-Quantified Pesticide Residues,” provides therationale for assigning ½ LOD or ½ LOQ to commodities that have been treated with a pesticide,but that show no analytically detectable residues for any or all commodities sampled. The thirdsection, entitled “A Statistical Method for Incorporating Non-detected Pesticide Residues,”provides a more accurate, statistically-based method for estimating non-detected pesticideresidues than simply assigning a default value of ½ LOD or ½ LOQ to these ND’s. Section IVprovides a list of references. The Appendix to this document is a sample calculation illustratingone (of many available) methods for calculating LOD or LOQ.
This science policy applies at this time only to exposure to pesticide residues via the foodsupply and, more specifically, only to the refinement of pesticide exposure from food bycalculation of Anticipated Residues (ARs), a risk assessment refinement tool. This policy is notappropriate for, and is not to be used in, the determination of the actual residue level which willbe established as the “tolerance” (maximum acceptable residue level) for a pesticide in a particularcommodity.
This document was drafted for the purpose of providing non-binding guidance tointerested stakeholders regarding the evaluation of non-detects in pesticide risk assessments. Itcontains OPP’s view concerning a reasonable way of addressing this issue. Although OPP willconsider this guidance in evaluating risk assessments, this guidance does not bind OPPdecisionmakers. Stakeholders remain free to comment on the application of the policy toindividual pesticides or on the appropriateness of the policy itself. OPP will carefully take into

8
account all comments that are received.
II. Assigning Values to Non-Detected/Non-Quantified Pesticide Residues
A. Definitions
In the discussion of which values to assign to non-detected and/or nonquantified residues,it is important that consistent definitions be employed for the various terms being used to describethese concepts. Over the years, a variety of different practices have arisen due to definitionaldifferences between LOD and LOQ, a lack of distinction between the two, preference for oneover the other, the proliferation of several synonymous terms such as “limit of determination” or“limit of sensitivity,” and the fact that there are situations in which one is, indeed, moreappropriate to use than the other. In many cases, a sample is reported to contain nondetectableresidues when, upon further investigation, the proper designation should have been“nonquantifiable,” or vice versa. In a number of instances, OPP has noted in residue chemistrysubmissions that these terms have been inappropriately used, used interchangeably, or usedwithout supporting documentation and/or information concerning their derivation. In OPP’spolicy, these terms will have the definitions provided below:
Limit of Detection (LOD). LOD is defined as the lowest concentration that can bedetermined to be statistically different from a blank. This concentration is recommendedto be three standard deviations above the measured average difference between the sampleand blank signals which corresponds to the 99% confidence level. In practice, detectionof an analyte by an instrument is often based on the extent to which the analyte signalexceeds peak-to-peak noise (Keith et al., 1983). Samples that do not bear residues at orabove the LOD are referred to as “non-detects” (NDs).
Additional, related concepts are the Method Detection Limit (MDL) which refers to thelowest concentration which can be reliably detected in either a sample or a blank and theInstrument Detection Limit (IDL) which refers to the smallest signal above backgroundnoise than an instrument can reliably detect.
Limit of Quantitation (LOQ). LOQ is defined as the level above which quantitativeresults may be obtained. The corresponding sample/blank difference is recommended tobe 10 standard deviations above the blank which corresponds to the 99% confidence level(Keith et al., 1983) and to an uncertainty of ±30% in the measured value at the LOQ. LOQ is typically used to define the lower limit of the useful range of the measurementtechnology in use. Samples that do not bear residues at or above the LOQ are oftenreferred to as “nonquantifiable.”
Lower Limit of Method Validation (LLMV). There are cases in which a laboratory

9
does not stringently determine the LOD and LOQ of a particular substrate/method/equipment combination but, rather, a “Lower Limit of Method Validation” (LLMV) isreported that could be higher than the true LOQ within the capability of the method. TheLLMV is simply the lowest concentration at which the method was validated. In thesecases, neither the method limit of first choice (LOD) nor second choice (LOQ) wasdemonstrated and OPP would normally request that an LOQ be estimated by the studysponsor from the LLMV, chromatograms, and other available information. In general,OPP discourages the determination and use of the LLMV if a consequence of this is that alegitimate LOD or LOQ cannot or will not be determined.
To date, OPP has not issued formal guidance or suggested/recommended procedures, ormade available a list of acceptable methodologies for the estimation of LOD and/or LOQ valuesfor pesticide residue analyses. Due in part to the many valid operational definitions of LOD andLOQ and procedures used to estimate these, OPP believes it unwise to prescribe any one specificprocedure or protocol as a standard universal requirement for pesticide registration submissions.Nevertheless, in the interest of informing registrants and other data submitters of at least onemethod for LOD/LOQ determination which has been acceptable in the past, an Appendix to thisScience Policy document which illustrates this method is attached. This is a slightly modifiedform of a procedure used by USDA’s IR-4 program and is published, in part, in 40 CFR (as 40CFR Part 136, Appendix B).
Any reasonable generally recognized statistical procedure may be considered and will beevaluated. It is recommended that registrants and other data submitters fully document theprocedures and protocols used to estimate the LOD and/or LOQ for review by OPP.
B. Refining Anticipated Residue Estimates Using ½ LOD or ½ LOQ for Non-detected Residues
Pesticide food risk assessments are initially conducted using conservative assumptionssuch as tolerance-level residues in crops, maximum theoretical livestock diets, highest field trialresidue values, and 100% of the crop being treated. Worst-case assessments using suchassumptions may result in an apparently unacceptable acute and/or chronic food risk. In suchcases, refinement of food exposure assessments to derive more realistic estimates is oftenwarranted. To further refine food exposure, calculations may include use of percent-crop-treateddata, more realistic livestock diets, averages of field trial data, statistically-collected monitoringdata from the U.S. Department of Agriculture (USDA) or the Food and Drug Administration(FDA), and/or incorporation of residue reduction factors to account for cooking or processing. In some cases, probabilistic analyses of composited or even single serving-size samples may beused. The use of these anticipated residues (AR’s) produces more refined exposure estimateswhich more closely approximate the pesticide residues that humans will actually consume in theirdiets. The ways in which the data are refined depends on such considerations as what data areavailable, the relative confidence the Agency has in these data, the residues of toxicologicalsignificance, which of these residues are detected by the analytical method(s) used, as well as the

10
metabolic profile over time.
Not infrequently, data on anticipated residues contain at least some measurements forwhich the chemical analyst reported residue concentrations at levels “below the limits of detectionor quantitation.” The fact that no residues are detected does not necessarily mean there are none. Residues may exist at levels that are too low to detect. If the Agency has informationdemonstrating that a crop sample was treated with the pesticide in question, but residues were notanalytically detected, there are a number of options available for dealing with these nondetectablevalues and integrating this information into pesticide food exposure assessments. The two extremeoptions would be 1) assume that if residues were not detected, that they were not present (i.e.,residues concentrations are zero); or 2) assume that if residues were not detected (at some limit ofdetection), that they were present at just below that limit of detection. The first option wouldlead to the least conservative (i.e., most likely to underestimate the actual average residue level inthe ND samples) exposure estimate since the Agency would be assuming nondetectable residueswere actually zero; the second option would result in the most conservative (i.e., least likely tounderestimate the actual average residue level in those samples) estimate since the Agency wouldbe assuming that nondetectable residues were actually present at just below the analytical limit ofdetection.
OPP believes that neither approach reasonably represents reality, particularly in data setsin which many nondetects are present. Rather, biological information and empirical residuemeasurements indicate that residue data sets (including the NDs) are often lognormallydistributed. On a theoretical basis, concentrations of pesticides in food crops might be expectedto be a Random-Product process and the Theory of Successive Random Dilutions (SRD) wouldpredict that concentrations of pesticides would be lognormal (Ott, 1995). In addition, a fairamount of empirical evidence for a lognormal distribution of pesticides in foods exists from arecent study by the United Kingdom’s Ministry of Agriculture, Fisheries, and Food (MAFF) inwhich thousands of individual serving sized samples were analyzed for a variety of pesticides andfound to follow in most cases a lognormal distribution (MAFF, 1997).
Given the above information, OPP recommends (as an initial step in the exposureassessment process) use of a residue value of ½ LOD (or ½ LOQ if an LOD has not beendetermined) or the LLMV, as appropriate, for samples with no detectable residues if it is knownor believed that these samples have been treated with a pesticide according to the followingprotocol:
• OPP generally recommends use of a value of zero for the proportion of the dataset corresponding to the percentage of the commodities known not to be treatedwith pesticide (see Section II.D.).
• For the remainder of the data points for pesticide-treated commodities, OPPrecommends as its preferred approach use of the following assumptions:

11
(1) if a valid Limit of Detection (LOD) exists, use ½ LOD as the assignedvalue for NDs when conducting food exposure and risk assessments;
(2) if an LOD is not available, but a valid Limit of Quantification (LOQ)exists, use ½ LOQ for the NDs;
(3) if neither an LOD nor an LOQ is available, use the Lower Limit ofMethod Validation (LLMV) for the NDs; and
(4) if both LOD and LOQ are determined and if nonquantifiable residuesare detected between the LOQ and LOD, use ½ LOQ for thosemeasurements.
In general, OPP considers that the “replacement” or “substitution” method (replacingtreated non-detects with ½ LOD or ½ LOQ) will result in reasonable estimates of risk andexposure if the number of non-detects is small (e.g, 10-15%). The use of ½ LOD or ½ LOQ fornondetectable residues in samples is widely used in the risk assessment community and isadvocated by EPA (EPA, 1998a) when the appropriate conditions are met. Registrant’s areencouraged to use the substitution method in these instances and OPP would perform sensitivityanalyses routinely in these situations only on a case-by-case basis. When the number of non-detects increases to greater than ca. 10-15% (but is still less than 50%) risk assessments should beperformed using the replacement method, but the effect of the substituted values should beassessed by performing a sensitivity analysis and verifying that the relevant risk and exposureestimates are not significantly affected. Such an analysis should be included as part of the riskcharacterization. If it is determined that the effect of this substitution is significant, it may bedesirable to use statistical methods developed for censored data (as explained in Section III ofthis document). When data sets consist of >50% non-detects, the handling of ND’s should beconsidered on a case-by-case basis and no general rule of thumb is possible.
Additional details concerning this procedure and assignments are provided below:
(1) Policy for NDs When a LOD Has Been Properly Determined
The selection of a numerical value to represent NDs in a refined exposure assessmentdepends on the level of confidence OPP has in the supporting documentation of the variousmethod limits under consideration. For OPP to have a high level of confidence, the claimed LODshould be demonstrated using chromatograms, calculations, and statistics as noted above. Although there are a variety of acceptable techniques which can be used to estimate the LOD orLOQ, one example which would acceptable is shown in the Appendix to this policy paper. Theinformation provided in this attachment is only an illustrative example. Data submitters are free touse any reasonable and scientifically supportable methodology. In any case, and in accordancewith OPPTS Test Guidelines - Residue Chemistry 860.1340(c)(2)(iii), the procedures used by alaboratory to determine the LOD and LOQ should be fully explained and/or copies of any
12
appropriate publications should be submitted with the analytical method description to theAgency.
OPP recommends that the actual numerical value used to represent ND residues and tobe entered into the acute or chronic AR calculation should be ½ LOD. Particularly in thosecases in which acute food risk is only marginally acceptable and ½ LOD is used for a significantportion of the samples, this assumption should be mentioned in the risk characterization and theuse of a sensitivity analysis should be considered (see Section II.C. of this document).
(2) Policy for NDs When Only An LOQ Has Been Properly Determined
If an appropriate LOD has not been properly determined, OPP scientists will examinewhether an LOQ has been experimentally and statistically demonstrated and if a given sample withND residues may be adequately represented by ½ LOQ as demonstrated by chromatograms andother information. OPP recommends that the actual numerical value to be entered into the ARcalculation should be ½ LOQ.
(3) Policy When Neither a LOD Nor LOQ Has Been Properly Determined
If neither the LOD nor the LOQ has been properly determined, the full LLMV (lowestconcentration at which the method was validated) generally will be used in risk assessment. Therationale for this policy is that the Agency has less confidence in data samples when an LOD orLOQ cannot be statistically determined or reasonably estimated from the data. In general, if aLLMV is reported instead of an LOQ, it is likely that insufficient analyses were performed and a½ LOQ value could not be calculated with sufficient statistical rigor and precision to be reliablyused in a risk assessment. Accordingly, to assure that actual exposure to pesticides in food willnot be underestimated using such data, the OPP will use the full LLMV for each ND of a treatedsample in this situation. OPP actively discourages a registrant from choosing to use or report aLLMV if this is to be used as a substitute for a properly-determined LOD or LOQ. However,OPP believes that in many cases a rigorously-determined LLMV (e.g., one in which numerousdeterminations were made at levels close to the LOQ and appropriate statistical methodologiescan be used) can be used to estimate an LOD or LOQ. In these cases, OPP recommends use ofthe ½ LOD or ½ LOQ default, as appropriate, in risk assessments.
(4) Policy When Detectable But Non-quantifiable Residues Are Found
If a sample contains detectable, yet nonquantifiable residues, i.e., residues fallingbetween the LOD and the LOQ, OPP recommends that such samples typically be representednumerically in the refined exposure assessment as ½ LOQ when assessing both acute andchronic risk. This science policy is consistent with the extensively peer reviewed “OPPTS TestGuidelines Series 875 - Occupational and Residential Exposure” which states that ½ LOQ shouldbe used to represent samples bearing detectable residues between the LOD and LOQ. This is alsoconsistent with the USDA Pesticide Data Program’s (PDP) policy for reporting these values: all

13
residues detected at >LOD but <LOQ by the PDP program are reported as ½ LOQ.
If information is available indicating that most residue values are just above the LOD orjust below the LOQ, a decision will be made on a case-by-case basis regarding the appropriatevalue to assign to NDs. The rationale for selection of a residue value different from ½ LOQ forthese commodities should be explained clearly in the risk characterization. If available and clearlysupported by raw data (chromatograms, etc.), the analyst’s estimate of the residue between theLOD and the LOQ may, at the discretion of the OPP, be used as a means of further refinement ofthe estimated exposure. If a significant portion of the residue values was derived via the analyst’sestimation of values between the LOD and LOQ, this should be noted in the risk characterization.
C. Sensitivity Analysis
In general, assigning numerical values to NDs as described above is not expected tosignificantly affect OPP’s risk estimate. However, OPP, under certain circumstances, willperform a sensitivity analysis if it is believed that the substitution of ½ LOD, ½ LOQ, or LLMVvalues for nondetects has significantly affected the outcome of a risk assessment and/or OPP’srisk decision. That is, if the OPP risk assessment shows unacceptable risks when ½ LOD valuesare used for nondetects, EPA will attempt to demonstrate that the use of ½ LOD has not by itselfsignificantly affected the risk assessment by re-estimating risks with zero substituted for ½ LODor ½ LOQ.
Conversely, if the risk assessment shows acceptable risk when ½ LOD values are assignedto nondetects, we will re-estimate the risks, where appropriate, with the full LOD or LOQsubstituted for ½ the LOD or LOQ. This latter substitution will never change the estimatedexposure (and risk) by more than a factor of 2 (and then only if all crops were considered treatedand if all values were ND). If the Agency risk assessment changes substantially as a result ofassigning these alternate values, the sensitivity analysis will have demonstrated that the Agencyrisk assessment is sensitive to assumed concentrations for the nondetects. OPP may then requestthat additional data and/or an improved analytical method be developed and submitted. To date,the conduct of these sensitivity analyses has not resulted in a significant change in the upperpercentiles of estimated acute exposures.
D. Use of Percent of Crop Treated
Notwithstanding the above discussion, OPP believes it to be appropriate to use “truezeroes” for those ND’s which represent untreated crops and OPP continues to support the use of“true zero” for those samples which have not (or are not expected to have been) been treated withthe pesticide of interest. Specifically, exposure assessments will generally be performed with thenon-treated samples incorporated as “true zeroes.”
The Agency will determine which “nondetect” samples should be represented by zero in a ratiodirectly proportional to the percent of crop not treated. In calculating average residues when a

A range of interlaboratory LOD variation of up to 35x has been observed for a single1
chemical/crop combination in one residue monitoring data set.
14
Suppose that 30% of apples are treated with a pesticide (and 70% aretherefore not treated), but a PDP survey of 5 lb. composite samples showsthat 80% (i.e., a total of 240 samples) of the 300 samples collected haveND (not detected or less than detection limit) residues. Three-quarters ofthose PDP ND values have a limit of detection of 0.05 ppm and one-quarterof the ND values have LOD’s of 0.10 ppm. We wish to calculate theaverage residue in apples for use in a chronic pesticide food residueassessment.
Given this information, we would conclude that 70% of the 300 compositeapple samples contain no (or zero) residues since they were not treated withpesticide. This means that 210 of the 300 composite samples are truezeroes (70%). From this, it follows that 210 of the 240 ND values (or87.5% of the ND’s ) represent true zeroes with the remaining 30 ND values(or 12.5% of the 240 NDs) representing treated apples with residues at lessthan the detection limit. To calculate residues in these treated samples, wewould assign one-half the 0.05 ppm LOD to three quarters of these ND’s(representing an expected 22.5 of the 240 ND samples) and one-half the0.10 ppm LOD to the remaining one-quarter of these ND’s (representing anexpected 7.5 of the 240 ND samples). The average residue for use in achronic assessment would therefore be calculated as follows:
(210 x 0 ppm) + (22.5 x 0.025 ppm) + (7.5 x 0.05 ppm) + 3 (all >LOD values) 300
If the residue data were to be used instead to establish an electronic residuefile for use in an acute probabilistic assessment, the file would contain 210true zeroes and 30 values at 0.0313 ppm (i.e., ½ the weighted LOD), withthe remaining 60 values represented by their >LOD measurements (at either½ LOQ or >LOQ, as appropriate)
variety of limits of detection exist,the average residue valuecalculated will incorporate aweighted average of the LODsfrom treated commodities inwhich no residues weredetected . Such a calculation will1
not incorporate one-half of theoverall average LOD from alllaboratories. For example, if 70%of a crop is not treated, but 80%of the monitoring samples in adata set is reported as <LOD, then70% of the samples would beassigned a value of zero, 10%would be designated as ½ LOD,and 20% of the samples would beassigned the reported residuevalues. If more than one LOD isreported for the samples in thedata set, one-half of the weightedaverage of the LODs would beused. An illustration of thiscalculation is shown in the abovebox. Similarly, in those caseswhere it is necessary to constructan electronic residue file for anacute exposure assessment (andthe average residue values are not appropriate), the file should be constructed such that thetreated non-detect samples are assigned a weighted average of the LODs in which no residueswere detected. An example of how this file would be established is illustrated in the box on theprevious page.
E. Considerations Related to Pesticides Having Analytes of Concern
The LOD and/or LOQ is often not established for all residues of toxicological significance. In some situations, the method may, in fact, be incapable of determining the residues at all. Thismay particularly be true for multi-residue monitoring methods. For example, FDA often reportsonly residues of the parent compound. USDA’s Pesticide Data Program (PDP) often attempts toanalyze all residues of toxicological significance; however, there are certain metabolites of

15
concern that are not sought by PDP due to analytical difficulty or due to the unavailability orexpense of analytical standards. As a result, difficulty arises when attempting to sum the residuesof multiple analytes of concern because a numerical limit is not available to assign tonondetectable levels of one or more of the residues of concern. Such shortcomings may renderone or both sources of monitoring data of limited value to the refinement of pesticide food residueexposure estimates unless metabolism studies and other information can be used to establish aratio between the concentration of one or more analyte(s) to the concentration of toxicologicallysignificant residues not determined by the method. Decisions on how to use such residue data willbe made on a case-by-case basis.
F. Essentially Zero Residues : Use of Zero (or Near Zero) ResidueConcentrations in Risk Assessments
A number of instances may arise in which it is appropriate to assume for risk assessmentpurposes that residue values so closely approach zero that this value (rather than ½ LOD or ½LOQ) should instead be used in the exposure assessment. Explanation of the rationale andfurther illustration of situations where this might be appropriate are detailed in HED’s SOP 99.6(8/20/1999) from which the following is excerpted (US EPA 1999):
... [I]t may be appropriate in certain cases to judge that the ND values fromthe monitoring data are “essentially zero,” particularly if a substantial portionof the measured residue values is less than the analytical detection limit (andwould therefore ordinarily be replaced by ½ LOD). In these instances, it maybe appropriate to introduce a value of zero ppm (or near zero) as a residuevalue (in place of ½ LOD) for the ND measurements in the risk assessment. This judgement should be made on a case-by-case basis, with the reviewerbringing a wide range of information to bear on proper valuation of the NDs,including the nature of distribution of the values above the detection limit, thepercent of the crop which is treated, and information on the processing ofcommodities before sampling;
For example, information from a radiolabel metabolism study or a field trial conducted atan exaggerated rate may be available which indicates that residues of concern are present at levelsmuch lower than ½ LOD. Alternatively, theoretical calculations based on mass balanceconsiderations, for example, may demonstrate for a seed-treatment use that resulting residues inthe harvested crop would be expected to be much less than ½ LOD. Other factors, perhaps whenconsidered jointly, might warrant consideration in this evaluation and suggest that resultingresidues would be near zero. For example, for a blended processed commodity such as corn oil, itmight in some instances be appropriate to assume measured ND values from monitoring studiesrepresent real zero (or near zeroes) concentrations after consideration of the percent of the corncrop which is treated, the range of actual application rates and pre-harvest intervals, andprocessing/cooking factors. For example, if only 5% of the corn crop is treated, residue fieldtrials on the raw agricultural commodity show average residues of 0.1 ppm, and processing ofcorn into corn oil has been demonstrated to reduce residues 15-fold, it would be reasonable to
Imputation, in general, can refer to procedures applied to other aspects of pesticide food2
residue exposure. For example, imputing single-serving residue values from composite samples ison form of imputation (which is perhaps more aptly referred to as a data deconvolution exercise). Similarly, construction of empirical distribution functions (EDFs) is a form of imputation as wellthat results in data interpolation. In the context of this paper, the term “imputation” refers toimputing (or “data uncensoring”) of left-censored data.
16
assume that average residues are less than 0.0003 ppm and thus any ND value in a corn oil monitoring survey could be assumed to be less than this calculated average. In many cases, it maybe a variety of factors which, when considered together, would lead the risk assessor to support adecision to replace <LOD measurements with zero (or near zero) values in the risk assessment.
Alternatively, a value of zero may be appropriate to represent “nondetects” for one ormore analytes of concern provided this decision is supported by such information as metabolismstudies, data at shorter preharvest intervals (PHIs), exaggerated rate data, etc. This approachmay be appropriate only for certain crops or certain use patterns. On a case-by-case basis, plantor livestock metabolism data, data reflecting exaggerated application rates and/or short PHIs,close examination of the chromatograms, consideration of the analytes determined by theanalytical method(s), and other information may be used singly or in conjunction to formulate aweight-of-the-evidence argument in favor of (or against) use of true zero to represent the level ofone or more analytes of toxicological concern potentially present in samples denoted as bearingless than LOD/LOQ residues. This procedure could be particularly important for pesticideshaving several residues of toxicological concern whereby, using the above information, thechemist gains confidence that only a subset of the terminal residues will be present at normalharvest time; zeros could be used for the other analytes of concern. On an international level, asimilar approach is used by the Food and Agriculture Organization/World Health Organization’sJoint Meeting on Pesticide Residues in the case of pesticides having a chronic toxicologicalendpoint.
III. A Statistical Method for Incorporating Non-Detected Pesticide Residues
There may be instances in which a significant portion (e.g., more than 15%) of the residuedata set contains non-detectable residues, when a sensitivity analysis reveals an inordinate effectof the ½ LOD or ½ LOQ assumption on the risk decision, or when it is simply decided that amore accurate assessment of residue levels is appropriate. This section of the policy paperdescribes how residues levels below the LOQ may be estimated using statistical imputation methodologies. Use of such methodologies should produce a more accurate estimate of <LODand <LOQ residues.
When the appropriate recommended conditions are met (see below), statistical imputationmethodologies are useful for predicting the distribution of non-detectable residues below the LODin cases where some of the residues of the data set are undetectable. Here, statistical imputationrefers to imputation procedures for left-censored data . When properly employed, such methods2

This assumption of normality (or lognormality) should be verified prior to use of these3
methods. The reference to an “assumed normal distribution” is made to reflect a commonstatistical convention that one cannot prove a given distribution belongs to a hypothesized familyof distributions (e.g, normal, lognormal, Poisson, etc.), but rather can only provide sufficientevidence to suggest that the hypothesized distribution is not inconsistent with actual distribution(analogous to either “rejecting” or “failing to reject” a hypothesis). If there is insufficient evidence to demonstrate that a distribution is not normal, then it is reasonable to refer to it as an“assumed normal” distribution.
17
can provide a scientifically sound basis for more accurately estimating pesticide food residueexposure and risk than assuming that exposure occurs at ½ LOD or some other single, finitevalue. This method is intended to be used chiefly by persons conducting probabilistic humanhealth pesticide food residue exposure assessments for purposes of registration, reregistration, ortolerance assessment of pesticides.
Briefly, the methods described below use the information provided by the uncensoredportion of the data (i.e., that portion of the data with >LOD values) and the assumed normal (ortransformed normal) distribution of the data to calculate a mean and standard deviation which3
incorporates the data which lie below the detection limit in the “censored” region of the data. Cohen’s method requires that the distribution be normal (or can be made normal) and that therebe only a single LOD or LOQ for all analyses of the same commodity. It will result in anestimated mean (i.e. arithmetic average) concentration which incorporates the <LOD values andcan be used in a chronic assessment or in an acute assessment for those commodities for whichthe use of a mean value is appropriate (e.g., blended commodities). By mentioning several specificmethods, OPP does not mean to imply that other methods are not appropriate for this task. Whichever method is selected, OPP recommends that the method be adequately supported byboth a sufficiently rich data set above the detection limit and a statistically-robust methodology forimputing those values.
Under the methods presented below, those measured values which lie above the LOD butbelow the LOQ should be considered as being “semi-quantitative.” In contrast to themethodology described in Section II of this document, in which ½ LOQ is generally used as adefault assumption for all values which lie between the LOD and LOQ, the actual measured“semi-quantitative” value should instead be used when working with methods for censored data.
A. Cohen’s Method
Cohen’s Method is a technique which can be used to more accurately determine meanresidue values from heavily “censored” data sets, i.e., data sets for which a substantial amount ofdata (e.g., 15-50%) are simply reported as less than a given detection or quantitation limit.Cohen’s method is fully described in EPA’s Guidance for Data Quality Assessment: PracticalMethods for Data Analysis originally issued in July 1996 (EPA/ 600/R-96/084) and in severalother publications described in the Reference section of this document (U.S. EPA, 1998a). The

18
EPA publication is available on the Internet athttp://www.epa.gov/r10earth/offices/oea/epaqag9.pdf .
The method is designed to be used only for data points which are part of a parentpopulation which is normally distributed or that can be made normal via transformation. Practically, this means that the parent population should have either a normal or log-normaldistribution. Thus, prior to using this method, the existence of a normal (or transformed log-normal) parent population should be demonstrated. It is strongly recommended that the data begraphed on appropriate probability paper and that normality tests (e.g., Shapiro-Wilk) beperformed to verify the assumed distribution. Various statistical procedures (with associatedexamples) which could be used to accomplish this task are available in the document Guidancefor Submission of Probabilistic Human Health Exposure Assessments to the Office of PesticidePrograms dated 11/4/98 (U.S. EPA, 1998b) which is available on the world wide web in draftformat at http://www.epa.gov/fedrgstr/EPA-PEST/1998/November/Day-05/o-p29665.htm.
Additional recommended criteria for use of Cohen’s methodology is that not more than50% of the data set be censored (ideally, less than 20% should be censored) and/or at least 10non-censored data points (with 20 or more being strongly desirable) be available. Exceptions tothese recommended criteria can be made on a case-by-case basis. However, with respect to theexceptions, it should be remembered that in many cases it is likely that a more refined estimationprocedure such as Cohen’s method is being using precisely because the insertion of ½ LOD forND residues resulting in risk above OPP’s level of concern while the substitution of 0 ppm forND’s resulted in risks below OPP’s level of concern. That is, in many cases Cohen’s method willbe used because OPP’s risk estimate or resulting decision is very sensitive to assumptions aboutvalues to assign to ND residues. Thus, OPP is justified in recommending stricter criteria for useof Cohen’s method than might normally be used in attempting to estimate a “best” estimate of amean residue value.
It is important to note that, when using USDA’s Pesticide Data Program (PDP) or othermonitoring data to calculate an average residue for use in a risk assessment, the percentage of thedata set which represents “true zeroes” (i.e., not treated) should be eliminated from the data setbefore considering whether the procedure in this document is applicable. For example, if 80% ofa crop is not treated, but 90% of the PDP values are reported as NDs, the not treated portion ofthe data should be removed from the data set; the remaining NDs (i.e., 10% of the originalsample) would be considered to represent treated commodities which have residues at levelslower than the LOD. Thus, in this case, 50% of the data would be censored (10% of the samplesare ND and 10% of the samples are greater than the LOD).
Since Cohen’s method is designed for use with a distribution that is normal, the logarithmsof the data should be used if the data are log-normally distributed with the resulting mean andstandard deviation of the (original) untransformed data back-calculated using the followingformulae for the mean and standard deviation respectively:

Cohen’s paper (Expression 2.5.5) indicates he is using n in the denominator, rather than4
n-1. The use of n in the denominator is more commonly associated with a population varianceformula while the use of n-1 is associated with the sample variance formula.
19
M = exp(M + 0.5 s )a L L2
s = M [exp(s )- 1]a a L2 2 2
where M is the arithmetic mean of the original (untransformed) residue values, M is the mean ofa L
the logarithms of the residue values, s is the standard deviation of the logarithms of the residueL
values, and s is the standard deviation of the original (untransformed) residue values. a
In general, the criterion that the data be normally (or lognormally) distributed is notexpected to present an impediment to the widespread application of this technique. On atheoretical basis, concentrations of pesticides in food crops might be expected to be a Random-Product process and the Theory of Successive Random Dilutions (SRD) would predict thatconcentrations of pesticides would be lognormal (Ott, 1995). In addition, a fair amount ofempirical evidence for a lognormal distribution of pesticides in foods exists from a recent study bythe UK’s Ministry of Agriculture, Fisheries, and Food (MAFF) in which thousands of individualserving sized samples were analyzed for a variety of pesticides and found to follow in many casesa lognormal distribution (MAFF, 1997).
Briefly, Cohen’s technique for censored samples involves the following steps for log-normally distributed data (derived from Perkins, et al., 1990):
1. Determine N = total sample size
2. n = number of quantitated measurements
3. h = (N-n)/N
4. Transform the uncensored measurements to logarithms
5. Determine ln(LOD) = X o
6. Determine S /(X -X ) = ( where X and S are the mean and (population)L L o L L2 2 2
variance of the log transformed detectable data, respectively .4
7. Using appropriate tables (e.g., in US EPA, 1996 or Perkins) with h and (, find (
8. M = X - ((X - X )L L L o
9. s = S + ((X - X )L L L o2 2 2

20
Concentrations of a pesticide in 10 samples of anagricultural commodity are as follows (in ppm):<0.2,0.45, 0.60, 0.76, 1.05, 1.12, 1.20, 1.37, 1.69, and 2.06. The LOD is reported at 0.2 ppm. A statistical evaluation(not shown) demonstrates that these values areconsistent with a lognormal distribution. The naturallogarithms of these concentrations are (respectively) asfollows:
ND, -0.7985, -0.5108, -0.2744, 0.04879, 0.1133,0.1823, 0.3148, 0.5247, and 0.7227
Using this information, the following results would begenerated:
1. N = total sample size = 10
2. n = number of quantitated measurements = 9
3. h = (N-n)/N = (10 - 9)/10 = 0.1
4. The natural logarithms of these concentrationsare (respectively) as follows: ND, -0.7985, -0.5108, -0.2744, 0.04879, 0.1133, 0.1823, 0.3148, 0.5247, and 0.7227
5. ln (0.20) = -1.6094
6. X = 0.03588; S = 0.21193; L L2
( = 0.21193/(0.03588 + 1.6094) = 0.078292
7. ( = 0.1164
8 ML = 0.03588 - 0.1164(0.03588 + 1.6094) = -0.1556
9. s = 0.21193 + 0.1164(0.03588 + 1.6094)L2 2
= 0.5270
10. Ma = exp[-0.1556 + 0.5(0.5270)] = 1.114
s = (1.114) [exp(0.5270)-1] = 0.8611a2 2
10. M = exp(M + 0.5 s )a L L2
s = M [exp(s )-1]a a L2 2 2
An example of the use of Cohen’s methodis provided in the box to the right (derived fromGilbert, 1987, p. 183).
B. Estimation of Specific ValuesThat Lie Below the DetectionLimit
Cohen’s method is appropriate for use incases where it is sufficient to calculate a meanresidue value and the basic distributional andother requirements are met. In general, the use ofa mean value in a risk assessment is appropriate ifa chronic analysis is being performed or if it isactually the mean value in an acute analysis whichis of interest. In certain instances, it may not besufficient to simply obtain the mean (and standarddeviation) of a data set by use of Cohen’smethod. For example, it may be desired toperform a Monte-Carlo analysis using data from amarket basket survey in which single servingsized samples were analyzed and many NDswere obtained. Or it may be required to insertdata from field trials with many ND values into aMonte-Carlo analysis. In these cases, it is theentire set of individual residue values (or theirestimates) which are desired and not simply themean or values which are greater than the LOD.
In these cases, it may be possible to usethe information provided by the uncensoredportion of the data to impute those values whichlie below the detection limit in the “censored”
It is important that the non-treated NDs be removed from the distribution prior to5
performing statistical calculations (as discussed under the Cohen’s Method section). Of course,one can instead simply substitute ½ LOD or ½ LOQ, as appropriate, for the NDs in a Monte-Carlo analysis.
21
region of the data. As in the case with Cohen’s method used to calculate a mean residue value,5
those data which are greater than the detection limit should be demonstrated to follow a specifichypothesized distribution; it is this specific distribution which is used to extrapolate residue valuesinto the less than detection limit (or censored) region of the data. The resulting imputed valuescan then be used directly in a Monte-Carlo assessment.
A variety of ways are available to impute values which lie below the detection limit in thecensored region of the data (i.e., imputing of left-censored data), and there is an extensiveliterature on this topic (see Reference list). OPP is not advocating specific ways in which thisstatistical imputation can or should be done, but rather simply emphasizing that, whichevermethodology is selected, it should be adequately supported. In general, these methods should beused only when it has been demonstrated that the relevant risk estimate [e.g., chronic risk basedon mean input values or acute risk based on the distribution of input values and a high-end(output) exposure percentiles] or risk management decision is sensitive to the assumption that NDvalues are equal to ½ LOD (or ½ LOQ). In general, these techniques will only be used if morethan 10-15% of the data are non-detects.
One popular method for this imputation procedure is Helsel’s Robust Method (Helsel,1990; ILSI, 1998). This method can be used to extrapolate a distribution to the region of thecensored portion of the data, and hence generate “replacement values” for those measurementsthat are simply reported as “below detection limit.” As stated by Helsel,
These methods combine observed data above the reporting limit with below-limit values extrapolated , assuming a distributional shape, in order to computeestimates of summary statistics. A distribution is fit to the data above thereporting limit by either MLE or probability plot procedures, but the fitteddistribution is used only to extrapolate a collection of values below thereporting limit.
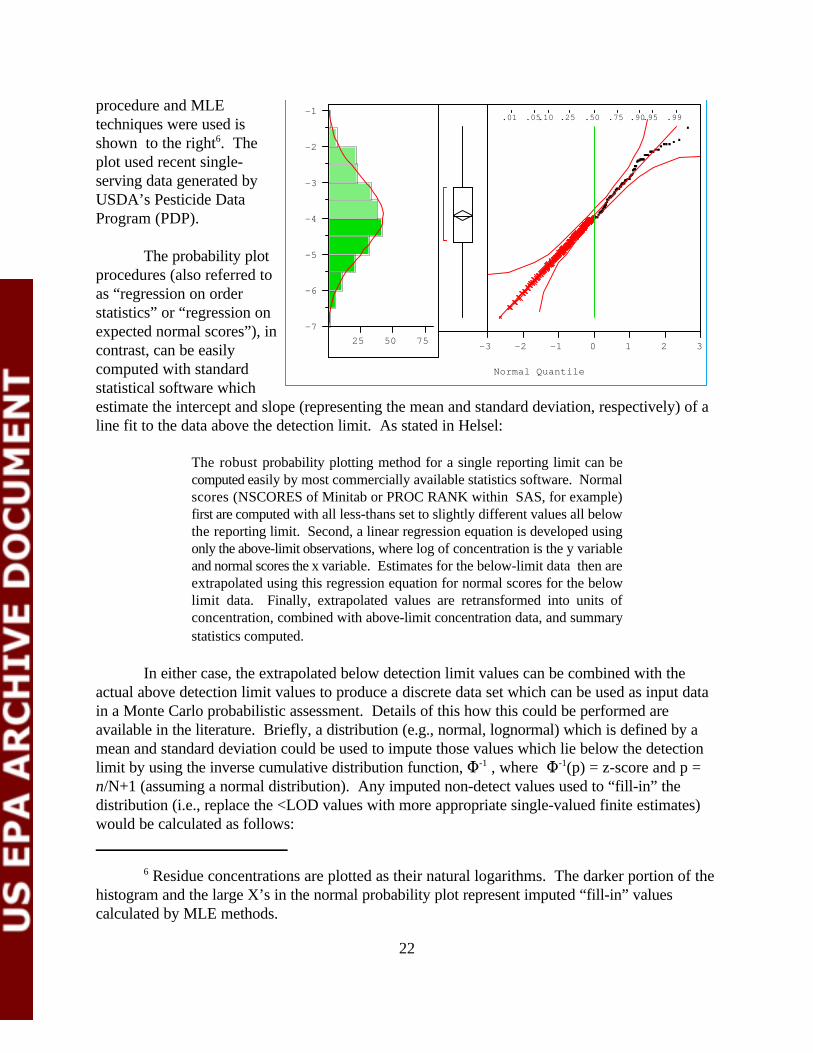
In general, the fitting of the distribution is done by either Maximum Likelihood Estimation(MLE) procedures or by probability plot procedures (which generally require that there be onlyone censoring point). Roughly speaking, the MLE procedures use, in a complex iterativemathematical optimization procedure, the reported above detection-limit values and the values ofthe detection limits to estimate the parameters of the family of distribution (e.g., normal,lognormal) which “maximize the likelihood” of observing the data actually observed. Once thevalues of the defining parameters have been obtained, they are used to generate replacement, or“fill-in”, values for the below detection limit observations. A sample plot in which Helsel’s
-7
-6
-5
-4
-3
-2
-1
25 50 75
.01 .05.10 .25 .50 .75 .90.95 .99
-3 -2 -1 0 1 2 3
Normal Quantile
Residue concentrations are plotted as their natural logarithms. The darker portion of the6
histogram and the large X’s in the normal probability plot represent imputed “fill-in” valuescalculated by MLE methods.
22
procedure and MLEtechniques were used isshown to the right . The6
plot used recent single-serving data generated byUSDA’s Pesticide DataProgram (PDP).
The probability plotprocedures (also referred toas “regression on orderstatistics” or “regression onexpected normal scores”), incontrast, can be easilycomputed with standardstatistical software whichestimate the intercept and slope (representing the mean and standard deviation, respectively) of aline fit to the data above the detection limit. As stated in Helsel:
The robust probability plotting method for a single reporting limit can becomputed easily by most commercially available statistics software. Normalscores (NSCORES of Minitab or PROC RANK within SAS, for example)first are computed with all less-thans set to slightly different values all belowthe reporting limit. Second, a linear regression equation is developed usingonly the above-limit observations, where log of concentration is the y variableand normal scores the x variable. Estimates for the below-limit data then areextrapolated using this regression equation for normal scores for the belowlimit data. Finally, extrapolated values are retransformed into units ofconcentration, combined with above-limit concentration data, and summarystatistics computed.
In either case, the extrapolated below detection limit values can be combined with theactual above detection limit values to produce a discrete data set which can be used as input datain a Monte Carlo probabilistic assessment. Details of this how this could be performed areavailable in the literature. Briefly, a distribution (e.g., normal, lognormal) which is defined by amean and standard deviation could be used to impute those values which lie below the detectionlimit by using the inverse cumulative distribution function, M , where M (p) = z-score and p =-1 -1
n/N+1 (assuming a normal distribution). Any imputed non-detect values used to “fill-in” thedistribution (i.e., replace the <LOD values with more appropriate single-valued finite estimates) would be calculated as follows:

23
“Fill-in” value = z-score * SD + mean.
For example, suppose that there are 100 data points of which 98 are above the detectionlimit and two are below the detection limit. Further supposed that calculation via Cohen’s (or anyother) method results in an estimated mean of the distribution of 10.0 and a standard deviation of2.0. The values would then be ranked, and (since there are 100 total values), the first non-detectwould occupy the 0.01 quantile and the second non-detect would occupy the 0.02 quantile. Thecorresponding p values would be calculated as p = 1/(100+1) = 0.0099 and p =2/(100+1) =1 2
0.0198 for the first and second ND values, respectively. Using a normal probability table, onewould determine that M (p ) = M (0.0099) = -2.33 and M (p ) = M (0.0198) = -2.06. The-1 -1 -1 -1
1 2
fill-in values associated with these two z scores are -2.33*(2.0) + 10.0 = 5.34 and -2.06*(2.0) +10.0 = 5.88. Thus, 5.34 and 5.88 would be the two fill-in values associated with the two non-detects.
A publicly available software program is available to implement this and other procedures(UNCENSOR v. 4.0, Newman et al.) and is distributed free of charge. Although OPP has notreviewed or tested this software, registrants and other data submitters and interested parties maybe interested in investigating its use.

24
IV. References
Berthouex, PM and LC Brown. 1994. Statistics for Environmental Engineers. Chptrs. 10 and 11."Simple Methods for Analyzing Data that are Below the Limit of Detection" and " Estimating theMean of Censored Samples", pp. 81-95
Cohen, AC., Jr. 1959. Simplified estimators for the normal distribution when samples are singlycensored or truncated. Technometrics 1:217-237
Cohen, AC, Jr. 1961. Tables for maximum likelihood estimates: singly truncated and singlycensored samples. Technometrics 3:535-541.
Gilbert, Richard O. 1987. Statistical Methods for Environmental Pollution Monitoring. JohnWiley and Sons (New York, NY).
Helsel, DR. 1990. Less than obvious: statistical treatment of data below the detection limit.Environ. Sci Technol. 24(12): 1766-1774.
Hornung, RW and LD Reed. 1990. Estimation of average concentration in the presence ofnondetectable value. Appl. Occup. Environ. Hyg. 5 (1):46-51.
International Life Science Institute. 1998. Aggregate Exposure Assessment. Appendix 3(Analysis of Data Including Observations Below Certified Reporting Limits).
Keith, L. H., et al. 1983. Principles of Environmental Analysis. Anal. Chem. 55(14): 2210-2218.
Miller, J.C. and J.N. Miller. 1984. Statistics for Analytical Chemistry. John Wiley and Sons(Philadelphia, PA).
Ministry of Agriculture, Fisheries, and Food. Pesticides Safety Directorate. 1997. Data suppliedwith Unit to Unit Variation of Pesticides in Fruit and Vegetables. March 14.
Ott, W. R. 1995. Environmental Statistics and Data Analysis. Chpts. 8 and 9 "Dilution ofPollutants" and "Lognormal Processes". Lewis Publishers (New York, NY). pp. 192-293.
Perkins, JL, GN Cutter, and MS Cleveland. 1990. Estimating the mean, variance, and confidencelimits from censored (<limit of detection), log-normally distributed exposure data. Am. Ind. Hyg.Assoc J. 51(8):416-19.
Travis, CC and ML Land. 1990. Estimating the mean of data sets with non-detectable values.Environ. Sci. Technol. 24(7):961-2.
U.S. EPA. 1998a. Guidance for Data Quality Assessment: Practical Methods for Data Analysis

25
EPA QA/G9. QA-97 Version. Office of Research and Development. EPA/600/R-96/084.(available in downloadable Adobe Acrobat pdf format on the world wide web athttp://www.epa.gov/r10earth/offices/oea/epaqag9.pdf )
U.S. EPA. 1998b. Draft document. Guidance for Submission of Probabilistic Human HealthExposure Assessments to the Office of Pesticide Programs. November 4. (available indownloadable Adobe Acrobat pdf format on the world wide web athttp://www.epa.gov/fedrgstr/EPA-PEST/1998/November/Day-05/o-p29665.htm)
U.S. EPA. 1999. Office of Pesticide Programs. Health Effects Division. “Classification of FoodForms With Respect to Level of Blending.” HED Standard Operating Procedure 99.6 (8/20/99)August 20.

A-1
APPENDIX 1
To date, OPP has not issued formal guidance or procedures, or made available a list ofacceptable methodologies for the estimation of LOD and/or LOQ values for pesticide residueanalyses. Due in part to the many valid operational definitions of LOD and LOQ and proceduresused to estimate these, OPP believes it unwise to prescribe any one specific procedure or protocolas a standard universal requirement for pesticide registration submissions. Any reasonable,generally recognized procedure consistent with the aims and requirements of regulatory exposureestimation and risk assessment practices of OPP may be considered and will be evaluated.
OPP notes, however, that there may be some confusion in the regulated community withrespect to LOD and LOQ issues. This is likely due, in part, to the plethora of definitions for LOD and LOQ, a lack of distinction between the two, organizational preference for one over theother, and the proliferation of several synonymous terms such as “limit of determination” or “limitof sensitivity,” In a number of instances OPP has noted in residue chemistry submissions thatthese terms have been inappropriately used, used interchangeably, or used without supportingdocumentation and/or information concerning their derivation. In many cases, OPP has found thata sample is reported to contain nondetectable residues when, upon further investigation, theproper designation should have been “nonquantifiable,” or vice versa. This confusion over thedefinition of LOD (or LOQ), and the implicit statistical concepts which are central to itsdefinition, is alluded to by Berthoux (1994)
The method limit of detection or method detection limit (MDL) is based on theability of a measurement method to determine an analyte in a sample matrix,regardless of its source of origin. Processing the specimen by dilution,extraction, drying, etc. introduces variability and it is essential that the MDLinclude this variability.
The MDL is a statistical concept, although it is often thought of as a chemicalconcept, because it varies from substance to substance and it becomes possibleto measure progressively smaller quantities as analytical measurementsimprove. Nevertheless, the MDL is a statistic that is estimated from the data.As such, it has no scientific meaning until it is operationally defined in termsof a measurement process and a statistical method for analyzing themeasurements that are produced. Without a precise statistical definition, onecannot determine a numerical value for the limit of detection or expectdifferent laboratories to be consistent in how they determine the limit ofdetection.
Many definitions have been published. They may differ in detail, but broadlyspeaking they are all defined in terms of a multiple of the standard deviationof measurements on blank specimens, or, alternatively, on specimens that havea very low concentration of the analyte of interest. All definitions exhibit thesame difficulty with regard as to how the standard deviation of blankspecimens is to be estimated. Without a precise statistical definition, one

In general, instrument responses are expected to be linear with respect to analyte concentration, but exceptions7
do exist. For example, linearity is maintained only in the “linear region” of analyte concentrations and there are certaindetectors, instruments, or methods (e.g., FPD detectors operated in the S-mode, certain ion-selective electrodes, orimmunoassays) where the expected response is curvilinear Confirmation of linearity in response over the range ofconcentrations is generally done by visual inspection of the standard curve or calibration plot. In those instances wherelinearity is suspect, the analyst may wish to perform supplementary statistical tests (e.g., lack of fit test, regressiondiagnostics and residual analysis, etc.).
A-2
cannot determine a scientifically plausible value for the limit of detection,expect different laboratories to be consistent in how they determine the limitof detection, or be scientifically honest about declaring that a substance has (orhas not) been detected. Beyond the statistical definition, there must be a clearset of operational rules for how this measurement error is to be determined inthe laboratory. Most published definitions are weak with respect to theseinstructions, which must explain how to estimate the variances and what kindand number of blanks to be used.
Given this confusion, and in the interest of informing registrants and other data submittersof one potential method for LOD/LOQ determination which would fully meet relevant scientificand statistical criteria, this Appendix provides an illustrative example of an LOD and LOQdetermination. The example provided is a slightly modified form of a procedure used by USDA’sIR-4 program and is published, in part, in 40 CFR (as 40 CFR Part 136, Appendix B).
The information provided in this attachment is only illustrative of a technique which aregistrant or data submitter may or may not choose to follow. Registrants and data submittersare free to use any reasonable and scientifically and statistically supportable methodology. Regardless of whether this specific example methodology or another separate methodology ischosen, the procedures used by a laboratory to determine the LOD and LOQ should be fullyexplained and/or copies of any appropriate publications should be submitted with the analyticalmethod description to the Agency. In addition, OPP expects that adequate supportingdocumentation (e.g, chromatograms, calculations, etc.) would be included in the submission.
ILLUSTRATIVE EXAMPLE
An analyst wishes to determine the LOD and LOQ for a specific method for measurementof a given pesticide in a given crop matrix. This method may be the proposed enforcementanalytical method, or simply a method which is used for measurement of residues in crop fieldtrials or market basket surveys. The estimation of the LOQ and LOD of a specific method for aspecific pesticide on a specific crop is done in the following two steps.
• The first step is to produce a preliminary estimate of the LOD and LOQ and toverify that a linear relationship between concentration and instrument responseexists . These preliminary estimates correspond to what some term the IDL7
(Instrument Detection Limit) and IQL (Instrument Quantitation Limit),respectively. The matrix of interest will be fortified (spiked) at the estimated LOQ

All concentrations reported in this attachment are in terms of the solution and not the plant matrix. 8
Subsequent conversions would be necessary to convert concentrations in the solution (e.g, ug/ml) to concentrations inthe matrix of interest (e.g., ug/g plant material).
Alternatively, the figures provided by the computer software could instead be calculated using a scientific9
calculator as follows in abbreviated format (discrepancies between these calculations and those shown in the text aredue to rounding):
r = 0.9950m= 1 973 098.5
b = 15 120.
A-3
in the next step for the actual estimation of LOD and LOQ of the method.
• The second step is to use the initial estimate of the LOD and LOQ determined inStep 1 to estimate the method detection limit and method quantitation limit in thematrix of interest.
These two steps are described in detail below.
STEP 1 The analyst derives a standard curve for the method of interest. In this particularinstance, the analyst prepares the standard solutions with the following concentrations ofthe pesticide of interest (all in ppm): 0.005, 0.010, 0.020, 0.050, and 0.100. For eachconcentration in the sample solution , the following instrument responses (measured peak8
height) are recorded:
Concentration Instrument Response(ppm) (peak height)
0.100 206,493
0.050 125,162
0.020 58,748
0.010 32,668
0.005 17,552
In order to verify that a linear response is seen throughout the tested range, the instrumentresponse is plotted as a function of injected concentration. The results (and associatedstatistics) are shown in Figure 1. Note from these results that the instrument responseappears to be adequately linear throughout the range of tested concentrations (0.005 ppmto 0.100 ppm), and that the R value from the Summary of Fit box is adequate (0.99003). 2
The standard deviation (as presented in the summary of fit box in Figure 1 as the RootMean Square Error) is 8986.8. The equation which describes this relationship (provided9

Standard deviation is calculated as follows:
x y yhat |y -yhat| (|y -yhat|)i i i i2
0.100 206,493 212,431 5,938 35,260,6800.050 125,162 113,774 11,388 129,696,6980.020 58,748 54,579 4,169 17,380,1900.010 32,668 34,848 2,180 4,750,4000.005 17552 24,982 7,440 55.350,470
3 = 242,438,439S y/x = [242,438,439/(5-2)]½
8,989.6
where yi is the observed instrument response and yhat it the predicted instrument response given the “best fit”regression.
A-4
in the “Parameter Estimates” box of Figure 1) is as follows:
Y = 15120 + 1 973 098 * (Concentration)
where Y is the instrument response (peak height)
The estimated LOD and LOQ are calculated as follows (assuming these values are set tobe 3 and 10 standard deviations above the blank response, respectively):
1. The Peak Height at the LOD (Y ) is calculated at 3 times the standard deviationLOD
while the Peak Height at the LOQ (Y ) is calculated at 10 times the standardLOQ
deviation
Y = 15120 + 3 * (8987) = 42 081LOD
Y = 15120 + 10 * (8987) = 104 990LOQ

Parameter Estimates
Term
Intercept
Concentration
Estimate
15119.954
1973098.5
Std Error
5834.672
114317.5
t Ratio
2.59
17.26
Prob>|t|
0.0810
0.0004
Lower 95%
-3448.891
1609283.2
Upper 95%
33688.799
2336913.9
A-5
Figure 1. Statistical Results using JMP Software

The following information is derived and obtained from a November 4, 1999 IR-4 memo.10
A-6
M. These values (peak height at LOD and peak height and LOQ) are then used tocalculate the concentrations associated with these peak heights as follows:
Y = 15120 + 1 973 098 * (Concentration)
Rearranging,
Concentration = (Y - 15 120) / 1 973 098
Therefore,
LOD = Y - 15120 / 1 973 098 = (42 081 - 15 120)/1 973 098 = 0.014 ppm => 0.014LOD
LOQ = Y - 15 120/1 973 098 = (104 990 - 15 120)/ 1 973 098 = 0.046 ppm => 0.05LOQ
Thus, the initial estimated LOD and LOQ are 0.014 ppm and 0.046 ppm, respectivelywhich correspond to the IDL and IQL.
Again, these estimated LODs (or IDL) and LOQs (or IQLs) are expressed in terms of thesolution concentration and not in terms of the matrix concentration. At this stage, thesolution concentration (ug/mL solution) should be converted to the effective concentrationin the matrix (e.g., ug/g of matrix).
STEP 2
With the initial estimate of LOD (or IDL) and LOQ (or IQL) obtained and linearityverified, STEP 2 involves estimating the LOQ and LOD in spiked matrix samples. Thisprocedure uses the estimated instrumental LOQ and the procedure detailed in 40 CFRPart 136, Appendix B and in the Handbook of Environmental Analysis to provide a betterestimate of LOQ and verify that method recoveries are acceptable . 10
The method calls for the analysis of 7 or more (n) untreated control samples spiked at theestimated LOQ. The standard deviation of these samples is measured and the LOD andLOQ are determined as follows:
LOD= t x S0.99
LOQ = 3 x LOD

A-7
where t = one-tailed t-statistic at the 99% confidence level for n-1 replicates
S = Standard Deviation of n samples spikes at the estimated LOQ
The following is a set of t values for use in the above equation:
# of Replicates Degrees of t # of Replicates Degrees of t(n) Freedom (n) Freedom
(n-1) (n-1)
0.99 0.99
3 2 6.965 13 12 2.681
4 3 4.541 14 13 2.650
5 4 3.747 15 14 2.624
6 5 3.365 16 15 2.602
7 6 3.143 17 16 2.583
8 7 2.998 18 17 2.567
9 8 2.896 19 18 2.552
10 9 2.821 20 19 2.539
11 10 2.764 21 20 2.528
12 11 2.718 22 21 2.518
In this example, the analyst prepared 7 untreated control samples spiked at the aboveestimated LOQ of 0.05 ppm. The following results were obtained:
Concentration Detected % Recovery(ppm)
0.0397 79.4%
0.0403 80.6%
0.0400 80%
0.036 72.0%
0.0498 99.6%
0.0379 75.8%
0.0388 77.6%

A-8
Average Concentration: 0.0404 ppmStandard Deviation: 0.0044 ppm
Average Recovery: 80.7%
Given that recoveries are adequate at the LOQ (average = 80.7%, range = 72.0-99.6%),the LOD and LOQ for the method are estimated as follows:
LOD= t x S (for 7-1 = 6 degrees of freedom)0.99
= 3.365 x 0.0044 ppm
= 0.0148 ppm
LOQ = 3 x LOD
= 3 * 0.0148 ppm
= 0.0444 ppm