US Department of Transportation Federal Transit Administration
37
US Department of Transportation Federal Transit Administration PREDICTED VERSUS ACTUAL IMPACTS OF CAPITAL INVESTMENT GRANTS PROJECTS - 2020 CAPITAL COST AND RIDERSHIP Prepared by: Federal Transit Administration Office of Planning and Environment
Transcript of US Department of Transportation Federal Transit Administration

US Department of Transportation Federal Transit Administration
PREDICTED VERSUS ACTUAL IMPACTS OF CAPITAL INVESTMENT GRANTS PROJECTS - 2020
CAPITAL COST AND RIDERSHIP Prepared by: Federal Transit Administration Office of Planning and Environment
2
Table of Contents
1. Introduction ............................................................................................................................. 3
1.1. Previous Predicted versus Actual Studies ........................................................................ 3
1.2. Before and After (B&A) studies ...................................................................................... 6
1.3. Summary of Findings from 1990, 2003, 2007 studies ..................................................... 8 2. Predicted versus Actual Capital Costs ..................................................................................... 9
2.1. Methodology .................................................................................................................... 9
2.2. Findings from the Current Set of Projects ...................................................................... 12
2.3. Comparisons across the Four PvA Studies .................................................................... 19 3. Predicted versus Actual Ridership ......................................................................................... 22
3.1. Methodology .................................................................................................................. 22
3.2. Findings from the Current Set of Projects ...................................................................... 26
3.3. Comparisons across the Four PvA Studies .................................................................... 30 3.4. Sources of Improvement ................................................................................................ 33
4. Conclusion ............................................................................................................................. 35
3
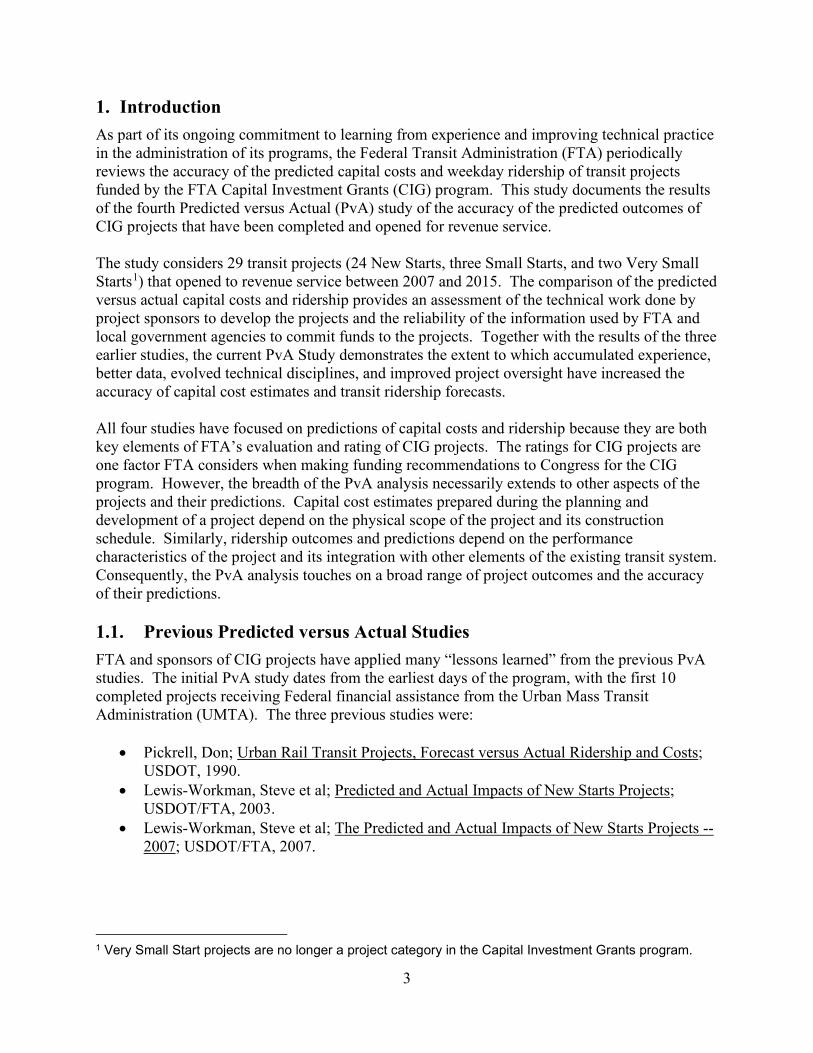
1. Introduction As part of its ongoing commitment to learning from experience and improving technical practice in the administration of its programs, the Federal Transit Administration (FTA) periodically reviews the accuracy of the predicted capital costs and weekday ridership of transit projects funded by the FTA Capital Investment Grants (CIG) program. This study documents the results of the fourth Predicted versus Actual (PvA) study of the accuracy of the predicted outcomes of CIG projects that have been completed and opened for revenue service. The study considers 29 transit projects (24 New Starts, three Small Starts, and two Very Small Starts1) that opened to revenue service between 2007 and 2015. The comparison of the predicted versus actual capital costs and ridership provides an assessment of the technical work done by project sponsors to develop the projects and the reliability of the information used by FTA and local government agencies to commit funds to the projects. Together with the results of the three earlier studies, the current PvA Study demonstrates the extent to which accumulated experience, better data, evolved technical disciplines, and improved project oversight have increased the accuracy of capital cost estimates and transit ridership forecasts. All four studies have focused on predictions of capital costs and ridership because they are both key elements of FTA’s evaluation and rating of CIG projects. The ratings for CIG projects are one factor FTA considers when making funding recommendations to Congress for the CIG program. However, the breadth of the PvA analysis necessarily extends to other aspects of the projects and their predictions. Capital cost estimates prepared during the planning and development of a project depend on the physical scope of the project and its construction schedule. Similarly, ridership outcomes and predictions depend on the performance characteristics of the project and its integration with other elements of the existing transit system. Consequently, the PvA analysis touches on a broad range of project outcomes and the accuracy of their predictions. 1.1. Previous Predicted versus Actual Studies FTA and sponsors of CIG projects have applied many “lessons learned” from the previous PvA studies. The initial PvA study dates from the earliest days of the program, with the first 10 completed projects receiving Federal financial assistance from the Urban Mass Transit Administration (UMTA). The three previous studies were:
• Pickrell, Don; Urban Rail Transit Projects, Forecast versus Actual Ridership and Costs; USDOT, 1990.
• Lewis-Workman, Steve et al; Predicted and Actual Impacts of New Starts Projects; USDOT/FTA, 2003.
• Lewis-Workman, Steve et al; The Predicted and Actual Impacts of New Starts Projects --2007; USDOT/FTA, 2007.
1 Very Small Start projects are no longer a project category in the Capital Investment Grants program.
4
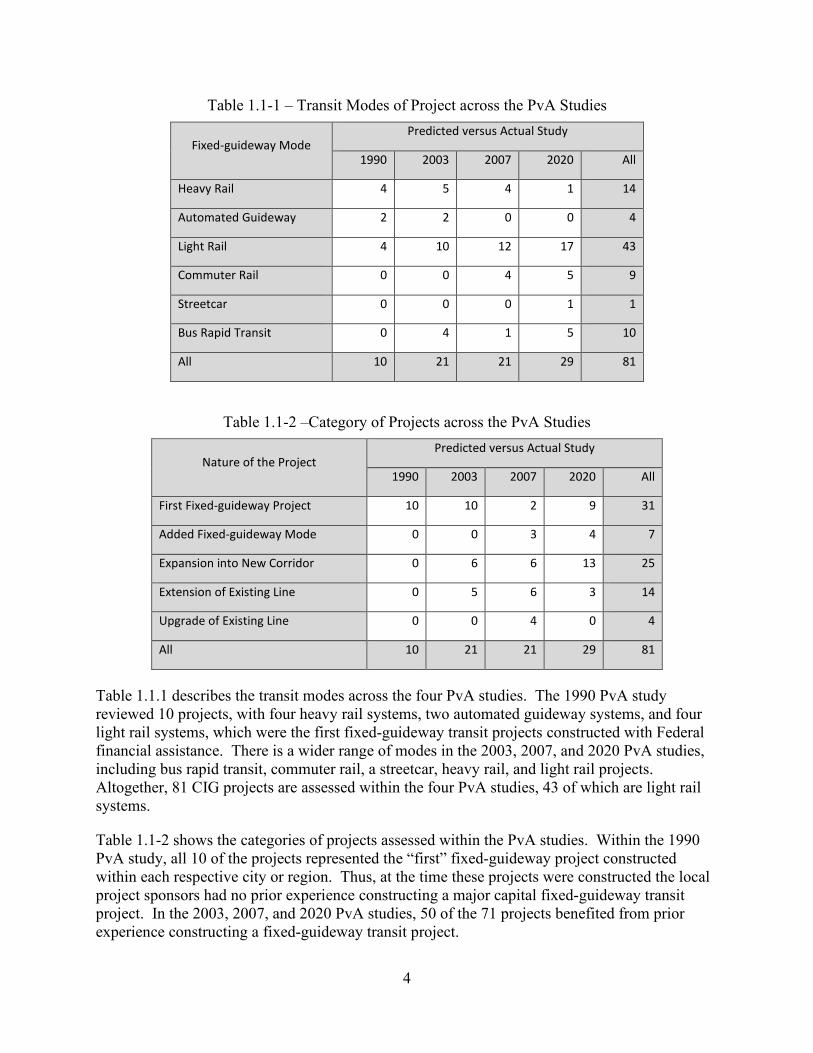
Table 1.1-1 – Transit Modes of Project across the PvA Studies
Fixed-guideway Mode Predicted versus Actual Study
1990 2003 2007 2020 All
Heavy Rail 4 5 4 1 14
Automated Guideway 2 2 0 0 4
Light Rail 4 10 12 17 43
Commuter Rail 0 0 4 5 9
Streetcar 0 0 0 1 1
Bus Rapid Transit 0 4 1 5 10
All 10 21 21 29 81
Table 1.1-2 –Category of Projects across the PvA Studies
Nature of the Project Predicted versus Actual Study
1990 2003 2007 2020 All
First Fixed-guideway Project 10 10 2 9 31
Added Fixed-guideway Mode 0 0 3 4 7
Expansion into New Corridor 0 6 6 13 25
Extension of Existing Line 0 5 6 3 14
Upgrade of Existing Line 0 0 4 0 4
All 10 21 21 29 81
Table 1.1.1 describes the transit modes across the four PvA studies. The 1990 PvA study reviewed 10 projects, with four heavy rail systems, two automated guideway systems, and four light rail systems, which were the first fixed-guideway transit projects constructed with Federal financial assistance. There is a wider range of modes in the 2003, 2007, and 2020 PvA studies, including bus rapid transit, commuter rail, a streetcar, heavy rail, and light rail projects. Altogether, 81 CIG projects are assessed within the four PvA studies, 43 of which are light rail systems.
Table 1.1-2 shows the categories of projects assessed within the PvA studies. Within the 1990 PvA study, all 10 of the projects represented the “first” fixed-guideway project constructed within each respective city or region. Thus, at the time these projects were constructed the local project sponsors had no prior experience constructing a major capital fixed-guideway transit project. In the 2003, 2007, and 2020 PvA studies, 50 of the 71 projects benefited from prior experience constructing a fixed-guideway transit project.
5
The 1990 study considered 10 of the earliest Federally-funded major capital projects. Below is a summary:
• Capital Costs: At that time, the methods used for capital cost estimation were unreliable. Of the nine projects that prepared a capital cost estimate, the actual cost of only one project was within 20 percent of the original cost estimate, six of nine projects were between 30 and 100 percent above their original estimates, and two projects were more than double (over 100 percent of) their cost estimates. On average, the actual cost of projects exceeded their cost estimates by 77 percent.
• Ridership: During the early efforts for CIG project planning, the methods applied to
predict ridership were generally unreliable. In 2007, FTA performed an update of the actual ridership for the projects included in the 1990 study. This analysis concluded that none of the 10 projects achieved, at the time of the analysis, ridership greater than 76 percent of their forecasts. Seven of the 10 projects had achieved less than 50 percent of their forecasts. On average, these projects achieved just 42 percent of their ridership forecasts.
The 2003 study examined 21 projects completed between 1990 and 2002, 19 of which had ridership predictions available. Below is a summary:
• Capital Costs: FTA found that the accuracy of the capital cost estimates had improved markedly since the 1990 PvA Study, but still systematically underestimated actual project costs. The actual capital cost of CIG projects were, on average, 21 percent greater than the inflation-adjusted predictions prepared during alternatives analysis, 14-percent greater than the predictions entering final design, and 7-percent greater than the predictions at execution of the FFGA (Full Funding Grant Agreement).
• Ridership: FTA found that ridership forecasts had also improved since the 1990 study.
However, CIG project sponsors tended to overpredict the actual ridership achieved by their projects. The results indicate that, as of 2002, four projects exceeded their initial ridership forecasts and five projects exceeded 80 percent of their initial ridership forecasts. All told, nine of the 19 projects included in that study either achieved, or had a reasonable likelihood of coming within a reasonable range (±20 percent), of their ridership forecasts. On average, this group of projects achieved 67 percent of their forecasted ridership.
The 2007 study examined 21 CIG projects completed between 2003 and 2007, 18 of which had ridership predictions available. Below is a summary:
• Capital costs: On average, for the 21 projects, actual construction costs exceeded the predictions developed during the alternatives analysis phase by an average of 40 percent, exceeded the cost estimate predictions developed at the entry into final design phase by 12 percent, and exceeded the cost estimate predictions developed at execution of the FFGA by six percent. The sum of all the New Starts projects’ actual capital costs exceeded the sum of their original inflation-adjusted FFGA amounts by $1.54 billion.

6
Over 60 percent ($948 million) of this amount was due to a single project (i.e., Tren Urbano). At the same time, 12 of the 21 projects had actual capital costs that were less than the FFGA inflation-adjusted estimate. Due in part to the inclusion of the Tren Urbano project in the 2007 PvA study, the average error in cost estimates for the projects in the 2007 study is higher than the average error for the projects in the 2003 study. However, the cost estimates analyzed for the 2003 and 2007 studies combined are more accurate than the cost estimates analyzed in the 1990 PvA study.
• Ridership: FTA found that eight out of 18 projects for which ridership data was
available had actual ridership exceeding 80 percent of the forecast ridership developed during the alternatives analysis phase. The same eight projects also exceeded 80 percent of the ridership forecasts developed when entering the final design phase. The projects in this study carried, on average, 75 percent of their alternatives analysis forecast ridership and 72 percent of the forecasts prepared before entering final design. Ridership forecasts analyzed in the 2007 PvA study are slightly more accurate than the forecasts in FTA’s 2003 study and are significantly more accurate than the forecasts analyzed in the 1990 PvA study.
1.2. Before and After (B&A) Studies
Since 2001, project sponsors receiving a Full Funding Grant Agreement (FFGA) for construction have been required to prepare a Before-and-After Study (B&A Study) as a condition of each FFGA, and as required since 2005 by Federal transit law at 49 U.S.C. § 5309(k)(2)(E). The B&A Studies are intended to: assess the impact of CIG projects on public transportation, compare the actual and forecast costs, service levels, scope of the projects and ridership two years after opening, and identify the sources of any differences between predicted and actual outcomes. Federal transit law requires B&A Studies for New Starts and Core Capacity projects at 49 U.S.C. § 5309(k)(2)(E)(i)(I). In addition, FTA encourages, but does not require, project sponsors to perform B&A Studies for Small Starts projects. Because of this statutory requirement, FTA has an extensive library of B&A Studies that were used to develop the 2020 PvA Study. The B&A Study summaries are located on the FTA public website at https://www.transit.dot.gov/funding/grant-programs/capital-investments/and-after-studies-new-starts-projects. FTA is required to submit a B&A Study Report to Congress annually, and those summaries provided a useful resource for this version of the PvA analysis of capital cost and ridership. The B&A Study summary for each project identifies the specific reasons why a specific project had a higher (or lower) capital cost estimate or ridership forecast compared to their actual capital cost or ridership. Projects Considered in the Current Predicted versus Actual Study Within the 2020 PvA study, FTA assessed the predicted versus actual outcomes for 29 CIG projects. Two of these projects were not required to submit travel forecasts because they were exempt from the CIG evaluation and rating process. Thus, 27 projects submitted travel forecasts for CIG project evaluation. These projects were constructed and opened to revenue service

7
between 2007 and 2015 and represent a variety of transit modes including light rail, heavy rail, commuter rail, and bus rapid transit systems. A significant proportion of the projects were the “first” fixed-guideway projects constructed in that city/region, while others were extensions to existing systems. Finally, several projects introduce a new transit mode to a region that already had fixed-guideway transit. The information used to assess the projects’ capital costs and ridership in the 2020 PvA Study has a greater level of consistency than the prior PvA studies. For example, each of the projects within the 2020 PvA study applied a similar method to calculate capital costs and entered their cost estimates into a Standard Cost Category excel workbook developed and maintained by FTA. Additionally, almost all the projects developed an opening year ridership forecast that could be used for the predicted versus actual ridership estimates and results. In prior PvA studies, the CIG projects did not develop opening year ridership forecasts. Thus, the earlier PvA studies had to use ridership forecasts based on a “20-year forecast.” This has made the compilation of the data in the 2020 PvA study to be based upon the information provided directly by project sponsors, with less interpretation and correction by FTA, compared to the prior PvA studies. Table 1.3-1 shows the 29 projects reviewed in the 2020 PvA study. The table shows the state and metropolitan area of the project, as well as the project name and mode (light rail, commuter rail, bus rapid transit, streetcar, and heavy rail). It also notes if it is the first fixed-guideway project, an additional mode for an existing transit system, or an expansion an existing fixed-guideway transit system. Finally, the table notes if the project is a New Start, Small Start, or Very Small Start project and the year it opened for revenue service. Additional information about any of these projects may be found within the B&A Study report summary located on FTA’s public website linked above.
Table 1.3-1 – Projects in the 2020 Predicted versus Actual Study
State Metro Area Project Mode Nature Type Open
NC Charlotte South Corridor LRT LR 1ST NS 2007 UT Salt Lake City Weber County to Salt Lake City Commuter Rail CR ADD NS 2008 AZ Phoenix Central Phoenix / East Valley Light Rail LR 1ST NS 2008 OH Cleveland Euclid Corridor Transportation Project BRT ADD NS 2008 CA San Diego Oceanside-Escondido Rail Corridor CR EXP NS 2008 OR Portland South Corridor I-205/Portland Mall LRT LR EXP NS 2009 OR Portland Wilsonville to Beaverton Commuter Rail CR ADD NS 2009 CA Los Angeles Metro Gold Line East Side Extension LR EXP NS 2009 MN Minneapolis Northstar Corridor Rail CR ADD NS 2009 WA Seattle Central Link Initial Segment LR 1ST NS 2009 TX Dallas Northwest/Southeast LRT MOS LR EXP NS 2010 AZ Flagstaff Mountain Links BRT BRT 1ST VSS 2011 UT Salt Lake City Mid Jordan LRT LR EXP NS 2011 VA Norfolk Norfolk LRT LR 1ST NS 2011 PA Pittsburgh North Shore LRT Connector LR EXP NS 2012 OR Portland Streetcar Loop SC EXP SS 2012 CO Denver West Corridor LRT LR EXP NS 2013

8
TX Houston North Corridor LRT LR EXP NS 2013 UT Salt Lake City Draper Transit Corridor LR EXT NS 2013 FL Orlando Central Florida Commuter Rail -- Initial Segment CR 1ST NS 2014 CO Fort Collins Mason Corridor BRT BRT 1ST SS 2014
MN Minneapolis-St. Paul Central Corridor LRT LR EXP NS 2014
VA Dulles Dulles Corridor Metrorail Extension to Wiehle Ave. HR EXP NS 2014 CA Sacramento South Sacramento Corridor Phase 2 LR EXT NS 2014 TX Austin MetroRapid BRT BRT 1ST VSS 2014 CN Hartford New Britain - Hartford Busway BRT 1ST NS 2015 TX Houston Southeast Corridor LRT LR EXP NS 2015 AZ Phoenix Central Mesa LRT Extension LR EXT SS 2015 OR Portland Portland-Milwaukie Light Rail LR EXP NS 2015
Abbreviations: LR light rail 1ST first fixed-guideway mode NS New Starts CR commuter rail ADD added fixed-guideway mode SS Small Starts SC streetcar EXP expansion into a new corridor VSS Very Small Starts BRT bus rapid transit EXT extension of an existing line
1.3. Summary of Findings from 1990, 2003, 2007 studies The FTA and the transit industry have applied numerous “lessons learned” from the 1990, 2003, and 2007 PvA Studies. The following are examples of how these PvA studies have been applied to improve the accuracy of capital cost and ridership forecasts prepared for the CIG program:
• FTA improved methods to estimate capital costs and ridership forecasts;
• FTA applied a “risk assessment” methodology to project scope estimates, schedule, and capital cost estimates; and
• FTA maintained proactive oversight of projects undertaking engineering and construction.
These methods have been adopted by CIG project sponsors since the early 2000’s, resulting in better data and information to assess PvA capital cost and ridership forecasts prepared for CIG projects. The B&A Studies provide a useful resource for identifying the reasons for the differences in predicted and actual capital cost and ridership of CIG projects. The availability of the 29 B&A Studies provided a solid foundation for the analysis in the 2020 PvA Study of Capital Costs and Ridership. Therefore, this study considers a larger number of projects than each of the prior PvA Studies and is based upon higher quality and more consistent data than the prior PvA studies.
9
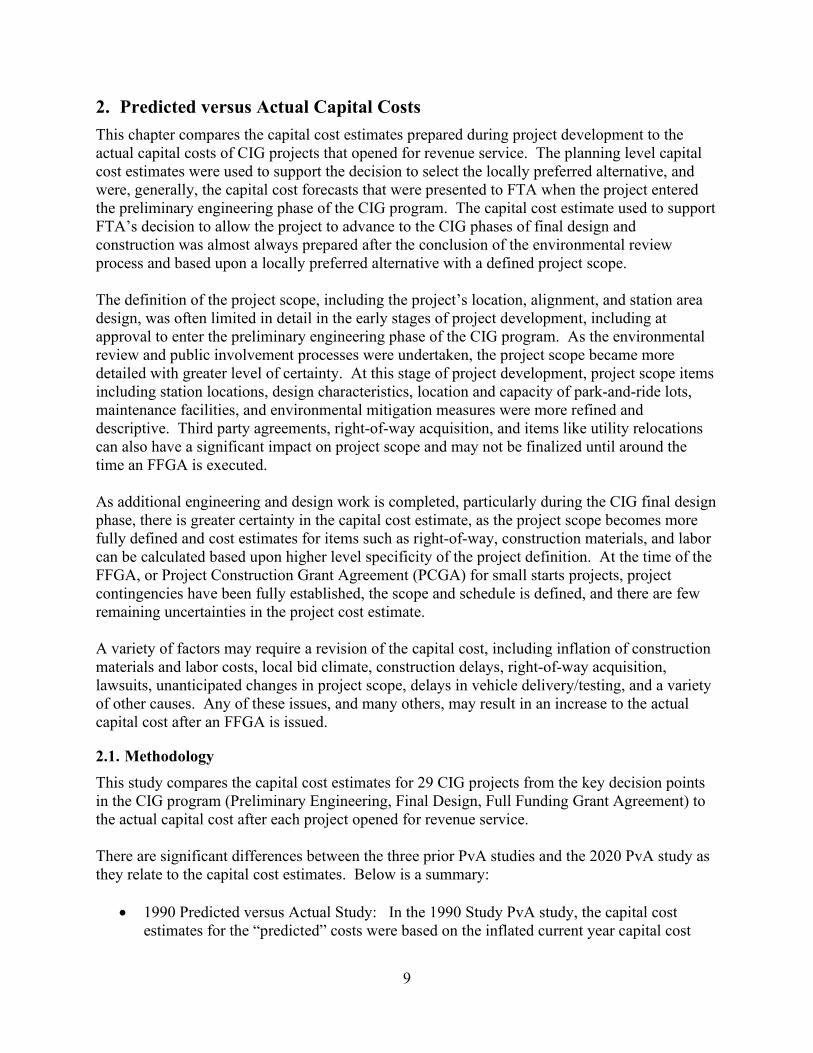
2. Predicted versus Actual Capital Costs This chapter compares the capital cost estimates prepared during project development to the actual capital costs of CIG projects that opened for revenue service. The planning level capital cost estimates were used to support the decision to select the locally preferred alternative, and were, generally, the capital cost forecasts that were presented to FTA when the project entered the preliminary engineering phase of the CIG program. The capital cost estimate used to support FTA’s decision to allow the project to advance to the CIG phases of final design and construction was almost always prepared after the conclusion of the environmental review process and based upon a locally preferred alternative with a defined project scope. The definition of the project scope, including the project’s location, alignment, and station area design, was often limited in detail in the early stages of project development, including at approval to enter the preliminary engineering phase of the CIG program. As the environmental review and public involvement processes were undertaken, the project scope became more detailed with greater level of certainty. At this stage of project development, project scope items including station locations, design characteristics, location and capacity of park-and-ride lots, maintenance facilities, and environmental mitigation measures were more refined and descriptive. Third party agreements, right-of-way acquisition, and items like utility relocations can also have a significant impact on project scope and may not be finalized until around the time an FFGA is executed. As additional engineering and design work is completed, particularly during the CIG final design phase, there is greater certainty in the capital cost estimate, as the project scope becomes more fully defined and cost estimates for items such as right-of-way, construction materials, and labor can be calculated based upon higher level specificity of the project definition. At the time of the FFGA, or Project Construction Grant Agreement (PCGA) for small starts projects, project contingencies have been fully established, the scope and schedule is defined, and there are few remaining uncertainties in the project cost estimate. A variety of factors may require a revision of the capital cost, including inflation of construction materials and labor costs, local bid climate, construction delays, right-of-way acquisition, lawsuits, unanticipated changes in project scope, delays in vehicle delivery/testing, and a variety of other causes. Any of these issues, and many others, may result in an increase to the actual capital cost after an FFGA is issued.
2.1. Methodology This study compares the capital cost estimates for 29 CIG projects from the key decision points in the CIG program (Preliminary Engineering, Final Design, Full Funding Grant Agreement) to the actual capital cost after each project opened for revenue service. There are significant differences between the three prior PvA studies and the 2020 PvA study as they relate to the capital cost estimates. Below is a summary:
• 1990 Predicted versus Actual Study: In the 1990 Study PvA study, the capital cost estimates for the “predicted” costs were based on the inflated current year capital cost

10
estimate at the CIG preliminary engineering phase, and the “actual” costs were based on the final construction cost.
• 2003 and 2007 Predicted versus Actual Study: The 2003 and 2007 studies based the
“predicted” capital cost on the “current year” capital cost estimate at the time the FFGA was awarded, and the “actual” capital cost in the “current year” capital cost at the completion of construction.
• The 2020 Predicted versus Actual Study benefited from the availability of the FTA
Standard Category Cost excel workbooks, and the “predicted” capital costs are based upon the PD or FFGA Year of Expenditure (YOE) escalated capital cost estimates compared to the “actual” capital cost estimate at the completion of construction.
Table 2.1-1 shows the 29 projects in the 2020 PvA study and the estimates of capital costs at entry into Preliminary Engineering (PE), entry into Final Design (FD), at FFGA (or Project Construction Grant Agreement) and the actual capital cost of the project. The remainder of the analysis in this chapter is based upon the information in this table.

11
Table 2.1-1: All projects; actual capital cost and all predictions
Project Characteristics Milestone Years Capital Cost in YOE Dollars
Project Mode Nature Type Open PE Entry
FD Entry
FFGA/ PCGA Actual PE
Entry FD
Entry FFGA/ PCGA
CLT-S LR 1ST NS 2007 2000 2003 2007 $463 $331 $371 $463 SLC-CR CR ADD NS 2008 2003 2005 2006 $614 $408 $581 $612 PHX-EV LR 1ST NS 2008 1998 2003 2005 $1,315 $1,076 $1,174 $1,253 CLE-EUC BRT ADD NS 2008 1997 2002 2004 $197 $177 $229 $197 SD-CR CR EXP NS 2008 1995 2000 2006 $478 $214 $332 $484 PLD-GRN LR EXP NS 2009 2004 2005 2007 $576 $495 $557 $576 PLD-CR CR ADD NS 2009 2001 2004 2008 $162 $85 $104 $117 LA-GLD LR EXP NS 2009 2000 2002 2004 $899 $760 $818 $899 MSP-CR CR ADD NS 2009 2005 2006 2007 $309 $265 $307 $317 SEA-APT LR 1ST NS 2009 1997 2000 2008 $2,558 $1,858 $2,651 $2,680 DAL-N/S LR EXP NS 2010 2001 2005 2006 $1,406 $1,151 $1,490 $1,406 FLG BRT 1ST VSS 2011 2009 --- 2011 $8 $10 --- $8 SLC-MJ LR EXP NS 2011 2007 2008 2009 $510 $522 $510 $535 NFK LR 1ST NS 2011 2002 2006 2007 $315 $195 $235 $232 PBG-NS LR EXP NS 2012 2001 2003 2006 $514 $110 $390 $539 PLD-SC SC EXP SS 2012 2007 --- 2009 $149 $152 --- $149 DEN-W LR EXP NS 2013 2001 2005 2009 $710 $555 $74 $692 HOU-RED LR EXP NS 2013 2008 2009 2011 $601 $641 $612 $654 SLC-DRA LR EXT NS 2013 2009 2010 2011 $146 $212 $194 $194 ORL-SUN1 CR 1ST NS 2014 2007 2008 2011 $357 $362 $357 $357 FTC-MAS BRT 1ST SS 2014 2007 --- 2012 $83 $74 --- $87 MSP-CC LR EXP NS 2014 2006 2010 2011 $926 $932 $957 $957 DULLES HR EXP NS 2014 2004 2008 2009 $3,047 $1,521 $2,988 $3,142 SAC-SX LR EXT NS 2014 2005 2012 2012 $270 $153 $270 $270 AUS-BRT BRT 1ST VSS 2014 2009 --- 2012 $39 $47 --- $48 HFD-NB BRT 1ST NS 2015 2000 2006 2011 $546 $88 $459 $567 HOU-PRP LR EXP NS 2015 2008 2009 2011 $728 $591 $730 $762 PHX-MSA LR EXT SS 2015 2010 --- 2012 $197 $198 --- $199 PLD-MIL LR EXP NS 2015 2009 2011 2012 $1,463 $1,418 $1,490 $1,490 Abbreviations: LR light rail 1ST first fixed-guideway mode NS New Starts
CR commuter rail ADD added fixed-guideway mode SS Small Starts SC streetcar EXP expansion into a new corridor VSS Very Small Starts BRT bus rapid transit EXT extension of an existing line
12
2.2. Findings from the Current Set of Projects
Predicted versus Actual Capital Cost at the PE/PD Milestone
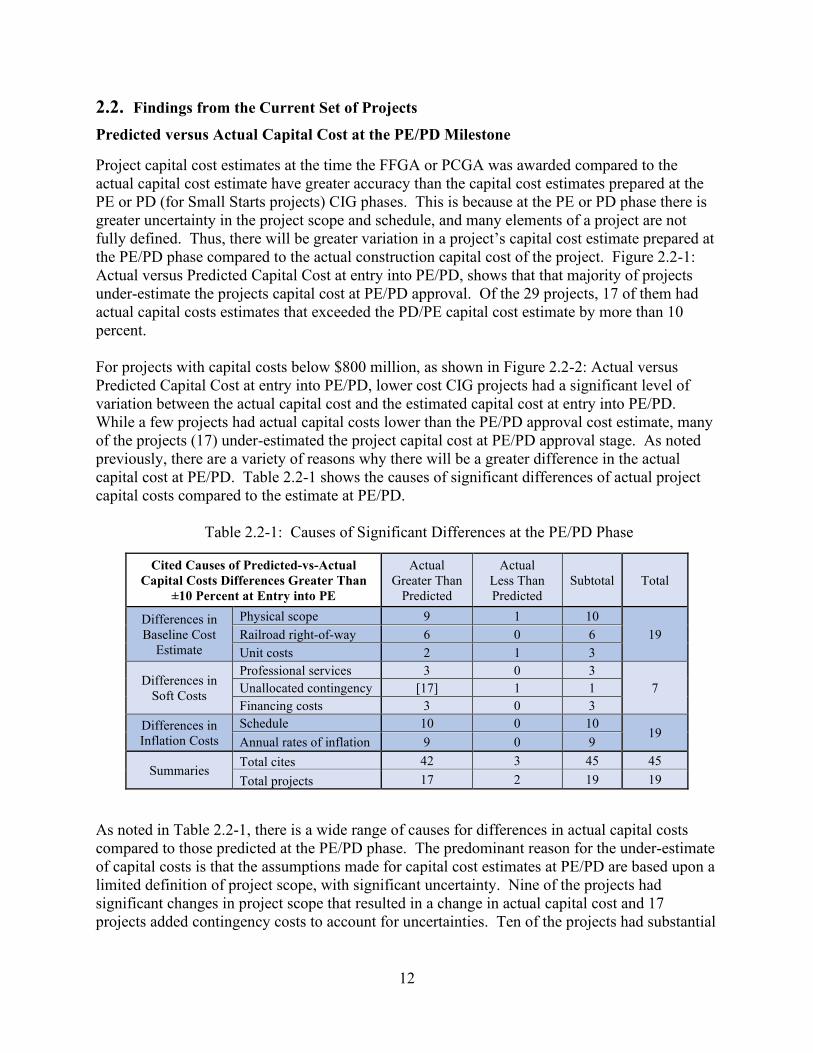
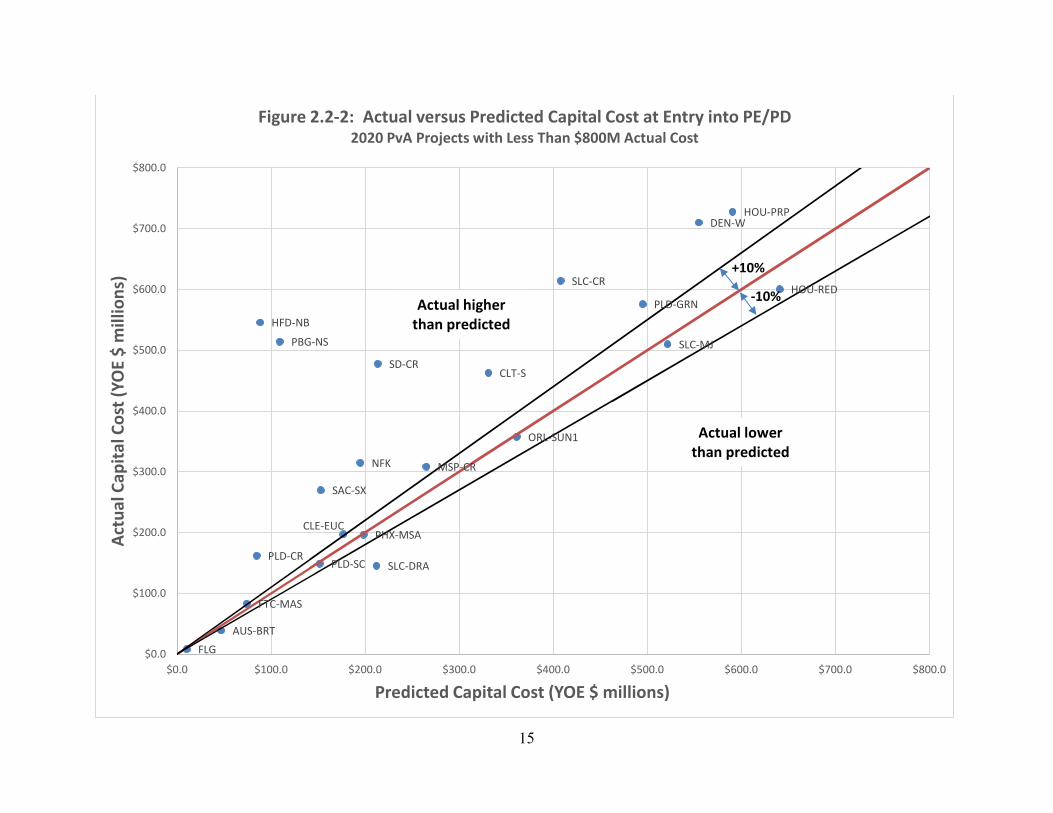
Project capital cost estimates at the time the FFGA or PCGA was awarded compared to the actual capital cost estimate have greater accuracy than the capital cost estimates prepared at the PE or PD (for Small Starts projects) CIG phases. This is because at the PE or PD phase there is greater uncertainty in the project scope and schedule, and many elements of a project are not fully defined. Thus, there will be greater variation in a project’s capital cost estimate prepared at the PE/PD phase compared to the actual construction capital cost of the project. Figure 2.2-1: Actual versus Predicted Capital Cost at entry into PE/PD, shows that that majority of projects under-estimate the projects capital cost at PE/PD approval. Of the 29 projects, 17 of them had actual capital costs estimates that exceeded the PD/PE capital cost estimate by more than 10 percent. For projects with capital costs below $800 million, as shown in Figure 2.2-2: Actual versus Predicted Capital Cost at entry into PE/PD, lower cost CIG projects had a significant level of variation between the actual capital cost and the estimated capital cost at entry into PE/PD. While a few projects had actual capital costs lower than the PE/PD approval cost estimate, many of the projects (17) under-estimated the project capital cost at PE/PD approval stage. As noted previously, there are a variety of reasons why there will be a greater difference in the actual capital cost at PE/PD. Table 2.2-1 shows the causes of significant differences of actual project capital costs compared to the estimate at PE/PD.
Table 2.2-1: Causes of Significant Differences at the PE/PD Phase
Cited Causes of Predicted-vs-Actual Capital Costs Differences Greater Than
±10 Percent at Entry into PE
Actual Greater Than
Predicted
Actual Less Than Predicted
Subtotal Total
Differences in Baseline Cost
Estimate
Physical scope 9 1 10 19 Railroad right-of-way 6 0 6
Unit costs 2 1 3
Differences in Soft Costs
Professional services 3 0 3 7 Unallocated contingency [17] 1 1
Financing costs 3 0 3 Differences in Inflation Costs
Schedule 10 0 10 19
Annual rates of inflation 9 0 9
Summaries Total cites 42 3 45 45 Total projects 17 2 19 19
As noted in Table 2.2-1, there is a wide range of causes for differences in actual capital costs compared to those predicted at the PE/PD phase. The predominant reason for the under-estimate of capital costs is that the assumptions made for capital cost estimates at PE/PD are based upon a limited definition of project scope, with significant uncertainty. Nine of the projects had significant changes in project scope that resulted in a change in actual capital cost and 17 projects added contingency costs to account for uncertainties. Ten of the projects had substantial

13
changes in their project schedules. A delay in a project schedule typically results in inflation of materials or labor that can substantially increase construction costs.

14
PHX-EV
LA-GLD
SEA-APT
DAL-N/S
MSP-CC
DULLES
PLD-MIL
$0.0
$500.0
$1,000.0
$1,500.0
$2,000.0
$2,500.0
$3,000.0
$3,500.0
$0.0 $500.0 $1,000.0 $1,500.0 $2,000.0 $2,500.0 $3,000.0 $3,500.0
Actu
al C
apita
l Cos
t (YO
E $
mill
ions
)
Predicted Capital Cost (YOE $ millions)
Figure 2.2-1: Actual versus Predicted Capital Cost at Entry into PE/PDAll 2020 PvA Projects
Actual higher than predicted
Actual lower than predicted
Enlarged on next slide
+10%
-10%Actual higher
than predicted
15
CLT-S
SLC-CR
CLE-EUC
SD-CR
PLD-GRN
PLD-CR
MSP-CR
FLG
SLC-MJ
NFK
PBG-NS
PLD-SC
DEN-W
HOU-RED
SLC-DRA
ORL-SUN1
FTC-MAS
SAC-SX
AUS-BRT
HFD-NB
HOU-PRP
PHX-MSA
$0.0
$100.0
$200.0
$300.0
$400.0
$500.0
$600.0
$700.0
$800.0
$0.0 $100.0 $200.0 $300.0 $400.0 $500.0 $600.0 $700.0 $800.0
Actu
al C
apita
l Cos
t (YO
E $
mill
ions
)
Predicted Capital Cost (YOE $ millions)
Figure 2.2-2: Actual versus Predicted Capital Cost at Entry into PE/PD2020 PvA Projects with Less Than $800M Actual Cost
Actual higher than predicted
Actual lower than predicted
-10%
+10%

16
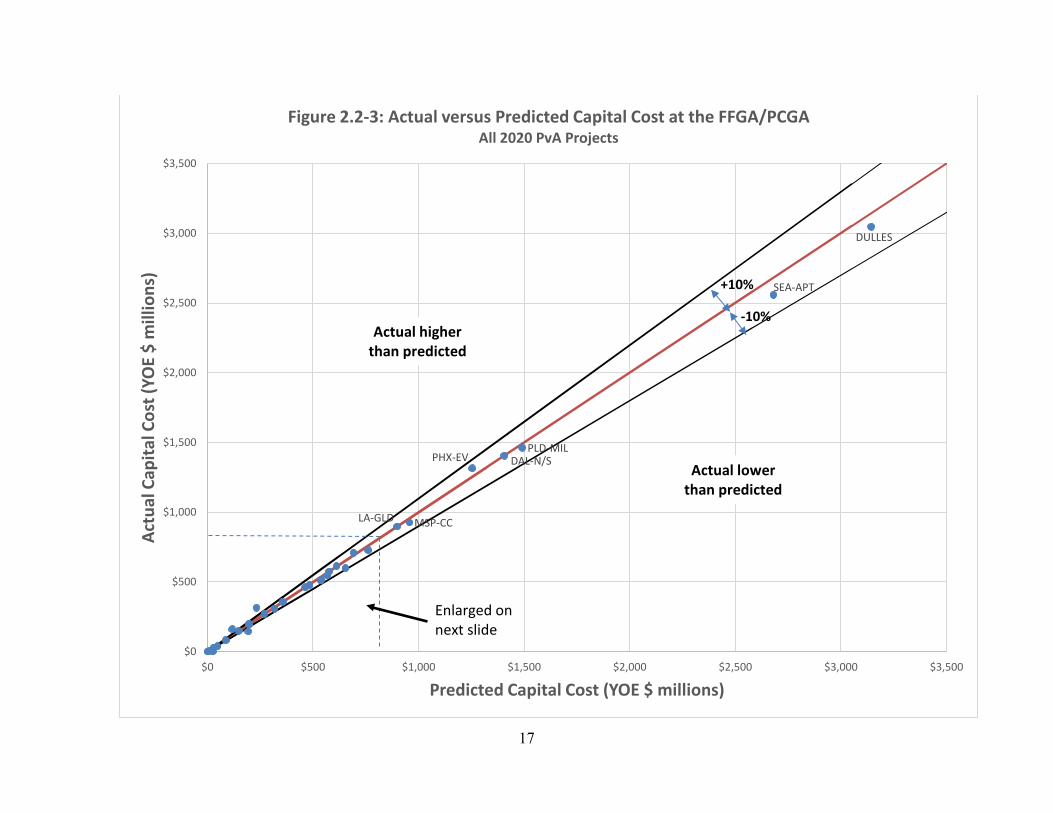
Predicted versus Actual Capital Cost at the FFGA/PCGA Most of the CIG projects with capital costs above $800 million have actual capital costs that are within 10 percent of the construction cost estimate at FFGA or PCGA, as shown in Figure 2.2-3, Actual versus Predicted Capital Cost at the FFGA/PCGA (projects over $800M). Two CIG projects with capital costs below $800 million exceed their capital cost estimate by greater than 10 percent, per Figure 2.2-4 Actual versus Predicted Capital Cost at the FFGA/PCGA (projects under $800 M). However, most projects below $800 million in cost have been near, or slightly under, their capital cost estimate at the time the FFGA/PCGA was signed.
Table 2.2-2: Causes of Significant Differences at the FFGA/PCGA Cited Causes of Predicted-vs-Actual
Capital Costs Differences Greater Than ±10 Percent at the FFGA/PCGA
Actual Greater Than
Predicted
Actual Less Than Predicted
Subtotal Total
Differences in Baseline Cost
Estimate
Physical scope 1 1 2 5 Railroad right-of-way 1 0 1
Unit costs 1 1 2
Differences in Soft Costs
Professional services 1 0 1 2 Unallocated contingency [2] 1 1
Financing costs 0 0 0 Differences in Inflation Costs
Schedule 2 0 2 4
Annual rates of inflation 2 0 2
Summaries Total cites 8 3 11 11 Total projects 2 1 3 3
Table 2.2-2 shows the causes of the significant differences in the actual capital cost versus the predicted capital cost at the FFGA/PCGA. Two projects exceeded their capital cost estimate by greater than 10 percent primarily due to changes in project scope, project schedule delays, increases in inflation for materials and labor, and right-of-way costs. In many cases, a post-FFGA change in project scope has a ripple effect on the project schedule, with the resulting delay increasing capital cost through inflation, additional professional services, and increased unit costs beyond what the construction cost would have been without a change in project scope. Overall, 27 of the 29 project’s actual capital costs are within 10 percent of their FFGA construction cost estimate. This is because of several reasons: 1) increased levels of contingency applied prior to the issuance of an FFGA; 2) FTA’s requirement that any increase in a project’s capital cost after the FFGA be paid for with non-Federal funds (this is an added incentive to maintain the projects capital cost and scope after receipt of an FFGA); 3) many project sponsors had prior experience constructing CIG projects; and 4) proactive oversight by FTA and the project sponsor.
17
PHX-EV
LA-GLD
SEA-APT
DAL-N/S
MSP-CC
DULLES
PLD-MIL
$0
$500
$1,000
$1,500
$2,000
$2,500
$3,000
$3,500
$0 $500 $1,000 $1,500 $2,000 $2,500 $3,000 $3,500
Actu
al C
apita
l Cos
t (YO
E $
mill
ions
)
Predicted Capital Cost (YOE $ millions)
Figure 2.2-3: Actual versus Predicted Capital Cost at the FFGA/PCGAAll 2020 PvA Projects
Actual higher than predicted
Actual lower than predicted
Enlarged on next slide
+10%
-10%

18
CLT-S
SLC-CR
CLE-EUC
SD-CR
PLD-GRN
PLD-CR
MSP-CR
FLG
SLC-MJ
NFK
PBG-NS
PLD-SC
DEN-W
HOU-RED
SLC-DRA
ORL-SUN1
FTC-MAS
SAC-SX
AUS-BRT
HFD-NB
HOU-PRP
PHX-MSA
$0.0
$100.0
$200.0
$300.0
$400.0
$500.0
$600.0
$700.0
$800.0
$0.0 $100.0 $200.0 $300.0 $400.0 $500.0 $600.0 $700.0 $800.0
Actu
al C
apita
l Cos
t (YO
E $
mill
ions
)
Predicted Capital Cost (YOE $ millions)
Figure 2.2-4: Actual versus Predicted Capital Cost at the FFGA/PCGA2020 PvA Projects with Less Than $800M Actual Cost
Actual higher than predicted
Actual lower than predicted
+10%
-10%

19
The accuracy of a project’s capital cost estimate improves as the project’s scope becomes more fully defined. This takes place as project sponsors undertake the environmental review process, PE, and FD. As shown in Figure 2.2-5, the level of accuracy of a projects capital cost estimate, compared to the actual capital cost, improved substantially from entry to PE/PD to FD entry, and FFGA/PCGA, for the 29 projects in the 2020 PvA Study. As shown in the chart on the left of Figure 2.2-5, at entry into PE/PD, a small proportion (24 percent) of the project cost estimates were within 10 percent of the “actual project cost” after construction. Per the middle set of bar charts in the table above, at the entry to FD phase, the scope of the project is more fully defined, leading to significantly improved capital cost estimates, with 60 percent FD capital cost estimates within 10 percent of the actual construction costs. By the time a project is ready to receive an FFGA, there is greater certainty about the project scope, schedule, and budget and contingency funding is allocated to account for remaining uncertainties. Per the bar graphs on the right side of Figure 2.2-5, 86 percent of the projects’ actual capital costs came within 10 percent of the FFGA/PCGA capital cost estimate.
2.3. Comparisons across the Four PvA Studies In the thirty years between the 1990 and 2020 PvA study, there have been substantial improvements in the methods used to estimate capital costs of CIG projects. CIG project sponsors and FTA have employed techniques to proactively mitigate project risks, implement controls for cost and schedule, and apply prior experience gained during the construction of new transit projects through Project Construction Roundtables and Project Management Oversight (PMO) contractor reviews.
20
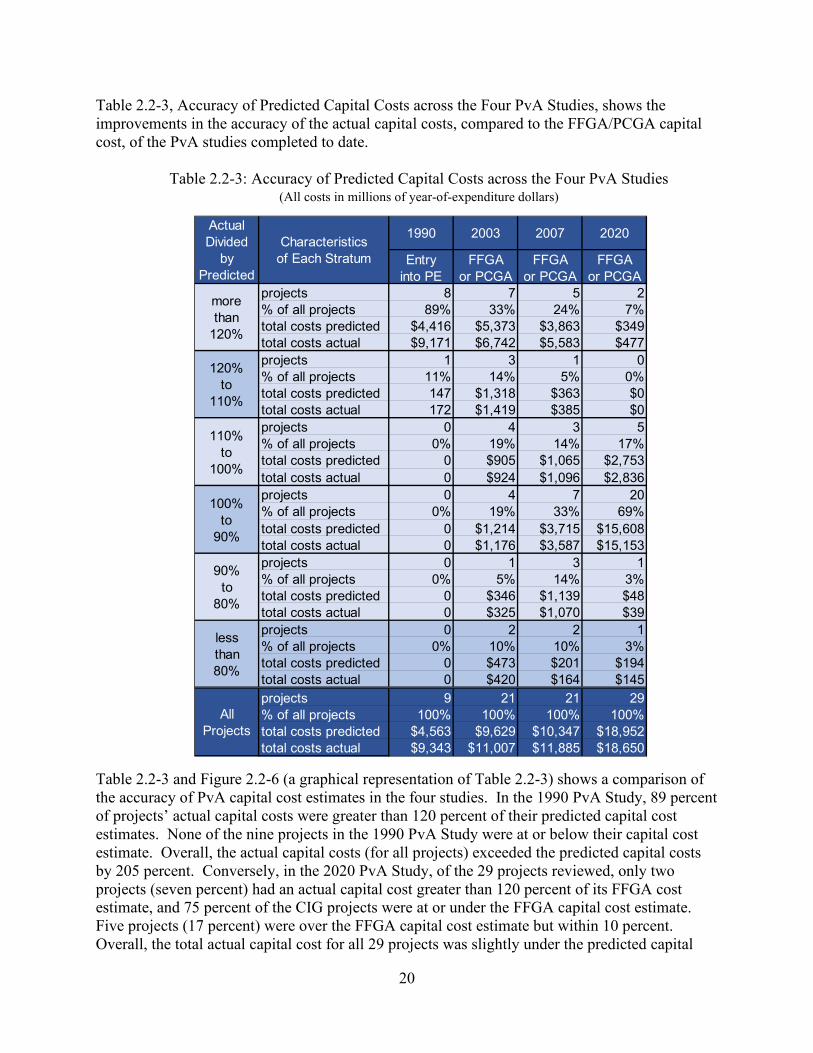
Table 2.2-3, Accuracy of Predicted Capital Costs across the Four PvA Studies, shows the improvements in the accuracy of the actual capital costs, compared to the FFGA/PCGA capital cost, of the PvA studies completed to date.
Table 2.2-3: Accuracy of Predicted Capital Costs across the Four PvA Studies (All costs in millions of year-of-expenditure dollars)
Table 2.2-3 and Figure 2.2-6 (a graphical representation of Table 2.2-3) shows a comparison of the accuracy of PvA capital cost estimates in the four studies. In the 1990 PvA Study, 89 percent of projects’ actual capital costs were greater than 120 percent of their predicted capital cost estimates. None of the nine projects in the 1990 PvA Study were at or below their capital cost estimate. Overall, the actual capital costs (for all projects) exceeded the predicted capital costs by 205 percent. Conversely, in the 2020 PvA Study, of the 29 projects reviewed, only two projects (seven percent) had an actual capital cost greater than 120 percent of its FFGA cost estimate, and 75 percent of the CIG projects were at or under the FFGA capital cost estimate. Five projects (17 percent) were over the FFGA capital cost estimate but within 10 percent. Overall, the total actual capital cost for all 29 projects was slightly under the predicted capital
projects 8 7 5 2% of all projects 89% 33% 24% 7%total costs predicted $4,416 $5,373 $3,863 $349total costs actual $9,171 $6,742 $5,583 $477projects 1 3 1 0% of all projects 11% 14% 5% 0%total costs predicted 147 $1,318 $363 $0total costs actual 172 $1,419 $385 $0projects 0 4 3 5% of all projects 0% 19% 14% 17%total costs predicted 0 $905 $1,065 $2,753total costs actual 0 $924 $1,096 $2,836projects 0 4 7 20% of all projects 0% 19% 33% 69%total costs predicted 0 $1,214 $3,715 $15,608total costs actual 0 $1,176 $3,587 $15,153projects 0 1 3 1% of all projects 0% 5% 14% 3%total costs predicted 0 $346 $1,139 $48total costs actual 0 $325 $1,070 $39projects 0 2 2 1% of all projects 0% 10% 10% 3%total costs predicted 0 $473 $201 $194total costs actual 0 $420 $164 $145projects 9 21 21 29% of all projects 100% 100% 100% 100%total costs predicted $4,563 $9,629 $10,347 $18,952total costs actual $9,343 $11,007 $11,885 $18,650
All Projects
Characteristics of Each Stratum
1990
more than
120%
120% to
110%
110% to
100%
100% to
90%
less than 80%
Actual Divided
by Predicted
Entry into PE
90% to
80%
FFGA or PCGA
FFGA or PCGA
2003 2007 2020
FFGA or PCGA

21
cost estimate at FFGA by two percent. This is a large improvement when compared to the 1990 PvA study and continued improvement over the 2003 and 2007 PvA studies. Based upon this analysis, FTA considers the 1990 PvA Study no longer representative of FTA’s recent experience with accuracy of capital cost estimates of CIG projects.

22
3. Predicted versus Actual Ridership This chapter compares the ridership forecasts prepared to support key decisions in the planning and project development process for CIG projects to the actual ridership after project opening. The ridership forecasts were used to support the selection of the locally preferred alternative and used by FTA for the project justification criteria to rate and evaluate CIG projects. This chapter compares the ridership forecasts for 27 CIG projects at key decision points (Preliminary Engineering, Final Design and Full Funding Grant Agreement) to the actual observed ridership two years after the projects opened for revenue service.
3.1. Methodology Actual ridership for projects presented in this study are measured via on-board rider surveys, which are a required element of B&A Studies. The rider survey is typically conducted two years after project opening, allowing for the project’s ridership market to mature. The survey is typically conducted in the spring or fall, which are generally thought to be most representative of typical ridership patterns. These surveys are conducted on either a system-wide or project corridor basis, depending on the complexity of the regional transit system. More complex transit systems typically use the corridor-based approach. The FTA, partnering with survey vendors serving the transit industry, has made significant improvements in conducting on-board rider surveys. Prior to 2012, the standard survey methodology used paper-based surveys on-board transit vehicles and expanded the returned surveys to aggregate route-level boarding counts. The process resulted in a very crude understanding of ridership by route and travel markets. This understanding tended to: 1) over-represent long-distance transit trips, as short-distance transit riders struggled to complete the paper form during their trip; 2) be limited by a relatively large segment of the survey responses (upwards of 10 percent) with illogical data, due to confusion of the transit rider or questions that were unanswered; and 3) use estimates for aggregate boarding riders for data expansion that didn’t guarantee accurate on-to-off movements on an individual route. The current state of the practice in transit rider surveys provides a much stronger understanding of transit markets and the characteristics of transit riders. Several methodological improvements have occurred since 2012. Survey vendors have migrated from paper-based surveys to in-person tablet interviews on-board the vehicle to obtain survey responses. The tablet interview process has several advantages including: use of interactive maps to identify key locations during the trip; customization of the interview to capture short-distance trips; surveys programmed in multiple languages to capture responses from non-English speaking riders; an interviewer guides the rider through the questions to reduce confusion; and the data collected is quality controlled in real-time to identify illogical responses, allowing the interviewer to clarify details of the trip. Thus, the survey records obtained from the current method of on-board rider surveys have superior quality than those obtained through earlier, paper-based methods. The approach for the data expansion of these surveys has also improved with the current generation of rider surveys. Survey firms use a combination of transit system passenger counts, typically obtained from automated passenger count (APCs) machines, to identify where riders

23
board and alight a transit line. In addition, standard survey methodology now includes samples of on-to-off passenger movements on a route; this ensures that the collected sample of survey records can be accurately weighted to represent the actual on-to-off movements by line, time-period, direction and route segment boarding to alighting counts. These changes amount to far more accurate actual ridership information in B&A Studies than the data FTA collected 10 years ago. In collaboration with project sponsors, FTA staff develop standard tabulations of rider surveys before and after a CIG project investment to describe transit ridership outcomes for each CIG project. These tabulations include detailed district-to-district movements by trip purpose, time-of-day, access mode and socio-economic class of the rider. These tabulations are performed for the overall regional transit system, as well as trips that use the CIG project. The surveyed tabulations of trips on the project, two years after the CIG project opened for revenue service, was used as the basis for the actual ridership in the predicted versus actual comparisons. The predicted ridership forecasts were obtained from opening year forecasts prepared by project sponsors during the CIG project development milestones. B&A Study requirements call for project sponsors to archive their travel forecasts made for CIG projects. This allows FTA and the project sponsor to retrospectively analyze the travel forecasts made during project development milestones and compare them directly to the actual outcomes as measured by the rider survey. The comparison allows for the identification of travel markets with significant predicted versus actual difference and for FTA to identify the causes of differences. For individual project’s specific details of these ridership comparisons, please visit FTA’s Before and After Study webpage at: https://www.transit.dot.gov/funding/grant-programs/capital-investments/and-after-studies-new-starts-projects. This PvA study uses the opening year ridership predictions for CIG projects, which marks a substantial improvement over prior PvA studies that used horizon year forecasts. The use of horizon year forecasts required FTA staff to extrapolate regional ridership trends to estimate actual horizon year ridership. This means the PvA comparisons in the 2003 and 2007 studies were, themselves, projections of actual outcomes to the horizon year. This version of the PvA Study yields a direct comparison between planned and actual ridership outcomes. It is important to note that while FTA required the submission of opening year forecasts, the FTA project rating and evaluation process at the time these projects were in the CIG program used horizon year forecasts only. Thus, the quality of the opening year forecasts prepared by sponsors vary, sometimes significantly. The FTA’s B&A Study experience shows that some projects carefully constructed opening-year forecasts, while others treated them as after-thoughts, since they were not used in FTA’s evaluation and rating process. As such, the opening year forecasts were not subjected to the same level of scrutiny as the horizon year forecasts. Project sponsors tabulate their opening year ridership forecasts to prepare tabulations of their ridership forecast. The tabulations are identical to those identified above in the description of rider survey. The tabulations of the ridership forecasts include the same detailed district-to-district movements by trip purpose, time-of-day, access mode and socio-economic class of the
24
rider. These tabulations are performed for the overall regional transit system, as well as trips that use the CIG project. In B&A Studies, the project sponsors compare the tabulations from the opening-year project ridership forecasts to the data collected from the on-board rider survey to identify markets where material differences occur between predicted and actual outcomes. This focuses the retrospective analysis on identifying the causes of differences and allows FTA technical staff to identify where the technical methods worked well, and where they struggled to predict actual outcomes. For this iteration of the PvA Study, FTA has focused the PvA comparison on the travel forecasts at the time of the Full Funding Grant Agreement (FFGA) or Project Construction Grant Agreement (PCGA). This decision was made because the forecasts at the grant agreement were the basis for FTA’s commitment to the project. These well-documented and preserved forecasts incorporate the final project scope and operating plan. Table 3.1-1 shows the 27 projects with travel forecasts in the 2020 PvA study, and the ridership forecasts at entry into Preliminary Engineering (PE), entry into Final Design (FD), at FFGA/PCGA and the actual measured ridership on the project. The remainder of the analysis in this chapter is based upon the information shown in this table.

25
Table 3.1-1: Data on Actual and Predicted Ridership by Project
Predictions Project Characteristics
Actual Ridership
Opening-year Horizon
Label Mode Nature Open PE-entry FD-entry FF/PCGA FF/PCGA
CLT-S LR 1ST 2007 14,400 --- --- 12,100 17,650 SLC-CR CR ADD 2008 5,300 8,400 5,650 5,900 11,800 PHX-EV LR 1ST 2008 40,700 --- --- 26,000 49,900 CLE-EUC BRT ADD 2008 14,300 21,100 21,100 13,500 39,000 SD-CR CR EXP 2008 7,600 --- --- 12,000 19,000 PLD-GRN LR EXP 2009 24,000 30,400 25,300 25,300 46,500 PLD-CR CR ADD 2009 1,700 2,400 2,000 1,600 3,000 LA-GLD LR EXP 2009 13,000 --- --- --- 16,300 MSP-CR CR ADD 2009 2,200 4,000 3,600 3,400 5,900 SEA-APT LR 1ST 2009 23,400 34,900 37,800 37,800 42,500 DAL-N/S LR EXP 2010 33,000 --- 40,300 40,300 45,900 FLG BRT 1ST 2011 4,200 4,150 4,150 4,150 --- SLC-MJ LR EXP 2011 7,400 --- 6,300 6,300 9,500 NFK LR 1ST 2011 4,600 --- 2,900 2,900 7,100 PBG-NS LR EXP 2012 11,100 --- 10,000 10,000 14,300 PLD-SC SC EXP 2012 2,500 8,100 8,100 3,900 --- DEN-W LR EXP 2013 11,950 --- 24,900 19,300 29,700 HOU-RED LR EXP 2013 14,400 17,400 17,400 17,400 29,900 SLC-DRA LR EXT 2013 3,200 2,275 3,600 3,600 6,800 ORL-SUN1 CR 1ST 2014 3,200 --- 4,300 4,300 7,400 FTC-MAS BRT 1ST 2014 5,300 4,100 4,100 4,100 --- MSP-CC LR EXP 2014 40,400 34,300 32,400 32,400 40,900 DULLES HR EXP 2014 32,100 62,800 69,600 69,600 85,700 SAC-SX LR EXT 2014 4,300 3,600 3,600 3,600 10,000 AUS-BRT BRT 1ST 2014 9,300 --- --- --- --- HFD-NB BRT 1ST 2015 8,200 --- 13,700 13,400 16,300 HOU-PRP LR EXP 2015 5,600 17,200 17,200 17,200 28,700 PHX-MSA LR EXT 2015 8,100 8,700 8,700 8,700 --- PLD-MIL LR EXP 2015 11,160 17,000 17,000 17,000 22,800
Abbreviations: LR light rail 1ST first fixed-guideway mode NS New Starts
CR commuter rail ADD added fixed-guideway mode SS Small Starts SC streetcar EXP expansion into a new corridor VSS Very Small Starts BRT bus rapid transit EXT extension of an existing line

26
3.2. Findings from the Current Set of Projects This section presents the findings for the PvA ridership outcomes. The key findings from this analysis are:
• Actual ridership on 13 of 27 projects (48 percent) were within 20 percent of their forecast
• Actual ridership on 22 of 27 projects (81 percent) were within 40 percent of their forecast
• Actual ridership on 25 of 27 projects (93 percent) achieved at least 60 percent of their forecast
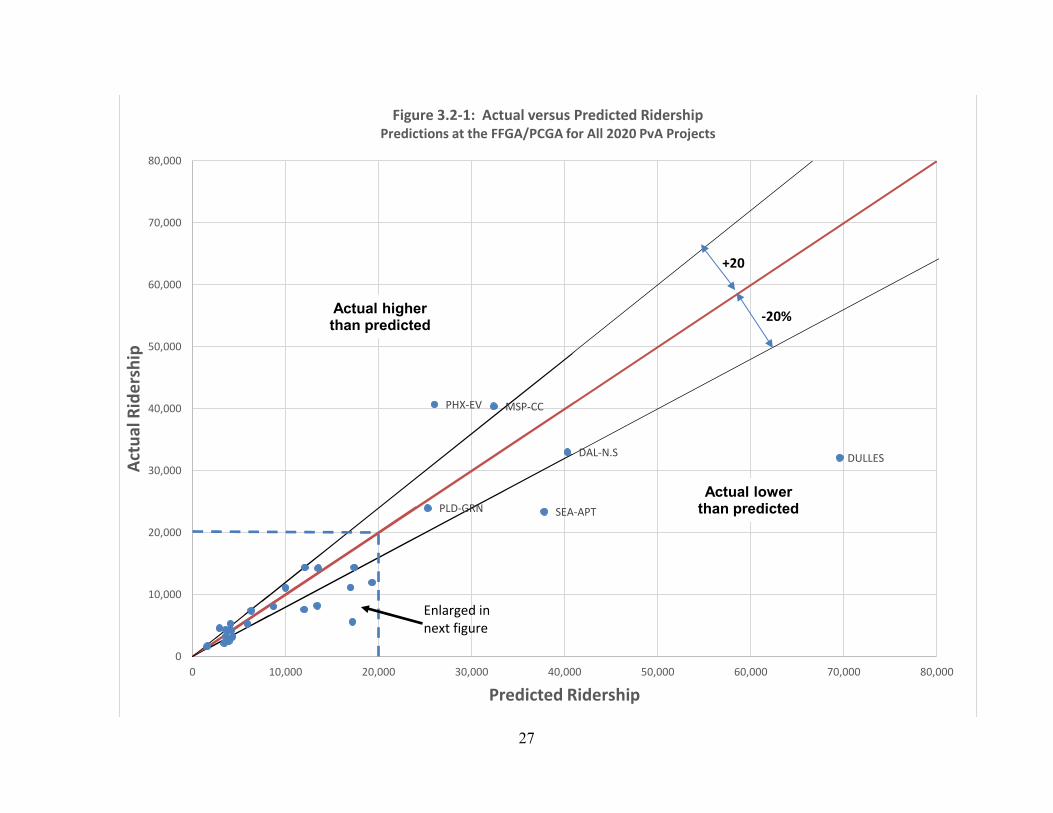
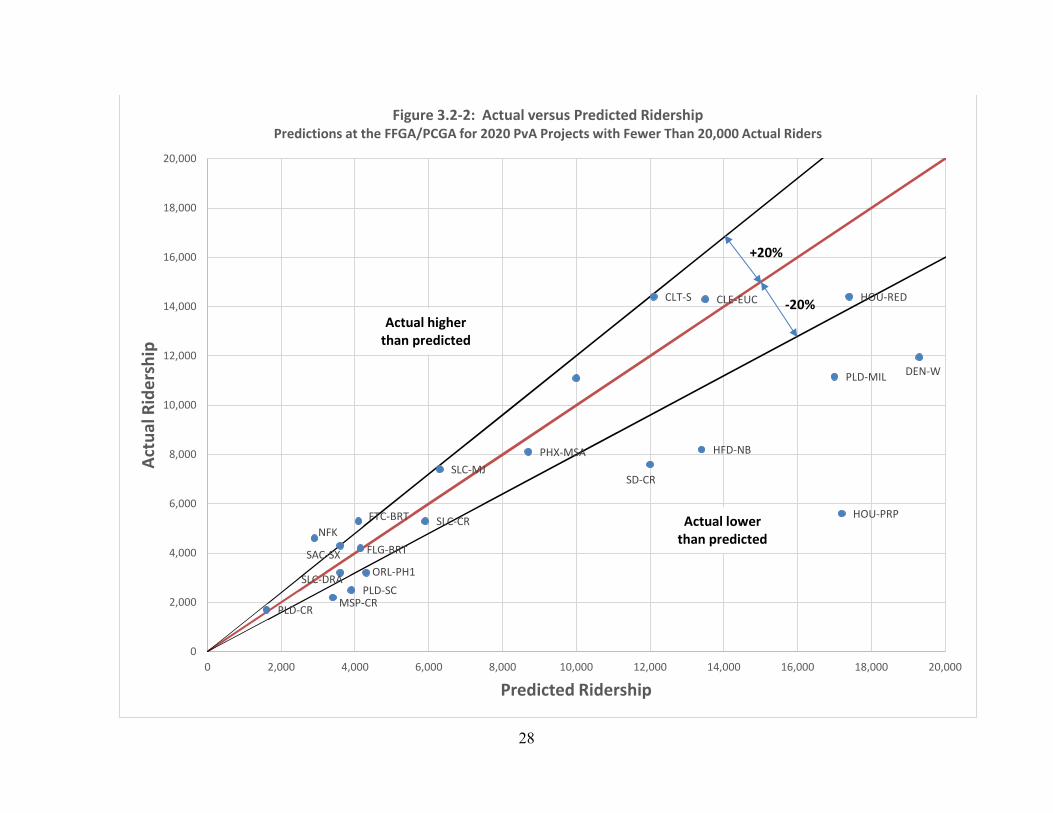
The comparisons of predicted versus actual ridership are summarized in two scatter plots in Figure 3.2-1 and 3.2-2 below. These scatter plots contain the predicted ridership on the horizontal axis and actual ridership on the vertical axis. The 45-degree line that is drawn on these plots represent where actual ridership is equivalent to predicted ridership. The closer a point is to this 45-degree line, the more accurate the forecast was to the actual ridership. The FTA has also placed a 20 percent upper and lower bound of accuracy on these plots. Each of the 27 projects has been labeled and plotted. Figure 3.2-1 includes all data points for the 27 projects, while Figure 3.2-2 focuses the plot on those projects with PvA ridership of under 20,000 trips per day.
27
PHX-EV
PLD-GRN SEA-APT
DAL-N.S
MSP-CC
DULLES
0
10,000
20,000
30,000
40,000
50,000
60,000
70,000
80,000
0 10,000 20,000 30,000 40,000 50,000 60,000 70,000 80,000
Actu
al R
ider
ship
Predicted Ridership
Figure 3.2-1: Actual versus Predicted RidershipPredictions at the FFGA/PCGA for All 2020 PvA Projects
+20
-20%Actual higher than predicted
Actual lower than predicted
Enlarged in next figure
28
CLT-S
SLC-CR
CLE-EUC
SD-CR
PLD-CR MSP-CR
FLG-BRT
SLC-MJ
NFK
PLD-SC
DEN-W
HOU-RED
SLC-DRA ORL-PH1
FTC-BRT
SAC-SX
HFD-NB
HOU-PRP
PHX-MSA
PLD-MIL
0
2,000
4,000
6,000
8,000
10,000
12,000
14,000
16,000
18,000
20,000
0 2,000 4,000 6,000 8,000 10,000 12,000 14,000 16,000 18,000 20,000
Actu
al R
ider
ship
Predicted Ridership
Figure 3.2-2: Actual versus Predicted RidershipPredictions at the FFGA/PCGA for 2020 PvA Projects with Fewer Than 20,000 Actual Riders
Actual higher than predicted
Actual lower than predicted
+20%
-20%

Through the B&A Study process, FTA has identified the causes of PvA ridership differences. Table 3.2-1 identifies the cited causes for those projects which have more than a 20 percent difference between their predicted FFGA/PCGA and actual ridership. Table 3.2-1: Causes of Ridership Differences Greater than ±20 Percent at the FFGA/PCGA
Cited Causes of Predicted-vs-Actual Ridership Differences Greater Than ±20
Percent at the FFGA/PCGA
Actual Less Than Predicted
Actual Greater Than
Predicted
Subtotal Total
Measurement Ramp-up 1 0 1 1
Inaccurate Representation of the Setting
Demographics 5 2 7
14 Project performance 3 0 3 Bus changes not made 3 0 3 Other lines not built 1 0 1
Uncertain Context
Problematic markets 1 1 2
10 Atypical setting 1 0 1 1st project 2 3 5 New mode 2 0 2
Methodology Model properties 4 1 5
7 Inattention to quality control 1 1 2
Summaries Total cites 24 8 32 32 Total projects 11 3 14 14
The FTA has taken steps to address the recurring issues cited in Table 3.2-1. The most frequently cited issue is inaccuracy in the underlying demographic assumptions used to make ridership forecasts. As discussed earlier, the projects in this study submitted opening year forecasts, typically five to ten years in the future. According to Table 3.2-1, with a relatively short prediction horizon, half of the projects with significant PvA differences had problematic demographic forecasts. Current FTA CIG evaluation addressed this issue by requiring project sponsors to submit a current-year travel forecast. Using a current-year forecast removes horizon-year demographic forecasts from project ridership forecasts. The second most frequent causes involve model properties and the CIG investment being the first project in a region. The FTA has developed the Simplified Trips-on-Project Software (STOPS) as a simplified forecasting method, which automates and provides a FTA best-practice transit forecasting methodology to project sponsors. STOPS has been calibrated and validated to the measured national experience with actual CIG projects built around the country using the B&A Studies. STOPS eliminates large-scale methodological errors from travel forecasts by standardizing effective travel forecasting procedures. First time project sponsors, who often face challenges forecasting how a new fixed-guideway transit system will affect local transit markets, benefit from STOPS being validated to actual CIG project ridership outcomes from across the United States.
30
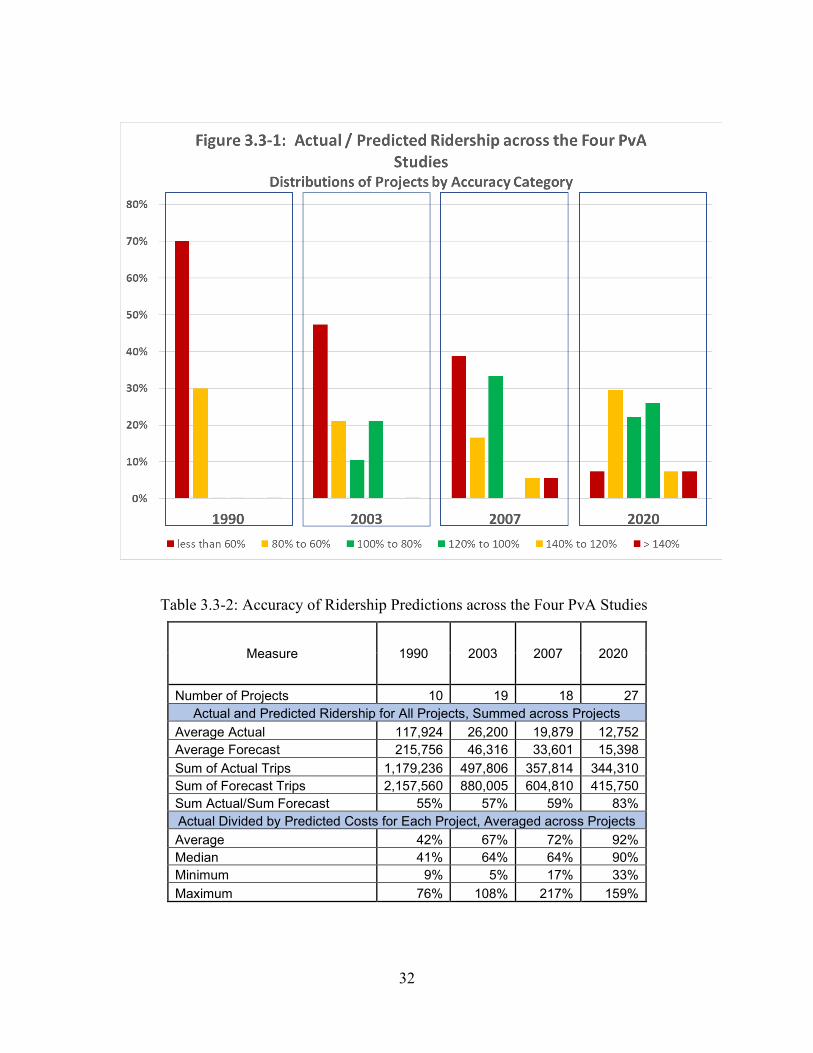
3.3. Comparisons across the Four PvA Studies This section compares the PvA ridership forecasts from the current study to the prior three efforts. Table 3.3-1 provides a distribution of the PvA ridership outcomes for each of the four PvA Studies. Figure 3.3-1 summarizes these distributions graphically. The key outcomes from the table and figure are as follows:
• In the current PvA Study, accurate travel forecasts, defined as within 20 percent of their actual outcome, make up 13 of the 27 projects (48 percent), which is a measurable improvement from the prior studies:
o 2007 Study – 6 out of 18 (33 percent) o 2003 Study – 6 out of 19 (32 percent) o 1990 Study – 0 out of 10 projects (0 percent)
• In the current PvA Study, projects that achieved significantly less than their predicted
ridership (less than 60 percent of their forecast) account for just two of the 27 projects (seven percent). This is a vast improvement over the prior efforts:
o 2007 Study - 7 out of 18 (39 percent) o 2003 Study – 9 out of 19 (47 percent) o 1990 Study – 7 out of 10 (70 percent)
Table 3.3-2 summarizes the key accuracy statistics across the four studies. It provides the statistics in two different ways. The top of half of the table sums the PvA ridership across all projects, which it is weighted more heavily to larger projects. The bottom of the table treats each individual project equally and each project prediction is treated as an individual data point. The current PvA Study shows the average project achieves, on average, 92 percent of its ridership forecast, which is a substantial improvement in the average ridership forecast as compared to the prior studies: • 2007 Study – average project achieved 72 percent of its forecast • 2003 Study – average project achieved 67 percent of its forecast • 1990 Study – average project achieved 42 percent of its forecast

31
Table 3.3-1: Distribution of Accuracy of Ridership Predictions across the PvA Studies
Actual Divided
by Predicted
TRIPS ON THE PROJECT
1990 2003 2007 2020
FFGA or PCGA
FFGA or PCGA
FFGA or PCGA
FFGA or PCGA
more than
140%
projects 0 0 1 2 % of all projects 0% 0% 6% 7% total trips predicted 0 0 10,050 28,900 total trips actual 0 0 21,811 45,300
140% to
120%
projects 0 0 1 2 % of all projects 0% 0% 6% 7% total trips predicted 0 0 24,800 36,500 total trips actual 0 0 33,477 45,700
120% to
100%
projects 0 4 0 7 % of all projects 0% 21% 0% 26% total trips predicted 0 120,348 0 51,250 total trips actual 0 125,222 0 57,400
100% to
80%
projects 0 2 6 6 % of all projects 0% 11% 33% 22% total trips predicted 0 49,370 130,338 101,200 total trips actual 0 43,456 111,855 88,000
80% to
60%
projects 3 4 3 8 % of all projects 30% 21% 17% 30% total trips predicted 1,051,500 69,719 124,430 111,100 total trips actual 788,395 50,060 78,689 70,210
less than 60%
projects 7 9 7 2 % of all projects 70% 47% 39% 7% total trips predicted 1,106,060 640,568 315,192 86,800 total trips actual 390,841 279,068 111,982 37,700
All Projects
projects 10 19 18 27 % of all projects 100% 100% 100% 100% total trips predicted 2,157,560 880,005 604,810 415,750 total trips actual 1,179,236 497,806 357,814 344,310
32
Table 3.3-2: Accuracy of Ridership Predictions across the Four PvA Studies
Measure 1990 2003 2007 2020
Number of Projects 10 19 18 27 Actual and Predicted Ridership for All Projects, Summed across Projects
Average Actual 117,924 26,200 19,879 12,752 Average Forecast 215,756 46,316 33,601 15,398 Sum of Actual Trips 1,179,236 497,806 357,814 344,310 Sum of Forecast Trips 2,157,560 880,005 604,810 415,750 Sum Actual/Sum Forecast 55% 57% 59% 83% Actual Divided by Predicted Costs for Each Project, Averaged across Projects Average 42% 67% 72% 92% Median 41% 64% 64% 90% Minimum 9% 5% 17% 33% Maximum 76% 108% 217% 159%
33
3.4. Sources of Improvement The current PvA Study shows a demonstrated improvement in the accuracy of travel forecasts for CIG projects. The FTA believes there are several reasons for this improvement:
1. Experience. The 1990 study evaluated the PvA outcomes for the first batch of capital transit projects that were built since the early 1900s. As such, the technical methods used in making travel forecasts for public transportation projects were built with then-new and unproven technical methods, limited data, and no actual experience with project performance. Since the 1990 study, FTA has compared the PvA outcome for 64 additional projects, which represents 64 additional opportunities to learn and evaluate the performance of travel forecasting methods and encourage the industry to utilize methodologies that work well (and remove those that performed poorly). The FTA has employed a continuous learning culture, which uses past-experiences (good and bad) to improve current and future travel forecasting performance. The prior PvA studies and the B&A Studies show FTA’s commitment to improving the practice of travel forecasting accuracy.
2. FTA Reviews of Transit Forecasts. The FTA has brought a national perspective and depth of knowledge to the review of ridership forecasts for CIG projects for decades. FTA draws on extensive agency travel-forecasting expertise to conduct these reviews in coordination with project sponsors, and has leveraged the past-experience to improve state-of-the-practice ridership forecasting methods, advancing improved data to identify transit markets, and identified approaches to mitigate risks to transit forecasts. In addition, FTA has developed tools to facilitate better understanding of the travel models employed to make CIG forecasts.
In the early 2000s, FTA developed the Summit program to identify Transportation System User Benefits (time savings) for CIG projects. It also became an essential quality control tool for transit forecasts and the travel models that produced them. Until this tool was released, most travel models were deemed to be “black boxes” which produced forecasts, with little insight or understanding of what was happening during the execution of the model. This program allowed the project sponsor and FTA review team to identify illogical model attributes during a CIG review. When it was released in the early 2000s, the program revealed many problematic elements from that generation of transit forecasting models and CIG project forecasts. The FTA’s reviews, using the Summit program, helped improve travel forecasting models, leading to documented improvement in forecasting accuracy.
3. Focus on Opening Year. The FTA’s use of the opening year forecasts has dramatically reduced the risk of a forecast being inaccurate. Prior to this PvA study, the earlier PvA studies relied on comparing the actual ridership to a forecast for a point in time that was 20 years in the future. This approach meant that the project ridership forecast was reliant on multiple predictions about 20 years in the future including: socio-economic growth (where it occurs and its magnitude) and the attributes of the future transit system and

34
future year highway system performance. By focusing on a compressed forecasting period, the range of plausible outcomes for each of these attributes is more tightly banded, allowing for improved accuracy. The FTA has further mitigated the forecasting risk by requiring projects to submit a current year forecast, which demonstrates how a project will perform with the existing transportation context.
4. Extensive use of Transit Rider Data to Enumerate Transit Travel Markets. Beginning about 15 years ago, FTA required project sponsors to conduct on-board transit surveys. The data from those surveys is used to identify how transit riders use transit service, the transit travel market origins and destinations, and other attributes. The travel forecasting methods are tested to make sure the forecasts reflect key transit markets and attributes of riders in those markets. The extensive use of rider survey data allowed sponsors’ travel forecasters and FTA reviewers to understand the key transit markets for a region and a project corridor, which led directly to models having a stronger representation of existing transit markets. A greater understanding of the transit markets produced better forecasts of what happens with a CIG project investment.
As discussed earlier, the data collection methods have significantly improved in the past decade to provide a more accurate understanding of regional transit travel patterns. The shift in survey methodology to in-person, interview style has substantially improved the quality and accuracy of the data collected on riders. In addition, new and emerging data sources, such as counts from Automated Passenger Count (APCs) machines and fare-system data are also being used to further increase our understanding of transit rider patterns.

35
5. Conclusion This PvA study is the most comprehensive study completed to date, with an assessment of 29 projects. The capital cost and ridership data used for this study are from the Before-and-After Studies produced by recipients of Full Funding Grant Agreements and Project Construction Grant Agreements. As a result, there is a higher level of consistency and quality of information in this PvA study compared to the prior three PvA studies undertaken in 1990, 2003, and 2007. To date, FTA has assessed the predicted versus actual capital cost and ridership of 81 projects constructed with Federal transit Capital Investment Grants program (49 U.S.C. § 5309) funding.
In the thirty-year interval between the 1990 PvA study and the 2020 PvA study, there have been substantial improvements in the methods used to estimate capital costs of CIG projects. CIG project sponsors and FTA have employed techniques to proactively mitigate project risks, implement controls for cost and schedule, and apply prior experience gained during the construction of new transit projects. This is evident in the results of the 2020 PvA study review of capital costs, in which 75 percent of the projects had capital costs at or below the estimate at the FFGA or PCGA. Of the 25 percent of projects in which the actual capital cost exceeded the FFGA capital cost estimate, five projects were within 10 percent of the FFGA estimate, and only two projects exceeded their FFGA capital cost estimate by more than 20 percent. In the 1990 PvA study, almost 90 percent of projects exceeded their capital cost estimates (at PD) by greater than 120 percent.
Similarly, in the thirty-year interval between the 1990 PvA and the 2020 PvA Study, there have been substantial improvements in the methods used to estimate ridership of CIG projects. The 2020 PvA study assessment of ridership is based upon FFGA/PCGA versus opening year ridership forecasts, which are inherently more accurate than ridership forecasts based on a point in time 20 years in the future. Since the earlier PvA studies, FTA and project sponsors have improved the technical methods used for making forecasts, and applied lessons learned about changes in travel behavior in response to the introduction of a new or extended transit system. This includes a close examination of the existing transit markets and use of passenger survey data to carefully calibrate local travel forecasting tools. The FTA has also applied detailed reviews of ridership forecasts and applied tools, such as Summit, to verify that the ridership forecasts reflect the benefits of the transit project, and not mistakes in networks or poor model calibration. This is evident in the results of the 2020 PvA study review of ridership, where 48 percent of the projects had actual ridership within 20 percent of their FFGA/PCGA ridership forecasts. Only two of the projects in the 2020 PvA study had actual ridership outcomes significantly lower (less than 60 percent of the forecast) at the FFGA/PCGA. In the 1990 PvA study, 70 percent of the projects had actual ridership that was less than 60 percent of the forecast.
Based on this analysis, the 1990 PvA Study is no longer representative of FTA’s experience with the accuracy of capital cost and ridership estimates for CIG projects.

36
Key to Project Labels in Charts
Label State Metro Area Project
AUS-BRT TX Austin MetroRapid BRT CLE-EUC OH Cleveland Euclid Corridor Transportation Project CLT-S NC Charlotte South Corridor LRT DAL-N/S TX Dallas Northwest/Southeast LRT MOS DEN-W CO Denver West Corridor LRT DULLES VA Dulles Dulles Corridor Metrorail Extension to Wiehle Ave. FLG AZ Flagstaff Mountain Links BRT FTC-MAS CO Fort Collins Mason Corridor BRT HFD-NB CN Hartford New Britain - Hartford Busway HOU-PRP TX Houston Southeast Corridor LRT HOU-RED TX Houston North Corridor LRT LA-GLD CA Los Angeles Metro Gold Line East Side Extension MSP-CC MN Minneapolis-St. Paul Central Corridor LRT MSP-CR MN Minneapolis Northstar Corridor Rail NFK VA Norfolk Norfolk LRT ORL-SUN1 FL Orlando Central Florida Commuter Rail -- Initial Segment PBG-NS PA Pittsburgh North Shore LRT Connector PHX-EV AZ Phoenix Central Phoenix / East Valley Light Rail PHX-MSA AZ Phoenix Central Mesa LRT Extension PLD-CR OR Portland Wilsonville to Beaverton Commuter Rail PLD-GRN OR Portland South Corridor I-205/Portland Mall LRT PLD-MIL OR Portland Portland-Milwaukie Light Rail PLD-SC OR Portland Streetcar Loop SAC-SX CA Sacramento South Sacramento Corridor Phase 2 SD-CR CA San Diego Oceanside-Escondido Rail Corridor SEA-APT WA Seattle Central Link Initial Segment SLC-CR UT Salt Lake City Weber County to Salt Lake City Commuter Rail SLC-DRA UT Salt Lake City Draper Transit Corridor SLC-MJ UT Salt Lake City Mid Jordan LRT

37
List of Acronyms
ADD - Addition B&A Study – Before-and-After Study BRT – Bus Rapid Transit CIG – Capital Investment Grants Program CR – Commuter rail EXP – Expansion EXT - Extension FFGA – Full Funding Grant Agreement FTA – Federal Transit Administration HR – Heavy Rail LR – Light rail NS – New Start M - Million PCGA – Project Construction Grant Agreement PD – Project Development PE – Preliminary Engineering PMO – Project Management Oversight PvA – Predicted versus Actual Study SC – Streetcar SS- Small Start VSS – Very Small Start