Next Generation Science Standards for our Next Generation Science Students

U.S. Department of Transportation
Federal Railroad Administration
Next-Generation Foundations for Special Trackwork – Phase I
Office of Research and Development Washington, DC 20590
DOT/FRA/ORD-13/10 Final Report February 2013
NOTICE
This document is disseminated under the sponsorship of the Department of Transportation in the interest of information exchange. The United States Government assumes no liability for its contents or use thereof. Any opinions, findings and conclusions, or recommendations expressed in this material do not necessarily reflect the views or policies of the United States Government, nor does mention of trade names, commercial products, or organizations imply endorsement by the United States Government. The United States Government assumes no liability for the content or use of the material contained in this document.
NOTICE
The United States Government does not endorse products or manufacturers. Trade or manufacturers’ names appear herein solely because they are considered essential to the objective of this report.

i
REPORT DOCUMENTATION PAGE Form Approved OMB No. 0704-0188
Public reporting burden for this collection of information is estimated to average 1 hour per response, including the time for reviewing instructions, searching existing data sources, gathering and maintaining the data needed, and completing and reviewing the collection of information. Send comments regarding this burden estimate or any other aspect of this collection of information, including suggestions for reducing this burden, to Washington Headquarters Services, Directorate for Information Operations and Reports, 1215 Jefferson Davis Highway, Suite 1204, Arlington, VA 22202-4302, and to the Office of Management and Budget, Paperwork Reduction Project (0704-0188), Washington, DC 20503.
1. AGENCY USE ONLY (Leave blank)
2. REPORT DATE February 2013
3. REPORT TYPE AND DATES COVERED Technical Report
4. TITLE AND SUBTITLE Next Generation Foundations for Special Trackwork – Phase I
5. FUNDING NUMBERS
DTFR53-00-C-00012
Task Order 265
6. AUTHOR(S) Xinggao Shu, David Davis, and Muhammad Akhtar
7. PERFORMING ORGANIZATION NAME(S) AND ADDRESS(ES) Transportation Technology Center, Inc. a subsidiary of the Association of American Railroads 55500 DOT Road Pueblo, CO 81001
8. PERFORMING ORGANIZATION REPORT NUMBER
9. SPONSORING/MONITORING AGENCY NAME(S) AND ADDRESS(ES) U.S. Department of Transportation Federal Railroad Administration Office of Research and Development Washington, DC 20590
10. SPONSORING/MONITORING AGENCY REPORT NUMBER
DOT/FRA/ORD-13/10
11. SUPPLEMENTARY NOTES COTR: Luis Maal and Gary Carr 12a. DISTRIBUTION/AVAILABILITY STATEMENT This document is available to the public through the FRA Web site at http://www.fra.dot.gov.
12b. DISTRIBUTION CODE
13. ABSTRACT (Maximum 200 words) This report reviews the dynamic load environment and failure modes of special trackwork frog foundations. Key measurements taken under a 39,000-pound wheel load traffic at the Facility for Accelerated Service Testing were used to develop and calibrate a vehicle-track model. Parametric studies show the following: (1) for new crossings without any track differential settlement, optimal foundation stiffness and damping could lower the current wheel-rail (W-R) impact by 30 percent, (2) for worn crossings, W-R impact increases significantly with foundation stiffness and damping; and (3) W-R impact increases with track differential settlement. On the basis of the modeling results, this report proposes preliminary design and maintenance guidelines for improving crossing performances.
14. SUBJECT TERMS Dynamic load environment, special trackwork frog foundations, wheel-rail impact, modeling
15. NUMBER OF PAGES 58
16. PRICE CODE
17. SECURITY CLASSIFICATION OF REPORT Unclassified
18. SECURITY CLASSIFICATION OF THIS PAGE Unclassified
19. SECURITY CLASSIFICATION OF ABSTRACT Unclassified
20. LIMITATION OF ABSTRACT
NSN 7540-01-280-5500 Standard Form 298 (Rev. 2-89) Prescribed by ANSI Std. 239-18
298-102
ii
METRIC/ENGLISH CONVERSION FACTORS
ENGLISH TO METRIC METRIC TO ENGLISH
LENGTH (APPROXIMATE) LENGTH (APPROXIMATE) 1 inch (in) = 2.5 centimeters (cm) 1 millimeter (mm) = 0.04 inch (in) 1 foot (ft) = 30 centimeters (cm) 1 centimeter (cm) = 0.4 inch (in)
1 yard (yd) = 0.9 meter (m) 1 meter (m) = 3.3 feet (ft) 1 mile (mi) = 1.6 kilometers (km) 1 meter (m) = 1.1 yards (yd)
1 kilometer (km) = 0.6 mile (mi)
AREA (APPROXIMATE) AREA (APPROXIMATE) 1 square inch (sq in, in2) = 6.5 square centimeters (cm2) 1 square centimeter (cm2) = 0.16 square inch (sq in, in2)
1 square foot (sq ft, ft2) = 0.09 square meter (m2) 1 square meter (m2) = 1.2 square yards (sq yd, yd2) 1 square yard (sq yd, yd2) = 0.8 square meter (m2) 1 square kilometer (km2) = 0.4 square mile (sq mi, mi2) 1 square mile (sq mi, mi2) = 2.6 square kilometers (km2) 10,000 square meters (m2) = 1 hectare (ha) = 2.5 acres
1 acre = 0.4 hectare (he) = 4,000 square meters (m2)
MASS - WEIGHT (APPROXIMATE) MASS - WEIGHT (APPROXIMATE) 1 ounce (oz) = 28 grams (gm) 1 gram (gm) = 0.036 ounce (oz) 1 pound (lb) = 0.45 kilogram (kg) 1 kilogram (kg) = 2.2 pounds (lb)
1 short ton = 2,000 pounds (lb)
= 0.9 tonne (t) 1 tonne (t)
= =
1,000 kilograms (kg) 1.1 short tons
VOLUME (APPROXIMATE) VOLUME (APPROXIMATE) 1 teaspoon (tsp) = 5 milliliters (ml) 1 milliliter (ml) = 0.03 fluid ounce (fl oz)
1 tablespoon (tbsp) = 15 milliliters (ml) 1 liter (l) = 2.1 pints (pt) 1 fluid ounce (fl oz) = 30 milliliters (ml) 1 liter (l) = 1.06 quarts (qt)
1 cup (c) = 0.24 liter (l) 1 liter (l) = 0.26 gallon (gal) 1 pint (pt) = 0.47 liter (l)
1 quart (qt) = 0.96 liter (l) 1 gallon (gal) = 3.8 liters (l)
1 cubic foot (cu ft, ft3) = 0.03 cubic meter (m3) 1 cubic meter (m3) = 36 cubic feet (cu ft, ft3) 1 cubic yard (cu yd, yd3) = 0.76 cubic meter (m3) 1 cubic meter (m3) = 1.3 cubic yards (cu yd, yd3)
TEMPERATURE (EXACT) TEMPERATURE (EXACT)
[(x-32)(5/9)] °F = y °C [(9/5) y + 32] °C = x °F
QUICK INCH - CENTIMETER LENGTH CONVERSION10 2 3 4 5
InchesCentimeters 0 1 3 4 52 6 1110987 1312
QUICK FAHRENHEIT - CELSIUS TEMPERATURE CONVERSIO -40° -22° -4° 14° 32° 50° 68° 86° 104° 122° 140° 158° 176° 194° 212°
°F
°C -40° -30° -20° -10° 0° 10° 20° 30° 40° 50° 60° 70° 80° 90° 100°
For more exact and or other conversion factors, see NIST Miscellaneous Publication 286, Units of Weights and Measures. Price $2.50 SD Catalog No. C13 10286 Updated 6/17/98

iii
Contents
Executive Summary ........................................................................................................................ 1
1. Introduction ................................................................................................................. 3 1.1 Background ................................................................................................................. 3 1.2 Objectives .................................................................................................................... 3 1.3 Overall Approach ........................................................................................................ 3 1.4 Scope ........................................................................................................................... 3 1.5 Organization of the Report .......................................................................................... 4
2. Current State of Practice .............................................................................................. 5 2.1 Frog Service Environment ........................................................................................... 7 2.2 Frog Service Life ....................................................................................................... 10 2.3 Designs Currently Used ............................................................................................. 11 2.4 Failure Modes ............................................................................................................ 19 2.5 Frog Design Methodologies ...................................................................................... 22 2.6 Research Needs ......................................................................................................... 23
3. Dynamic Load and Deflection Measurement ............................................................ 25 3.1 IWS Measurement ..................................................................................................... 26 3.2 Wayside Measurement .............................................................................................. 27 3.3 IFC Car Measurement ............................................................................................... 29
4. Modeling and Validation ........................................................................................... 30
5. Parametric Study ....................................................................................................... 32 5.1 Effect of Foundation Stiffness and Damping ............................................................ 32 5.2 Effect of Rail Surface Perturbation ........................................................................... 35 5.3 Effect of Track Settlement ........................................................................................ 40
6. Conclusion ................................................................................................................. 46
7. References ................................................................................................................. 48
Abbreviations and Acronyms ....................................................................................................... 50
iv
Illustrations
Figure 1. Schematic Drawing of a Turnout .................................................................................... 5
Figure 2. Typical North American Crossing Diamond ................................................................... 5
Figure 3. Typical North American Fixed-Point Frog (RBM frog) ................................................. 6
Figure 4. Wheel Load for a High-Angle Crossing Diamond .......................................................... 8
Figure 5. Normalized Dynamic Load ............................................................................................. 9
Figure 6. Spring Frog .................................................................................................................... 12
Figure 7. Partial Flange-Bearing Frog .......................................................................................... 13
Figure 8. Movable Point Frog ....................................................................................................... 14
Figure 9. All-Rail Crossing Diamond ........................................................................................... 15
Figure 10. Reversible Casting Diamond (AMS)........................................................................... 16
Figure 11. Solid Casting Diamond................................................................................................ 17
Figure 12. Flange-Bearing Frog Diamond .................................................................................... 18
Figure 13. Effect of Track Damping on Maximum Wheel Load at Flangeway Gaps .................. 24
Figure 14. A Diamond Crossing Tested at FAST ......................................................................... 25
Figure 15. Load Cell Instrumentation on Diamond Crossing ....................................................... 26
Figure 16. Measured Maximum Wheel Vertical Forces ............................................................... 26
Figure 17. Measured Load Cell Forces ......................................................................................... 27
Figure 18. Measured Rail Deflection ............................................................................................ 28
Figure 19. Carbody Acceleration over Diamond Crossing ........................................................... 29
Figure 20. Truck Side Frame Acceleration over Diamond Crossing............................................ 29
Figure 21. Predicted and Measured Static Rail Deflection under Loaded Car ............................. 30
Figure 22. Predicted and Measured Wheel Vertical Dynamic Load ............................................ 30
Figure 23. Predicted Load Cell Forces ......................................................................................... 31
Figure 24. Comparison of Predicted and Measured Rail Deflection ............................................ 31
Figure 25. Effect of Foundation Stiffness (connection damping between rail and ground 30 lb/in/s, 40 mph) ........................................................................................... 32
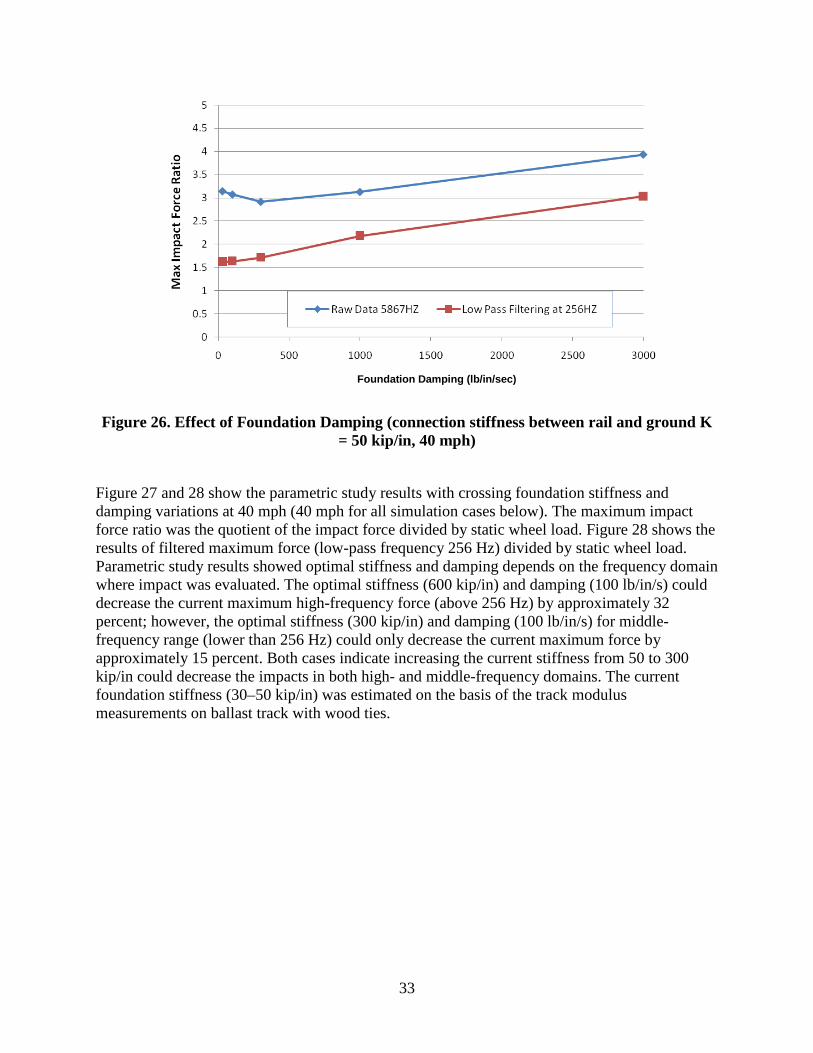
Figure 26. Effect of Foundation Damping (connection stiffness between rail and ground K = 50 kip/in, 40 mph) ................................................................................................. 33
Figure 27. Effect of Foundation Stiffness and Damping (High Frequency)................................. 34
Figure 28. Effect of Foundation Stiffness and Damping (middle frequency) .............................. 34
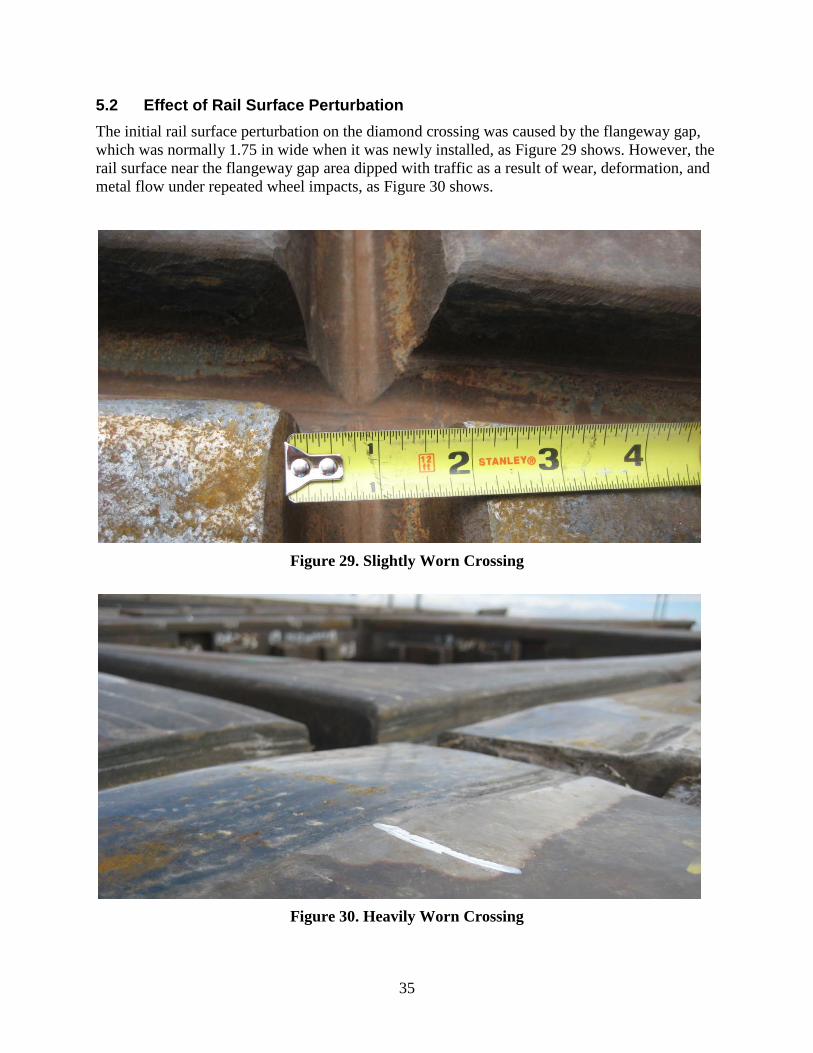
Figure 29. Slightly Worn Crossing ............................................................................................... 35

v
Figure 30. Heavily Worn Crossing ............................................................................................... 35
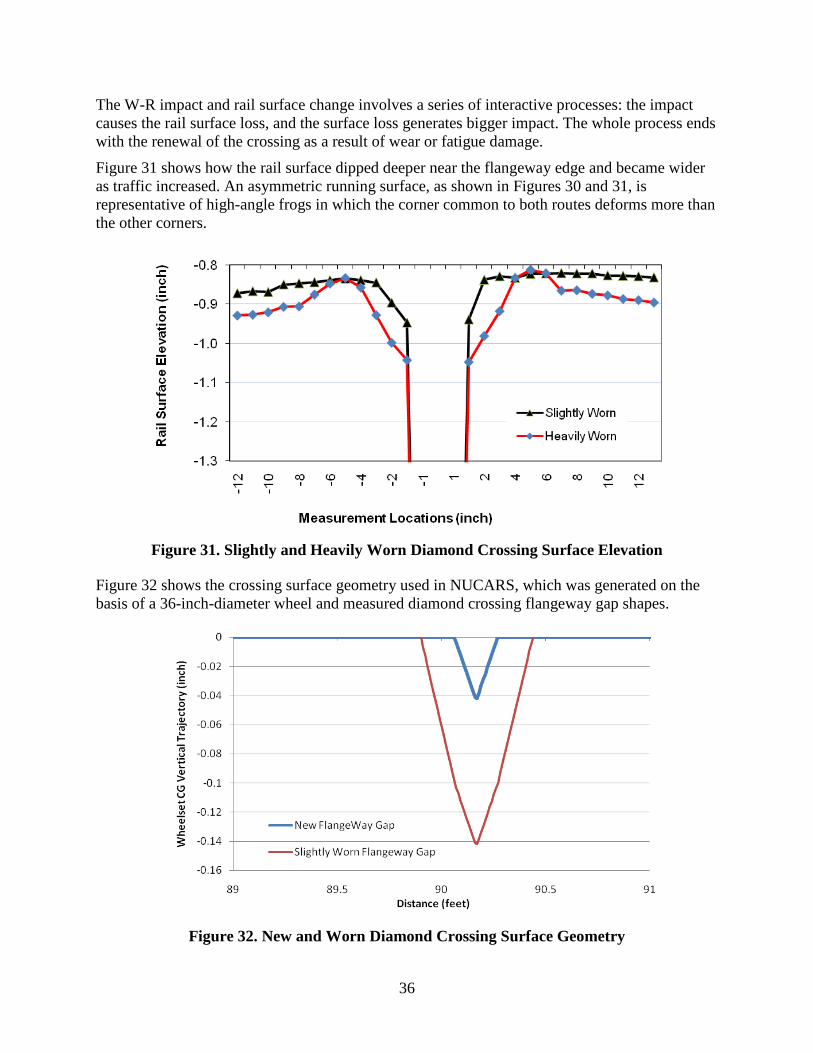
Figure 31. Slightly and Heavily Worn Diamond Crossing Surface Elevation ............................. 36
Figure 32. New and Worn Diamond Crossing Surface Geometry ............................................... 36
Figure 33. High-Frequency Impact on Slightly Worn Diamond Crossing ................................... 37
Figure 34. Middle-Range Frequency Impact on Slightly Worn Diamond Crossing .................... 37
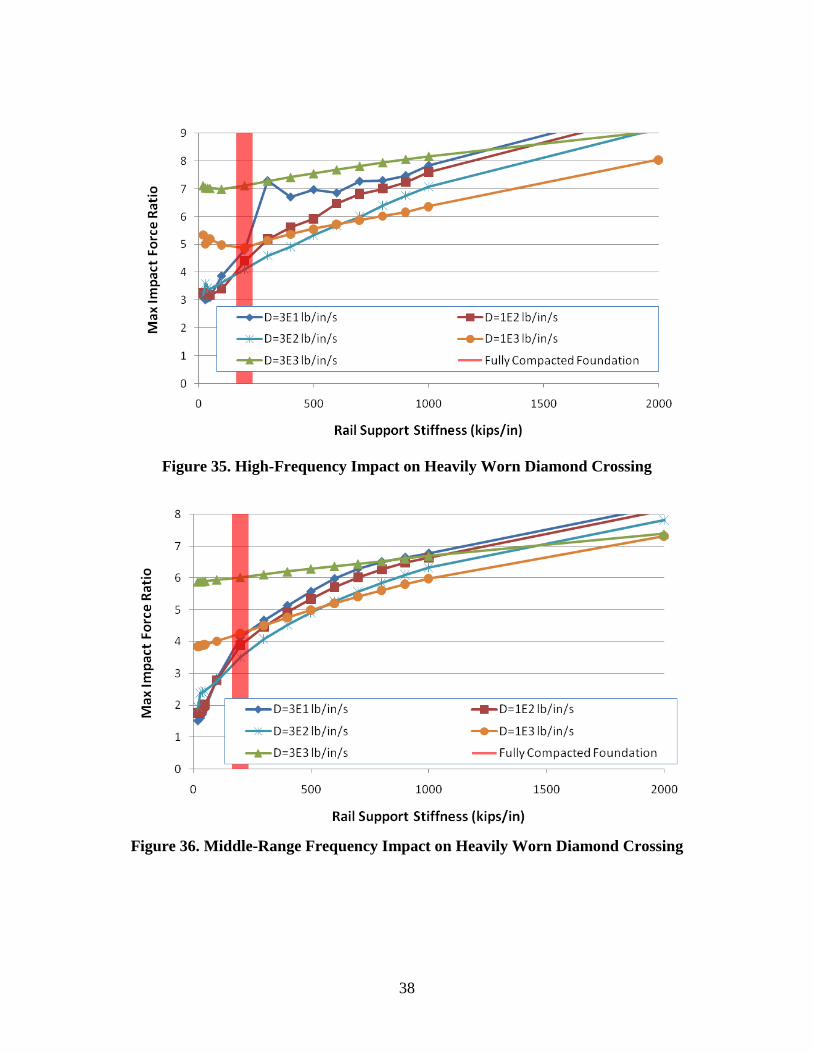
Figure 35. High-Frequency Impact on Heavily Worn Diamond Crossing ................................... 38
Figure 36. Middle-Range Frequency Impact on Heavily Worn Diamond Crossing .................... 38
Figure 37. Measured Wheel Vertical Forces on Slightly and Heavily Worn Diamond Corner ........................................................................................................... 39
Figure 38. Stress-Strain–Dependent Characteristic of Ballast (excerpt from Selig (22))............. 40
Figure 39. Track Differential Settlement and Flangeway Gap Geometry .................................... 41
Figure 40. Effect Of Foundation Stiffness and Damping on High-Frequency Impact (new crossing with a 0.1-inch track differential settlement) ........................................ 41
Figure 41. Effect of Foundation Stiffness and Damping on Middle-Range Frequency Impact (new crossing with a 0.1-inch track differential settlement) ........................................ 42
Figure 42. Track Differential Settlement in a Scaled Rubber Panel Tested at FAST .................. 43
Figure 43. Gap under Platework because of Track Foundation Settlement ................................. 44
Figure 44. Effect of Foundation Stiffness and Damping on High-Frequency Impact (new crossing with 0.4-inch track differential settlement)........................................... 45
Figure 45. Effect of Foundation Stiffness and Damping on Middle-Range Frequency Impact (new crossing with 0.4-inch track differential settlement) .............................. 45
vi
Tables
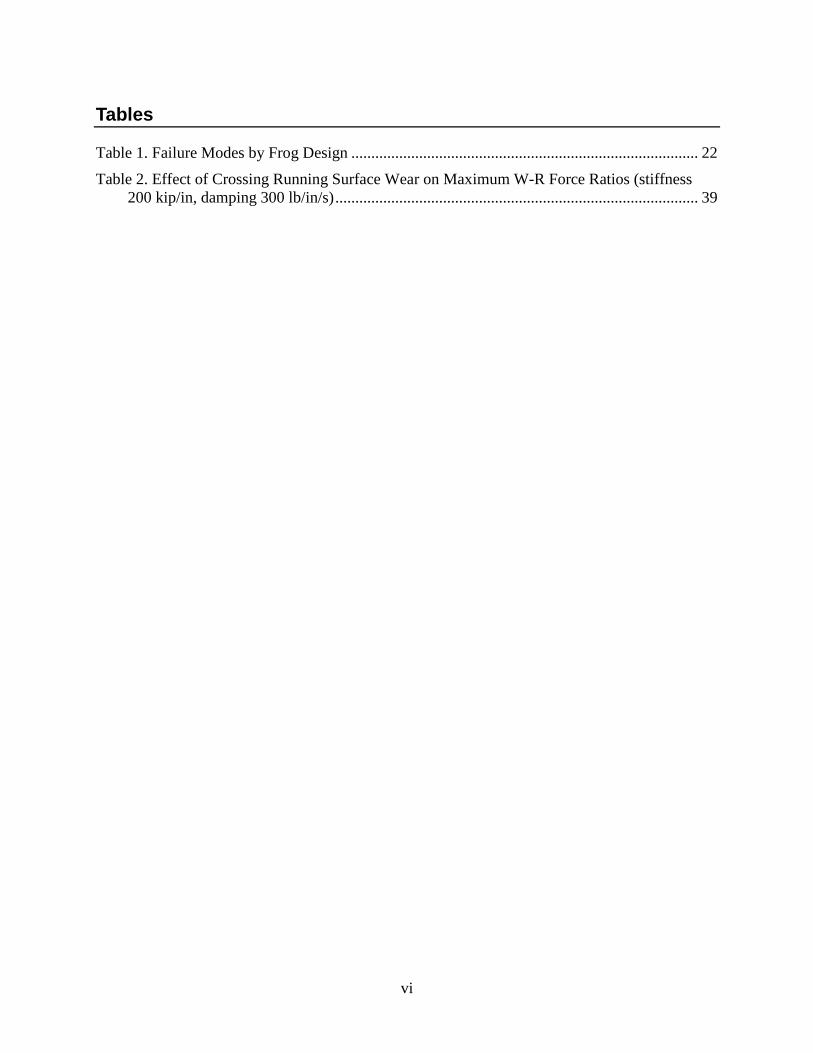
Table 1. Failure Modes by Frog Design ....................................................................................... 22
Table 2. Effect of Crossing Running Surface Wear on Maximum W-R Force Ratios (stiffness 200 kip/in, damping 300 lb/in/s) ........................................................................................... 39

1
Executive Summary
Transportation Technology Center, Inc. (TTCI), conducted a study on “Next-Generation Foundation for Special Trackwork—Phase I” under task order 265 of Federal Railroad Administration’s (FRA) research and development plan. The scope of the first phase of this study includes literature review, service load environment measurement, and parametric study.
This report reviews the dynamic load environment and failure modes of special trackwork frog foundations. The literature survey showed that rail surface loss and track differential settlement were the top crossing failure modes; rail surface perturbation, track differential settlement, and foundation stiffness and damping have the most significant effects on wheel-rail (W-R) impact for heavy haul axle load operation among all other factors.
TTCI conducted diamond crossing service load environment measurements at the Facility for Accelerated Service Testing High Tonnage Loop (FAST HTL) by using wayside instrumentation, instrumented (with strain gages and accelerometers) freight car (IFC), and load measuring instrumented wheelsets (IWS). Test results were used to benchmark the vehicle and track model. The field measurements confirmed previous work to describe the dynamic load environment of frogs in heavy axle load (HAL) service and added some additional findings:
• Maximum dynamic wheel loads of 60,000–100,000 pounds (lb) were measured at 10–25 miles per hour (mph), respectively. The static wheel load of this wheelset was 39,000 lb.
• Wayside measurement showed that uneven contact between diamond crossing components resulted in “hot spots” and load variations, which could cause component damage and foundation degradation.
A parametric simulation study conducted with NUCARS®* showed the following:
• A local optimum damping value produces minimum dynamic W-R force for each track stiffness. The optimum combination changes with each stiffness or damping value. The optimum is also dependent on the load duration of interest, which means the same track properties will not minimize flangeway impacts and rebound dynamic loads (i.e., the commonly called P1 and P2 forces) simultaneously.
• For new crossings without any track differential settlement, optimal foundation stiffness and damping could lower the current W-R impact by 30 percent.
• For worn crossings, W-R impact increases significantly with foundation stiffness and damping.
• W-R impact increases with track differential settlement, especially at the frog flangeway gaps.
Although track degradation and stiffness variations are inevitable for the current crossing designs, the modeling results suggest that crossing performance and service life could be improved by using the following guidelines for design and maintenance:
* NUCARS is a registered trademark of the Transportation Technology Center, Inc.
2
• Build the foundation with optimal stiffness and damping when a crossing is installed.
• Adjust the foundation stiffness and damping during its service life on the basis of the crossing conditions, which can best be done on current designs by renewing the ballast layer and surfacing the track.
• Minimize crossing foundation differential settlement; mitigate the effects of differential settlement with track surface “ramps” that lengthen the distance over which the elevation change occurs.
• Design durable crossing structures including components, assembly, and fixation systems, which are capable of absorbing the high-frequency impact energy from the beginning of the energy transfer routine.
These guidelines can be used to decrease W-R impact and slow down the rail surface loss and track foundation degradation. Further tests and simulations are recommended in the phase II study to validate these guidelines and develop a prototype design. The following tasks are planned for the next phase of work:
• Evaluate foundation materials, including nonsoil subgrades, which will minimize differential settlement.
• Investigate the elimination of ballast from the frog foundation. Ballast is largely responsible for the changes in stiffness, damping, and differential settlement seen in current frog designs.
• Develop frog designs that are optimized to minimize dynamic loading.
3
1. Introduction
1.1 Background Development of improved performance frogs is a railway industry goal. Frogs are used in turnouts and rail crossings to allow flanged railway vehicle wheels on one rail to cross through another rail. These devices make possible the turnouts and crossing diamonds which railways use to control traffic on their networks. As such, frogs are essential elements in the safety, efficiency, reliability, and capacity of the railway network, but they are subject to more severe service load environments, shorter service lives, more frequent maintenance, and experience more safety issues compared with open track. The goal is to develop improved designs that better account for the unique dynamic load environment that exist at these locations from running surface discontinuities, such as flangeway gaps. A multiyear research project sponsored by FRA was initiated by TTCI to investigate developing new designs for next generation foundation for special trackwork.
1.2 Objectives The research is intended to improve the dynamic performance of frogs in revenue service to improve safety. Direct benefits in the form of lower forces and reduced derailment risk at frogs will result; indirect benefits such as lowered vehicle component dynamic loading will result in longer fatigue lives and fewer service failures for wheels, axles, and other truck components.
1.3 Overall Approach Project elements include the following:
• Development of a detailed test plan with participation and review by FRA and the John A. Volpe National Transportation Systems Center
• Review of relevant frog failure modes
• Measurement of service load environment and load path
• Computer modeling and analysis of foundation parameters and their effects The literature review results helped to determine the essential features for the modeling effort and necessary field test plan parameters. The field test site was a materials test bed at Facility for Accelerated Service Testing (FAST) with a high-angle diamond. The vehicle-track computer simulation model was built using the NUCARS track model. NUCARS has been used successfully in previous special trackwork development efforts.
1.4 Scope The scope of the work for the first phase of this project included a literature review, service load environment measurement, and modeling. Effects of foundation parameters on frog performance were investigated through a NUCARS parametric study. Recommendations for improving frog performance and service life have been proposed, based on the parametric study.
4
1.5 Organization of the Report This technical report is organized as follows: Section 1, the background of this study; Section 2, the current state of practice related to special trackwork foundation; Section 3, the diamond crossing service load environment test results; Section 4, the vehicle-track model and modeling validation; Section 5, parametric study results; and Section 6, findings from this study.

5
2. Current State of Practice
Frogs are used in turnouts and crossing diamonds. Turnouts are used to move trains from one track to another. Each turnout consists of a switch and a frog. Figure 1 shows a schematic drawing of a turnout. The frog allows wheels to make a level crossing through the rail of another track. Figure 2 shows a crossing diamond. This device is used to allow trains to cross another track at the same elevation. No option to change track is available, however. The crossing diamond consists of four frogs.
Figure 1. Schematic Drawing of a Turnout
Figure 2. Typical North American Crossing Diamond
6
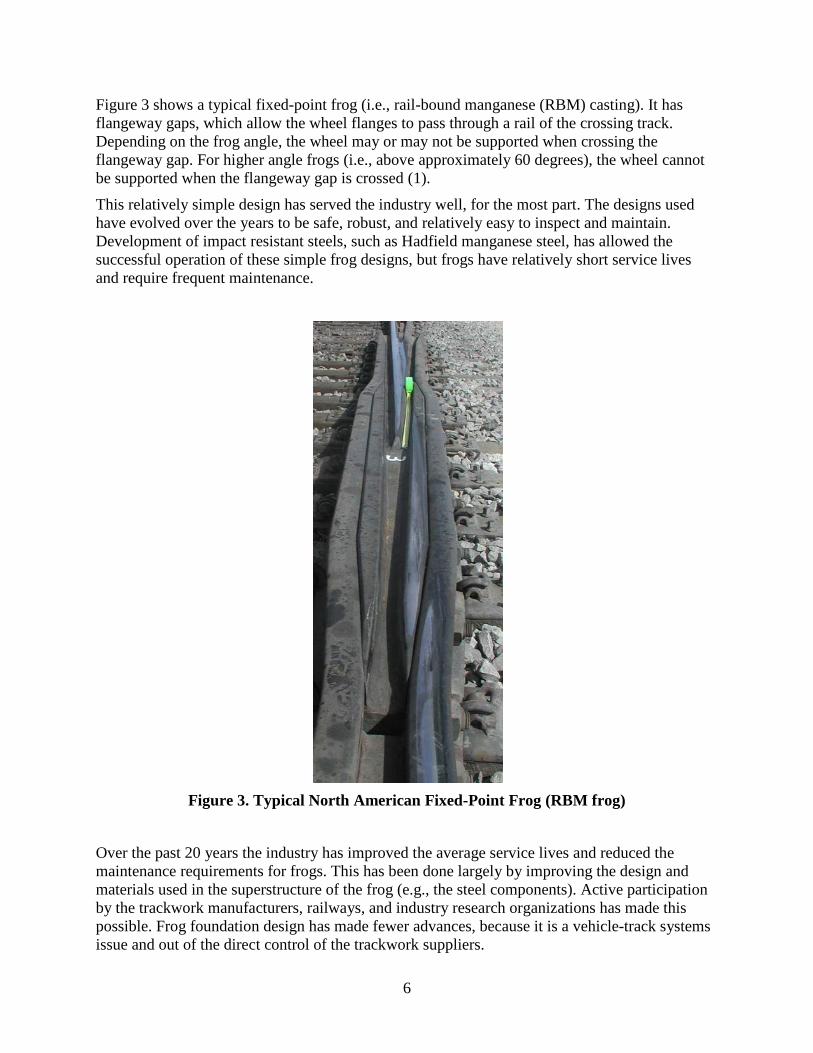
Figure 3 shows a typical fixed-point frog (i.e., rail-bound manganese (RBM) casting). It has flangeway gaps, which allow the wheel flanges to pass through a rail of the crossing track. Depending on the frog angle, the wheel may or may not be supported when crossing the flangeway gap. For higher angle frogs (i.e., above approximately 60 degrees), the wheel cannot be supported when the flangeway gap is crossed (1).
This relatively simple design has served the industry well, for the most part. The designs used have evolved over the years to be safe, robust, and relatively easy to inspect and maintain. Development of impact resistant steels, such as Hadfield manganese steel, has allowed the successful operation of these simple frog designs, but frogs have relatively short service lives and require frequent maintenance.
Figure 3. Typical North American Fixed-Point Frog (RBM frog)
Over the past 20 years the industry has improved the average service lives and reduced the maintenance requirements for frogs. This has been done largely by improving the design and materials used in the superstructure of the frog (e.g., the steel components). Active participation by the trackwork manufacturers, railways, and industry research organizations has made this possible. Frog foundation design has made fewer advances, because it is a vehicle-track systems issue and out of the direct control of the trackwork suppliers.

7
The safety record of frogs is generally very good. Although special trackwork (i.e., turnouts and crossing diamonds) is typically the third leading cause of track-related derailments, those attributed to frogs are fewer than those attributed to switches (2). However, frog performance is a contributor to many vehicle-caused derailments. The high dynamic forces generated at frogs contribute significantly to wheel, axle, bearing, and truck component failures. Special trackwork and track transitions have been shown to be among the most common track features associated with high dynamic loading in vehicles (3). It has also been shown that high dynamic loading (from wheel profile defects) is associated with wheel, axle, and bearing failures. The use of wheel impact load detectors, for example, has led to significant decreases in wheel service failures (4). Similarly, improvement in the dynamic performance of frogs will decrease the fatigue accumulation rate in virtually all revenue service wheels.
The designs used have raised wheel guards throughout and special alloy steel inserts. These features allow for high vertical dynamic loading while reliably guiding the wheelsets down the intended route through the frog. This project examines what can be done practically to improve the dynamic performance of frogs through foundation design changes.
TTCI conducted a literature survey to determine the current state of frog performance and foundation design practice. The survey was documented in following subsections.
2.1 Frog Service Environment All fixed-point frogs have a high dynamic load environment, which are due to the following factors:
• Flangeway gaps — Gaps in the running surface of the frog
• Joints — Running surface discontinuities at construction joints between rails and/or frog castings
• Nonconformal running surfaces — Because of thin sections and point slopes at frog points
• Track structure changes — Added structure to accommodate the high dynamic loads at flangeways. The nonstandard structure often has different dynamic properties than the rest of the track
The flangeway gap is the most important factor influencing frog performance. It is the largest of several running surface discontinuities in the frog. When new, the flangeway gap is 1-7/8 inch (in) wide at the gage line of the frog. With rounded corners, it makes the actual running surface gap approximately 2-1/2 to 3 in for a 90-degree angle frog. Assuming the running surfaces have the appropriate shapes and elevations to accommodate the wheels operating over it, the effective gap decreases as the frog angle decreases. Thus, turnout frogs, with angles of approximately 3–5 degrees, have a complete longitudinal overlap of support. In theory, the wheel is continuously supported across the gap. However, deformation and wear of the frog running surfaces can make the effective gap of worn frogs considerably larger.
Figure 4 shows the measured force at the W-R interface of a 315,000-pound car operating over a new high-angle crossing diamond at 40 mph, resulting in vertical wheel forces of 120,000 lb (or three times the static wheel load). Note that the flangeway impact is a high-frequency event, followed by a secondary wheel bounce of lower magnitude and longer duration. Several

8
researchers have attributed the initial impact as the cause of superstructure damage, such as running surface cracking, broken bolts, and plate weld failures (5). The secondary wheel bounce is often attributed as the source of foundation layer damage, such as ballast breakdown and loss of track surface. The wheel bounce is a lower frequency event that may put more total energy into the frog. This longer duration event has sufficient time to affect the foundation of the frog, whereas the initial impact event does not have sufficient time or energy to affect it.
Figure 4. Wheel Load for a High-Angle Crossing Diamond
Although a high angle frog is potentially the worst case for dynamic loading, lower angle frogs also can generate high dynamic loads. Other factors can become important as the frog angle decreases. These factors remain relatively constant with respect to angle. Figure 5 shows a summary of the measured dynamic loads on crossing diamonds and turnout frogs versus speed for 315,000-pound cars tested at FAST. Compared with open track, the frogs are significant outliers, with a service environment unlike the rest of the track.

9
Figure 5. Normalized Dynamic Load
Running surface joints are also prevalent in frogs. Mechanical joints often occur where the frog casting and running rails meet. These locations can be flash welded, if it is a butt joint. For splice joints and wrap rail joints on turnout frogs, the rail cannot be welded easily to the casting. The use of rail and flat surface castings create running surface discontinuities as the wheel transitions from one shape (e.g., rail) to another (e.g., casting). The rail is often bent away from the direction of travel as well. With bolted connections, there is often differential movement of components relative to each other under load. Thus, these running surface joints often create discontinuities in the running surface that result in dynamic loads.
Added structure accommodates the high dynamic loads at frog flangeways. The nonstandard structure often has different dynamic properties than the rest of the track. It is usually stiffer and may have less damping. As a result, the structure change itself can cause dynamic loads. Previous FRA projects have reviewed the effects of track property changes at track transitions, such as bridges, road crossings, and special trackwork. Plotkin and Davis (6) attributed the high dynamic loads at these locations largely to track surface defects resulting from differential settlement. They further evaluated theoretically the effects of changing track stiffness, damping, and settlement independently. The study suggested that stiffness, by itself, could affect maximum vertical loading by approximately 6–8 percent. They analyzed a case in which the wheel load travels from a soft (2,000 lb/in/in) track modulus in the approach track to a very stiff (30,000 lb/in/in) modulus assumed for an open deck bridge. For these track modulus values and with a 136-pound rail loaded by an assumed 33,000-pound wheel load, the wheel will change in elevation by approximately 1/8 in under quasi-static loading conditions. The dynamic load increase in going from a stiff bridge to a soft approach was less than 6 percent.
10
Thus, if one could maintain a track to be level across an abrupt stiffness change (e.g., from a soft approach to an open deck bridge), the increased vertical loading on the bridge would be only 6–8 percent. The report provided more field data from load measuring wheelsets on Amtrak high-speed routes, where travel over open deck bridge transitions shows very low dynamic loads.
Lundquist and Dahlberg (7) constructed a finite element model to analyze W-R forces from a 24,000-pound wheel load traversing an abrupt change in track stiffness from 250,000 to 500,000 lb/in at 200 mph. For an assumed rail weight of 136 lb/yard, this relates to track modulus values of 2,775 and 7,000 lb/in/in, respectively. Note that the stiffness increase is not as large as assumed by the Plotkin and Davis analysis, but the vehicle speed is considerably greater. Lundquist and Dahlberg showed that the sudden change in track stiffness produced a dynamic increase in wheel load of approximately 2,000 lb (or an 8 percent increase) when traveling from soft to stiff track and a dynamic wheel load increase of 1,600 lb (7 percent increase) when traveling from stiff to soft track. Lundquist and Dahlberg’s analysis further demonstrates that large, abrupt changes in track stiffness do not produce dynamic wheel load variations of the magnitude commonly thought to occur.
These findings cast serious doubt on the commonly held belief that track stiffness changes are the cause of high dynamic loading at these locations. Track stiffness changes do not generate the high dynamic loading at bridge approaches that causes track surface defects. The dynamic loads created by stiffness changes are not where the low spots on the approach are typically located. Differential settlement, related to the track structure and stiffness change, is more likely a cause of the track geometry defects that ultimately generate high dynamic forces. Thus, the correlation of high forces and track structure changes is strong, but the cause-effect relationship and the commonly believed failure mode are not correct.
Plotkin and Davis’ FRA report evaluated the effects of track stiffness changes on track component forces. The results confirm that components, such as crossties, will experience higher loads and stresses on a stiff foundation that the same components will experience on a soft foundation (all other conditions being equal). Field experience confirms this finding. Many cases of track deterioration, such as concrete tie cracking and fasteners breaking, are documented, occurring sooner on stiff ballast deck bridges (8, 9).
2.2 Frog Service Life The service life of frogs has been improving over the past 20 years as designers have adapted to heavier wheel loads and improved frog designs. The better performing frogs have replaced a large portion of the total population in mainline track, because frogs have a relatively short service life. The average service life of a mainline number 20 fixed-point frog in HAL service is estimated to be 580 million gross tons (MGT) (10). This compares favorably to the 220 MGT average service life in 1993 (11). Frog service life improvement was attributed to better quality frog castings, improved maintenance, and improved designs of the steelwork.
The average service life of high-angle crossing diamonds is more difficult to determine because of the relatively small population and the tendency to replace components rather than whole diamonds. The Association of American Railroads (AAR) estimated the increase in average service lives for turnout and crossing diamond frogs from 1990 to 2005 as 257 and 500 percent, respectively.

11
The effect of wheel load on crossing diamonds is quite significant. Short service lives were documented for frogs used in HAL service at FAST (1). These ranged from 5 to 20 MGT for designs that had 100–300 MGT service lives under 100- and 110-ton service. This can be partly explained by the operating requirements of the HTL at FAST (i.e., condition-based speed restrictions cannot be allowed because of their effects on productivity). However, most crossing diamonds in revenue service have a speed restriction, which extends service lives.
2.3 Designs Currently Used Freight railroads have traditionally used tread-bearing frogs for crossing diamonds and turnouts. In tread-bearing frogs, a flangeway gap in the running surface is cut to allow the crossing track wheel flanges passage through the running rails. For high-angle frogs, no provision is made to support the wheel across this gap; the wheel is intended to jump across. These frogs are simple and generally cheaper to build than flange-bearing types.
In general, the designs used are simple and robust. Typically, a full flangeway guides wheels to the intended path. Wheelset guarding is redundant in many designs. Raised inner guards are common for most high-angle frogs. The raised height allows the guard to contact more area on the wheel, lowering the maximum stress on the wheel.
With tread-bearing frogs, there is significant potential for high dynamic loads as wheels travel across unsupported flangeway gaps. At angles above approximately 60 degrees, it is not possible for a typical wheel with a 5- to 6-inch-wide tread to span across a flangeway and to remain in contact with both sides. At angles lower than 60 degrees, wheels may not be supported across the flangeway gaps because of the shapes of the wheel and frog running surfaces. In fact, dynamic loads occur on turnout frogs as a result of wing and point height mismatches and wheel and frog profile mismatches. Measured dynamic wheel loads of up to twice the static wheel load are not uncommon (12).
Because of the service load environment, most frogs are built with a relatively large structure, as compared with the rest of the track.
North American freight railroads use the following four types of turnout frogs:
• Fixed point frogs — Have no moving parts (i.e., they have a fixed point). • Movable wing (or spring) frogs — Have a movable diverging side wing, which is
normally closed against the point. As a result, wheels on the mainline route have a continuous running surface.
• Partial flange bearing (or Lift or Jump) frogs — Have a fixed-point and a continuous running surface for the mainline route. Diverging wheels are raised over the mainline rail on tread and flange bearing ramps.
• Movable point (or swing nose) frogs — Have a movable point, thrown by a switch machine, and resembles a switch point. This frog provides a continuous running surface for both routes.
Most fixed-point frogs used today are RBM casting frogs (Figure 3). The frog intersection consists of a high-alloy (14-percent manganese) steel casting. The casting is bound by rails, which are fastened to the casting with bolts and nuts. This design is effective in its use of tough, impact-resistant austenitic manganese steel for the frog intersections and low-cost conventional
12
rail for the rest of the frog. Some low-tonnage applications will have all-rail frogs. All-rail frogs consist entirely of rail, with points made from rail sections.
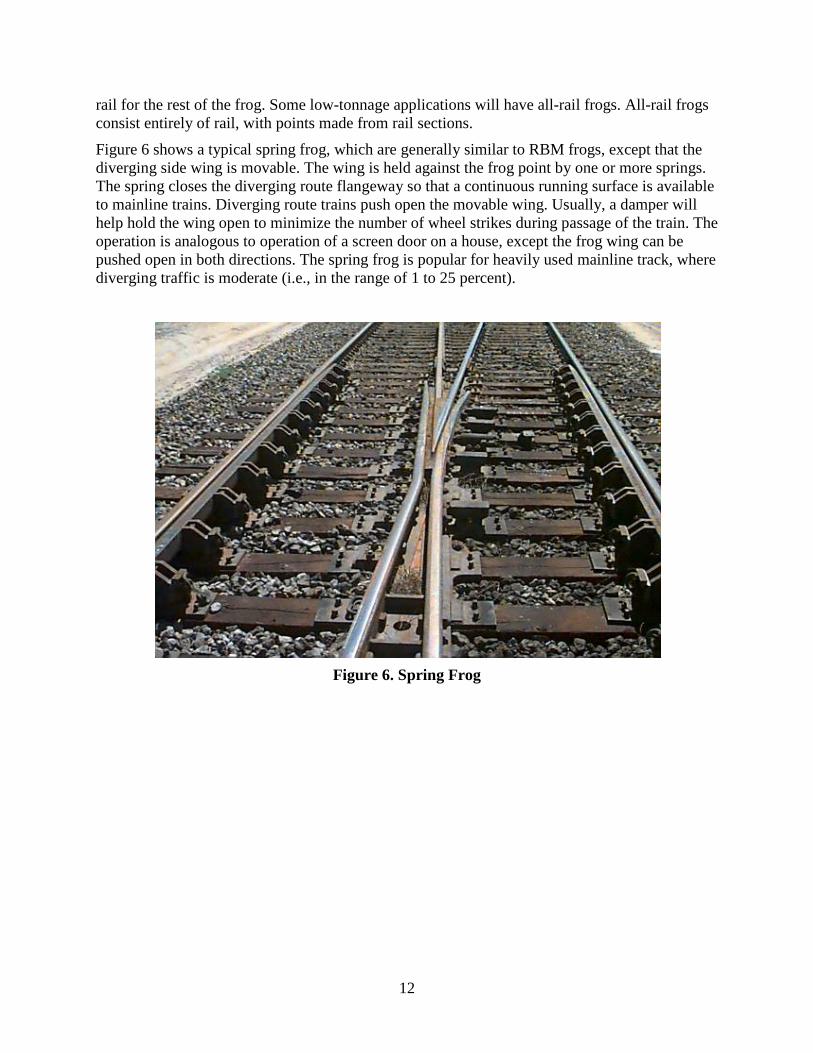
Figure 6 shows a typical spring frog, which are generally similar to RBM frogs, except that the diverging side wing is movable. The wing is held against the frog point by one or more springs. The spring closes the diverging route flangeway so that a continuous running surface is available to mainline trains. Diverging route trains push open the movable wing. Usually, a damper will help hold the wing open to minimize the number of wheel strikes during passage of the train. The operation is analogous to operation of a screen door on a house, except the frog wing can be pushed open in both directions. The spring frog is popular for heavily used mainline track, where diverging traffic is moderate (i.e., in the range of 1 to 25 percent).
Figure 6. Spring Frog

13
Partial flange bearing frogs are used for very low diverging tonnage mainline turnouts, such as bad order set out tracks or industry sidings directly off the mainline. Figure 7 shows a partial flange-bearing frog, which function by having diverging wheels pass over (not through) the mainline rail. The frogs have a tread-bearing ramp in the toe end of the frog and a flange-bearing ramp in the heel end. The diverging wheels run across the mainline rail in flange bearing (13).
Figure 7. Partial Flange-Bearing Frog
14
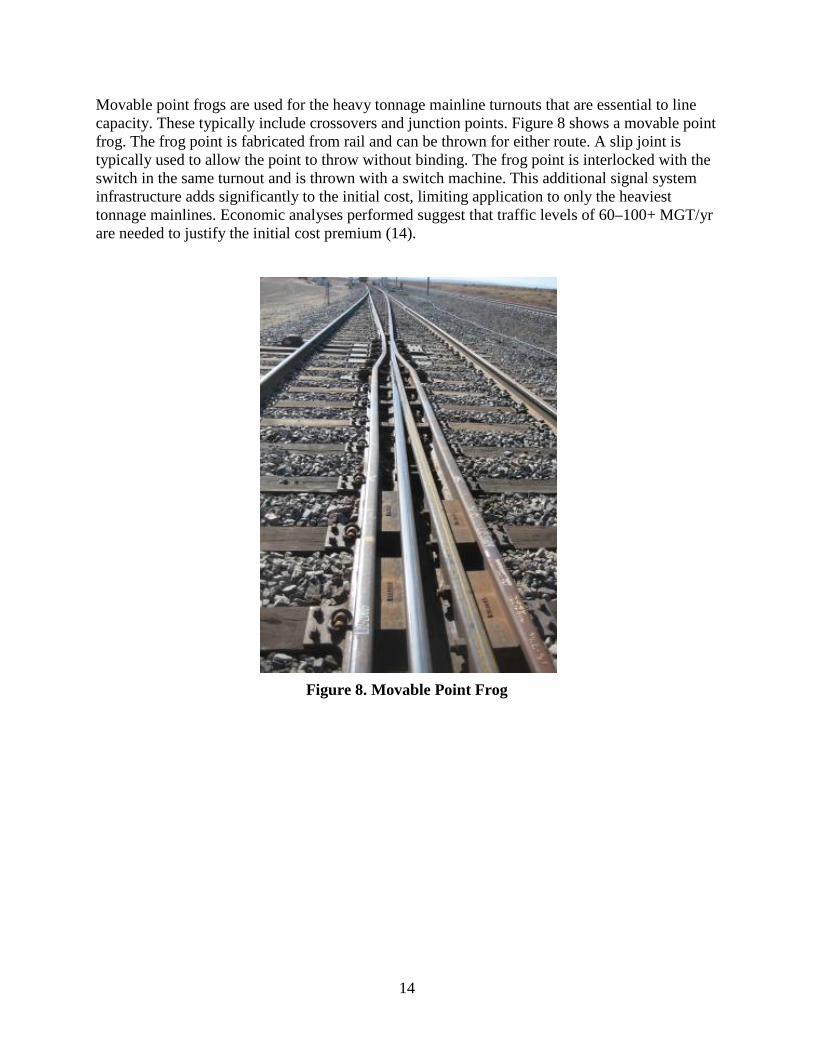
Movable point frogs are used for the heavy tonnage mainline turnouts that are essential to line capacity. These typically include crossovers and junction points. Figure 8 shows a movable point frog. The frog point is fabricated from rail and can be thrown for either route. A slip joint is typically used to allow the point to throw without binding. The frog point is interlocked with the switch in the same turnout and is thrown with a switch machine. This additional signal system infrastructure adds significantly to the initial cost, limiting application to only the heaviest tonnage mainlines. Economic analyses performed suggest that traffic levels of 60–100+ MGT/yr are needed to justify the initial cost premium (14).
Figure 8. Movable Point Frog
15
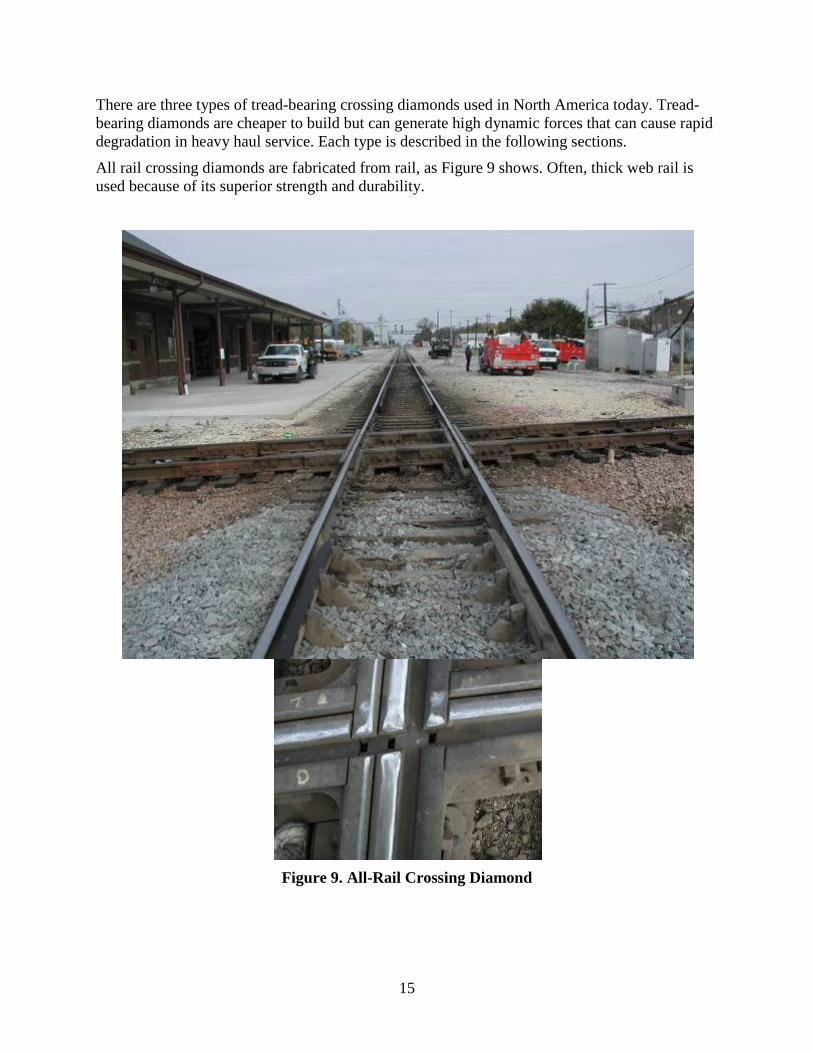
There are three types of tread-bearing crossing diamonds used in North America today. Tread-bearing diamonds are cheaper to build but can generate high dynamic forces that can cause rapid degradation in heavy haul service. Each type is described in the following sections.
All rail crossing diamonds are fabricated from rail, as Figure 9 shows. Often, thick web rail is used because of its superior strength and durability.
Figure 9. All-Rail Crossing Diamond

16
Reversible casting diamonds have austenitic manganese steel (AMS) insert castings in the frogs. The frogs are high-angle versions of railbound frogs used in turnouts, as Figure 10 shows. They are composite rail and casting frogs.
Figure 10. Reversible Casting Diamond (AMS)

17
Solid casting diamonds have AMS castings, but they are larger castings. Each frog is composed of a casting only, as Figure 11 shows.
Figure 11. Solid Casting Diamond

18
Flange-bearing frog crossing diamonds exist in very small numbers. These diamonds are flange bearing for both tracks, requiring maintenance of a level flangeway floor for both routes through a frog. Flange-bearing frog diamonds have the potential to reduce dynamic loading on vehicles by a significant amount. In 2010, AAR obtained a waiver of the FRA track safety standards, allowing large-scale implementation of flange-bearing frog crossing diamonds to begin. Figure 12 shows a flange bearing frog diamond on CSX at Shelby, OH.
Figure 12. Flange-Bearing Frog Diamond
19
2.4 Failure Modes Frog failure modes are many as reported in revenue service, including the following most common causes:
• Running surface height loss (metal flow and wear) • Differential settlement • Casting cracking • Frog point cracking (casting or rail point) • Rail bolt hole cracks • Joint bar cracking • Track bolt failures • Platework cracking • Rail fastener and shoulder weld fatigue • Plate welded stop failure • Crosstie splitting • Crosstie to ballast abrasion • Loss of alignment
These failure modes are indicative, for the most part, of fatigue failures. Some are from very low cycle and/or capacity failures. Wear is not often the root cause of failure and removal of frogs. Because of the high dynamic loading at these locations, fatigue is the dominant failure mode for HAL service.
The following are brief descriptions of each failure mode and its association with a particular design type:
• Running surface height loss (metal flow) — This occurs because of high dynamic loading and/or thin sections on high-angle frogs. The problem is worse on AMS frog castings, because the material has lower yield strength and higher ductility.
• Running surface height loss (wear) — This occurs because of high contact stresses and surface tractions at key locations in frogs. Running surface profiles are not always conformal to wheels, especially at thin sections of low-angle frogs. High-surface tractions can also result from wheels abruptly changing contact position in transitioning from wing to point or from rail to casting. AMS also tends to wear more than modern rail steels under the same loading.
• Track differential settlement (loss of surface) — The different traffic rates on mainline and diverging routes and the dynamic loading causes accelerated and uneven vertical settlement of track at and around frogs.
• Casting cracking — Frog castings crack after reaching ductility exhaustion. They will undergo plastic flow as they work harden. Eventually, they reach a flow limit (with AMS, this is ~20–25 percent strain). They are also made with large stress raisers at bolt holes and corners in the design. This was considered acceptable because of the high toughness of the casting material. A turnout frog may be 30–40 ft in length. Track settlement can put large forces in the frogs. Excessive bending under load can also cause casting cracking.
20
• Frog point cracking (casting or rail point) — This is often due to plastic surface flow or structural failure within the casting itself. The points have very severe service environments, with high dynamic loads and thin cross sections.
• Rail bolt hole cracks — Bolt hole cracking is common on the leg rails connected to frogs. Many rails are bolted to the frogs as a result of the dissimilar materials used for the rail and castings. Failure of the joints to stay in lateral compression often leads to the bolts acting as pins. This puts high loading (both longitudinal and vertical) on the rail at the bolt hole. The joints fail to stay in compression because of fretting of the casting, bolt, nut, and headlock surfaces under the dynamic load. Also, bolts may not be fully tightened because of lack of equipment and torque measuring devices.
• Track bolt failures — See Rail bolt hole cracks above. Also, the frog may be a longitudinal anchor in track. The high longitudinal forces from temperature changes are carried by the bolts in the frog to rail joints. These forces can exceed the capacity of the bolts, especially if the load distribution is uneven between bolts in a joint.
• Joint bar cracking — Joint bars are shear links between some large pieces, such as castings in a solid casting diamond. The joint bars are required to carry significant vertical loading as well as longitudinal loading between these frogs. In addition, the joints generate dynamic loading for wheels, especially when thermal loading pulls the castings apart.
• Platework cracking — The dynamic loading on frogs can be very large. These forces are borne by the platework under the castings. When the traffic rates are different on the two tracks of a crossing diamond or turnout frog, differential settlement can result. The frog platework often spans this settlement. The resultant bending load can fatigue the platework.
• Rail fastener and shoulder weld fatigue — Elastic fasteners used at frogs can suffer from the larger vertical deflections at these locations. Often, the clip is deflected beyond its working range. This results in larger-than-intended loads for the shoulder. The clip may fatigue, or the shoulder weld may fatigue and fail first. The shoulders also may have high lateral loading (i.e., longitudinal loading from the cross traffic), which fatigues the welds.
• Plate welded stop failure — High longitudinal loading from temperature changes and live loads can combine to fatigue stops welded to the platework. Inferior welding practices contribute to embrittlement and cracking of the platework.
• Crosstie splitting — Longitudinal forces and high vertical forces cause lateral and longitudinal forces on fasteners. Often, fasteners must be aligned in such a way as to cause splitting forces in crossties and longitudinal timbers.
• Crosstie to ballast abrasion — The high dynamic loading and large deflections can lead to accelerated ballast degradation. The high bearing pressures cause degradation of the tie bottom surface, as well.
• Loss of alignment — Longitudinal forces cause misalignment of track at frogs. At locations where two tracks cross two others, the entire crossing tends to rotate clockwise, because of right-handed operation of trains.
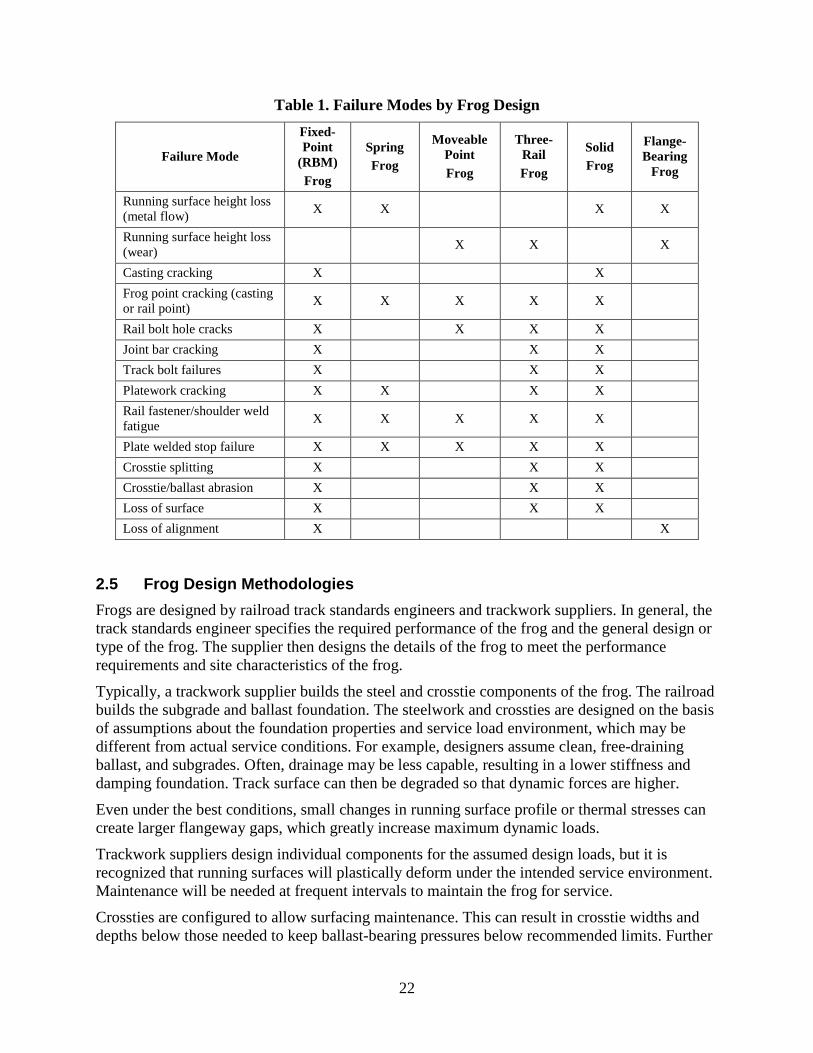
Table 1 shows a map of failure modes associated with each frog design. Note that failure modes associated with high dynamic loads are associated with unsupported flangeway designs. Thus,

21
the RBM, solid, and three-rail designs, with two unsupported flangeways each, have the most dynamic load associated failure modes. The spring frog design and the flange-bearing turnout frog have one unsupported flangeway each. The movable point frog and the flange-bearing frog diamonds have no unsupported flangeways.
22
Table 1. Failure Modes by Frog Design
Failure Mode
Fixed-Point
(RBM) Frog
Spring Frog
Moveable Point Frog
Three- Rail Frog
Solid Frog
Flange-Bearing
Frog
Running surface height loss (metal flow) X X X X
Running surface height loss (wear) X X X
Casting cracking X X Frog point cracking (casting or rail point) X X X X X
Rail bolt hole cracks X X X X Joint bar cracking X X X Track bolt failures X X X Platework cracking X X X X Rail fastener/shoulder weld fatigue X X X X X
Plate welded stop failure X X X X X Crosstie splitting X X X Crosstie/ballast abrasion X X X Loss of surface X X X Loss of alignment X X
2.5 Frog Design Methodologies Frogs are designed by railroad track standards engineers and trackwork suppliers. In general, the track standards engineer specifies the required performance of the frog and the general design or type of the frog. The supplier then designs the details of the frog to meet the performance requirements and site characteristics of the frog.
Typically, a trackwork supplier builds the steel and crosstie components of the frog. The railroad builds the subgrade and ballast foundation. The steelwork and crossties are designed on the basis of assumptions about the foundation properties and service load environment, which may be different from actual service conditions. For example, designers assume clean, free-draining ballast, and subgrades. Often, drainage may be less capable, resulting in a lower stiffness and damping foundation. Track surface can then be degraded so that dynamic forces are higher.
Even under the best conditions, small changes in running surface profile or thermal stresses can create larger flangeway gaps, which greatly increase maximum dynamic loads.
Trackwork suppliers design individual components for the assumed design loads, but it is recognized that running surfaces will plastically deform under the intended service environment. Maintenance will be needed at frequent intervals to maintain the frog for service.
Crossties are configured to allow surfacing maintenance. This can result in crosstie widths and depths below those needed to keep ballast-bearing pressures below recommended limits. Further
23
work is needed to develop crosstie configurations that perform well but can still be tamped when needed.
Ballast is desired to allow surfacing the track. Because the frog generally settles more than its surrounding track, the frog is often raised upon surfacing.
Subgrade strengthening is popular for frogs, especially for high-angle crossing diamonds. Hot mix asphalt (HMA) is frequently built as a replacement for native soils under crossing diamonds. The HMA is rolled and compacted, as one would build a highway pavement (15). The HMA protects the underlying soil from water. It also provides a uniform, stronger base, provided the subgrade is sufficiently strong to support it. Once the frog area and its approaches are paved, the HMA can help tie the approach track and the frog together. Rose (16) has developed design methods for HMA track underlayments.
2.6 Research Needs What is often lacking in frog design is a coherent system design. Individual components are designed well, but there is no system optimization. Because of the unsupported flangeways and their resultant dynamic loads, the frog is typically stiffer and more massive than the surrounding track. Transitioning from the surrounding track to the frog is often underappreciated by the trackwork supplier and the track engineer. This aspect of design may be sacrificed if the frog buyer is concerned more with initial cost than life-cycle cost.
Also, dynamic design tools, which would allow the frog designer to minimize vehicle dynamic loads, may not be readily available. Tools, such as NUCARS (17), have been used in this study to guide frog designers toward designs, which will minimize vehicle dynamic loads. Much has been done in recent years to mitigate the effects of HAL on frog service life. Elimination of unsupported flangeway gaps by use of flange-bearing frogs has the largest potential to improve performance (18). Fewer revolutionary design changes, such as running surface profile ramps, have reduced maintenance and increased service life for turnout and crossing diamond frogs (19).
Singh (20) examined the effects of varying frog stiffness and damping on vehicle forces. The study showed that frog stiffness would not have a large effect on maximum dynamic forces. The flangeway gap and running surface profiles were major determinants of the impact force generated. However, track damping could affect the magnitude and duration of these forces. Also, there appears to be an optimal damping range for minimizing the maximum dynamic force. As Figure 13 shows, this range is likely more damping than is currently present in frogs in revenue service.

24
Figure 13. Effect of Track Damping on Maximum Wheel Load at Flangeway Gaps
25
3. Dynamic Load and Deflection Measurement
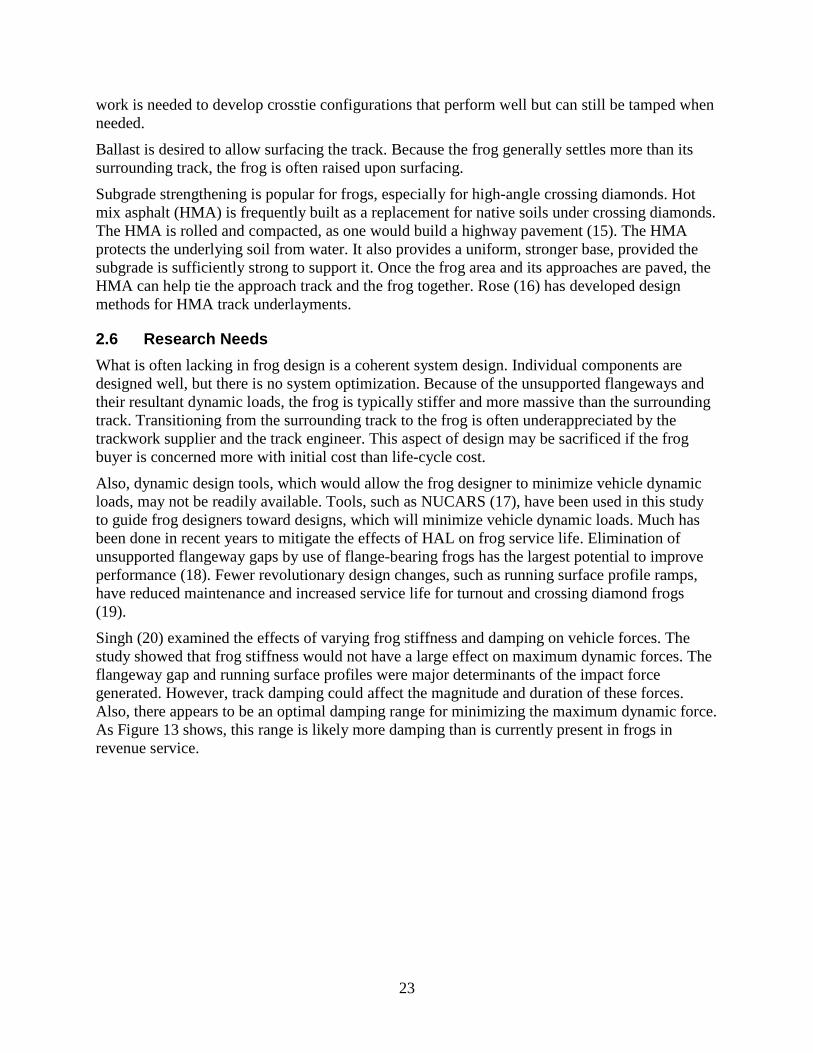
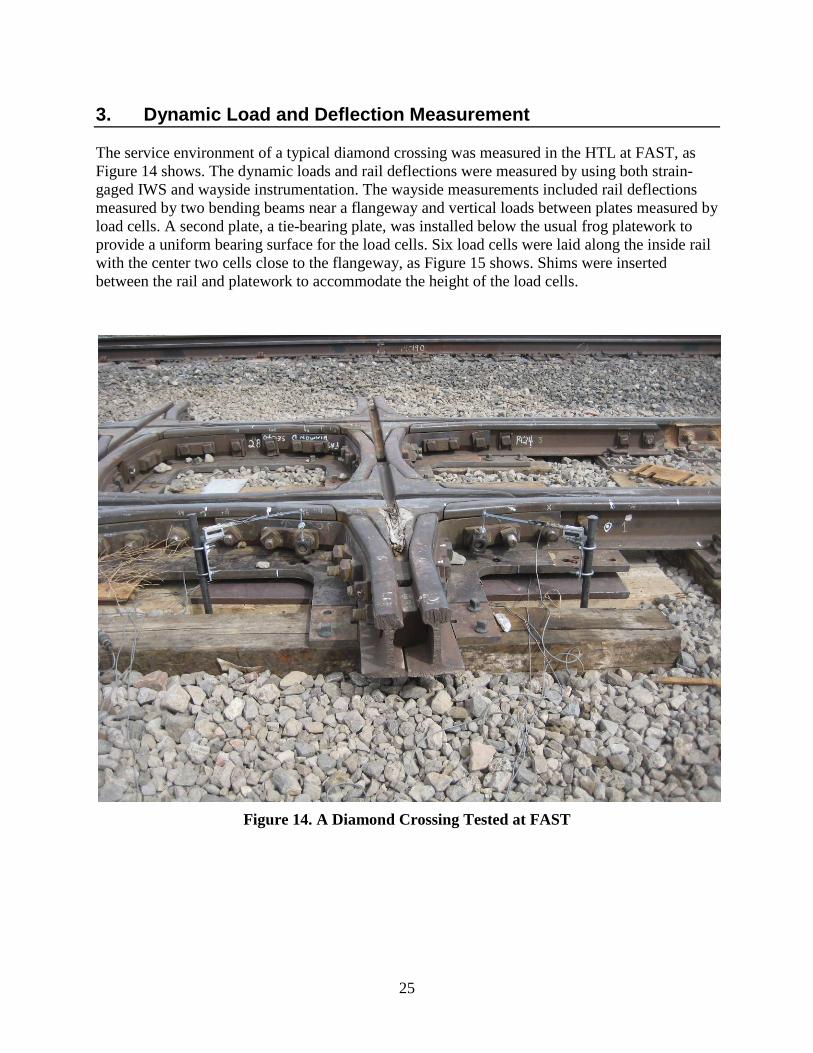
The service environment of a typical diamond crossing was measured in the HTL at FAST, as Figure 14 shows. The dynamic loads and rail deflections were measured by using both strain-gaged IWS and wayside instrumentation. The wayside measurements included rail deflections measured by two bending beams near a flangeway and vertical loads between plates measured by load cells. A second plate, a tie-bearing plate, was installed below the usual frog platework to provide a uniform bearing surface for the load cells. Six load cells were laid along the inside rail with the center two cells close to the flangeway, as Figure 15 shows. Shims were inserted between the rail and platework to accommodate the height of the load cells.
Figure 14. A Diamond Crossing Tested at FAST
26
Figure 15. Load Cell Instrumentation on Diamond Crossing
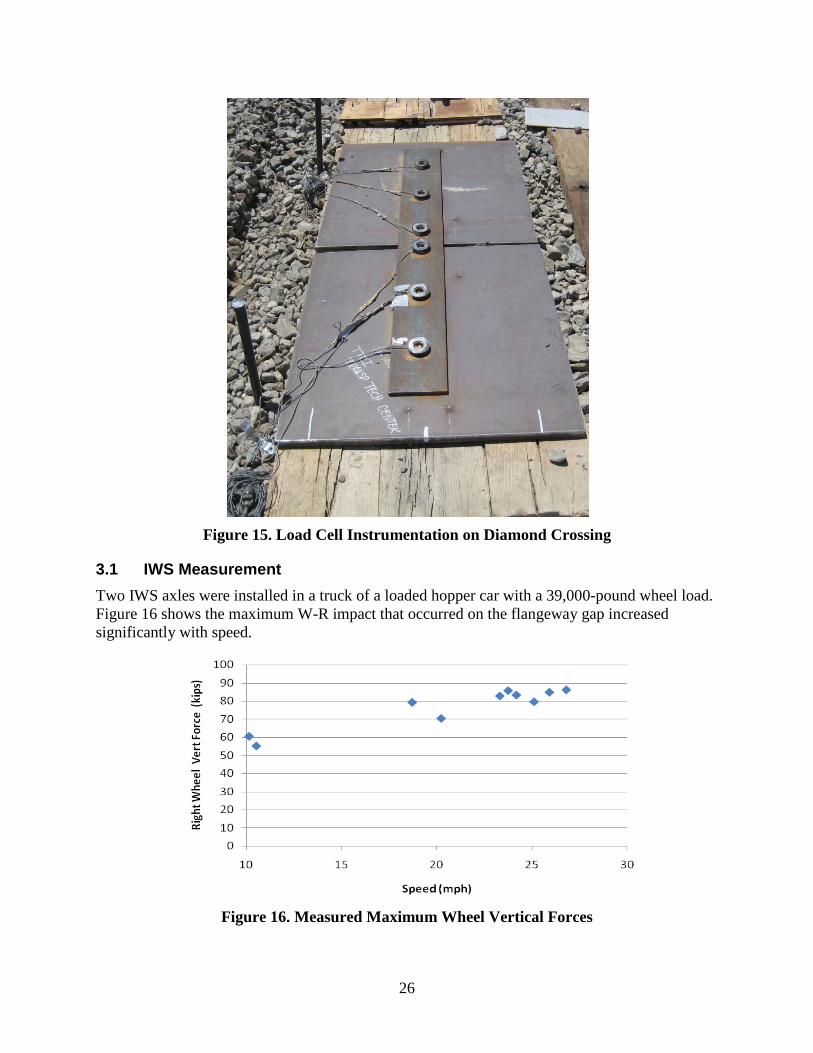
3.1 IWS Measurement Two IWS axles were installed in a truck of a loaded hopper car with a 39,000-pound wheel load. Figure 16 shows the maximum W-R impact that occurred on the flangeway gap increased significantly with speed.
Figure 16. Measured Maximum Wheel Vertical Forces

27
3.2 Wayside Measurement The W-R impact energy on the rail was transferred and dissipated through the crossing frog structures and substructures. Figure 17 shows the sixth load cell force (20 in away from the flangeway) between two rail plates was almost constant for speeds up to 25 mph, but at 25 mph the first load cell (20 in away from the flangeway) decreased, and the second load cell (11 in away from the flangeway) increased. The dynamic changes at 25 mph could be caused by:
• Carbody dynamic movements such as rolling and bouncing,
• Rail plate movement because load cells were installed only under the inside rail
• Uneven load bearing The other load cell forces were less than 8,000 lb, indicating there were voids under them. The load cell force should be equal to or less than the applied wheel load under even contact conditions between the rail plate and load cell. However, there could be some hot spots among the load cells if they contact the platework unevenly. A load cell on a hot spot, such as the sixth load cell, could have borne more than one wheel load when it was in the center of the two axles, and other nearby load cells and shims were barely touched. NUCARS modeling using the hot spot assumptions (discussed in the following section) confirmed the load cell test results. The load cell measurement showed that changes are needed on the diamond crossing structure design and installation to avoid hot spots and load variations.
Figure 17. Measured Load Cell Forces

28
The dynamic rail deflection was measured by a bending beam with low-pass filtering (100 hertz (Hz)). Figure 18 shows the dynamic deflection increased with speed as a result of the impact. The dynamic deflection was greater than the static deflection measured before the dynamic test, indicating track settlements and nonlinear dynamic characteristics of the foundation.
Figure 18. Measured Rail Deflection
29
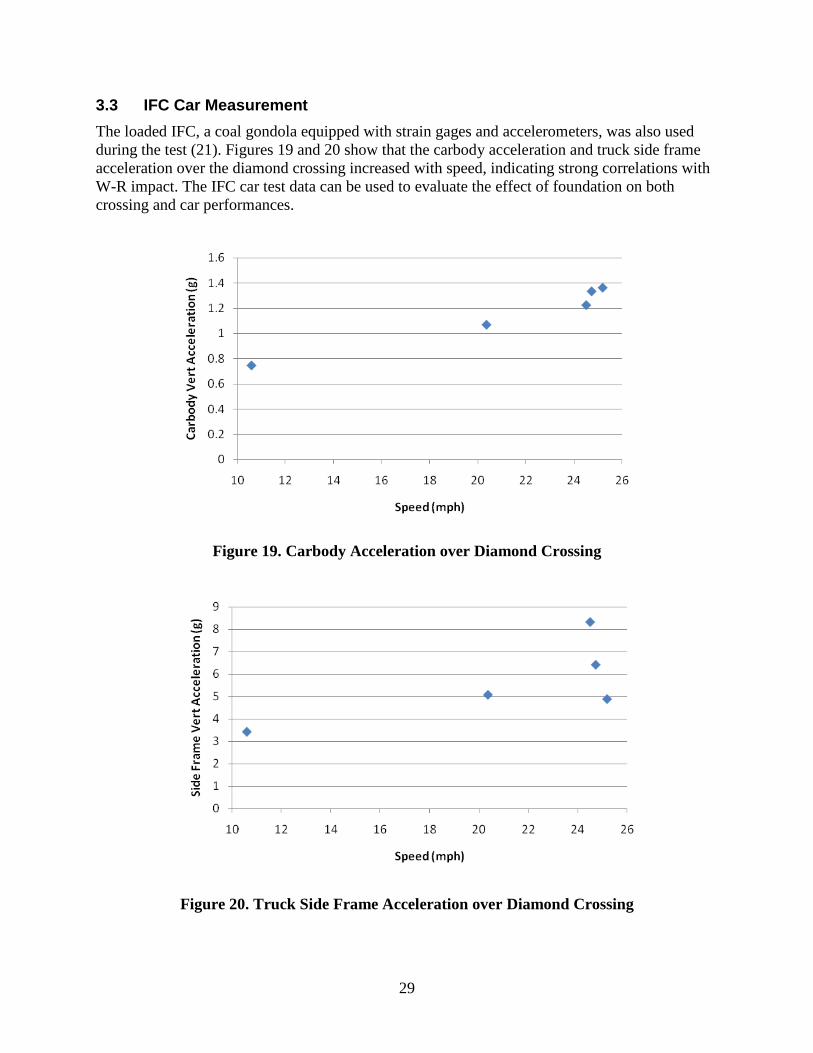
3.3 IFC Car Measurement The loaded IFC, a coal gondola equipped with strain gages and accelerometers, was also used during the test (21). Figures 19 and 20 show that the carbody acceleration and truck side frame acceleration over the diamond crossing increased with speed, indicating strong correlations with W-R impact. The IFC car test data can be used to evaluate the effect of foundation on both crossing and car performances.
Figure 19. Carbody Acceleration over Diamond Crossing
Figure 20. Truck Side Frame Acceleration over Diamond Crossing

30
4. Modeling and Validation
A freight car model and a one-layer flexible track model were built by using NUCARS multibody dynamics simulation program. The freight car model represents a loaded hopper car equipped with a typical three-piece truck with a 39,000-pound wheel load. The one-layer track model included two 115-feet-long flexible rails, with 68 lateral and vertical bending modes. The rail was connected to the ground with 69 parallel connections with 20-inch spacings, and each connection used nonlinear stiffness and damping parameters in the vertical and lateral directions. The model was first checked by comparing the predicted rail deflection to the measured deflection under the loaded car, as Figure 21 shows.
Figure 21. Predicted and Measured Static Rail Deflection under Loaded Car The model connection stiffness between rail and ground was determined by matching the predicted rail deflection with the measured one. The model was further checked by comparing the predicted dynamic load and deflection to the test results. Figure 22 shows that the predicted wheel dynamic vertical forces are consistent with test results.
Figure 22. Predicted and Measured Wheel Vertical Dynamic Load

31
Figure 23 shows the predicted vertical load between rail and platework using the hot spots assumptions as discussed above. The load cell could bear more than one wheel load force with void support nearby, which is consistent with test results. Unlike the test results, the predicted first and second load cell changed little at 25 mph. The reason could be that the track perturbation and track modulus variation along the rails were not included in the model. Figure 24 shows the trend of the predicted rail deflection is generally consistent with test results.
Figure 23. Predicted Load Cell Forces
Figure 24. Comparison of Predicted and Measured Rail Deflection

32
5. Parametric Study
The effects of diamond crossing foundation stiffness and damping, rail surface perturbation, and track differential settlement on W-R impact were investigated through a NUCARS parametric study.
5.1 Effect of Foundation Stiffness and Damping The wheel and rail dynamic interaction on a diamond crossing involves high-frequency impact on the flangeway and ensuing low-frequency wheel bounce. Figure 25 shows that higher foundation stiffness decreases the high-frequency impact on the flangeway, but increases the low frequency wheel bouncing. The damage caused by these high- and low-frequency forces on track components and cars needs to be further investigated to ensure the optimal performance for both tracks and cars.
Figure 25. Effect of Foundation Stiffness (connection damping between rail and ground 30 lb/in/s, 40 mph)
Figure 26 shows that an optimal 300 lb/in/s foundation damping could decrease the high-frequency impact by 7 percent compared with the case with 30 lb/in/s damping. However, the impact at middle and low frequency (lower than 256 Hz) increases with damping. The damping effect, similar to the stiffness effect, also depends on the frequency range.
33
Figure 26. Effect of Foundation Damping (connection stiffness between rail and ground K = 50 kip/in, 40 mph)
Figure 27 and 28 show the parametric study results with crossing foundation stiffness and damping variations at 40 mph (40 mph for all simulation cases below). The maximum impact force ratio was the quotient of the impact force divided by static wheel load. Figure 28 shows the results of filtered maximum force (low-pass frequency 256 Hz) divided by static wheel load. Parametric study results showed optimal stiffness and damping depends on the frequency domain where impact was evaluated. The optimal stiffness (600 kip/in) and damping (100 lb/in/s) could decrease the current maximum high-frequency force (above 256 Hz) by approximately 32 percent; however, the optimal stiffness (300 kip/in) and damping (100 lb/in/s) for middle-frequency range (lower than 256 Hz) could only decrease the current maximum force by approximately 15 percent. Both cases indicate increasing the current stiffness from 50 to 300 kip/in could decrease the impacts in both high- and middle-frequency domains. The current foundation stiffness (30–50 kip/in) was estimated on the basis of the track modulus measurements on ballast track with wood ties.
Foundation Damping (lb/in/sec)

34
Figure 27. Effect of Foundation Stiffness and Damping (high frequency)
Figure 28. Effect of Foundation Stiffness and Damping (middle frequency)
The high-frequency impact, occurring on the flangeway gap, mainly causes rail deformation, metal flow near the flangeway gap, and track components damage. The effect of middle-frequency impact on track and car performance needs to be further investigated.
35
5.2 Effect of Rail Surface Perturbation The initial rail surface perturbation on the diamond crossing was caused by the flangeway gap, which was normally 1.75 in wide when it was newly installed, as Figure 29 shows. However, the rail surface near the flangeway gap area dipped with traffic as a result of wear, deformation, and metal flow under repeated wheel impacts, as Figure 30 shows.
Figure 29. Slightly Worn Crossing
Figure 30. Heavily Worn Crossing
36
The W-R impact and rail surface change involves a series of interactive processes: the impact causes the rail surface loss, and the surface loss generates bigger impact. The whole process ends with the renewal of the crossing as a result of wear or fatigue damage.
Figure 31 shows how the rail surface dipped deeper near the flangeway edge and became wider as traffic increased. An asymmetric running surface, as shown in Figures 30 and 31, is representative of high-angle frogs in which the corner common to both routes deforms more than the other corners.
Figure 31. Slightly and Heavily Worn Diamond Crossing Surface Elevation
Figure 32 shows the crossing surface geometry used in NUCARS, which was generated on the basis of a 36-inch-diameter wheel and measured diamond crossing flangeway gap shapes.
Figure 32. New and Worn Diamond Crossing Surface Geometry

37
Figures 33–36 show that the impact on the worn diamond crossing increases significantly with the crossing surface loss caused by wear, deformation, and metal flow. Comparing maximum impact force ratios for the same foundation stiffness and damping in Figures 33 and 35 or Figures 34 and 36, shows that the worn diamond crossing cases generate higher dynamic forces. Table 2 shows one example of case comparison. IWS test results in Figure 37 show the impact on the heavily worn crossing corner were higher than that on the slightly worn corner even at relatively low speeds (10–25mph), which partially validate the modeling results at low speeds.
Figure 33. High-Frequency Impact on Slightly Worn Diamond Crossing
Figure 34. Middle-Range Frequency Impact on Slightly Worn Diamond Crossing
38
Figure 35. High-Frequency Impact on Heavily Worn Diamond Crossing
Figure 36. Middle-Range Frequency Impact on Heavily Worn Diamond Crossing

39
Table 2. Effect of Crossing Running Surface Wear on Maximum W-R Force Ratios (stiffness 200 kip/in, damping 300 lb/in/s)
Crossing Surface High Frequency Middle Frequency(<256 Hz) Slightly Worn 3.0 2.6 Heavily Worn 4.1 3.5
Figure 37. Measured Wheel Vertical Forces on Slightly and
Heavily Worn Diamond Corner
The NUCARS simulation results show that the optimal stiffness and damping for new diamond crossings are not optimal for the worn diamond crossing; the impact on a worn crossing generally increased with foundation stiffness. To decrease the impact on the worn crossing, the foundation has to be maintained (tamped) at low stiffness; however, this is not feasible for the current ballast foundation in revenue service, because:
• Lower foundation stiffness will result in larger rail deflection, which will cause more rapid rail fatigue and damage to components
• Short tamping cycle increases not only maintenance cost but also risk of track instability(buckling)
The performance of a worn out crossing deteriorated quickly because of surface loss and foundation stiffness increased after it was fully compacted under high impact. This deterioration trend seems to be inevitable for ballast foundations.
40
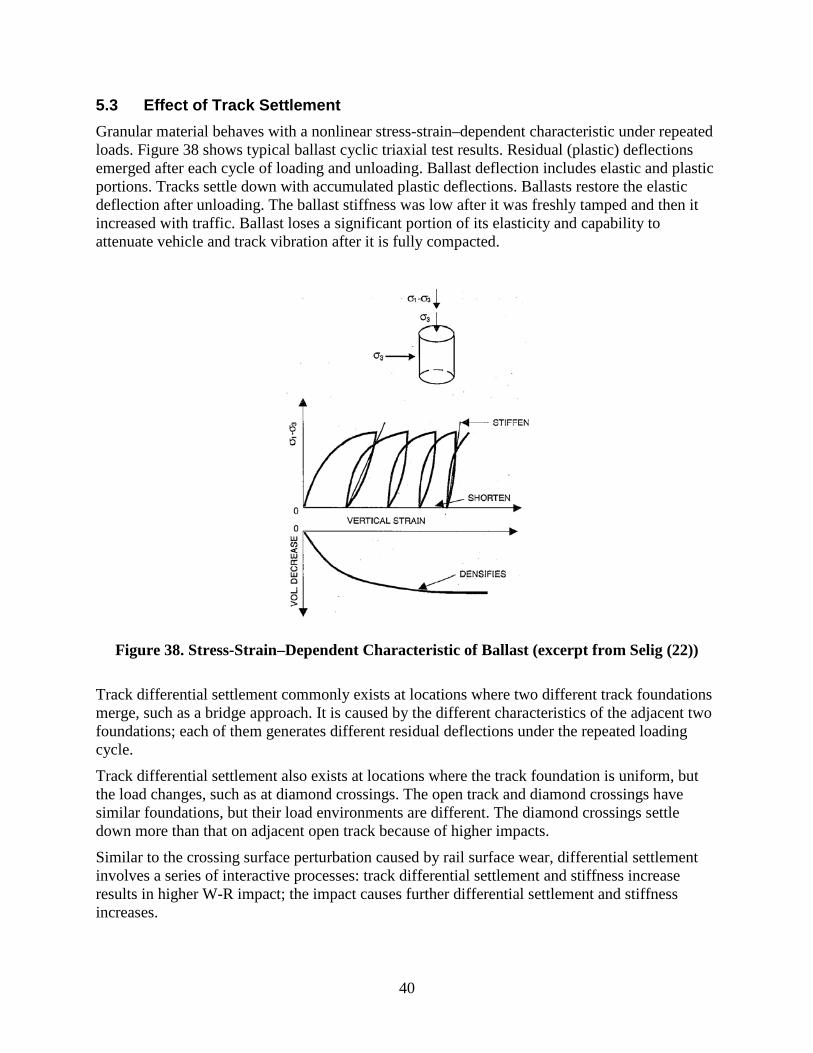
5.3 Effect of Track Settlement Granular material behaves with a nonlinear stress-strain–dependent characteristic under repeated loads. Figure 38 shows typical ballast cyclic triaxial test results. Residual (plastic) deflections emerged after each cycle of loading and unloading. Ballast deflection includes elastic and plastic portions. Tracks settle down with accumulated plastic deflections. Ballasts restore the elastic deflection after unloading. The ballast stiffness was low after it was freshly tamped and then it increased with traffic. Ballast loses a significant portion of its elasticity and capability to attenuate vehicle and track vibration after it is fully compacted.
Figure 38. Stress-Strain–Dependent Characteristic of Ballast (excerpt from Selig (22)) Track differential settlement commonly exists at locations where two different track foundations merge, such as a bridge approach. It is caused by the different characteristics of the adjacent two foundations; each of them generates different residual deflections under the repeated loading cycle.
Track differential settlement also exists at locations where the track foundation is uniform, but the load changes, such as at diamond crossings. The open track and diamond crossings have similar foundations, but their load environments are different. The diamond crossings settle down more than that on adjacent open track because of higher impacts.
Similar to the crossing surface perturbation caused by rail surface wear, differential settlement involves a series of interactive processes: track differential settlement and stiffness increase results in higher W-R impact; the impact causes further differential settlement and stiffness increases.
41
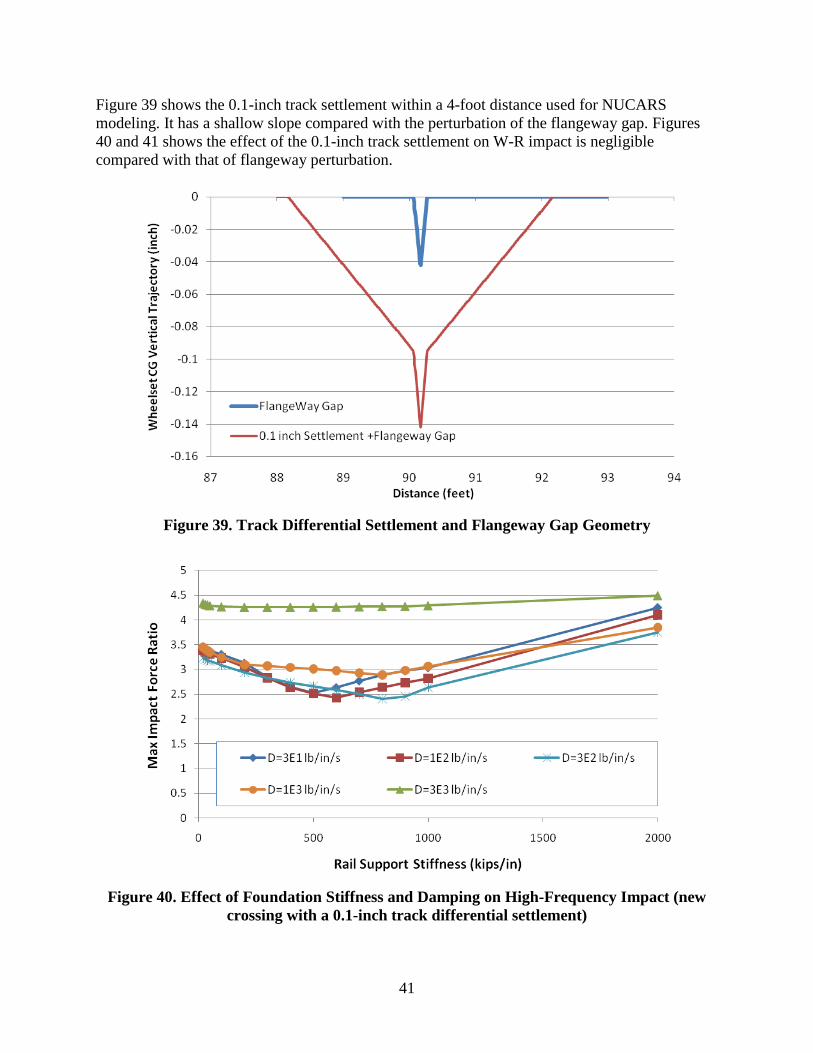
Figure 39 shows the 0.1-inch track settlement within a 4-foot distance used for NUCARS modeling. It has a shallow slope compared with the perturbation of the flangeway gap. Figures 40 and 41 shows the effect of the 0.1-inch track settlement on W-R impact is negligible compared with that of flangeway perturbation.
Figure 39. Track Differential Settlement and Flangeway Gap Geometry
Figure 40. Effect of Foundation Stiffness and Damping on High-Frequency Impact (new
crossing with a 0.1-inch track differential settlement)

42
Figure 41. Effect of Foundation Stiffness and Damping on Middle-Range Frequency
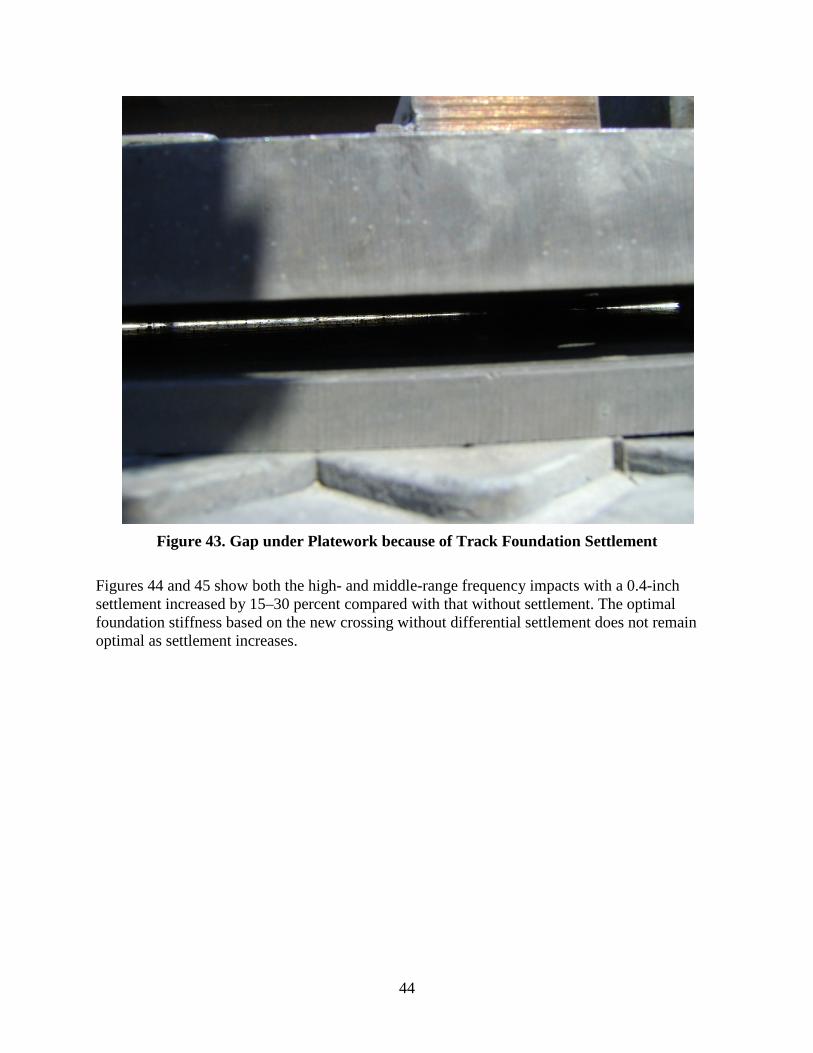
Impact (new crossing with a 0.1-inch track differential settlement) Track settlement in diamond crossings can be severe due to high impacts. More than 0.5 in of track settlement (over 1.23 MGT of traffic at 40 mph) was observed in a scaled rubber panel test at FAST (Figure 42). Figure 43 shows that daylight can be seen under the platework after the foundation settled down.

43
Figure 42. Track Differential Settlement in a Scaled Rubber Panel Tested at FAST
Gap
Gap
44
Figure 43. Gap under Platework because of Track Foundation Settlement
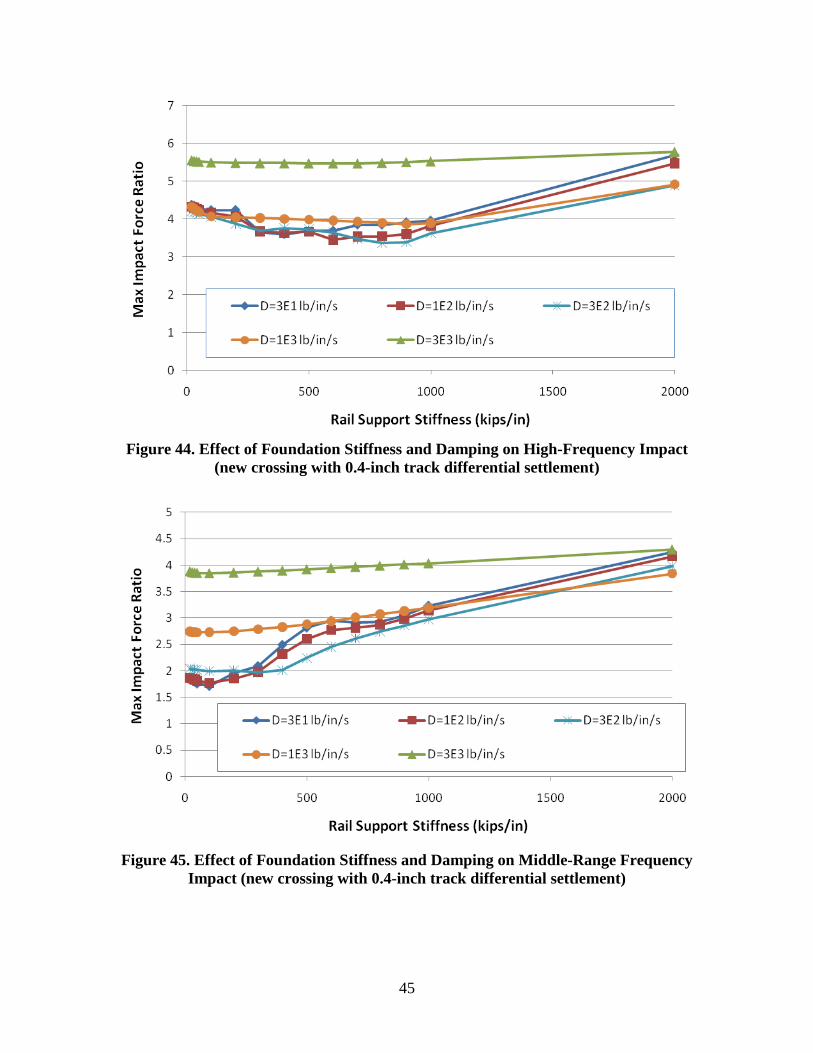
Figures 44 and 45 show both the high- and middle-range frequency impacts with a 0.4-inch settlement increased by 15–30 percent compared with that without settlement. The optimal foundation stiffness based on the new crossing without differential settlement does not remain optimal as settlement increases.
45
Figure 44. Effect of Foundation Stiffness and Damping on High-Frequency Impact
(new crossing with 0.4-inch track differential settlement)
Figure 45. Effect of Foundation Stiffness and Damping on Middle-Range Frequency
Impact (new crossing with 0.4-inch track differential settlement)
46
6. Conclusions
This report reviews the dynamic load environment and failure modes of special trackwork frog foundations. The literature survey showed that rail surface loss and track differential settlement were the top crossing failure modes; rail surface perturbation, track differential settlement, and foundation stiffness and damping have the most significant effects on W-R impact for heavy haul axle load operation among all other factors.
TTCI conducted diamond crossing service load environment measurements at the FAST HTL by using wayside instrumentation, IFC, and load measuring IWS. Test results were used to benchmark the vehicle and track model. The field measurements confirmed previous work to describe the dynamic load environment of frogs in HAL service and added some additional findings:
• Maximum dynamic wheel loads of 60,000–100,000 lb were measured at 10–25 mph, respectively. The static wheel load of this wheelset was 39,000 lb.
• Wayside measurement showed that uneven contact between diamond crossing components resulted in hot spots and load variations, which could cause components damage and foundation degradation.
A parametric simulation study conducted with NUCARS showed the following:
• A local optimum damping value produces a minimum dynamic W-R force for each track stiffness. The optimum combination changes with each stiffness or damping value. The optimum is also dependent on the load duration of interest, which means the same track properties will not minimize flangeway impacts and rebound dynamic loads (i.e., the commonly called P1 and P2 forces) simultaneously.
• For new crossings without any track differential settlement, optimal foundation stiffness and damping could lower the current W-R impact by 30 percent.
• For worn crossings, W-R impact increases significantly with foundation stiffness and damping.
• W-R impact increases with track differential settlement, especially at the frog flangeway gaps.
Although track degradation and stiffness variations are inevitable for the current crossing designs, the modeling results suggest that the crossing performance and service life could be improved by using the following guidelines for design and maintenance:
• Build the foundation with optimal stiffness and damping when a crossing is installed.
• Adjust the foundation stiffness and damping during its service life based on the crossing conditions, which can best be done on current designs by renewing the ballast layer and surfacing the track.
• Minimize crossing foundation differential settlement; mitigate the effects of differential settlement with track surface ramps that lengthen the distance over which the elevation change occurs.

47
• Design durable crossing structures including components, assembly, and fixation systems, which are capable of absorbing the high frequency impact energy from the beginning of the energy transfer routine.
These guidelines can be used to decrease W-R impact and slow down the rail surface loss and track foundation degradation. Further tests and simulations are recommended in the phase II study to validate these guidelines and develop a prototype design. The following tasks are planned for the next phase of work:
• Evaluate foundation materials, including artificial subgrades, which will minimize differential settlement.
• Investigate the elimination of ballast from the frog foundation. Ballast is largely responsible for the changes in stiffness, damping and differential settlement seen in current frog designs.
• Develop frog designs that are optimized to minimize dynamic loading.

48
7. References
1. LoPresti, J., and Otter, D. (1994 Oct.). “Impact Forces Measured over a 62-Degree Crossing,” Technology Digest TD-94-018, Association of American Railroads, Washington, DC.
2. Shu, X., and Davis, D. (2010 May). “Mainline Switch Design,” Technology Digest TD-10-013, Association of American Railroads, Transportation Technology Center, Inc., Pueblo, CO.
3. Koch, K. (2007 June). “Measurement of Wheel Load and Axle Strain Environment, 286,000-pound Gross Rail Load, Coal Train Service,” Research Report R-983, Assocation of American Railroads, Transportation Technology Center, Inc., Pueblo, CO.
4. Tournay, H. and Stahura, T. (2010 March). “Detector Technology Implementation & Advanced Technology Safety Initiative,” Presentation to 15th Annual AAR Research Review, Transportation Technology Center, Inc., Pueblo, CO.
5. Sasaoka, C. and Davis, D. (2006 Feb.). “Diamond Crossing Foundation Design,” Technology Digest TD-06-004, Association of American Railroads, Transportation Technology Center, Inc., Pueblo, CO.
6. Plotkin, D. and Davis, D. (2008 Feb.). “Bridge Approaches and Track Stiffness.” (U.S. Department of Transportation Report No. DOT/FRA/ORD-08-01). Washington, DC: Office of Railroad Policy and Development, Federal Railroad Administration.
7. Lundquist, A. and Dahlberg, T. (2005 June). “Load Impact on Railway Track due to Unsupported Sleepers,” Journal of Rail and Rapid Transit, Vol 219 No F2.
8. Akhtar, M., Otter, D., and Doe, B. (2006 July). “Stress-State Reduction in Concrete Bridges Using Under Tie Rubber Pads and Wood Ties,” Technology Digest TD-06-016, Association of American Railroads, Transportation Technology Center, Inc., Pueblo, CO.
9. Li, D. et al. (2007 Dec.). “Dynamic Load and Track Response: Bridge Approach Test at the Western Mega Site,” Technology Digest TD-07-042, Association of American Railroads, Transportation Technology Center, Inc., Pueblo, CO.
10. Mc Williams, R. and Davis, D. (1998 Aug.). “Effects of Heavy-Haul Traffic on Turnout Components in Revenue Service,” Technology Digest TD-98-019, Association of American Railroads, Transportation Technology Center, Inc., Pueblo, CO.
11. Otter, D. (1994 Jan.). “Life of Rail-Bound Manganese Frogs in Revenue Heavy Haul Service,” Technology Digest TD-94-001, Association of American Railroads, Washington, DC.
12. Davis, D. et al. (2004 Nov.). “Field Implementation of Flange Bearing in Crossing Diamonds,” Technology Digest TD-04-019, Association of American Railroads, Transportation Technology Center, Inc., Pueblo, CO.
13. Davis, D., Shu, X., and O’Connor, T. (2008 Oct.). “Evaluation of Flange Bearing Frogs for Turnouts,” Technology Digest TD-08-044, Association of American Railroads, Transportation Technology Center, Inc., Pueblo, CO.

49
14. Martland, C., Smith, E., and Davis, D. (1996 May). “An Updated Assessment of the Economics of Advanced Turnouts,” Technology Digest TD-96-011, Association of American Railroads, Washington, DC.
15. Asphalt Institute. (1998). “HMA Trackbeds – Hot Mix Asphalt for Quality Railroad and Transit Trackbeds,” Information Series IS-137, Asphalt Institute.
16. Rose, J.G., Li, D., and Walker, L.A. (2002 Sept.). “Tests and Evaluations of In-Service Asphalt Trackbeds,” Paper presented at the American Railway Engineering and Maintenance-of Way Association Annual Conference, Washington, DC.
17. Handal, S. (1992 March). “Partial Validation of a Generalized Turnout Model Based on NUCARS,” Research Report R-797, Association of American Railroads, Washington, DC.
18. Davis, D. et al. (1997 Sept.). “Load and Ride Quality Assessment of Crossing Diamonds,” Technology Digest TD-97-036, Association of American Railroads, Washington, DC.
19. Sasaoka, C., Davis, D., and Guillen, D. (2003 Dec.). “Service Evaluation of Improved Running Surface Profile Frogs,” Research Summary, RS-03-004, Association of American Railroads, Transportation Technology Center, Inc., Pueblo, CO.
20. Singh, S. and Davis, D. (1998 July). “Reducing Impact Forces on High Angle Crossing Diamonds,” Technology Digest TD-98-021, Association of American Railroads, Washington, DC.
21. Meddah, A.; Li. D., and Roybal, S. (2010 March). “Track Inspection Using an Instrumented Freight Car in Revenue Service,” Technology Digest TD-10-005, Association of American Railroads, Transportation Technology Center, Inc., Pueblo, CO.
22. Selig, E.T. and Waters, J.M. (1994). “Track Geotechnology and Substructure Management,” published by Thomas Telford Services Ltd. London, UK.
50
Abbreviations and Acronyms
AAR Association of American Railroads
AMS austenitic manganese steel
FAST Facility for Accelerated Service Testing
FRA Federal Railroad Administration
HAL heavy axle load
HMA hot mix asphalt
HTL High Tonnage Loop
IFC instrumented freight car
IWS instrumented wheelsets
MGT million gross tons
RMB rail bound manganese
TTCI Transportation Technology Center, Inc.
W-R wheel-rail