U.S. Department of Energy Properties of LNG Don Juckett US Department of Energy February 12, 2002...
43
U.S. Department of Energy Properties of LNG Don Juckett US Department of Energy February 12, 2002 LNG Workshop Solomons, MD
-
Upload
dwayne-turner -
Category
Documents
-
view
224 -
download
2
Transcript of U.S. Department of Energy Properties of LNG Don Juckett US Department of Energy February 12, 2002...
U.S. Department of Energy
Properties of LNGDon Juckett
US Department of EnergyFebruary 12, 2002
LNG WorkshopSolomons, MD

U.S. Department of Energy
Background – LNG in the US
• US Natural Gas imports and Exports• Projections of Market Growth• LNG’s Role in the US Market
• Focus on LNG marine transport issues• FERC, DOE - Security and Operations, DOC –
NOAA, USCG

U.S. Department of Energy
Imports Will be an Important Source of Supplies to Satisfy Growing Demand
0
5
10
15
20
25
30
35
40
1995 1996 1997 1998 1999 2000 2001 2002 2003 2004 2005 2006 2007 2008 2009 2010
Total Domestic Production
Consumption in Excess of Prduction
Consumption
History Projection

U.S. Department of Energy
Gas Imports From Canada and LNG Imports Are Projected to Grow As Sources of Supply
-1
0
1
2
3
4
5
1995 1996 1997 1998 1999 2000 2001 2002 2003 2004 2005 2006 2007 2008 2009 2010
Vo
lum
e (
Tri
llio
n C
ub
ic F
ee
t)
ProjectionHistory
Canada
Mexico
Liquified Natural Gas

U.S. Department of Energy
U.S. LNG Import Facilities
Everett LNG Import Facility - Massachusetts (Expansion underway)
Cove Point LNG Facility - Maryland(Import capability currently being re-commissioned)
Elba Island LNG Import Facility - Georgia(Currently being re-started)
Lake Charles LNG Import Facility - Louisiana(Expansion underway)

U.S. Department of Energy
U.S. LNG Import Facilities
Possible Capacity Expansion
Location Status
Sendout (MMcf/Day)
Storage (Bcf)
Everett, MA Active 450100 by truck
3.5 165 MMcf/d– sendout
Lake Charles, LA Active 700 6.3 300 MMcf/d– sendout
Elba Island, GA Restarting operations
440 4.1 360 MMcf/d– sendout
Cove Point, MD • Active for Storage• Planned opening for imports 2002
1,000 (nameplate)1
5.0 2.8 Bcf – storage
Note: Except where noted, sendout capacity is LNG vaporization which is then shipped via pipeline
1 This is Cove Point’s nameplate capacity. Capacity for reopening has not yet been determined.
Current Capacity
U.S. Department of Energy
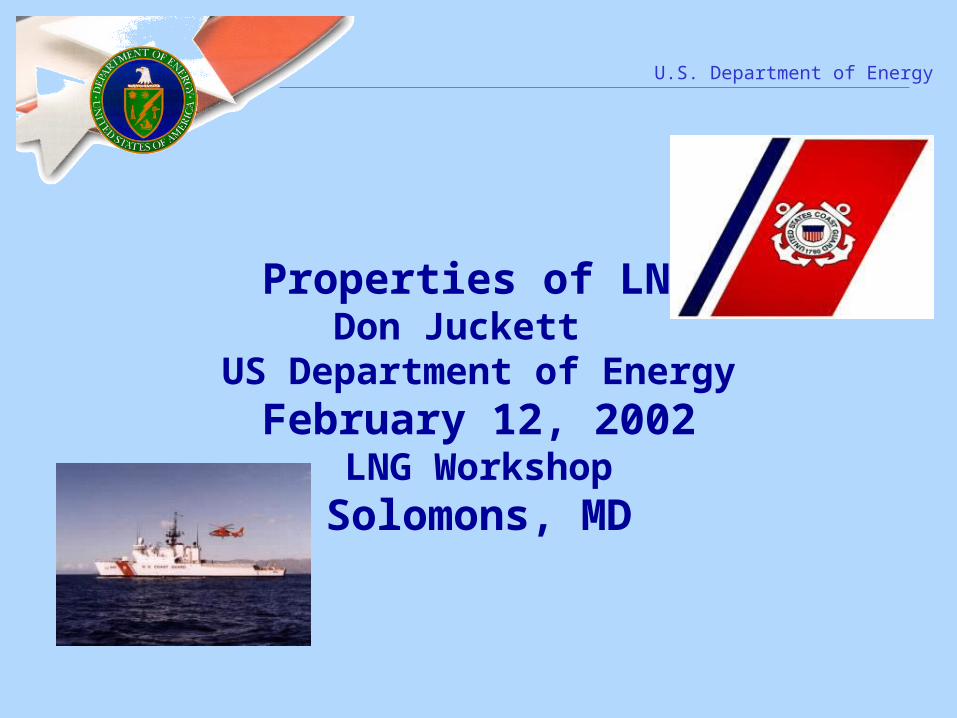
LNG Imports Projections by Receiving Facility
0
50
100
150
200
250
300
1995 1996 1997 1998 1999 2000 2001 2002 2003 2004 2005 2006 2007 2008 2009 2010
Vo
lum
e (
Bill
ion
Cu
bic
Fe
et)
Cove Point, MD Everett, MA Lake Charles, LA Elba Island, GA
ProjectionHistory
Cove Point
Lake Charles
Elba Island
Everett
U.S. Department of Energy
LNG Imports are a Key Element of U.S. Supplies
• LNG Imports have grown by more than 2 and one-half times between 1998 and 2000, from 85 Bcf to 224 Bcf
• LNG imports are expected to grow from 1.3 percent of U.S. consumption to more than 3 percent by 2008
• LNG imports can be quite significant on a regional basis
• New greenfield projects often meet local resistance

U.S. Department of Energy
Japan
Trinidad and Tobago
Qatar
12
20
51163
61
55
42
3368
Natural Gas Imports & Exports, 1999 (BCF)
Australia
Algeria
LNG
LNG
64Malaysia
76
3
United ArabEmirates
3

U.S. Department of Energy
Japan
Trinidad and Tobago
6
46
99223105
12
75
3544
Natural Gas Imports & Exports, 2000AustraliaAlgeria
LNG
LNG
66
44
United Arab Emirates
3
10
Oman
NigeriaIndonesia
133
Qatar

U.S. Department of Energy
LNG and Natural Gas
• Physical properties and behavior
• Myth and Legend
• Knowledge and Common Sense
• Hazards -

U.S. Department of Energy
LNG Properties
• Liquefied Natural gas is a Cryogenic Liquid– LNG Density - 26.5 LB./Cu. Ft.
• Lighter than water (65 LB/Cu. Ft.)
– LNG Boiling point - (-259o F)• Liquid Nitrogen - (-320o F)• Liquid Oxygen - (-297o F)
U.S. Department of Energy
Natural Gas Properties
• Natural gas is lighter than air– Natural Gas Density - 0.47
• (Air - 1.0)
• Natural gas rises under normal atmospheric conditions

U.S. Department of Energy
Myth and Legend
• “Catastrophic release of LNG creates a BLEVE -- boiling liquid expanding vapor explosion”
NOT TRUENOT TRUE
– In laboratory and open ocean combustion tests, there have been no documented cases of LNG BLEVEs
U.S. Department of Energy
Myth and Legend• “An LNG Tanker is a floating Bomb”
NOT TRUE
• Liquefied Natural Gas tankers have been run aground, experienced loss of containment, suffered weather damage, been subjected to low temperature embrittlement from cargo spillage, suffered engine room fires, and been involved in serious collisions with other vessels - NO CARGO NO CARGO EXPLOSIONS REPORTEDEXPLOSIONS REPORTED

U.S. Department of Energy
El Paso Paul Kayser – In Dry Dock after grounding in Straits of Gibraltar
64,750 dwt, 125,000 m3 of gas
Photo- Courtesy of BP

U.S. Department of Energy
Common Sense and Knowledge
• Natural gas needs to be in vapor form and mixed with air to burn
• Natural gas is combustible in the range of 5% to 15% volume concentrations in air
• Combustible mixtures in confined space will burn explosively
– LNG does not explode or burnLNG does not explode or burn

U.S. Department of Energy
Common Sense and Knowledge• LNG is a cryogenic liquid – physical
contact or spillage constitute a personnel and equipment hazard
• LNG Natural Gas
• Natural Gas presents an asphyxiation hazard

U.S. Department of Energy
LNG Tanker Underway
Photo Courtesy of BP

U.S. Department of Energy
What happens with a spill on water?
• LNG pool vaporizes rapidly (faster than an equal sized pool on land)
• LNG spill on or within hull can cause brittle fracture (carbon & low alloy steel)
• LNG can undergo “rapid phase transition”, a physical vapor explosion (not combustion)
• LNG pool formation accompanied by ignition• Natural gas cloud formation with subsequent burn
back

U.S. Department of Energy
Assessing The Hazard30 Years of LNG Experience
• LNG history in the US dates back to 1940’s• LNG tanker trade initiated with exports in 1969 • Eight marine incidents have resulted in spillage of
LNG - some hull damage due to cold fracture and no cargo fires
• Seven incidents not involving spillage - two from grounding - no significant cargo loss
• LNG carriers are inherently much more robust than typical crude, fuel, and chemical tankers
U.S. Department of Energy
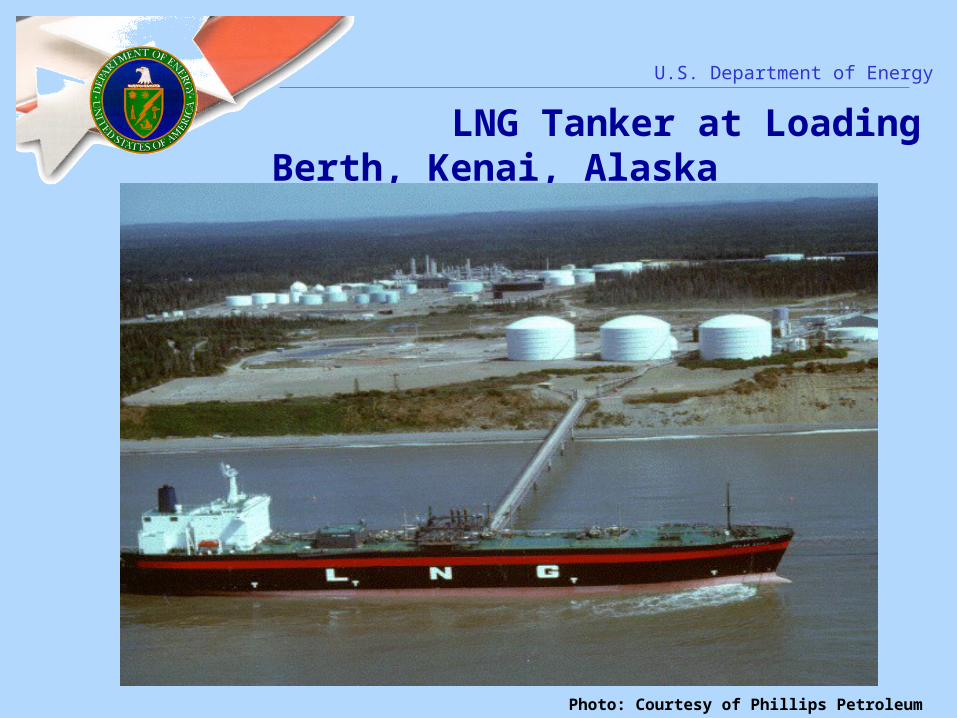
LNG Tanker at Loading Berth, Kenai, Alaska
Photo: Courtesy of Phillips Petroleum

U.S. Department of Energy
Cross Section of LNG Tanker

U.S. Department of Energy
Cutaway Model of LNG Tanker

U.S. Department of Energy
Assessing The Hazard• LNG vaporizes and causes condensation of
atmospheric moisture – visible cloud• As LNG vapor cloud warms it lifts• Water is a superior heat source compared to
soil/solids• Spills on water tend to vaporize rapidly creating a
potentially combustible plume that migrates until a) the LNG source is exhausted, and b)dilution by air reduces the concentration below the lower flammability limit (LFL)

U.S. Department of Energy
Assessing The Hazard• An ignition source close to the origin of the spill is
likely to cause ignition and result in rapid burn off of natural gas vapors
• Absence of an ignition source would result in a plume that could migrate downwind for a considerable distance.
• A remote (downwind) ignition of a plume in the flammable portion of the vapor cloud would result in relatively slow (subsonic) burn back to the spill pool

U.S. Department of Energy
Assessing The Hazard
• The opinion of experts indicate that a catastrophic failure caused by collision or terrorist act would result in numerous ignition sources close to the vessel and ignition and burn down would occur

U.S. Department of Energy
Jettisoning Test – Trial to test Equipment
Photo: Courtesy of BP

U.S. Department of Energy
What Has Changed Since Sept. 11, 2001?
• Everyone is looking at their environment differently
• Potential threat to infrastructure has increased - Responsible parties are reacting
• Assumptions about what constitutes threats are being reassessed
U.S. Department of Energy
Assessing the risk
• Models
• Analogs
• Other related hydrocarbons/chemicals

U.S. Department of Energy
Assessing the risk
• Following suspension of LNG tanker dockings at the Distrigas (Tractebel) facility in Boston Harbor DOE, working with FERC, DOT (OPS), local and state public safety officials, commissioned a series of model runs intended to mimic a serious and catastrophic breaching of a single tank of an LNG carrier.

U.S. Department of Energy
Assessing the riskModeling Catastrophic Failure
• One meter (3.3ft.) and five meter (16.4 ft.) hole in one tank of tanker
• Rapid (but not instantaneous) loss of cargo onto water
• Variable atmospheric conditions
• Dispersion, Fire Radiation and Burn Times

U.S. Department of Energy
Dispersion Model ResultsQUEST Consultants
Release From Tanker
Hole Size Atmospheric
Conditions Pasquill-Gifford* Atmospheric stability
Liquid Impoundment
Distance to Lower Flammability Limit (LFL)
5 meters 1.5m/s F No 2.5 miles
5 meters 5 m/s D No 0.6 miles
1 meter 1.5m/s F No 2.3 miles
1 meter 5 m/s D No 0.5 miles
* Stability D is characterized by fully overcast or partial cloud cover during both daytime and nighttime. The atmospheric turbulence is not as great during D conditions as during A conditions; thus, the gas will not mix as quickly with the surrounding atmosphere. Stability F corresponds to the most “stable” atmospheric conditions. Stability F generally occurs during the early morning hours before sunrise (thus, no solar radiation) and under low winds. The combination of low winds and lack of solar heating allows for an atmosphere which appears calm or still and thus restricts the ability to actively mix with the released gas.]

U.S. Department of Energy
Pool Fire ResultsQUEST Consultants
Release from 25000m3 Tank
Hole Size Atmospheric
Conditions
Liquid Impoundment
Distance
_____________
7000 Btu/hr-ft3
To
_____________
4000 Btu/hr-ft3
RFL (ft) *
_____________
1500 Btu/hr-ft3
5 meter 9m/s No 1020 1260 1770
1 meter 9m/s No 835 1020 1420
* Radiant Flux Levels - measured from center of pool

U.S. Department of Energy
Estimated Burn TimesQUEST Consultants
Inventory Spilled Time to Burn OutSpill Description (cubic meters) (minutes)-------------------------- ------------------ -----------------
5 m. hole in ship 25,000. 37.1 m. hole in ship 25,000. 64.

U.S. Department of Energy
Summary of Conclusions from the Lloyd’s Report
Report draws from many sources, historical, experimental, and modeling
• Historically for all types of LNG - no loss of life - land based property damage - environmental damage
• LNG carriers inherent strength has prevented loss of containment
• A missile hit or explosion will provide a large number of ignition sources
• If containment loss should occur under specific conditions
– Holing may not be visible

U.S. Department of Energy
Summary of Conclusions from the Lloyd’s Report
• There is potential for escalating failure due to embrittlement - with subsequent explosion/fire
• Ignition and sustained burn of a vaporized LNG cloud is difficult - multiple ignition sources would probably result in a burn back to the source
• Unconfined LNG vapor cloud detonation has not been demonstrated and unlikely
• External ignition (of vapor cloud) results in slow moving flame
• Rapid Phase Transition will not cause ignition but potentially damaging for ship/equipment

U.S. Department of Energy
Summary of Conclusions from the Lloyd’s Report
In terms of pool spread
• The LFL for methane/air mixtures is ~5% so the LFL boundary is well within the visible cloud
• Modeling of dispersion cloud 3-6 km. Dispersion on that scale unlikely because of local ignition sources
• Exposure at 300 meters (1000ft) from a pool fire would cause pain within 60 seconds
• Warming gas cloud will become lighter than air and rise• No direct environmental damage or clean up from primary
spill• A fire fed by single (25,000 m3) cargo tank vented through
a 1m2 hole would last 1hr - burn diameter 25 meters

U.S. Department of Energy
Summary of Conclusions from the Lloyd’s Report
Specific terrorist scenario assessments included in Lloyd’s report are omitted from this summary because of concern for providing “template” information

U.S. Department of Energy
Security Issues
• Security and threat discussions are not contemplated in this presentation - Rely on US Coast Guard to determine treatment
• US DOE if asked is willing to consider access to security and operations personnel and other resources
• Security staff from DOE are present today

U.S. Department of Energy
Summary
• The US market for natural gas is growing - • Part of that market demand will be met by LNG• The experience of the LNG industry suggests that
hazards are manageable • 30+ years of experience with marine transport of
LNG - no major failures carriers and cargo inherently safer than other hydrocarbon fuels transported by ship
• Post September 11, 2001- new risk not new hazard

U.S. Department of Energy
Summary
• Fundamental properties and behavior of LNG and natural gas remain the same
• Risk scenarios do not produce results outside of those contemplated in previous EIS documentation for siting facilities and transportation of LNG

U.S. Department of Energy
Information Sources
• FERC documents• DOT documents• DOE National Laboratories• US Coast Guard• Energy Information Administration• SIGTTO Society of International Gas Tanker and
Terminal Operators• Various consultant reports• Industry sources• Other literature