
U.S. Department of Education · we focus our work: (1) Help all children reach challenging academic...
229
U.S. Department of Education FY 2000 Annual Plan Volume 1. Objective Performance Plans and Data Quality February 25, 1999
Transcript of U.S. Department of Education · we focus our work: (1) Help all children reach challenging academic...

U.S. Departmentof Education
FY 2000 Annual Plan
Volume 1.Objective PerformancePlans and Data Quality
February 25, 1999

Contents
Preface
Introduction.....................................................................................................................................1
End Outcomes for Goal 1 and Goal 2...........................................................................................8
Goal 1. Help all children reach challenging academic standards, so that they are preparedfor responsible citizenship, further learning, and productive employment............................17Objective 1.1: States develop challenging standards and assessments for all studentsin the core academic subjects. ........................................................................................................19Objective 1.2: Every state has a school-to-work system that increases student achievement,
improves technical skills, and broadens career opportunities for all.........................................25Objective 1.3: Schools are strong, safe, disciplined, and drug-free................................................32Objective 1.4: A talented and dedicated teacher is in every classroom in America.......................39Objective 1.5: Families and communities are fully involved with schools and school
improvement efforts..................................................................................................................49Objective 1.6: Greater public school choice will be available to students and families.................56Objective 1.7: Schools use advanced technology for all students and teachers to improve
education...................................................................................................................................62
Goal 2. Build a solid foundation for learning for all children. ...............................................71Objective 2.1: All children enter school ready to learn.............................................................72Objective 2.2: Every child reads well and independently by the end of the third grade................77Objective 2.3: Every eighth-grader masters challenging mathematics, including the
foundations of algebra and geometry.................................................. ....................................84Objective 2.4: Special populations participate in appropriate services and assessments
consistent with high standards..................................................................................................92
Goal 3. Ensure access to postsecondary education and lifelong learning.............................102Objective 3.1: Secondary school students get the information, skills, and greater support
they need to prepare successfully for postsecondary education.............................................104Objective 3.2: Postsecondary students receive the financial aid and support services
they need to enroll in and complete a high-quality educational program................................110Objective 3.3: Postsecondary student aid delivery and program management is efficient,
financially sound, and customer-responsive...........................................................................117Objective 3.4: All adults can strengthen their skills and improve their earning power over
their lifetime through lifelong learning..................................................................................122
Goal 4. Make ED a high-performance organization by focusing on results, servicequality, and customer service..............................................................................................130
Objective 4.1: Our customers receive fast, seamless service and dissemination of high-qualityinformation and products........................................................................................................132
Objective 4.2: Our partners have the support and flexibility they need without diminishingaccountability for results........................................................................................................138
Objective 4.3: An up-to-date knowledge base is available from education research to supporteducation reform and equity...................................................................................................145
Objective 4.4: Our information technology investments are sound and used to improve

impact and efficiency.............................................................................................................149Objective 4.5: The Department’s employees are highly skilled and high-performing.................157Objective 4.6: Management of our programs and services ensures financial integrity................164Objective 4.7: All levels of the agency are fully performance-driven..........................................169
Use of Tax Expenditures............................................................................................................174
Role of Evaluation in GPRA......................................................................................................178
Quality of Performance Data: How Data will be Verified and Validated.............................184
Appendix A: Coordination with Federal Agencies..................................................................194
Appendix B: Description of Program Evaluations and Other Studies..................................200
Appendix C: Relationship of Program Goals to Strategic Plan Goals and Objectives........218
Appendix D: Funding and Staffing by Objective.....................................................................224

Preface
The American people consistently rank education as a top national priority; they recognizeeducation as being crucial to helping people secure jobs and become responsible, productivecitizens. In recent years, the role of education has expanded beyond providing all children with achallenging academic experience to moving families from welfare to work, teaching children toavoid illegal drugs and alcohol, preparing a skilled workforce for our growing technology sector,and offering safe and supervised before- and after-school enrichment programs for children.
President Clinton’s FY 2000 budget request seeks to strengthen education’s position to deal withthese growing responsibilities. Built on the Department of Education’s (ED) previous success,this budget would allow us to continue to help states and communities move academic standardsfor all students into the classroom; create partnerships between schools, families, businesses, andcommunity organizations; and greatly expand financial support for college students. Initiatives inFY 2000 would help reduce class size in the lower grades to just 18 students per class, recruit andtrain thousands of qualified teachers for the country’s booming student population, and use taxcredits to build modern school buildings. ED’s programs would also help children read well bythe end of the third grade and master challenging mathematics by the eighth grade. The programswould also promote professional development for teachers to use educational technology in theclassroom, assist in providing programs during the out-of-school hours through the 21st CenturyCommunity Learning Centers, and encourage children and families to start planning early forcollege.
To address these issues, the Department of Education has established four main goals by whichwe focus our work:(1) Help all children reach challenging academic standards, so that they are prepared for
responsible citizenship, further learning, and productive employment;(2) build a solid foundation for learning for all children;(3) ensure access to postsecondary education and lifelong learning; and(4) make ED a high-performance organization by focusing on results, service quality, and
customer satisfaction.
This Strategic Plan for FY 2000 reflects these four goals and provides a concrete description ofthe strategies we are employing to achieve them. Complete with past accomplishments andfuture goals, this document is designed to hold us accountable both to the American public and toCongress, and to guide us to continuously improve the effectiveness of our performance.
As the demands upon education grow, the Department of Education is faced with a deeperresponsibility toward the American people to constantly find more effective ways of helpingstates and communities improve their educational systems. This document sets forth our goals ofDepartmental and national improvement in education and our plans for meeting them.
Richard W. RileySecretary of Education
Marshall S. SmithDeputy Secretary of Education (A)

U.S. Department of Education FY 2000 Annual Plan, Volume 1 Page 1
Introduction
The American public consistently rates education among its top national priorities. The publicrightly expects the U.S. Department of Education, in partnership with states, communities,institutions, and other federal agencies, to carry out its responsibilities to effectively andefficiently support educational excellence and equity for all children. This second annual planidentifies the key strategies and performance measures to meet the public’s high expectations andto fulfill its obligation to become a high-performance organization though implementing its“Results Act” Strategic Plan for 1998-2002.
The plan focuses on achieving the Department’s mission: “To ensure equal access to educationand to promote educational excellence throughout the nation.” Our four goals to support thismission are as follows (see Figures 1 and 2):
1. Help all students reach challenging academic standards so that they are prepared forresponsible citizenship, further learning, and productive employment.
2. Build a solid foundation for learning for all children.3. Ensure access to postsecondary education and lifelong learning.4. Make ED a high-performance organization by focusing on results, service quality, and
customer satisfaction.
The Education Department has come a long way toward developing the organizational andmanagement capacity to achieve these goals. Seven years ago, the General Accounting Officeidentified the Department as a troubled organization with serious management weaknesses. Atthat time the Department lacked a Department-wide strategic plan that set out, in one statement,its core policy, program and management priorities. Many programs could not specify theirintended performance goals and hence could not be held accountable for results. Criticalmanagement weaknesses in major systems, especially in major student aid systems, wereprevalent.
The Department has taken significant action to correct these weaknesses, including reformsinitiated in response to the “Results Act.” It is shifting organizational priorities to performanceaccountability, strengthening key management systems, and introducing new staff developmentand mobility initiatives.
These actions are paying off in improved results and performance during the 1990s:
§ Scores for mathematics are up, especially for schools serving low-income students.§ Nearly all states now have reading and math academic standards in place, whereas few
did so prior to Goals 2000 and the 1994 elementary and secondary reauthorization§ A 1998 report by the General Accounting Office praised the Goals 2000 program for its
work in helping states and districts implement standards-based reform.§ Rates of student loan defaults have been halved, to below 10 percent, from rates in excess
of 20 percent a decade ago, saving taxpayers several billion dollars annually.§ New streamlined electronic reporting systems are simplifying student aid applications
and improving the overall financial integrity of the system

U.S. Department of Education FY 2000 Annual Plan, Volume 1 Page 2
§ Major progress realized in Y2K compliance with 13 out of 14 mission critical systemscompliant, validated and implemented and 99 percent of non-mission critical systems,and the last system will be completed well before March 3, 1999.
§ The Department’s 1-800-USA-LEARN information center served its 1-millionthcustomer, and the Department’s WEB site receives 3 million hits a month.
§ The Department received its first department-wide “clean audit” opinion, whichrepresents independent verification of its strengthened financial management systemsand procedures in handling public funds
§ The Department has established a new Performance-based organization to oversee themodernization and management of the $52 billion student aid delivery system.
The Education Department, in partnership with the Congress, has also identified and addressedmajor new national education initiatives that are reflected in new legislation and increasedbudgets. Examples are:
§ The “America Reads Excellence Act,” which is the first time the Department has formallyrecognized reading as a major Departmental program area for support.
§ The “21st Century Schools” program, which supports after-school programs to extendlearning time and provide children with positive environments during those hours of the dayin which youth criminal activity is highest.
§ “GEAR UP” (Gaining Early Awareness and Readiness for Undergraduate Programs) to helpchildren during their critical middle school years make intelligent choices about taking toughcourses and working hard in school.
§ The teacher quality enhancement program, to improve the quality of the teaching force.
The Education Department also realizes that the progress it has achieved in performancerepresents only initial steps toward becoming a performance-driven agency that ranks among thebest in the public and private sectors. Changing agency culture to focus on impact, not number ofgrants, takes time. It requires altering agency incentives and providing employees at all levels ofthe organization with the skills and tools they need to become truly performance driven.
A strengthened FY 2000 annual plan
The Department’s annual plan retains its previous two-part division. Volume I represents theconsolidated agency-wide plan. It consists of the four agency-wide goals just identified and 22objectives. The goals and objectives are summarized in Figure 2. The goals represent keycustomer groups and education processes, starting with support for building the capacity of theelementary and secondary school system, moving to support for the conditions that must beachieved for specific K-12 target populations, and then to postsecondary education access. Tomake the plan work, the fourth goal represents cross-cutting management strategies to supportachieving the three substantive goals. Figure 2 illustrates the relationship among the goals.Volume II of the plan contains the program performance plans to support achieving the fourgoals.

U.S. Department of Education FY 2000 Annual Plan, Volume 1 Page 3
The Education Department FY 2000 plan incorporates a number of significant improvements tosupport performance and results compared with its initial FY 1999 plan:
§ Most annual plan indicators have baseline measures. The FY 2000 annual plan, Volume I(department level) includes 98 indicators, 90% of which have baseline performancemeasures. Many of the baseline measures include multiyear information to provide a basis forjudging both short-term and long-term progress. Although the Results Act is linked with theannual budget process and focused on annual changes, many indicators of educational systemperformance objectives move slowly and are best viewed over the long-term.
§ Most programs (other than ones newly enacted) have baseline performance measuresfor program outcomes. Within the 94 FY 2000 program plans, approximately 85% ofprograms that are not newly authorized present baseline performance measures for programoutcomes. Although all programs are scheduled to have outcome data as required by the FY2000 performance report, the Department is seeking in advance to hold as many programs asis feasible accountable for results.
§ A new section in the annual plan on limitations of the data and strengthened sections ondata verification. These sections will be used to guide improvements in indicatordevelopment and data quality.
§ A new section on external factors affecting achievement of Departmental objectives.External factors are especially important in achieving education objectives because of thedependence of the Department on its governmental and institutional partners. This sectionidentifies, for each objective in Volume 1, key factors that are largely outside of directDepartmental control, and discusses how the Department is working to positively respond tostrengthen its objectives.
§ Draft standards on data quality. In its FY1999 plan, the Department made a commitmentto developing standards for data quality and a process for implementing these standards. Thisyear’s plan contains these draft standards and a plan for their implementation (see the sectionon Data Quality). The draft standards are now being reviewed by program offices and will beimplemented in FY1999.
Linking performance measurement to program improvement
The ultimate success or failure of Education’s Results Act initiative will hinge on how effectivethe Department is in integrating performance measurement into program, policy, andmanagement decisions across all aspects of service delivery. The failure of many prior federal-level management reforms, such as Zero-Based Budgeting and Management by Objectives,suggests the need for constant attention to its usefulness. It is not something that simply happens.
Performance measures are important for more than accountability; they are even more importantfor improvement. The Department has sought to meld the two together. Accountability to thetaxpayers of the country is necessary, but it is equally important to provide those being heldaccountable with the tools and supports for improvement.

U.S. Department of Education FY 2000 Annual Plan, Volume 1 Page 4
Examples of Departmental initiatives to strengthen accountability and to improve performanceare as follows:
§ The Deputy Secretary implemented performance agreements with all senior-level officersthat includes their identifying expected strategic plan accomplishments. These performanceagreements are designed to align with and carry out the relevant parts of the Strategic Plan foreach office. Regular meetings with the Deputy Secretary provide progress updates and canprovide needed Department-wide assistance.
§ The Department will propose elementary and secondary education legislation, that will carryout the President’s State of the Union pledge to improve the quality and accountability ofelementary and secondary schools through such performance-based strategies as issuingschool report cards to publicly report performance, ending social promotion, and assessingcompetency of entering teachers. Each measure is accompanied by corresponding requestsfor added assistance to facilitate performance.
§ The Department’s first-ever “Customer Satisfaction Report” will be released this year. It willidentify areas in which the Department serves its customers well and areas in whichimprovements are needed. The customer satisfaction report will segment the Departmentaround major customer groups, such as students, teachers, and higher education institutions,rather than organized by program. This will provide a comprehensive perspective on howwell the different parts of the Department work together to meet customer needs.
§ The Department will produce integrated program self-assessment guides to strengthen use ofperformance measures at both national and grantee service levels. Grantees can use theguides as tools to support self-appraisal and continuous improvement and for performancereporting.
§ The Department will expand staff training in performance measurement and strategicplanning. Education’s Intranet site will enable staff to receive training in plain English inperformance measurement, as through the recently prepared performance measurement guidein higher education “cite, ” along with examples and question and answers.
Measurement challenges
The Education Department works within a highly diverse and decentralized American educationsystem. This system presents several challenges for performance measurement
1. Overcoming serious data limitations. These stem from three main causes: some program andmanagement areas within the Department lack a foundation of performance measurement; thejoint character of federal programs with states, communities and institutions makes it difficult tocreate sound measurement systems, and the large numbers of programs the Department has tomeasure. The FY 2000 report has made inroads in filling measurement gaps and improvingquality. However, one unintended consequence of improved measures is some lack of indicatorcontinuity from those submitted for FY 1999. We expect in future years, as the Strategic andperformance plan process matures, the number and scope of indicator changes will be muchreduced.
2. Evaluating individual performance within a system in which national education goals andobjectives are achieved with limited federal control. Many larger federal programs, especially

U.S. Department of Education FY 2000 Annual Plan, Volume 1 Page 5
those within the elementary and secondary education system, operate as formula grants to helpoverall state educational systems meet the needs of certain national priority populations orservices. Control group studies to isolate a program’s unique contribution to outcomes, such asstudent test scores, are not feasible. In such cases, the Department of Education’s plan typicallyidentifies and displays both performance on joint outcomes and performance on intermediateprogram-specific outcomes, such as service quality, which are more directly under federal control(GAO, Managing for Results).
3. Cross-program and cross-agency coordination. Programs with overlapping purposes areanother example of joint program outcomes. For example, support for reading occurs directlythrough the new “America Reading Excellence Act,” but also through programs for special needpopulations, such as Title I, ESEA assistance for at-risk children in high-poverty areas. Volume Iof the plan is structured to focus on agency-wide objectives and allows for cross-cutting programgoals, with each objective including a description of related programs supporting that objective.
The Department is making progress in coordination, for example, in the research area, whereOERI is collaborating with the National Science Foundation and the National Institute for ChildDevelopment to develop a strong, coordinated research agenda. Other examples of cross-agencycoordination are summarized in Appendix A.
The Department of Education also realizes, however, that it needs to better understand therelationship among programs with overlapping goals and to assess the feasibility of strengtheningcoordination through joint planning, coordinated service delivery, and integrated performancemeasurement systems. To achieve that understanding the Department is initiating across-program/across-agency reviews in at least the following objective areas:§ Reading, including family literacy and early childhood (objectives 2.1 and 2.2)§ Mathematics (objectives 2.3)§ Teacher quality (objective 1.4)§ Technical assistance under the broader support objective (objective 4.2)§ Research and knowledge development.
4. Creating systems of information collection out of disjointed, overlapping studies,program performance reports, and statistical reporting. The Department will seek to reduceduplication through the application of distributive data base technology to improve data baselinkage. This work involves collaboration with program offices, research and statistical agencies,state and local grantees, and private foundations, where appropriate, so that information isgathered as efficiently and in as useful form as possible. The
5. Providing continuous, timely information. Information needs to be collected on criticalprocesses of implementation at multiple points to assess change, make midcourse corrections, andshare successes. New strategies for moving the Department’s evaluations to real-time informationare highlighted in the Appendix B on program evaluations.
6. Measuring the hard to measure. In some critical program areas, performance measurement issimply not well developed. A major example is teacher quality, where the primary measure isteacher credentials rather than direct measures of quality in the classroom or knowledge studentsacquire. Lack of good measures of teacher quality also affects the capacity to measureperformance across a number of programs affecting teachers from initial credential throughprofessional development. The Department will be launching a major review of teacher qualitymeasurement.

U.S. Department of Education FY 2000 Annual Plan, Volume 1 Page 6
Figure 1.
Inter-relationship of Strategic Plan Goals and Objectives
Goal 3: Ensuring access to postsecondaryeducation and lifelong learning.
Information and support to prepare forpostsecondary education; financial aid and supportservices to enroll and complete postsecondaryeducation; efficient student aid delivery; lifelonglearning.
Goal 2: Providing a solid foundation forlearning.
Ensuring that all children enter school ready tolearn; all children reading by end of 3rd grade; all8th-graders knowledgeable about math; and helpingspecial populations.
Goal 1: Helping all students reachchallenging standards.
Support for challenging academic standards; schoolto work systems; strong, safe, & disciplinedschools; talented teachers; meaningful family-school partnerships; greater public school choice;and education technology.
Goal 4: Achieving ahigh-performingdepartment.
Customer service; granteesupport and flexibility;knowledge base to supportreform and equity; effectiveuse of informationtechnology; skilled andhigh-performingemployees; financialintegrity; and performancemanagement.

U.S. Department of Education FY 2000 Annual Plan, Volume 1 Page 7
Figure 2.
U.S. Department of EducationFramework of Strategic Plan Goals and Objectives
Mission: To ensure equal access to educationand to promote educational excellence throughout the nation.
Goal 1.Help all students reachchallenging academic
standards so that they areprepared for responsible
citizenship, furtherlearning, and productive
employment.
Goal 2.Build a solid foundation
for learning for allchildren.
Goal 3.Ensure access to
postsecondary educationand lifelong learning.
Goal 4.Make ED a high-
performance organizationby focusing on results,
service quality, andcustomer satisfaction.
Objectives1.1 States develop
challenging standardsand assessments for allstudents in the coreacademic subjects.
1.2 Every state has aschool-to-work systemthat increases studentachievement, improvestechnical skills, andbroadens careeropportunities for all.
1.3 Schools are strong,safe, disciplined, anddrug-free.
1.4 A talented anddedicated teacher is inevery classroom inAmerica.
1.5 Families andcommunities are fullyinvolved with schoolsand schoolimprovement efforts.
1.6 Greater public schoolchoice will be availableto students andfamilies.
1.7 Schools use advancedtechnology for allstudents and teachers toimprove education.
Objectives2.1 All children enter
school ready tolearn.
2.2 Every child reads welland independently bythe end of the thirdgrade.
2.3 Every eighth-gradermasters challengingmathematics,including thefoundations of algebraand geometry.
2.4 Special populationsparticipate inappropriate servicesand assessmentsconsistent with highstandards.
Objectives3.1 Secondary school
students get theinformation, skills,and support theyneed to preparesuccessfully forpostsecondaryeducation.
3.2 Postsecondarystudents receive thefinancial aid andsupport services theyneed to enroll in andcomplete a high-quality educationalprogram.
3.3 Postsecondary studentaid delivery andprogram managementis efficient, financiallysound, and customer-responsive.
3.4 All adults canstrengthen their skillsand improve theirearning power overtheir lifetime throughlifelong learning.
Objectives4.1 Our customers receive
fast, seamless serviceand dissemination ofhigh-quality informationand products.
4.2 Our partners have thesupport and flexibilitythey need withoutdiminishingaccountability forresults.
4.3 An up-to-dateknowledge base isavailable from educationresearch to supporteducation reform andequity.
4.4 Our informationtechnology investmentsare sound and used toimprove impact andefficiency.
4.5 The Department’semployees are highlyskilled and high-performing.
4.6 Management of ourprograms and servicesensures financialintegrity.
4.7 All levels of the agencyare fully performance-driven.

U.S. Department of Education FY 2000 Performance Plan, Volume 1 Page 8
End Outcomes for Goal 1 and Goal 2
Context: Congress appropriated approximately $39 billion in FY 1999 for various program activitiesadministered by the U.S. Department of Education. Expenditures for these program activities representedabout 2 percent of the federal government’s annual $1.7 trillion budget. Continuing ED’s expenditures withfunding from all other federal agencies, the federal government contributes approximately 9 percent to totalnational expenditures on education, and the remaining 91 percent comes from State, local, and privatesources. More than half of the Department’s $39 billion budget supported elementary and secondaryeducation. In addition to the many programs the U.S. Department of Education administers, tax expenditurestargeted for education benefits also significantly support the objectives of the Department’s Strategic Plan.
To measure the use of these resources, the U.S. Department of Education’s Strategic Plan for sets forth sevenkey performance indicators for elementary and secondary education, which are shown here. These indicatorssummarize the nation’s education progress across the wide variety of Departmental programs, and provide apicture of the state of U.S. elementary and secondary education as a whole.
Progress toward the seven key outcome indicators in this section is influenced by federal programs andactivities taking place under Goals 1 and 2 of the Strategic Plan, namely:
§ Goal 1: “All students will reach challenging academic standards so that they are prepared for responsiblecitizenship, further learning, and productive employment.”
§ Goal 2: “A solid foundation will be built for the learning of all children.”
External factors. The outcomes measured by these seven indicators cannot be achieved by the federalgovernment alone, but constitute a shared national responsibility of districts, schools, parents, communities,and society at large. The strategies described in Goals 1 and 2 show how we can work together with our non-Federal partners to focus on results, minimize administrative burden, and use resources to the fullest in orderto maximize student learning.
Performance indicators and charts
Indicator 1. Increasing percentages of all students will meet or exceed basic,proficient, and advanced performance levels in national and state assessments ofreading, math, and other core subjects.
Indicator background and context. The percentage of fourth and twelfth grade students performing at orabove the basic level in reading has been stable since the early 1990s. Eighth graders’ reading performancehas improved. Math performance improved substantially for students in all three grades from 1990 to 1996.

U.S. Department of Education FY 2000 Performance Plan, Volume 1 Page 9
Limitations of the data. Reading data for 1990 is omitted because it is not comparable with that of lateryears.
Performance of Students on NAEP Assessment(Percentage of Students Scoring At or Above NAEP Basic Level)
GoalGoal
62% 60% 62% 66%
50%59% 64%
70%
0%
20%
40%
60%
80%
100%Grade 4
1992 19981994 2002 1990 19961992 2000
MathReading
Goal Goal
69% 70% 74%79%
52%58% 62%
70%
0%
20%
40%
60%
80%
100%Grade 8
1992 19981994 2002 1990 19961992 2000
GoalGoal
80%75%
77%85%
58%64%
69%74%
0%
20%
40%
60%
80%
100%Grade 12
1992 19981994 2002 1990 19961992 2000
Figure 3

U.S. Department of Education FY 2000 Performance Plan, Volume 1 Page 10
Verification/validation of measures: Data verified and validated by the National Center for EducationStatistics and the National Assessment Governing Board.Data source(s). National Assessment of Educational Progress (NAEP) and the National Center forEducation Statistics.
Indicator 2. Students in high-poverty schools will show continuous improvement inachieving proficiency levels comparable to those for the nation.
Indicator background and context.Reading. While students in low-poverty schools improved their reading scores from 1988 to 1996, scores ofstudents in high-poverty schools have only begun improving since 1992. From 1992 to 1996, scores of 9-year-olds in high-poverty schools rose by 8 scale score points, or close to a grade level of improvement.
Figure 4 Figure 5
Math. Improvement in mathematics has occurred most appreciably for students in high-poverty schools since1992, rising by 11 points, or one grade level. (High-poverty schools are defined as those in which more than75% of the students are eligible for free or reduced-price lunch. Low-poverty schools are defined as havingfewer than 25 % students eligible for free or reduced-price lunch.) The Department of Education’s target isto improve the mathematics and reading performance of students in high-poverty schools, such that by theyear 2000, at least 50% of these students perform at or above the basic level on NAEP.
Limitations of the data. Data on the percentage of students eligible for free and reduced-price lunch is notavailable for some schools.Verification/validation of measures: Based on special analyses of NAEP Reading and Mathematics trenddata. NAEP is reviewed according to NCES Statistical Standards.Data source(s). Special analyses of data from National Assessment of Educational Progress (NAEP) and theNational Center for Education Statistics. Next update: Math 2000 data is due in 2001.
Indicator 3. The proportion of high school graduates, including vocationalconcentrators, who complete at least three years of science and three years of math willincrease 10% between 1994 and 2000.
Trends in NAEP Mathematics PerformanceAverage Scale Scores of 9-Year-Old Public School Students by Poverty Level of School (1986 to 1996)
236
208213
208215 217
238239237
228 230229230219
228
160
180
200
220
240
260
1986 1990 1992 1994 1996
Low-Poverty Schools High-Poverty Schools
All Schools
Trends in NAEP Reading PerformanceAverage Scale Scores of 9-Year-Old Public School Students by Poverty Level of School (1988 to 1996)
220
190 189180 184 188
225220221217210209209211 209
160
180
200
220
240
260
1988 1990 1992 1994 1996
Low-Poverty Schools High-Poverty Schools
All Schools
Prereauthorization Prereauthorization

U.S. Department of Education FY 2000 Performance Plan, Volume 1 Page 11
Indicator background and context. In 1994, 60% of all high school graduates had completed three years ofmathematics and three years of science. In addition to the number of years of coursework, the level ofdifficulty of the courses students complete is also important. The percentage of students completing variouscourses in mathematics and science has increased for all courses offered, as well as for more challengingcourses such as calculus and physics.

U.S. Department of Education FY 2000 Performance Plan, Volume 1 Page 12
Percentage of High School Graduates Who HaveTaken 3 Years of Math and 3 Years of Science
60%70%
0%
20%
40%
60%
80%
100%
2000 (Goal)1994
Figure 7
Figure 6
Percentage of High School Graduates TakingSelected Mathematics and Science Courses in High
School: 1990 to 2000
14%
22%
22%
64%
75%
9%
17%
17%
59%
70%
7%
13%
18%
52%
63%
0% 20% 40% 60% 80% 100%
19901994
2000 (Target)
Mathematics
Geometry
Algebra II
Trigonometry
Analysis/pre-calculus
Biology
26%
59%
29%
61%
99%
21%
54%
24%
56%
94%
19%
48%
22%
49%
91%
0% 20% 40% 60% 80% 100%
1990
1994
2000 (Target)
Science
Calculus
Chemistry
Physics
Biology andchemistry
Biology,chemistry,
and physics

U.S. Department of Education FY 2000 Performance Plan, Volume 1 Page 13
Limitations of the data. These data are collected only once every four years, and 1998 data will be availablein year 2000.Verification/validation of measures: Special tabulations produced for and reviewed by the National Centerfor Education Statistics, according to the NCES Statistical Standards.Data source(s). Based on 1994 High School Transcript Study and other surveys, National Center forEducation Statistics. Next update: 2000.
Indicator 4. Increasing numbers of high school students will successfully completeadvanced placement courses each year.
Indicator background and context. Since 1990, an increasing proportion of 11th and 12th grade studentshave been taking Advanced Placement (AP) courses, and an increasing number have passed at the levelnecessary to receive college credit. In 1998, 150 AP tests were administered per 1000 students, and 96 ofthose tests were awarded college credit. This trend toward increased AP course-taking began in 1984, andhas occurred among both sexes and all racial/ethnic groups.
Figure 8
Limitations of the data. Because AP candidates often take more than one examination, there is not a one toone ratio between the number of examinations taken and the number of students.Verification/validation of measures: Special analyses prepared for and reviewed by the National Center forEducation Statistics according to NCES Statistical Standards. Data supplied by The College Board.Data source(s). Based on special analyses of data from the College Board AP Program prepared for andreviewed by the National Center for Education Statistics. Next update: 1999 data due in 2000.
Indicator 5. Students in high-poverty schools will complete comparable amounts ofchallenging coursework -- including advanced placement courses -- which will enablethem to pursue higher education or other options.
75 7683
90 96
130150
139
122113
020406080
100120140160
1994 1995 1996 1997 1998
Number of AP Tests Administered
Number of Tests Earning College Credit
Number of Advanced Placement (AP) Tests Administeredand Number with Test Scores Required for College Credit,
per 1,000 11th and 12th Grade Students,1994 to 1998

U.S. Department of Education FY 2000 Performance Plan, Volume 1 Page 14
Indicator background and context. As preparation for college, students are encouraged to complete threeyears of mathematics and three years of science. In 1994, there was only a small gap between the percentageof all graduates and the percentage of graduates of high-poverty schools who had taken this coursework.
While the number of years of mathematics is important, the rigor of the coursework is also important. (Seeindicator 3 in this series). Research shows that schools with a large proportion of high- poverty students areless likely to offer advanced courses than schools in which students come from affluent families.
Figure 9
Limitations of the data. Data collected only once every four to six years. Next data to be collected in 2000.Verification/validation of measures: Special analyses prepared for the National Center for EducationStatistics and reviewed according to NCES Statistical Standards.Data source(s). Based on special analyses of data from the NAEP Transcript study prepared for the NationalCenter for Education Statistics. Next update: 1998 data due in 2000.
Indicator 6. High school attendance and graduation rates will continually improve --particularly in high-poverty schools and among students with disabilities and others atrisk of school failure.
Indicator background and context. Between 1990 and 1996, the percentage of students who dropped outof high school increased slightly for all students, and also for students from low-income families. There aremany ways to calculate drop out rates. The rate used in this indicator is the event drop out rates, which is themost sensitive to year-to-year changes in the percentage of students who leave school before graduating. Theevent drop out rate is defined as the percentage of 15-24 year olds who were enrolled in high school one year,but had not completed high school, and were not enrolled in grades 10 to 12 in October a year later.
High School Graduates Who Have Taken 3 or More Years of Math and 3 or More Years of
Science by Poverty Level of School: 1994 and 2000 (Target)
70%56%
65%60%
0%
20%
40%
60%
80%
100%
1994 2000 (Goal)
All High School Graduates Graduates from High-Poverty Schools

U.S. Department of Education FY 2000 Performance Plan, Volume 1 Page 15
Figure 10
Limitations of the data. None.Verification/validation of measures: Data published by the National Center for Education Statistics, andreviewed according to NCES Statistical Standards. Based on U.S. Department of Commerce, Bureau of theCensus.Data source(s). U.S. Department of Commerce, Bureau of the Census, Current Population Survey, October(various years), and National Center for Education Statistics.
Indicator 7. Increasing percentages of high school graduates will successfullytransition into employment, further education, or the military.
Indicator background and context. The percentage of graduates who were enrolled in college the Octoberfollowing graduation has risen steadily since the early 1990s. The percentage of graduates not in college whoare employed rose dramatically in 1997. The percentage of graduates who are employed is sensitive tofluctuations in the economy.
0%
5%
10%
15%
20%
1 9 8 8 1 9 9 0 1 9 9 1 1 9 9 2 1 9 9 3 1 9 9 4 1 9 9 5 1 9 9 6 1 9 9 7 1 9 9 8 1 9 9 9 2 0 0 0
Low-income A ll students High-income
Recent School Dropouts, by Family Income, 1988-1998(Event Dropout Rates)
Goals
13.7%
4.8%
1.3%
9.1%
3.0%
2.1%

U.S. Department of Education FY 2000 Performance Plan, Volume 1 Page 16
Figure 11 Figure 12
Limitations of the data. None.Verification/validation of measures: Data provided by the National Center for Education Statistics, andreviewed according to NCES Statistical Standards.Data source(s). Based on special analyses of Census Bureau data, and the October Current PopulationSurveys prepared for the National Center for Education Statistics. Next update: annually.
Transition to College: 1981 to 1999Percentage of High School Graduates Aged 16-24 Who Were Enrolled in
College the October Following Graduation
Target: 2%Improvement
each year
71%
54%
0%
20%
40%
60%
80%
100%
81 83 85 87 89 90 91 92 93 94 95 96 97 98 99
Transition from High School to Work: 1980 to 1999Recent High School Graduates Not in College - Percent Employed
Target: 2%Improvement
each year
71%
69%
0%
20%
40%
60%
80%
100%
80 82 84 86 8 8 89 90 91 92 93 94 95 96 97 98 99

U.S. Department of Education FY 2000 Annual Plan, Volume 1 Page 17
Goal 1. Help all children reach challenging academicstandards, so that they are prepared for responsiblecitizenship, further learning, and productive employment.
A high quality education system is essential for America’s future prosperity. Today’s students will,within a few years, participate in our political system and our economy. To prepare them to makeproductive contributions, the U.S. Department of Education (ED) will continue to assist educators,decision-makers, and families in reforming and revitalizing education at all levels.
So that all students will be prepared for responsible citizenship, further learning, and productiveemployment, the U.S. Department of Education will continue to focus on the areas that are central toimproving and maintaining high standards of learning for everyone. ED is committed to pursuingstrategies that help American schools provide students with equal opportunities to excel. This meansensuring that:
1. States develop and implement challenging standards and assessments for all students in the coreacademic subjects. All students must have the opportunity to attain educational excellence,which will only happen if schools are held accountable for helping students achieve.
2. Every state has a school-to-work system that increases student achievement, improves technicalskills, and broadens career opportunities for all. By improving the connection between real worksituations and the classroom, and by increasing access to further education and training, we caninspire students to strive for excellence and ensure that they make a smooth transition to futurecareers.
3. Schools are safe, disciplined, and drug-free. If students are to learn effectively, schools mustprovide a safe and drug-free environment.
4. A talented and dedicated teacher is in every classroom in America. Teachers who are well-prepared and highly skilled support, encourage, and inspire student excellence.
5. Families and communities are fully involved with schools and school improvement efforts.When families are involved in their children’s education, learning improves. When families areinvolved in schools, schools improve. Family involvement is an essential part of ensuringeducational excellence.
6. Greater public school choice will be available to students and families. Public school choice canhelp schools in addressing the needs and interests of students and families, fostering improvedlearning.
7. Schools use advanced technology for all students and teachers to improve education. When usedeffectively, with appropriate training and other support, technology can significantly improveteaching and learning.
As part of the process of reauthorizing the Elementary and Secondary Education Act, the Department isexploring ways to strengthen the legislation to ensure that all students learn to high standards, build thecapacity of schools and teachers to provide a high-quality education, and support accountability foreducational results in states, districts, and schools. By pursuing key strategies in these areas—including

U.S. Department of Education FY 2000 Annual Plan, Volume 1 Page 18
financial support, technical assistance, dissemination of innovative approaches, coordination with stateinitiatives and the efforts of other federal agencies, research and evaluation—the U.S. Department ofEducation is fostering educational excellence and success for all students.

U.S. Department of Education FY 2000 Annual Plan, Volume 1 Page 19
Objective 1.1: States develop challenging standards andassessments for all students in the core academic subjects.
Context: All students must have the opportunity to reach high levels of educational excellence, and allschools should be held accountable for enabling students to achieve to high standards. The FY 1994reauthorization of the federal elementary and secondary programs, along with the creation of Goals 2000,supported the development of challenging standards and assessments, and brought federal programsupport and accountability in line with state and local reform efforts. As states make progress indeveloping challenging content and student performance standards, the focus of the U.S. Department ofEducation (ED) is turning toward helping states and districts build the capacity of schools and teachers todeliver high-quality curriculum and instruction and to provide students with the support they need to meethigh standards for learning.
Meeting the goal of helping all children reach high standards of learning is a truly cross- cutting objectivein which every federal program has a role to play. Most notably, Title I of the Elementary and SecondaryEducation Act (ESEA) is focused on ensuring that all students meet high standards, especially studentswho are at risk of educational failure in economically disadvantaged communities. Goals 2000 providesgrants to states and districts to improve student achievement by supporting local standards-based reformefforts. Through these programs, ED is helping states, districts, and schools to develop challengingcontent and student performance standards and assessments, bring standards into the classroom; holdschools accountable for results; and assist states, districts, and schools in aligning all aspects of theireducational system with high standards of learning.
Although it appears that all states are making progress on developing standards and have adopted a timeline that will produce assessments aligned with content and student performance standards by 2000-01, anumber of states are currently operating under a waiver of the ESEA standards deadline to extend theperiod of time these states have to complete the process of developing performance standards. Manystates have adopted a process different from the one anticipated in 1994. Rather than developing studentperformance standards as a template for assessments to come on line later, many states are developingtheir assessment instruments and constructing performance standards from pilot tests of their newassessments. This approach requires more time than the statute allowed. A few states are experiencingtechnical difficulties related to developing and aligning their standards. ED has made technical assistanceavailable to these states and has granted waivers to extend the period of time they have to complete thestandards process.
External factors: The development of state content and performance standards is an ongoing processrequiring constant revision, improvement, and raising of expectations and standards. To be meaningful,setting standards at the state level must be accompanied by ongoing efforts to bring standards to theclassroom level, equip teachers to help students meet standards, and set in place measures ofaccountability for meeting expectations. While the Department has provided assistance and expertise toaccelerate the pace of reform and enhance the impact, standard setting is ultimately a state-levelresponsibility.
Key strategies
n Challenging state content and student performance standards. To ensure that states follow arigorous process for continually upgrading and improving challenging content and performancestandards, ED is peer-reviewing evidence submitted related to the process that states have used toadopt challenging standards; providing technical assistance to states through peer consultants,

U.S. Department of Education FY 2000 Annual Plan, Volume 1 Page 20
comprehensive assistance centers, and regional labs; and raising public awareness of standards andassessment issues.
n Assessments aligned with high standards. Using Title I and Goals 2000 grants, ED helps statesmeet the statutory requirement that they have assessment systems in place to measure studentperformance against state standards for at least two core subjects by 2000-01.
n Help students with special needs meet high standards. ED is helping states make assessmentsinclusive of students with limited English proficiency (LEP) and special needs ensuring that statesinclude students with limited proficiency in English and students with disabilities in theiraccountability systems through appropriate accommodations on assessments; and developing modelalternative assessments for states to use when students cannot be accommodated in the regularassessment program.
n Reauthorization of ESEA. ED is developing reauthorization proposals that will build the capacity ofschools and teachers to deliver challenging curriculum and engaging instruction aligned to highstandards. These proposals include promoting staff development to ensure that teachers have theknowledge and skills necessary to help all students meet high standards and using technology tosupport student learning.
Selected Accomplishments
Recognition by GAO for Goals 2000 contribution to standards-basedreform efforts§ A 1998 report by the General Accounting Office on the activities of Goals 2000 praises the
program for its work in helping states and districts implement standards-based reform. Thereport notes, “Many state officials report that Goals 2000 has been a significant factor inpromoting their education reform efforts and, in several cases, was a catalyst for some aspectof the state’s reform movement. State and local officials said that Goals 2000 fundingprovided valuable assistance and that, without this funding, some reform efforts either wouldnot have been accomplished or would not have been accomplished as quickly.”
Progress on state content standards§ 48 states plus Puerto Rico and the District of Columbia have developed state content standards.
One state is in the process of developing state content standards and in the other remainingstate, districts are responsible for developing standards that meet the state’s criteria.
Focused assistance on performance standards§ The Department of Education (ED) is helping states develop performance standards by
supporting teams of peer consultants to work with the states. The peer consultants conveneTitle I, assessment, and other state officials and experts to clarify issues, give technicalassistance, and help develop a timeline for the implementation of standards. The peerconsultant teams, made up of state and local experts in the field, assisted 7 states in 1998.
§ ED published a handbook on performance standards developed by a collaboration of about 20states called the State Collaborative on Assessments and Student Standards (SCASS), who areworking together through the Council of Chief State School Officers on standards andassessment issues. The handbook has been broadly disseminated and is being used as a guidefor several workshops the Department is holding for states facing challenges in puttingperformance standards in place. The handbook provides state policymakers, assessmentdirectors, and teachers with detailed information on the process of developing performancestandards.

U.S. Department of Education FY 2000 Annual Plan, Volume 1 Page 21
Coordination with other federal agencies
n National Science Foundation. ED is building on the math and science activities funded by theNational Science Foundation, and is working with NSF to learn from and build upon the systemicinitiatives.
n National Education Goals Panel. ED is working with National Education Goals Panel as well asvarious organizations and associations to promote strategies to implement standards in the classroom.
n Department of Defense. ED is providing opportunities for interagency collaboration on standardsissues. For example, the Department of Defense is represented on the Department of Education’sStandards and Accountability Team.
n Department of Interior. ED is working with Bureau of Indian Affairs to develop standards andassessments for the Bureau’s schools and to ensure that programs are implemented to help Indianstudents reach challenging standards.
n National Academy of Sciences. ED is working with the National Academy of Sciences todisseminate information on state-of-the-art assessment techniques.
Programs supporting this objective
Grantsn Goals 2000n Title I Grants to States for
Disadvantaged Childrenn Fund for the Improvement of
Educationn School-to-Work Opportunitiesn IDEA: State Grants (Part B)n IDEA: State Improvement
Grants (Part D)n Eisenhower Professional
Developmentn Comprehensive School Reform
Demonstration
Technical assistance anddisseminationn Comprehensive Regional
Assistance Centers EisenhowerRegional Consortia
n Fund for the Improvement ofEducation
n Regional EducationalLaboratories
n Parent Information Centers(IDEA Part D)
n National DisseminationActivities
Research and demonstrationn Comprehensive School Reform
Demonstrationn National Education Research
Institutes (Student AchievementInstitute)
n IDEA Research and Innovation
Performance indicators and charts
State progress for Goals 2000 is measured through annual Goals 2000 state reports and ED’s evaluationof the state implementation of Goals 2000 and ESEA programs. ED has developed a number of indicators

U.S. Department of Education FY 2000 Annual Plan, Volume 1 Page 22
to track improvements in instruction based on these new standards and assessments, including theimplementation of research-based approaches in Title I schools and the progress of students, particularlythose in high-poverty Title I schools, in meeting challenging standards.
Indicator 8. By the end of the 1997-98 school year, all states will have challengingcontent and student performance standards in place for two or more core subjects.
Indicator background and context. States are expected to submit evidence that standards are in placeand that states followed a rigorous process in adopting their standards. ED has approved the developmentprocess for content standards in 48 states, the District of Columbia, and Puerto Rico for content standards(see Figure 13). One additional state is still in the process of developing state content standards and in theother, standards are being developed at the district level.
Although states were required to have content and performance standards completed in the 1997-98school year, ED anticipates that many states’ student performance standards will not be completed until2000-01 because many states are developing performance standards at the same time as final assessments,which aren’t required to be in place until that time. To date, 21 states and Puerto Rico have completed thedevelopment of both content and student performance standards (see Figure 14).
Figure 13 Figure 14
Limitations of the data. Although states are expected to submit evidence that standards are in place,states are not required to submit their standards to the U.S. Department of Education. Therefore, ED canonly evaluate whether states used a challenging process in developing and adopting standards, not thequality of the standards themselves.Verification/validation of measures. Independent validation of state-reported information on the qualityof state content and performance standards has been obtained through peer reviews of state-reportedprocesses and information and by reviews of standards by non-governmental organizations, such as theCouncil for Basic Education, Achieve, the American Federation of Teachers, and the FordhamFoundation. Program evaluations will independently assess the quality of evidence which states submit todemonstrate that their standards are challenging.Data source. Department of Education review of evidence submitted by states to demonstrate theirstandards and assessment development process, ongoing.
42
5052
0
10
20
30
40
50
60
1997 1998 1999
Nu
mb
er o
f S
tate
s
States with Challenging Content Standards
Goal
8
22
38
5052
0
10
20
30
40
50
60
1997 1998 1999 2000 2001
Nu
mb
er o
f S
tate
s
States with Challenging Performance Standards
Goal

U.S. Department of Education FY 2000 Annual Plan, Volume 1 Page 23
Indicator 9. By 2001, all states will have assessments aligned to challenging contentand performance standards for two or more core subjects.
Indicator background and context. States are required by Title I to have assessments aligned withchallenging standards in place by the 2000-01 school year. Final assessments must include all students,and states must be able to disaggregate performance by student groups. A review of state progress onimplementing IASA requirements indicates that as of 1997, 14 states provided evidence that they have inplace assessments aligned to state content standards in place (see Figure 15). However, no state hasformally notified ED that it has all components of its final assessment in place.
Figure 15 Figure 16
Limitations of the data. ED may not validate aligned standards and assessment systems and relies onself-reported information and a review of the process for adopting standards and assessments.Verification/validation of measures. A comparison of student achievement on the National Assessmentof Educational Progress (NAEP) with achievement on various state assessments indicates reason forconcern about the rigor of state performance standards and assessments (see Figure 16). States’ ownperformance measures may be more or less rigorous when compared with an independent assessmentsuch as NAEP. However, note that the content of the NAEP assessment may not align with a State’s owncontent and performance standards.Data source(s). Schneck and Carlson, “Standards-Based Assessment and Accountability in AmericanEducation: A Report on States’ Progress (draft)” 1998; National Center for Education Statistics.
14
28
45
52
0
10
20
30
40
50
60
1998 1999 2000 2001
Nu
mb
er o
f S
tate
s
States with Assessments Aligned withChallenging Standards
Goal
State 1996 NAEP Scores for 8th Grade MathematicsCompared to States’ Own Assessments
79
68
81
13
28
68
43
48
55
47
38
48
51
55
56
56
57
67
67
70
0 10 20 30 40 50 60 70 80 90 100
Louisiana
South Carolina
Georgia
Delaware
Kentucky
North Carolina
Maryland
Oregon
Michigan
Connecticut
Percent of Students
NAEP Basic
State Standard
Percent of students scoring at or above Basic on NAEP and percent of students meeting state standards

U.S. Department of Education FY 2000 Annual Plan, Volume 1 Page 24
Indicator 10. By 2002, increasing percentages of the public and parents will be awareof the importance of challenging academic standards for all children, including at leastthe majority of parents from low-income families.
Indicator background and context. The initial challenge for states is to develop challenging content andstudent performance standards. For students to reach higher levels of achievement, these standards mustbe implemented in the classroom; and the public, especially parents, must be made aware of standards.This indicator measures views of teachers about standards in the classroom and parental awareness ofgoals and standards. According to a 1998 survey by Public Agenda, a majority of teachers and parents arefamiliar with efforts to raise standards for their students (see Figure 17).
Figure 17
Limitations of the data. ED is preparing a survey instrument that will serve as a valid and consistentsource for updating this indicator, including for awareness of standards among low-income families.Verification/validation of performance measures: Public awareness and opinions on standards will beobtained through national polls that meet acceptable statistical standards.Data source. Public Agenda, 1998.
Awareness and Implementationof Standards: 1998
98%
46%
55%
0% 20% 40% 60% 80% 100%
Parents that say they know a lot about academic goals
Teachers that say standards have raised their
expectations of students
Teachers that saystate/district set
standards for learning

U.S. Department of Education FY 2000 Annual Plan, Volume 1 Page 25
Objective 1.2: Every state has a school-to-work system thatincreases student achievement, improves technical skills,and broadens career opportunities for all.
Context: Researchers, educators, employers, and policymakers have sought ways to make educationrelevant to students’ future careers, to adapt instruction to the ways in which students learn best, and toensure that students learn the habits and skills that employers value. By adding meaningful context fromthe world of work, educators hope to engage the interest and intellect of students and help them learnmore effectively. Whether learning by doing is accomplished at school or in a work setting, school-to-work (STW) systems seek to improve career prospects and academic achievement in high school--andthereby boost enrollment in postsecondary education and increase the likelihood of obtaining high-skill,high-wage employment.
The School-to-Work Opportunities Act, signed into law in 1994, aims to improve learning by connectingwhat goes on in the classroom to future careers and to real work situations and to increase student accessto opportunities for postsecondary education and advanced training. The recently reauthorized Carl D.Perkins Vocational and Applied Technology Education program will help support activities that sustainand enhance STW systems once the STW Act sunsets in 2001.
External factors: Implementing school-to-work systems is a long-term effort that will require state andlocal support beyond the period of the initial federal investment for system-building. The Departments ofEducation and Labor are working closely with states to develop ways to sustain promising STW activitiesafter federal funding ends.
Key strategies
n Curriculum improvement. The Department is requesting $1.03 billion for a reauthorized VocationalEducation State Grants program that supports state and local efforts to integrate vocational andacademic education and to link secondary and postsecondary education.
n Support high academic achievement and transition to postsecondary education. The FY 2000request includes $17.5 million for national activities, including projects to develop career clusterswith career-related curricula, standards, and certificates in the areas of high-demand occupations. TheBuilding Linkages Project will develop curriculum around broad industry clusters, which helpintegrate academic requirements and industry requirements as presented in industry-recognized skillstandards.
n Support state and local development of School-to-Work systems. The Administration requests $55million for the School-to-Work Opportunities initiative in the FY 2000 Department of Educationbudget, with an identical amount requested in the Department of Labor budget. FY 2000 funds willcomplete federal support for 25 State Implementation Grants, 60 Urban/Rural Opportunities Grants,and grants for the territories and Indian youth.
n Support high school reform. ED will continue support for the New American High Schools andNew Urban High School initiatives, which help sustain STW by creating organizational flexibilityand promoting high academic standards.

U.S. Department of Education FY 2000 Annual Plan, Volume 1 Page 26
n Strengthen accountability. ED will work with state vocational education agencies and state school-to-work partnerships to improve the quality and use of state accountability systems. Currently, sevenstates are participating in a pilot project to establish a set of core performance measures that can beused both for local program improvement and national accountability.
n Involve schools, colleges, and employers in building School-to-Work systems and strongervocational education programs. Key approaches include these:§ Get high schools, postsecondary institutions, and adult high schools involved in School-to-
Work systems and vocational education by sponsoring a national information center; creatingnetworks that include educators, employers, and other key stakeholder groups; andsponsoring efforts to align postsecondary admissions policies with new methods of assessinghigh school student performance.
§ Build strong employer participation in School-to-Work by targeting outreach activities toemployers and their organizations.
§ Promote professional development by helping colleges of education incorporate school-to-work elements in their curricula, and by supporting teacher training efforts aimed atimproving the skills of teachers in using contextual learning approaches for instruction inbasic and technical skills.
Coordination with other federal agencies
n Department of Labor. The Departments of Education and Labor jointly administer the School-to-Work program and will improve the management of this program by aligning grant-making, audit,technical assistance, budget, and performance reporting functions.
n Job Corps. Job Corps Centers are incorporating tenets of STW to improve the effectiveness ofservices for out-of-school youth.
Selected AccomplishmentsSchool-to-Work (STW) are in all states and are serving specialpopulations• As of October 1, 1998, STW implementation grants had been awarded to all 50 states, the
District of Columbia, and Puerto Rico. STW implementation also continues in the territories,Urban/Rural Opportunities areas, and in projects that serve Native Americans.
One-fourth of STW programs are part of collaborative reform efforts• In increasing numbers of states, School-to-Work is being combined with other education
reform efforts to raise academic achievement for all students. About one-fourth of STWpartnerships are built upon collaborative efforts that include Title I, Goals 2000, Tech-Prepand workforce development boards.
More students are connecting academic courses with career interests• An independent evaluation of 8 states implementing School-to-Work systems found that
between 1996 and 1998, more students saw a connection between their academic courseworkand career interests, with particularly large increases among black students and the non-college bound.

U.S. Department of Education FY 2000 Annual Plan, Volume 1 Page 27
Programs supporting this objective
State grant programsn School-to-Work Opportunitiesn State Grants for Vocational Educationn Tech-Prep Educationn IDEA Grants to Statesn Title I
Research, development, and technicalassistancen IDEA Research and Innovationn Vocational Education National Programs,
including the National Center for Researchon Vocational Education
n School-to-Work National Program
Performance indicators and charts
Indicator 11. By fall 2000, 2 million youth will participate annually in STW.
Indicator background and context. High school participation rates increased from 280,000 youth in1996 to 472,000 in 1997 (see Figure 18). “Participants” are defined as students who take integratedacademic and vocational coursework and work-based learning.
Figure 18
Limitations of the data. States may differ in their definition of vocational coursework.Verification/validation of measures. Case studies in four states are under way to examine the process bywhich local partnerships gather the information reported in their progress reports.Data source. Grantee progress reports; next update in 1999 for 1997/98 school year.
Annual Student Participation in STW Systems
280,000 471,000
1,000,000
1,500,000
2,000,000
0
500,000
1,000,000
1,500,000
2,000,000
2,500,000
1995-96 1996-97 1997-98 1998-99 1999-00
Nu
mb
er o
f st
ud
ents
GOAL
GOAL
GOAL

U.S. Department of Education FY 2000 Annual Plan, Volume 1 Page 28
Indicator 12. By fall 2000, the percentage of high school graduates from STW systemscompleting 3 years of math and 3 years of science will increase by 10 percent.
Indicator background/context. In 1996, 83 percent of high school seniors graduating from STWsystems completed 3 years of math, 73 percent completed 3 years of science, and 69 percent 3 years ofmath and science. Figure 19
Limitations of the data. Results based on high school transcripts for sample of high school students in 8states.Verification/validation of measures. Transcripts are a rigorous method for collecting information oncoursework, although course titles may differ across communities for similar courses.Data source. Student transcripts from National Evaluation of School-to-Work Implementation,Mathematica Policy Research; next update in 1999 for 1998 high school graduates.
Indicator 13. By fall 2000, the percentage of high school graduates, includingvocational concentrators, who make a successful transition into employment, furthereducation, or the military will increase to 90 percent.
Indicator background and context. Eighteen months after graduating from high schools that participatein school-to-work systems, 60 percent of 1996 graduates were enrolled in two-year or four-year college, 7percent were in other postsecondary training programs or the military, and 20 percent were employed full-time. Overall, 87 percent of all students were enrolled in post-secondary education or the military or wereemployed full-time. A similar proportion of vocational concentrators made successful transitions,although these students were less likely to be enrolled in college and more likely to be employed full-time.
Percent of All Students that Have Taken 3 Years of Math andScience in States with School-to-Work (STW) Systems in 1996
83.4% 73.0%
69.0%
0%
20%
40%
60%
80%
100%
3 yrs ofmath
3 yrs ofscience
3 yrs ofmath &science
93.4%83.0% 79.0%
Actual percentages Target for the Year 2000

U.S. Department of Education FY 2000 Annual Plan, Volume 1 Page 29
Figure 20
Limitations of data. Results based on high school transcripts for sample of high school students in 8states.Verification/validation of measures. Transcripts are a rigorous method for collecting information oncoursework, although course titles may differ across communities for similar courses.Data Source. Student surveys from National Evaluation of School-to-Work Implementation,Mathematica Policy Research; next update in 2000 for 1998 high school graduates.
Indicator 14. By fall 2000, 10 percent of students in local STW systems will earn skillcertificates.
Indicator background/ context. The percentage of high school seniors who had earned skill certificatesremained unchanged—2.4% in 1996 and 3.6% in 1997 (see Figure 21).
Figure 21
Student Participation in Education and Employment Activities(18 months after high school)
6 0 %
7 %
2 0 %
9 %
2 8 %
6 3 %
7 %
2 0 %
5 0 %
0%
20%
40%
60%
80%
100%
Any College (Two
or Four Year)
Other
Postsecondary/
Full Time
Employment
Per
cen
tag
e C
urr
entl
yP
arti
cip
atin
g In
Act
ivit
y**
*A “vocational concentrator” is a student who completed 3 credits in one of the following specific labor marketpreparation programs: agriculture, business/office, marketing/distribution, health, occupational home economics,trade and industry, and technical communications.
Military
**Percentage in each activity is exclusive of other activities; where students were both employed full-time andattending college, they were counted as enrolled in college.
Sample sizes: all students, n=1776; vocational concentrators, n=353
All StudentsVocational Concentrators*Target for the Year 2000
2.4% 3.6% 5.0% 7.0%10.0%
0%
20%
40%
60%
80%
100%
1995-96 1996-97 1997-98 1998-99 1999-00
Per
cen
t o
f S
tud
ents
Students Earning Skill Certificates
Goal

U.S. Department of Education FY 2000 Annual Plan, Volume 1 Page 30
Limitations of data. Based on aggregate estimates of STW partnerships.Verification/validation of the data. Survey subject to rigorous data quality procedures.Data source. Local partnership surveys from National Evaluation of School-to-Work Implementation,Mathematica Policy Research; next update 1999 for 1997-98 school year.
Indicator 15. By fall 2000, 40 percent of high schools will have implemented key STWconcepts.
Indicator background/context. In 1996, a national survey of school administrators reported that 30percent of high schools were implementing more "school-based,” “work-based,” and “connecting” STWactivities than the typical high school. Other results from an independent evaluation found no changebetween 1996 and 1997 in the percentage of high schools that offered career major programs coupledwith work-based learning (25 percent).
Limitations of data. Surveys count the frequency with which schools offer STW activities even if fewstudents participate.Verification/validation of the data. Survey subject to rigorous data quality control procedures..Data Source. National Longitudinal Survey of Youth, Survey of School Administrators; next update in2001. Local partnership surveys from National Evaluation of School-to-Work Implementation,Mathematica Policy Research; next update in 1999 for 1997/98 school year.
Indicator 16. By fall 2000, 350,000 employers participating in STW systems will offerwork-based learning opportunities.
Indicator background/context. The number of employers providing work-based learning opportunitiesfor students doubled—from 59,239 in 1996 to 136,176 in 1997 (see Figure 22).
Figure 22
Employers Providing Work-Based LearningExperiences
59,239
136,176
200,000
270,000
350,000
0
50,000
100,000
150,000
200,000
250,000
300,000
350,000
400,000
1995-96 1996-97 1997-98 1998-99 1999-00
Goal
Goal
Goal
Nu
mb
er o
f em
plo
yers

U.S. Department of Education FY 2000 Annual Plan, Volume 1 Page 31
Limitations of data. The nature of work-based learning experiences may differ considerably acrossemployers.Verification/validation of measures. Case studies in four states are under way to examine the process bywhich local partnerships gather the information reported in their progress reports.Data Source. Grantee progress reports; next update in 1999 for 1997/98 school year.

U.S. Department of Education FY 2000 Annual Plan, Volume 1 Page 32
Objective 1.3: Schools are strong, safe, disciplined, and drugfree.
Context: Schools must provide a safe and drug-free environment if students are to learn effectively.Drug and violence prevention plays a critical role in ensuring such environments. School modernizationalso contributes to strong, safe schools by creating safe environments that support learning.
The Department of Education (ED) is pursuing a variety of strategies, including efforts to identify,evaluate, and disseminate effective approaches, technical assistance to states and school districts, supportfor after-school programs and the hiring of staff to assist schools with programming.
ED is setting high standards to promote the use of effective strategies by grant recipients and is reportingon school safety information to encourage awareness and improved prevention efforts. In addition, EDcontinues to coordinate and collaborate with the efforts of other federal agencies. Finally, ED is proposinglegislative changes to improve the Safe and Drug-Free Schools program. Through all these means, EDsupports and encourages effective action at the federal, state, and local levels.
External factors: Drug use and violence involving young people are vast and complex problems affectedby a host of factors, only some of which are under schools’ control. These factors include societal andparental attitudes; peer pressure; activities of organized crime and gangs; individual, family, andcommunity risk and protective factors; advertising and other media images of drug use and violence; andgovernment efforts at the local, state, national, and international levels. In addition, these factors play outvery differently from one locale to another, making it more difficult for federal actions to respondeffectively to local needs. Moreover, it is more difficult to influence local policy and implementationthrough a formula grant program (like Safe and Drug-Free Schools state grants) than through adiscretionary program.
The success of ED’s efforts to improve implementation and outcomes for this objective depends on beingable to target resources to areas of greatest need with prevention strategies of high quality. ED has madeseveral legislative proposals to support these efforts in reauthorization.
Key strategies
n Principles of Effectiveness.§ To promote the Safe and Drug Free Schools program’s Principles of Effectiveness through
evaluations and technical assistance to ensure state and district use of effective preventionstrategies.
§ To monitor state implementation of the Principles of Effectiveness and to highlight states that areparticularly successful in implementing the Principles and providing technical assistance todistricts.
§ To utilize an Expert Review Panel to identify effective drug and violence prevention strategies.
n Targeted Grants. To continue to target $60 million in competitive grants (scheduled for FY 1999award) under the Safe and Drug-Free Schools National Programs through the “Safe Schools/HealthyStudents” program. This interagency effort, jointly funded by ED, the Department of Health andHuman Services (HHS), and the Department of Justice (DOJ), will assist schools and communities todevelop and implement comprehensive, community-wide strategies for creating safe and drug-freeschools and for promoting healthy childhood development, so that students can grow and thrivewithout resorting to violence or other destructive behaviors.

U.S. Department of Education FY 2000 Annual Plan, Volume 1 Page 33
n Coordinators. To implement a $50 million Safe and Drug-Free Schools initiative to support thehiring of program coordinators to serve middle schools throughout the nation. These coordinatorswill assess drug and violence problems, identify effective, research-based strategies to address thoseproblems, assist staff with program implementation, and build new links with community-basedprevention programs.
n Technical Assistance, Demonstration and Replication of Effective Elements and Programs§ To continue this activity, begun in 1998, to provide targeted technical assistance and training to
selected large urban districts in using their Safe and Drug-Free Schools funds effectively.§ To identify effective prevention strategies by continuing the multi-year demonstration program
begun in 1998 to evaluate, under rigorous methodological conditions, the most promising drugand violence prevention program and strategies in the country.
§ To replicate effective programs in additional schools and communities by continuing grants toimplement prevention programs that have already demonstrated sustained reductions in youthdrug use and violent behavior and that include a rigorous evaluation component.
n Safe and Drug-Free Schools Recognition Program. To identify and disseminate information aboutschools that are implementing exemplary drug and violence prevention approaches.
n Early Warning, Timely Response. To update ED’s Early Warning, Timely Response guide,designed to provide technical assistance to educators in preventing violent behavior by identifyingand providing help early to troubled students.
n Annual Report on School Safety. To collaborate with the Department of Justice to continue to issuethe Annual Report on School Safety to encourage public awareness of school safety issues and toencourage schools and communities to monitor safety and improve prevention strategies.
n Mentoring Initiative. With the Department of Health and Human Services (HHS), to implement amultiyear initiative to recruit and train adult mentors to help at-risk youth avoid drug use andviolence.
Selected AccomplishmentsPromoted the use of effective drug and violence prevention strategies bystates and districts by:• Establishing and promoting the Department’s Safe and Drug-Free Schools Program Principles
of Effectiveness based on research, to ensure that grantees use high-quality preventionapproaches;
• Establishing an Expert Review Panel to identify effective drug and violence preventionstrategies;
• Reestablishing the Safe and Drug-Free School Recognition Program to identify schools withexemplary prevention programs; and
• Awarding cooperative agreements to rigorously evaluate promising drug and violenceprevention strategies.
Promoted public awareness of school safety issues.• Encouraged schools and communities to monitor safety and improve prevention strategies by
issuing the 1998 Annual Report on School Safety (in collaboration with the Department ofJustice) and Early Warning, Timely Response: A Guide to Safe Schools (the guide includesissues related to students with disabilities).
Improved information on prevalence of students’ drug abuse andviolence.• Improved the capacity of states and districts to collect and analyze information on alcohol and
drug use and violent behavior by awarding grants to improve the quality of state data collectionsystems.

U.S. Department of Education FY 2000 Annual Plan, Volume 1 Page 34
n After-school Programs.§ To continue to expand the 21st Century Community Learning Centers program to provide 4,000
programs—serving about one million students—to keep schools open as safe havens and toprovide extended learning opportunities for the whole community. The Centers will work tostrengthen individual and community achievement while reducing individual and communityviolence and substance use.
§ To continue to partner with the C.S. Mott Foundation—which is making a five-year, $55 millionprivate donation to the 21st Century Community Learning Center program—to provide extensivetechnical assistance to the grantees through semiannual and annual conferences and regionaltraining centers.
n Changes in legislation or regulations being proposed with the FY 2000 budget in order tostrengthen the foregoing strategies. For example:§ Increased competition and improved targeting. SDFSCA state grants would target the 30 percent
of funds for highest need districts competitively based on district need and program quality, thusimproving the quality of how funds for these districts are used.
§ Project SERV. Under this proposed initiative, ED, in collaboration with DOJ, HHS, and theFederal Emergency Management Administration, will provide resources to districts andcommunities that experience a major crisis in a school to meet unanticipated needs such as crisiscounseling for students and staff.
§ State Capacity Grants. This initiative will award funds to states or multi-state consortia foractivities to enhance states’ capacity to support districts in implementing high-quality, research-based drug and violence prevention programs.
§ Alternative Education for Students Expelled from School. These funds would be used toestablish, expand, and improve model “alternatives to expulsion” programs that includeappropriate interventions and education to help students who violate the Gun-Free Schools Actbecome responsible, contributing members of society rather than leaving them unsupervised intheir communities.
Use of tax expenditures
Support school modernization to create a safe environment in which children can learn. Provide federaltax credits to approximate the interest on nearly $25 billion in school modernization bonds to construct orrenovate public school facilities. The National Clearinghouse for Educational Facilities collects,evaluates, and disseminates information on K-12 school planning, design, construction, finance, andmaintenance.
Coordination with other federal agencies
n Data. Continue to produce the Annual Report on School Safety, with the Department of Justice(DOJ); make maximum use of other agencies’ data, e.g., Department of Health and Human Services(HHS) [Monitoring the Future, National Institute on Drug Abuse (NIDA); Youth Risk BehaviorSurveillance System, Centers for Disease Control] and DOJ [National Crime Victimization Survey].
n Evaluation. Continue to cooperate on evaluation projects with DOJ [e.g., National Study on SchoolViolence, being conducted in cooperation with the National Institute for Justice-sponsored NationalStudy of Delinquency Prevention in Schools] and HHS [e.g., School Health Policies and Program’sStudy, for which ED is providing consultation].

U.S. Department of Education FY 2000 Annual Plan, Volume 1 Page 35
n Prevention activities. Continue to pursue joint projects to: prevent truancy and youth hate crimes[with DOJ's Office of Juvenile Justice and Delinquency Prevention (OJJDP)]; provide training andtechnical assistance to educators, communities, and states [with OJJDP, DOJ's Office for Victims ofCrimes, HHS's Center for Substance Abuse Prevention, HHS's Maternal and Child Health Bureau andNIDA], support the Secretary's Initiative on Youth Substance Abuse Prevention [with HHS'sSubstance Abuse and Mental Health Services Administration]; support initiatives to curb bingedrinking on college campuses [with NIAAA]; implement and evaluate drug and violence preventioninterventions for high-risk youth through grade 10 and their families [with HHS's National Institute ofMental Health]; and support the coordinating council on comprehensive school health [with HHS'sCenters for Disease Control].
Programs and funding supporting this objective
Grants for servicesn Safe and Drug-Free
Schools State Grantsprogram
n Safe and Drug-FreeSchools NationalPrograms
n Safe and Drug-FreeSchools Coordinators
n 21st Century CommunityLearning Centers
n Impact Aid
Statisticsn National Center for
Education Statistics
Development,dissemination, andtechnical assistancen Safe and Drug-Free
Schools NationalPrograms
n Comprehensive regionalassistance centers
Performance indicators and charts
ED is monitoring progress on this objective in terms of the national trends in student drug and alcoholuse, including in-school use, and attitudes toward drugs and alcohol as precursors to behavior, as well asnational trends in student victimization and violent incidents in schools. ED is also focusing on indicatorsof the quality of drug and violence prevention programs as a result of problems identified by evaluationsof the antecedent Drug-Free Schools and Communities Act.
Indicator 17. By 2000, reduce the prevalence of past-month use of illicit drugs andalcohol among youth by 20% as measured against the 1996 base year [Office ofNational Drug Control Policy (ONDCP) target]. Recent increasing rates of alcoholand drug use (alcohol, marijuana, and tobacco) among school-age children will slowand begin to fall by 2000.
Indicator background and context. This indicator provides a national context for the school-basedprevention efforts supported by ED. Although rates of student drug use have shown increases in recentyears, 1998 Monitoring the Future data indicate that use of alcohol and drugs have begun to level off.Figure 23 shows use of any illicit drug other than alcohol, while Figure 24 shows alcohol use, reported bystudents for the 30-day period prior to the survey.

U.S. Department of Education FY 2000 Annual Plan, Volume 1 Page 36
Figure 23 Figure 24
Limitations of the data: Based on student self-reports.Verification/validation of measures: Data will be obtained from rigorously designed and nationallyrepresentative independent data collections, such as Monitoring the Future (University ofMichigan/HHS).Data source(s). Monitoring the Future, 1991-1998; next update: annual.
Indicator 18. Rates of alcohol and drug use in schools will begin to fall by 2001.
Indicator background and context. The rates of use in schools (shown in Figure 25) parallel, but aremuch lower than, overall use rates (that is, use in any location). Overall annual 12th-grade use rates (notshown in a figure) for 1998: alcohol, 74%; marijuana, 38%. In 1998, the prevalence of marijuana inschool dropped below the targets projected for subsequent years. The targets have been changed toreflect this improvement.
Figure 25
Limitations of the data: Based on student self-reports. Figure 25 shows annual use rates, which are notcomparable with the 30-day rates shown in Figures 23 and 24.
30-Day Prevalence of Alcohol Use for 8th, 10th, and 12th Graders
2 5 % 2 6 % 2 4 % 2 6 % 2 5 % 2 6 % 2 5 % 2 3 % 2 3 % 2 1 %
4 3 %4 0 % 3 8 % 3 9 % 3 9 % 4 0 % 4 0 % 3 9 %
3 5 %3 2 %
5 4 %5 1 % 4 9 % 5 0 % 5 1 % 5 1 % 5 3 % 5 2 %
4 5 %4 1 %
0%
10%
20%
30%
40%
50%
60%
1991 1992 1993 1994 1995 1996 1997 1998 1999 2000
12th graders
10th graders
8th graders
Stud
ent
Alc
ohol
Use
Goals
Annual Prevalence of Drug and Alcohol Usein School for 12th Graders
7% 7% 7%
8%
9%
10% 10%
8%
5% 5%
6%
8%
7%
8% 8% 8% 8% 8%
7%
0%2%4%6%8%10%12%
1991 1992 1993 1994 1995 1996 1997 1998 1999 2000 2001
Per
cen
t u
sin
g S
ub
stan
ce a
t S
cho
ol
Marijuana
Alcohol
Goals
BelowTarget
30-Day Prevalence of Drug Use for 8th, 10th, and 12th Graders
6 % 7 % 8 %
1 1 % 1 2 %
1 5 %1 3 % 1 2 % 1 3 % 1 2 %
1 2 % 1 1 %
1 4 %
1 9 % 2 0 %
2 3 % 2 3 % 2 2 % 2 1 %1 9 %1 6 %
1 4 %
1 8 %
2 2 %2 4 % 2 5 % 2 6 % 2 6 %
2 3 %
2 0 %
0 %
5 %
1 0 %
1 5 %
2 0 %
2 5 %
3 0 %
1 9 9 1 1 9 9 2 1 9 9 3 1 9 9 4 1 9 9 5 1 9 9 6 1 9 9 7 1 9 9 8 1 9 9 9 2 0 0 0
12th graders
10th graders
8th graders
Stud
ent
Dru
g U
se
Goals

U.S. Department of Education FY 2000 Annual Plan, Volume 1 Page 37
Verification/validation of measures: Data will be obtained from rigorously designed and nationallyrepresentative independent data collections, such as Monitoring the Future (University ofMichigan/HHS).Data source(s). Monitoring the Future, 1991-1998; next update: annual.
Indicator 19. The number of criminal and violent incidents in schools by students willcontinually decrease between now and 2001.
Indicator background and context. Student-reported rates of victimization provide one measure ofschool safety; these rates may differ from incident reports provided by administrators. Although long-term trend data are not available, data for recent years suggest that student victimization rates arecurrently relatively stable.
Figure 26
Limitations of the data. Based on student self-reports. While the most recent data show the indicatormoving in the right direction, the change from 1993 to 1997 is not statistically significant (see Figure 26).Verification/validation of measures: Data are obtained from rigorously designed and nationallyrepresentative independent data collections, such as the Youth Risk Behavior Surveillance System (CDC).Data source(s). Youth Risk Behavior Surveillance System, 1993-1997. Data are collected biennially.
Indicator 20. By 1999, all school district participating in the Safe and Drug-FreeSchools program will use prevention programs based on the ED’s Principles ofEffectiveness.
Indicator background and context. ED has developed Principles of Effectiveness for the SDFSCAprogram to ensure that states and districts implement effective prevention approaches. The Principles tookeffect July 1, 1998, and apply to all SDFSCA grantees.
Limitations of the data. No data are currently available on the number of district implementing thePrinciples of Effectiveness. ED began collecting this information starting in FY 1998 through districtsurveys and state performance reports. An evaluation will examine the quality of implementation of thePrinciples during the first years they are in effect.Verification/validation of measures: Evaluation studies to examine the implementation of Principle ofEffectiveness sponsored by ED include rigorous methodologies, are conducted by an independentcontractor, and include technical working groups to provide independent consultation.
9th-12th Grade Students in a Physical Fight onSchool Property, 1993-1997
16% 16%15%
14%
12%
0%
5%
10%
15%
20%
1 9 9 3 1 9 9 5 1 9 9 7 1 9 9 9 2 0 0 1
Per
cen
t o
f st
ud
ents
in p
hys
ical
fig
ht
GOALS

U.S. Department of Education FY 2000 Annual Plan, Volume 1 Page 38
Data source(s). Study of Local Education Agency Activities (data available 1999).
Indicator 21. By 1999, all states will conduct periodic statewide surveys or collectstatewide data on alcohol and drug use of students and incidents of crime and violencein schools.
Indicator background and context. Because drug and alcohol use and violence involving youth varyfrom one locale to another, state-level data provide the public, policymakers, and program planners withimportant information about existing needs and the effectiveness of prevention approaches.
Figure 27
Limitations of the data. Figure 27 is based on a review of state performance reports for 1996-97. Statesthat were able to furnish data that responded to any of the questions posed in the reporting form related todata about incidence prevalence of drug use and violence were counted, although not all states couldfurnish all of the data requested. An additional review is being conducted to determine the number ofstates that reported information on all critical items.Verification/validation of measures: An evaluation will examine State procedures for collectingStatewide data against criteria of data quality.Data source(s). Internal review of program files.
Indicator 22. The percentage of teachers who are trained to deal with disciplineproblems in the classroom will increase significantly by 2000.
Indicator background and context. Relatively minor school discipline problems can escalate into moreserious incidents. Teachers who are trained to deal with discipline effectively can help prevent schoolviolence. See data source for first year of data availability.
Limitations of the data: Will be based on teacher self-reports.Verification/validation of measures: No validation measures are planned at this time.Data source(s). An item is being added to the Schools and Staffing Survey that asks whether teachershave received training on student discipline and classroom management. Baseline data will be availableconcerning school year 1999-2000.
States Reporting StatewideData on Student Drug/Alcohol
Use and School Violence/Crime
Drug & Alcohol Use
48 50
44
50
0
10
20
30
40
50
60
1997 1999
Violence & Crime
GOAL

U.S. Department of Education FY 2000 Annual Plan, Volume 1 Page 39
Objective 1.4: A talented and dedicated teacher is in everyclassroom in America.
Context: Teachers’ knowledge and skill make a crucial difference in what students learn. However, only36 percent of teachers of the core academic subjects feel very well prepared to implement state or districtstandards in their classrooms. Recent research has also demonstrated that teacher quality is a strongpredictor of student success. The U.S. Department of Education (ED) addresses this objective through sixsets of strategies: (1) improving teacher recruitment, preparation, and retention of new teachers; (2)supporting rigorous standards for new and experienced teachers; (3) strengthening professionaldevelopment; (4) conducting research and disseminating information on teacher quality andaccountability; (5) strengthening school leadership; and (6) building public awareness of the issues ofquality as they apply to the teacher workforce.
External factors: Over 2 million teachers will need to be hired over the next decade because of normalturnover, increases in enrollment, and the retirement of veteran teachers. The pressure to hire largenumbers of new teachers will make it difficult for states and districts to maintain their current standardsfor initial teacher certification, and will work against states’ efforts to elevate those standards.
In addition, the strong economy and low unemployment rates mean that many teachers and teachercandidates can easily find higher-paying career opportunities outside education. As more highly skilledpeople are drawn to higher-pay fields, education may be attracting many workers with relatively weakacademic skills. For example, in Massachusetts, 59 percent of prospective teachers recently failed thenew test for initial teacher certification. Although questions remain about the rigor and validity of thetest, the high failure rate may indicate the low skills of many students who hope to become teachers and agap between the content and rigor of the teacher preparation programs and the knowledge and skillsexpected of new teachers.
Key strategies
The Department’s proposal for the reauthorization of the Elementary and Secondary Education Act(ESEA) will include a program to “get standards into the classroom” by supporting high-quality,standards-based professional development for teachers. The proposal will also include a set-aside forprofessional development under Title I. Finally, the proposal will require states to report on a key set ofaccountability measures that will demonstrate improvements in the quality of the teaching force.
n Improve teacher recruitment, preparation of future teachers, and retention of new teachers.§ ED will implement the three new Teacher Quality Enhancement Grant programs in Title II of the
HEA in order to bring about fundamental improvements in teacher education at institutions ofhigher education, comprehensive teacher quality reforms at the state level, and new strategies forreducing shortages of qualified teachers in high-need areas. The Administration is requesting$115 million for this program in FY 2000.
§ ED will help create a National Job Bank to provide teachers with information on teachingvacancies in states and school districts nationwide and link prospective employers to a pool ofpotential new hires.
§ ED will implement the new $75 million Teacher Training in Technology program in order tobuild capacity at teacher preparation institutions to prepare tomorrow’s teachers to integratetechnology effectively into curriculum and instruction.

U.S. Department of Education FY 2000 Annual Plan, Volume 1 Page 40
§ ED is requesting funding for a national awards program for teacher preparation programs that areproducing elementary teachers and secondary math teachers who have outstanding contentknowledge and pedagogical skills. The awards program will be open to all kinds of programs –traditional pre-service programs as well as innovative, alternative certification programs. Impacton student achievement will be a major criterion for determining awards.
§ The FY 2000 budget includes $1.4 billion in mandatory funds to continue a Class-Size ReductionInitiative that by 2005 would recruit and train 100,000 new teachers in order to help reduce classsizes in grades 1-3 to a nationwide average of 18.
§ The Special Education Personnel Preparation program will focus on supporting and disseminatingresearch-validated programs for preparing teachers of children with disabilities.
Selected AccomplishmentsNew programs funded in the Higher Education Act• In FY 1999, the Congress appropriated $75 million for Teacher Quality Enhancement Grants
in Title II of the HEA, based on the Administration’s proposal, focused on improvingrecruitment, preparation, licensing, and ongoing support of teachers. This is the first majorfederal investment in pre-service teacher education in 30 years.
National Board for Professional Teaching standards has substantialimpact• By November 1998, the number of National Board-certified teachers about doubled from the
past year to 1,835 but the impact of the work of the NBPTS goes far beyond the number ofBoard-certified teachers. Many teachers consider the process to be the best professionaldevelopment experience they have ever had. In addition, 63 teacher training programs aretaking steps to restructure their curriculum or program structure based on the NBPTSstandards. Standards have been completed in 21 of the 25 areas, and certification packagescompleted and available in 12 areas, which cover 62% of teachers.
Professional development program adopts results-based reporting• States and districts that receive Eisenhower funds are now required to develop performance
objectives and indicators that reflect their own reform efforts, while remaining consistent withthe key elements in the national program objectives and indicators. This reporting system isoutcome-oriented and tied to standards-based professional development. Preliminary reviewsof the 1998 state reports reveal that states are moving toward reaching these objectives.
National awards program for model professional development• ED conducted the second round of awards for exemplary professional development tied to
increases in student achievement. The awards program is helping to change the conversationin schools about professional development. The program’s evaluation has become a self-evaluation instrument for schools and districts. ED, its regional labs, and the National StaffDevelopment Council feature past winners, and each award winner reports having beencontacted for information by over 100 schools and districts. ED receives numerous requestsfor applications and technical assistance—evidence of a groundswell of interest in the field.
Coordination within the Department• The Teacher Initiative has focused on improving coordination across Principle Offices and the
seven priorities. The coordination has brought about two new collaborative efforts: launchingof a new teacher preparation awards program and a faculty enhancement initiative for teachereducation.
Awareness of the importance of teacher quality grows• Partly as a result of the Department’s outreach efforts, teacher quality is becoming one of the
most important issues at the local, state, and national levels. The Chief State School Officersand the Education Commission of the states have made teacher quality their top issues. TheState of American Education speech by the Secretary in February of 1999 highlighted teacherquality as a dominant theme.

U.S. Department of Education FY 2000 Annual Plan, Volume 1 Page 41
§ The budget includes $18 million for the continuation and expansion of the Troops to Teachersprogram to recruit and prepare transitioning military personnel and other professionals asteachers.
§ The budget includes a request for $10 million for an American Indian Teacher Corps that willprovide training support over five years, to 1,000 Alaskan Natives and Native Americans who arecommitted to teaching in schools with high concentrations of Native American children.
n Develop and support rigorous standards for teachers.§ Provide ongoing support for the National Board for Professional Teaching Standards (NBPTS)
and the Interstate New Teacher Assessment and Support Consortium (INTASC). The NBPTSestablishes rigorous standards and assessments for certifying accomplished teachers. INTASC, aprogram of the Council of Chief State School Officers, is a consortium of state educationalagencies, higher education institutions, and national educational organizations dedicated toreform in education, licensing, and ongoing professional development of teachers.
§ ED will support a study by the National Academy of Sciences that will analyze the current stateof teacher testing, recommend ways to improve existing tests, and suggest viable alternatives.
n Strengthen professional development.§ ED will embed its Mission and Principles of High-Quality Professional Development in all
appropriate legislation and disseminate information on effective policies and practices to thefield.
§ Through the National Awards Program for Model Professional Development, ED will promoteresults-oriented professional development that focuses on improving student achievement. Incollaboration with the National Staff Development Council, ED will aggressively disseminate thePrinciples of High-Quality Professional Development and summaries of award-winningprofessional development programs through targeted mailings and conferences such as the annualImproving America’s Schools conference.
§ The $335 million request for Eisenhower Professional Development State Grants would supportintensive, high-quality professional development aimed at ensuring that all teachers have theexpertise needed to prepare their students to meet high standards.
§ The $75 million request for Bilingual Education Professional Development, a 50 percent increase,would help meet the critical need for fully certified bilingual education and ESL teachers.
§ The Department of Education is requesting an increase of $10 million for the State Improvementprogram, which is designed to assist states in addressing their needs for personnel to improveoutcomes for children with disabilities.
§ The Technology Literacy Challenge Fund ($450 million) will help States and local districts toprovide educators with sustained, high-quality training in the effective use of educationaltechnology.
n Support research, development, and dissemination of information on teacher quality andaccountability.§ Implement the accountability requirements outlined in Title II of the Higher Education
Amendments (HEA) of 1998 by collecting data on the quality of the teaching force from allstates and institutions of higher education that receive HEA funds. Report to Congress on datatrends and findings.

U.S. Department of Education FY 2000 Annual Plan, Volume 1 Page 42
§ New, collaborative research projects between OERI, NSF, and NICHD will focus on improvingthe content and pedagogical skills for reading, math, and science teachers.
n Strengthened school leadership. One component of ED’s proposal for the reauthorization of theElementary and Secondary Education Act will focus on improving school leadership.
n Public awareness. Issue the second biennial national report card on teacher quality by January 2000.
Coordination with other organizations and federal agencies and withinED
n National Science Foundation. ED is coordinating with the National Science Foundation (NSF) toimplement the ED-NSF Action Strategy to improve mathematics instruction and achievement. ED isrequesting $6.7 million in new funding for Eisenhower Professional Development Federal Activitiesto examine what teachers need to know and be able to do to improve student achievement in math,and that professional development is needed to bring teachers to that level.
n National Staff Development Council (NSDC). ED is also coordinating with the National StaffDevelopment Council (NSDC) in the dissemination of information about the lessons from the award-winning sites under ED’s National Awards Program for High-Quality Professional Development.
n Coordination within ED. ED’s cross-office Professional Development Team will continue toimprove the coordination of ED’s programs that support professional development by sharinginformation and strategies across programs and by sponsoring training opportunities on teacherprofessional development for ED staff. In addition, the Professional Development Team iscoordinating with the Department’s Math and Reading Initiatives to develop an awards program foroutstanding teacher training programs in reading and math. The Professional Development Team isalso working with those initiatives in order to develop a program to support professional developmentopportunities for higher education faculty who work in teacher training programs.

U.S. Department of Education FY 2000 Annual Plan, Volume 1 Page 43
Programs supporting this objectivePrograms solely for teacher training orprofessional developmentn Eisenhower Professional Development State
Grantsn HEA Title II: Teacher Quality Grantsn Teacher Training in Technologyn IDEA Personnel Preparationn Telecommunications Demonstration Project for
Mathematicsn National Writing Projectn Bilingual Education Professional Developmentn Indian Education Professional Development
Programs for technical assistance and/orresearchn Eisenhower Professional Development Federal
Activities Programn Eisenhower Regional Consortian Regional Educational Laboratories
n National Education Research Institutesn Comprehensive Regional Assistance Centersn Statistics and Assessment
Programs for instructional services andprofessional developmentn Title I grants to local educational agenciesn Technology Literacy Challenge Fundn IDEA State Improvement Grantsn IDEA State Grants (B,C)n Bilingual Educationn Goals 2000n Class Size Reductionn Educational Opportunity Zonesn Reading Excellence Actn Star Schoolsn Javits Gifted and Talented Educationn Technology Innovation Challenge Grants
Performance indicators and chartsThe six performance indicators in the Strategic Plan for objective 1.4 focus on key outcomes regardingthe quality of the teaching force and the policies that affect the teaching force.
Indicator 23. The percentage of teachers who feel very well prepared to implementnew, higher standards will increase annually.
Indicator background and context. According to the 1996 Public School Survey on Education Reform(Fast Response Survey 54, National Center for Education Statistics), 35 percent of teachers reported thatthey felt very well equipped to set or apply new, higher standards in their classrooms (see Figure 28). By1998, the percentage of teachers who felt confident about implementing standards had not grownsignificantly: In the 1998 NCES Fast Response Survey (FRS) of teachers, only 36 percent said that theyfelt very well prepared to implement state or district curriculum and performance standards.

U.S. Department of Education FY 2000 Annual Plan, Volume 1 Page 44
Figure 28
Limitations of the data. Indicator is based on teacher self-reported data. However, research has foundteachers answers to correspond closely with independent classroom validations.Verification/validation of measures. The 1998 National Longitudinal Survey of Schools (NLSS)includes a survey of teachers that asks about their preparation to implement standards.Data source(s). FRS, 1996; FRS, 1998. Data will be available from the NLSS in late 1999.
Indicator 24. By 2002, 75% of states will align initial teacher certification standardswith high content and student performance standards.
Indicator background and context. Currently, about 32 states are working to raise initial teachercertification standards through the Interstate New Teacher Assessment and Support Consortium(INTASC) -- a consortium of state educational agencies, higher education institutions, and nationaleducational organizations developing model standards and assessments for beginning teachers.
Limitations of the data. In addition to knowing the percentage of states that align their initial teachercertification standards to student content and performance standards, it will also be important to track thepercentage of new teacher candidates who are able to pass new initial certification tests.Verification/validation of measures. No independent study currently exists on the quality or alignmentof initial teacher certification standards.Data source(s). Interstate New Teacher Assessment and Support Consortium. Through the upcomingevaluation of Title II (Teacher Quality) of the Higher Education Amendments of 1998, ED will sponsoran independent, expert review of states’ standards for initial teacher certification.
Indicator 25. Throughout the nation the percentage of secondary school teachers whohave at least a minor in the subject they teach will increase annually.
Indicator background and context. Between 1994 and 1998, the percentage of secondaryEnglish/language arts and science teachers with an undergraduate or graduate major or minor increased(FRS, 1998).
Percentage of Teachers who “Feel Very Well Preparedto Implement New, Higher Standards”
35% 36%50%
0%
20%
40%
60%
80%
100%
1996 1998 2000
Per
cen
tag
e o
f T
each
ers
Goal
“New,higher
standards”
“State/district
standards”
“New,higher
standards”or “state/
districtstandards”

U.S. Department of Education FY 2000 Annual Plan, Volume 1 Page 45
Figure 29
Limitations of the data. Some teachers report that although they may not have a major or minor in theirmain teaching field, their schools or districts require them to take additional courses in their mainteaching fields. Thus, in some cases, teachers who do not have a major or minor in their subjects may beadequately prepared to teach in those subject fields.Verification/validation of measures. NCES will conduct an extensive review of all FRS and SASS datain order to ensure data quality in 1999-2000.Data source(s). SASS, 1994; FRSS, 1998. In 1999-2000, ED will conduct the next Schools and StaffingSurvey (SASS) and will thus obtain updated data for teachers of all academic subjects.
Indicator 26. Increasing percentages of teachers will have weekly, common planningperiods or weekly collaborative meetings with other teachers in order to improvecurriculum, teacher knowledge, teaching skills, and student performance.
Indicator background and context. Teachers often report that working collaboratively improves thequality of their teaching. In 1998, 60 percent of elementary and secondary classroom teachers of the coreacademic subjects had weekly common planning periods with other teachers, and 34 percent of suchteachers had weekly collaborative meetings with other teachers (FRS, 1998).
78% 82%86% 88%
0%
20%
40%
60%
80%
100%
1993-94
1998
Percentage of Public School English and Science Teachersof Grades 7 Through 12 Who Have a Major or Minor
in Their Main Teaching Assignment F ield
English/LanguageArts
Science
Percentage of Teachers

U.S. Department of Education FY 2000 Annual Plan, Volume 1 Page 46
Figure 30
Limitations of the data. The main source of data for this indicator will come from large-scale surveyssuch as the Fast Response Survey of teachers; this kind of survey will not provide in-depth data on thequality and productivity of this collaborative time. Other research sponsored by ED and independentorganizations will need to provide this in-depth, qualitative information.Verification/validation of measures. The National Center for Education Statistics (NCES) willextensively review the data from the FRS and SASS in order to ensure data quality.Data source(s). The 1998 Fast Response Survey (FRS) of teachers and the 1999-2000 Schools andStaffing Survey will be the data sources for this indicator.
Indicator 27. Increasing percentages of teachers will participate in a formal, high-quality induction program during their first year of teaching.
According to the 1998 NCES Fast Response Survey (FRS) of teachers, higher percentages of newerteachers report that they participated in a formal induction program during their first year of teaching thando teachers with many years of experience (see Figure 31). These data imply that induction programshave become more common in recent years. Although this may be the case, we do not know if theinduction programs are of high-quality because teachers in the SASS and FRS samples were not askedquestions about the nature and intensity of the program. Research indicates that year-long supports, suchas common planning time with other teachers, sessions with a mentor teacher, or regular communicationswith the principal or other staff, are features of high-quality, induction programs. In the 1999-2000SASS, NCES will collect data on the percentage of teachers that participate in induction programs withthese important features.
Percentage of Teachers with Weekly Common Planning Periods orCollaborative Meetings on Instruction and Student Performance
60% 64% 68% 72%
34% 36% 38% 40%
0%
20%
40%
60%
80%
100%
1998 2000 2002 2004
Per
cen
tag
e o
f T
each
ers
Common Planning Period Regular Collaborative Meeting
Actual Projected

U.S. Department of Education FY 2000 Annual Plan, Volume 1 Page 47
Figure 31
Verification/validation of measures. The National Center for Education Statistics (NCES) willextensively review the data from the next SASS (1999-2000).Data source(s). The next update will be from the 1999-2000 SASS.
Indicator 28. The number of nationally board certified teachers will increaseannually.
Indicator background and context. The National Board for Professional Teaching Standards (NBPTS)establishes rigorous standards and assessments for certifying accomplished teaching. There are currently1,835 nationally board-certified teachers, and the goal is to increase the number of such teachers annually(see Figure 32).
By the end of 2000, the Board will offer assessment packages and certificates in 16 teaching fields. Whenassessments and certificates in 16 fields are available, approximately 82 percent of the teaching workforcewill have access to National Board certification. When a total of 25 certificates are available in 2002, 95percent of the teaching population will have access to National Board certification.
0%
20%
40%
60%
80%
100%P
erce
nta
ge
of
Tea
cher
s
All Teachers Teachers with lessthan 4 years of
experience
Teachers with 20+years of experience
34%
65%
14%
Percentage of Teachers Who Participated in an InductionProgram During Their First Year of Teaching (1998)

U.S. Department of Education FY 2000 Annual Plan, Volume 1 Page 48
Figure 32
Limitations of the data. Although the indicator on the number of Board certified teachers is important, itdoes not fully capture the impact of the NBPTS. For example, the work of the Board has influenced thedevelopment of teacher standards in states and districts and is currently bringing about changes incurriculum or program structure at 63 teacher training programs across 28 states.Verification/validation of measures.Data Source. National Board for Professional Teaching Standards (NBPTS).
Number of Nationally Board-Certified Teachers willIncrease Annually
1835
0
5,000
10,000
15,000
20,000
25,000
1998 1999 2000 2001 2002
èè èè Continuously Increase èè
èè

U.S. Department of Education FY 2000 Annual Plan, Volume 1 Page 49
Objective 1.5: Families and communities are fully involvedwith schools and school improvement efforts.
Context: Family involvement in their children’s learning is a greater predictor of academic achievementthan socioeconomic status or parents’ educational level. As such, getting families and communitymembers involved in children’s learning can be a powerful force for school improvement efforts. To helpall children achieve to high standards and to improve schools, the U.S. Department of Education (ED)initiated a unique private-public partnership in 1994, known as the Partnership for Family Involvement inEducation. The Partnership and its over 4,200 members focus on specific national activities—AmericaGoes Back to School, The America Reads Challenge, Think College Early, and 21st Century CommunityLearning Centers. In addition, parental and community involvement is promoted through the ED’sprograms—Title I, Even Start, special education, bilingual education, migrant education, postsecondaryeducation, and Goals 2000.
External factors: Family involvement is ultimately determined by the actions of parents and theirchildren in their home. Through assisting schools, community organizations, employers and religiousorganizations by holding conferences and providing information on best practices, the Department canhelp support families in their efforts to help their children learn.
Key strategies
n Financial support for federal programs that support families in helping their children learn.§ Support the start-up or expansion of 6,000 additional 21st Century Community Learning Centers
that would provide extended learning services to 1.1 million students in total ($600 million in FY2000).
§ Support state projects and local college-school partnerships under GEAR UP ($240 million).§ Continue family literacy programs through Even Start ($145 million).§ Support Goals 2000 Parent Information and Resource Centers that exist in every state and
territory ($30 million).§ Increase support for IDEA parent information centers for families of children with disabilities
($22.5 million).
n Partnership for Family Involvement in Education (PFIE).§ Involve local Partners in PFIE’s four lead initiatives: 21st Century Community Learning Centers
or the After-School Initiative, the America Reads Challenge/READ*WRITE*NOW, AmericaGoes Back to School, and Think College Early.
§ Continue to seek out new partners through outreach efforts that promote family-school-community partnerships.
§ Work with member organizations from education, business, community groups, and faithcommunities to build local coalitions and to further their own family involvement activities.
§ Hold religion and education summits across the nation to promote family involvement activities.§ Work with representatives from program offices across ED to leverage partners to increase
participation in the four lead initiatives, and use these four initiatives to gain additional partners.§ Promote greater student involvement in PFIE efforts.

U.S. Department of Education FY 2000 Annual Plan, Volume 1 Page 50
n Outreach and technical assistance.§ Coordinate federal program assistance and training materials for family involvement in children’s
learning by connecting parent provisions in Title I and other programs for at-risk students such asComprehensive Regional Assistance Centers, Goals 2000 Parent Information and ResourceCenters, and Civil Rights outreach activities.
§ Support parents of children with disabilities through IDEA technical assistance and disseminationand parent information centers.
§ Increase use of Web site information dissemination by expanding resources on the PFIE webpage to include additional publications, training materials, evaluation templates, guides toeffective practices, examples of model programs, and other resources that can strengthenpartners’ networking capacities.
§ Increase outreach to Hispanic families through local PFIE summits and other sign-on activities.
Selected AccomplishmentsStrengthened family involvement in federal programs§ Partnership efforts have contributed to the drafting and adopting of legislation that incorporates
family and community involvement components, including the Reading Excellence Act,GEAR UP for College, and 21st Century Community Learning Centers.
§ Developed a coordinated outreach of the Title I “Compact for Reading” (a template forbuilding effective school-parent-community partnerships) the Comprehensive TechnicalAssistance Centers
§ Expanded Parent Information and Resource Centers to include at least one center in everyState.
§ Supported parents of children with disabilities through IDEA technical assistance anddissemination and parent information centers.
Implemented regional strategies§ Increased outreach to Hispanic families through seven local PFIE summits and other activities
at the regional and local levels, in collaboration with the White House Initiative on Excellencein Education for Hispanic Americans. More than 1,300 local family, community, education,employer, and religious leaders participated.
Expanded outreach and technical assistance§ Through a new public-private after-school partnership, the Charles Stewart Mott Foundation,
has pledged $55 million over five years to provide technical assistance, training, and publicoutreach to support high-quality extended learning opportunities.
§ The number of partner organizations in the Partnership for Family Involvement in Educationgrew by more than 1,300 with membership now totaling more than 4,800 family, school,community, employer, and religious organizations.
§ In a customer satisfaction survey of Partner organizations more than 80% of respondents saidthat they had benefited from their involvement in the Partnership for Family Involvement inEducation and a majority reported that their level of activity had increased since signing on
§ The Partnership collaborated with major national business conferences, The Conference Boardand Working Mother magazine’s annual CEO Summit, to highlight the efforts of employers tostrengthen employee involvement in education and build business-education partnerships thatsupport systemic reform in local schools.
§ Provided information, technical expertise, and other assistance to enable families andcommunities to become involved in children’s learning through printed matter, civil rightstechnical assistance, and the Internet.
§ Partnership outreach efforts have resulted in the significant redesign of the Partnership's Website with support from USA Today and linked to its main news site, which receives 75 millionhits daily. Community Update, with information about Partnership activities, now circulatestoo more than 275,000 subscribers.
§ Partners developed a CD ROM, “Preparing Teachers to Involve Families,” as a preservice andprofessional development tool. Launched at the 1999 American Federation of TeachersMidwinter conference, the kit is being used by educator, school and familyorganizations with their own members for use to train their members.

U.S. Department of Education FY 2000 Annual Plan, Volume 1 Page 51
n Research§ Develop and implement a long-range applied research agenda to strengthen family involvement
in children’s learning.§ Annually evaluate the performance of the Partnership for Family Involvement in Education.§ Undertake recognition activities that identify and publicize effective Partnership activities.§ Provide evaluation guidance for family-school partnerships to help students learn in such areas as
after-school programs and early college awareness.
Coordination with other federal agencies
n White House§ Work with the White House Cabinet Affairs office to successfully implement the Partnership’s
national initiative, America Goes Back to School, through participation of every federal agency.§ Participate in White House activities promoting their Strong Families, Strong Communities
initiative in such areas as fatherhood, family involvement in education, and Family Reunions.
n Health and Human Services, Housing and Urban Development, Department of Agriculture,Department of Justice. Work through the National Performance Review with the Departments ofHealth and Human Services, Housing and Urban Development, Agriculture, Justice, Corporation forNational Service, and many others on coordinating efforts that make the most of young people’s out-of-school time.
n Corporation for National Service. In partnership with the Corporation for National Service, 65 pilotsites were established throughout the country which were linked to the PFIE Partners and theCoalition for the America Reads Challenge. Materials were developed jointly, Web sites were linked,and College Work-Study students used.
n Other organizations. PFIE continues to obtain input and support from numerous public and privateorganizations, such as the National Middle School Association, the College Board, and Boy Scouts ofAmerica (Learning for Life), in designing and implementing the Early Awareness Informationprogram, ED-National Science Foundation (NSF) national mathematics public engagement campaign,and High Hopes program.
Programs and funding supporting this objective
Direct service to parentsn Goals 2000 Parental Assistancen IDEA Parent Information Centers (Part D)n IDEA Technical Assistance and
Dissemination (Part D)n IDEA Infants and Families (Part C)n Even Startn Bilingual Educationn Ready to Learn Televisionn 21st Century Community Learning Centers
Readingn Inexpensive Book Distributionn Ready to Learn Television
Information on collegen TRIO programsn GEAR UPn 21st Century Community Learning Centersn Preparing for College (proposed)
Family-school partnership buildingn Title I Grants to LEAsn IDEA State Grants (Part B)n Migrant Educationn Safe and Drug-Free Schoolsn Comprehensive Regional Assistance Centersn Regional Educational Laboratoriesn 21st Century Community Learning Centers

U.S. Department of Education FY 2000 Annual Plan, Volume 1 Page 52
n Comprehensive Regional Assistance Centersn Regional Educational Laboratoriesn Reading Excellence Actn 21st Century Community Learning Centers
After-schooln 21st Century Community Learning Centersn Title I Grants to LEAsn IDEA State Grants (Part B)n Regional Educational Laboratories
Performance indicators and charts
Performance indicators for objective 1.5 focus on measuring family involvement in education from thevantage points of the parent and the child.
Indicator 29. The percentage of elementary school students who come to schoolprepared for learning and having completed their homework, as rated by theirteachers, will increase substantially over the next five years, especially among childrenfrom low-income families.
Indicator background and context. According to teachers, the number of parents who do notadequately monitor their children to see that they regularly complete their homework has increased in thelast decade.
Figure 33
Limitations of the data. This is an interim indicator obtained from a nationally representative survey ofteachers. Teachers were asked their views on parent homework supervision, an important factor indetermining whether students’ complete their homework.Verification/validation of measures. The Metropolitan Life survey was conducted by Louis Harris andAssociates and subject to rigorous statistical quality controls.Data source(s). The American Teacher 1998, Metropolitan Life. A 1999 survey will ask teachers directlyabout homework completion in the elementary grades.
61%
68%
0%
20%
40%
60%
80%
100%
1987 1997
Most/Many
Percentage of Teachers who Report thatMost or Many Parents Neglect to See that
Homework Gets Done

U.S. Department of Education FY 2000 Annual Plan, Volume 1 Page 53
Indicator 30. The percentage of parents who meet with teachers about their children’slearning will show improvement and the gap in participation in parent-teacherconferences between high- and low-poverty schools will close.
Indicator background and context. Although parent teacher conferences are one important way inwhich parents can work with teachers to support their children’s learning, rates of attendance vary greatlyamong schools. Parents in high-poverty schools are only about half as likely to regularly attend suchconferences as parents in schools serving higher income families (see Figure 34).
Figure 34
Limitations of the data The classification of “most or all” parents attending is possibly subject todiffering interpretations across school respondents.Verification/validation of measures. The NCES survey is subject to strict statistical controls.Data source(s). Parent Involvement in Children’s Education: Efforts by Public Elementary SchoolsNational Center for Education Statistics, Fast Response Survey, 1998.
Indicator 31. The percentage of parents who say that the school actively encouragesand facilitates family involvement will show improvement.
Indicator background and context. Although parents overwhelmingly say that schools treat them asimportant partner, schools do not necessarily involve families in a true partnership that supportschildren’s learning through shared responsibilities (see Figure 35). In 1997, 79 percent of parents saidthey want to learn more about how to help their children in school. A high percentage of parents,especially minority parents, report a willingness to participate in a compact, yet few parents report thatthey have had the opportunity to do so. In 1997, about one-third of parents reported having signed anagreement for learning at school or at home, an increase from one-fifth in 1994.
Percentage of K-8 schools that indicated "most or all" parents typically attended parent-teacher
conferences, by school poverty
76%
58%
39%
0%10%20%30%40%50%60%70%80%
Under 25% 25%-49% 50% or more
% eligible for free or reduced price lunch

U.S. Department of Education FY 2000 Annual Plan, Volume 1 Page 54
Figure 35
Limitations of the data. Cultural and language barriers between schools and family members may limitopportunities for full parental involvement.Verification/validation of measures. No verification measures at this time.Data source(s). GTE commissioned Survey conducted by NORC, 1997.Next update: 1999.
Indicator 32. By 2002, the number of children participating in after-school programswill double, from 1.7 million to 3.4 million children.
Indicator background and context. High-quality after-school programs with goal setting, low staff-student ratios, strong family involvement, and linkage with schoolteachers help ensure children’scontinuous growth, development, and learning through the preadolescent and adolescent school years(Safe and Smart, 1998). While a number of communities are already developing such after-schoolprograms, they are not widespread, particularly in the public schools. In 1998, there were 28 millionschool-aged children with parents in the workforce. But as recently as the 1993-94 school year, 70 percentof all public elementary schools did not have a before- or after-school program (see Figure 36). Inaddition, the majority of extended-day programs are aimed at kindergarten and early elementary schoolstudents, and focus on supervised care rather than academic instruction.
Percent of parents who say the school treats themas important partners in children’s learning
85%
91%
91%
85%
90%
84%
93%
89%
0% 20% 40% 60% 80% 100%
Urban
Rural
White
Non-White
Lower income
Middle income
Higher income
All parents
GTE Survey

U.S. Department of Education FY 2000 Annual Plan, Volume 1 Page 55
Figure 36
Limitations of the data. No limitations of data.Verification/validation of measures. The last major study of after-school programs used 1991 data. Datafrom the 1993-94 Schools and Staffing Survey were used by NCES to determine school-based after-school programs in 1996.Data source(s). Seppanen, P., Love, J., deVries, D. And Bernstein, L. (1993). National Study of Before-and After-School Programs. Washington, D.C.: U.S. Department of Education; NCES 1996.
23%
32%35%
16%
25%
30%
17%
24%
30%
0%
20%
40%
60%
80%
100%
1987-88 1990-91 1993-94
Percentage of Public Elementary Schools Offering Extended Day
Schools w/ highminority enrollment
All public schools
High-poverty schools

U.S. Department of Education FY 2000 Annual Plan, Volume 1 Page 56
Objective 1.6: Greater public school choice will be availableto students and families.
Context: Research suggests that public school choice fosters a sense of ownership among school staff,students, and parents, which promotes successful efforts toward common goals. Public school choice canencourage greater flexibility in school offerings to address the needs of students, families, andcommunities, while maintaining accountability for students meeting challenging state standards ofperformance.
According to a 1993 survey of parents, approximately 12 percent of all U.S. students in grades 3-12attended a public school that their families chose. Public school choice operates through a variety ofmechanisms, including charter schools, magnet schools, open enrollment policies, and postsecondaryoptions.
The Department of Education (ED) has promoted choice in public education primarily by supporting newor significantly expanded charter schools and magnet schools through ED’s Public Charter SchoolsProgram (PCSP) and Magnet School Assistance Program (MSAP), respectively.
Most of these public school choice programs are designed to expand educational opportunities, heightenparental engagement, and be used as tools for school reform -- all strong forces behind improvedacademic outcomes for all students. Specifically, the PCSP provides start-up funds for charter schools andfor evaluating the effects of the charter school on other schools and students. The MSAP provides fundsto help school districts establish new magnet schools. The purpose of these magnet schools is to reduceminority group isolation and promote diversity by creating programs that attract students from differentbackgrounds.
External factors: The extent to which public school choice is made available to students and families isconsiderably influenced by state and local decision-making. For example, 18 states, and districts in 11other states, permit open enrollment (i.e., allowing students to attend public schools other than theirassigned school).
Key strategies
n Financial support for public schools of choice.§ Support the planning and start-up costs of up to 2,200 charter schools (serving about 300,000
students) through the FY 2000 request for $130 million for the Public Charter Schools Program.§ Support magnet school projects in 57 school districts (with an average of 7 or 8 magnet schools
per district) through the $114 million request for the Magnet Schools Assistance Program.
n High-quality and timely technical assistance and outreach.§ Hold annual national charter schools conferences to promote cross-fertilization of knowledge and
experience about charter school practitioners and researchers. Participants in similar conferencesprovided very positive feedback on the usefulness of conference sessions to their jobs.
§ Encourage interest and understanding of charter schools by conducting informational andoutreach meetings in states with new charter school laws.
§ Provide ongoing technical assistance to magnet schools and charter schools through the EquityAssistance Centers and the Comprehensive Regional Assistance Centers.
§ Provide assistance to entities that grant charters in developing accountability plans, reviewingcharter applications, and administering high-quality programs.

U.S. Department of Education FY 2000 Annual Plan, Volume 1 Page 57
§ Monitor recipients of Public Charter School Program funds to determine whether they arefollowing the terms and conditions of the grant award.
§ Develop new leaders for charter schools by conducting outreach and training workshops throughthe Department of Education’s regional education labs.
§ Increase networking among charter schools through the continually updated and improved charterschools’ web site–this site averages 10,000 hits per month, most of which are from practitioners.
n Research and evaluation.§ Release the year 1 report of the evaluation of the Public Charter Schools Program -- the first of a
three-year study -- which will examine the role of Public Charter Schools Progam and StateEducational Agencies in promoting the development of charter schools.
§ Release the year 1 report of the evaluation of the Magnet Schools Assistance Program -- the firstof a four-year study -- which will provide a baseline picture of the extent to which MagnetSchools Assistance Program grantees are meeting statutory objectives.
§ Release charter school finance study, which will explore whether states’ policies and practicesrelated to charter school finance are conducive to meeting the policy goals set forth in theircharter school legislation.
Coordination with other federal agencies
n Partnerships to promote charter schools in the District of Columbia. Work with other federalagencies and the District of Columbia school system to encourage their adoption or support of high-quality public charter schools in the district.
Selected AccomplishmentsPromoted the growth of high-quality charter schools• The Charter Schools Expansion Act of 1998 made great strides toward encouraging the
creation of high-quality charter schools that operate flexibly in exchange for improved studentperformance. The law reauthorized the Public Charter Schools program and encouragesstates—through grant funding priority—to allow charter schools to control their budgets andexpenditures; it also encourages them to review charter school performance regularly and tohold them accountable for clear and measurable objectives for student performance.
Facilitated the sharing of best practice among charter schools and otherpublic schools• ED brought hundreds of charter schools operators together to share “lessons learned” with one
another through a major national conference (800 attendees, who overwhelmingly reported itsusefulness), its web site, which attracts 4,000 visitors per week, and several regional meetings.Further, to promote charter schools’ positive impact on the public school system, the CharterSchools Expansion Act provides new opportunities for charter schools to share promisingpractices with other public schools.
Explored ways to better promote excellence and equity in ED publicschool choice programs and initiatives• ED convened a forum of education experts in December of 1998 to gather insight into ways
that the Public Charter Schools and Magnet Schools Assistance programs can increase theavailability of public school choice and better promote quality, equity and diversity withinpublic education. The resulting discussion is helping shape the role of public school choice inthe Department’s ESEA reauthorization proposal as a tool for accelerating school reform.

U.S. Department of Education FY 2000 Annual Plan, Volume 1 Page 58
Programs and funding supporting this objective
Grants for servicesn Magnet Schools Assistance Program n Public Charter Schools Program
Performance indicators and charts
The Department of Education measures its progress toward meeting the objective of increased publicschool choice availability by tracking (1) the percentage of students in public schools of choice, (2) thenumber of states with charter school authorizing legislation, (3) the number of charter schools operatingnationwide, and (4) the extent to which districts are making choice available to families.
Indicator 33. By 2003, 25% of all public school students in grades 3-12 will attend aschool that they or their parents have chosen.
Indicator background and context. The growth in charter schools, magnet schools and other publicschool choice strategies will result in increasing percentages of students enrolled in schools that they andtheir families choose (see Figure 37).
Figure 37
Limitations of the data. No known limitations.Verification/validation of measures. The National Household Education Survey (NHES) is a datacollection system of the National Center for Education Statistics (NCES) that is designed to address awide range of education-related issues. In the 1993 NHES, nearly 64,000 households were screened.Data source(s). National Household Education Survey, 1993, 1999 and 2003.
1 2 %
1 8 %
2 5 %
0%
5%
10%
15%
20%
25%
30%
1993 1999 2003
Per
cen
t o
f S
tud
ents
Percent of Students in Grades 3-12 in PublicSchools of Choice, 1993-2003
Goal

U.S. Department of Education FY 2000 Annual Plan, Volume 1 Page 59
Indicator 34. By 2001, a minimum of 40 states will have charter school legislation.
Indicator background and context. Since Minnesota became the first state to enact charter schoolauthorizing legislation in 1991, 34 states, the District of Columbia, and Puerto Rico have followed suit asof 1998 (see Figure 38).
Figure 38
Limitations of the data. None.Verification/validation of measures. Existence of state legislation is easily verified.Data source(s). State Educational Agencies.
Indicator 35. By 2002, there will be 3,000 charter schools in operation around thenation.
Indicator background and context. The number of charter schools has been increasing rapidly since thefirst charter school opened in Minnesota in 1992 (see Figure 39). Between the 1996-97 and 1997-98school years alone, there was nearly a 100% increase in the number of operating schools. Over 1,100charter schools are in operation in 1998-99. The nature of state laws significantly influences the growthof charter schools; indeed, although 33 states have authorizing legislation, the majority of charter schoolsare located in seven states (Arizona, California, Colorado, Florida, Michigan, North Carolina, and Texas).
Number of States with Charter School Legislation
0
5
10
15
20
25
30
35
40
45
'92 '93 '94 '95 '96 '97 '98 '99 '00 '01
New states withcharter schoollegislation
Total number of stateswith legislation
Actual Goal

U.S. Department of Education FY 2000 Annual Plan, Volume 1 Page 60
Figure 39
Limitations of the data. Two key issues relevant to tracking the number of charter schools include theirquickly growing numbers and the fact that schools can be chartered through a variety of public andprivate entities. Estimates are often made by combining data that are not collected uniformly.Verification/validation of measures. Cross-referencing sources has helped validate figures receivedfrom various sources. Plans are underway to collect basic information from state educational agencies oncharter schools, including counts of operating schools twice per year.Data source(s). National Study of Charter Schools, Center for Education Reform; State EducationalAgencies.
Indicator 36. By 1999, at least half of school districts with 1,000 or more students willhave public school choice options available to their students through magnet schools,charter schools, and open enrollment policies.
Indicator background and context. School districts can provide families choice in public educationthrough open enrollment, magnet and charter schools, and other mechanisms. The extent and nature ofavailable choices is expanding (see Figure 40).
100255
428
790
1100
1600
2200
2801
3400
0
500
1000
1500
2000
2500
3000
3500
94-95 95-96 96-97 97-98 98-99 99-00 00-01 '01-'02 '02-'03
Number of Charter Schools in Operation,1994-2002
Actual Goal

U.S. Department of Education FY 2000 Annual Plan, Volume 1 Page 61
Figure 40
Limitations of the data. The survey question from which these data have been derived is worded in verygeneral terms, and there may be measurement error resulting from respondents’ differences ininterpretation. Further, this estimate was derived from a sample of all districts, including very smalldistricts that could not offer choice among schools within a district because there is only one schoolavailable. Therefore, the actual percent of districts offering choice as a proportion of the number ofdistricts that realistically can do so may be considerably higher. Lastly, several states have statewidepublic school choice policies in place; these state policies do not appear to have factored into the districtpersonnel survey responses that comprise this measure.Verification/validation of measures. The Schools and Staffing Survey (SASS) was designed to provideestimates for public schools at both the national and state levels. At the local level, the 1993-94 SASSselected 5,500 school districts associated with selected schools and 100 districts not associated withselected schools. The district-level survey had a weighted response rate of 94%.Data source(s). Schools and Staffing Survey, 1993-94. Next update: 1999-2000.
3 4 %
5 0 %
0
10
20
30
40
50
60
1993 1999-2000
Goal
P e r c e n t a g e o f D i s t r i c t s w i th P u b licS c h o o l C h o ic e O p t io n s

U.S. Department of Education FY 2000 Annual Plan, Volume 1 Page 62
Objective 1.7: Schools use advanced technology for allstudents and teachers to improve education.
Context: Research has found that educational technology, when used effectively, can significantlyimprove teaching and learning. To support schools in incorporating technology into their curricula, thePresident has established the four pillars of the Educational Technology Literacy Challenge:
1. All teachers in the nation will have the training and support they need to help students learn usingcomputers and the Internet (Information Superhighway);
2. All teachers and students will have modern multimedia computers in their classrooms;3. Every classroom will be connected to the Internet (Information Superhighway); and4. Effective software and on-line learning resources will be an integral part of every school’s
curriculum help to ensure that no child is left behind.
The educational resources of the Internet (Information Superhighway) are growing rapidly. However,many students and teachers, particularly those in high-poverty or rural schools, have little access to theseresources.
We have made great progress on our goals to put modern computers in our classrooms and connect themto the Internet (Information Superhighway). With increasing access to computers and tele-communications, we must ensure that teachers also have the ongoing training and support they need toeffectively use this investment for improved teaching and learning.
In response to this significant need, the Administration’s educational technology FY 2000 investmentswill place special emphasis on technology training for educators. These funds will help to ensure that allnew teachers can use technology effectively in the classroom and that at least one teacher in every schoolcan serve as a technology expert to assist other teachers. In addition, the FY 2000 budget requestsincreased funding for the interagency research initiative and for increasing access to technology incommunities, particularly for disadvantaged students and families.
External factors: The digital divide between low-and high-poverty schools is closing slowly, but thedigital divide between poor homes and others is larger than that between school -and it persists. Lack ofaccess to and use of computers in the home for poor children exacerbates inequalities stemming fromlower rates of access to computers in high-poverty schools.
Key strategies
n Technology Challenge Programs. Financial support for leveraging state and local initiatives foreffective use of educational technology.§ Through the Technology Literacy Challenge Fund (TLCF), support grants to local districts to
expand efforts to train teachers, get computers, connect schools to the Internet, and acquire,where necessary, high-quality educational software and on-line learning resources.
§ Encourage states and local districts to devote at least 30 percent of the TLCF funds to providetraining and support for teachers in the use of technology for teaching.
§ Provide evaluation tools and encourage states and districts to evaluate progress toward achievingthe four national education technology goals and to evaluate the impact of education technologyon student achievement.

U.S. Department of Education FY 2000 Annual Plan, Volume 1 Page 63
§ Use the Technology Innovation Challenge Grants appropriation to continue and expandpartnerships among educators, business and industry, and other community organizations todevelop and demonstrate innovative applications of technology that are integral to the curriculumand professional development in the effective use of technology in the classroom.
National initiatives:n Teacher preparation for 21st century classrooms§ Use $75 million for the Preparing Teachers to Use Technology program to make grants to teacher
colleges, other education organizations, and consortia to help ensure that prospective teachers areprepared to integrate technology effectively into teaching when they enter the classroom.
Selected Accomplishments
Technology Innovation Challenge Grants (TICG) build partnerships andfunds for education• Technology Innovation Challenge Grants (TICG) have brought together education, industry,
and other partners in 82 different demonstration projects that involve 701 school districts, 389business partners, 220 colleges and universities, and hundreds of community organizations.Business and community partners have matched the federal investment with commitments ofover $1 billion in the first four years of the program.
Increasing technology access in 1,814 districts• Technology Literacy Challenge Fund (TLCF) monies in FY97 provided increased access to
technology in 1,814 districts serving 12.8 million students, or about 28 percent of all studentsnationally.
State and local technical assistance in evaluating technology• In response to state and local requests, the Department has developed “An Educator's Guide to
Evaluating the Use of Technology in Schools and Classrooms.” The Guide will serve as apractical resource to help educators tailor evaluations to the specific needs of their districts andschools.
“E-rate” pulls in 30,000 applicants• The E-Rate has resulted in more than 30,000 applicants (states, districts, schools and libraries)
who will qualify for more than $1.9 billion in telecommunications discounts.
Computer donations to schools initiative• Secretary Riley pledged to donate 2,000 surplus departmental computers to schools as part of
the Computers for Learning Initiative. To date, ED has donated 1,202 computers from theDepartment of Education to schools across the country. Government-wide, federal agencieshave donated more than 8,900 computers to schools.
On-line reporting initiated• The Department of Education is using technology in new ways to facilitate program
administration for states. For the first time, states and districts have submitted their annualTechnology Literacy Challenge Fund (TLCF) annual reports via an on-line database. Thereporting will yield a baseline for subsequent program support and evaluation.
Technology Links: Teachers, Centers, and Networks§ An $87 million dollar appropriation for Technology National Activities in FY 1999 will initiate
a $75 million program to ensure that new teachers are prepared to integrate technologyeffectively into their classrooms; a $10 million program to establish computer learning centersin low-income communities; and a $2 million program to strengthen the network of ED’stechnology programs and link them more closely to other federal, state, and private sectorefforts.

U.S. Department of Education FY 2000 Annual Plan, Volume 1 Page 64
§ Encourage states to adopt technology standards that are included in the teacher certification andrecertification process. Encourage higher education institutions to partner with the private sectorto integrate educational technology into preservice teacher preparation.
n Technology literacy for students by the end of middle school§ Encourage states to establish technology literacy as a requirement for completion of middle
school or junior high school.§ Obtain appropriation of new funding to train teacher technology leaders in each middle school, or
a team of teachers at middle or high schools who can lead these efforts.
n Technology connections, especially for high-poverty urban and rural schools and communities§ Encourage schools to greatly expand their use of technology through the E-rate, or universal
service program, created under the Telecommunications Act of 1996.§ Use funding for the Community Technology Centers initiative to address disparities in home
access to educational technology by providing increased access to computers for students andadults in high-poverty urban and rural communities.
n Research§ Use the $25 million Education Research Initiative to focus on the use of technology to promote
improvements in teaching and learning.
n High-quality educational software and Web sites§ Support grant competitions to encourage the development of high-quality educational software
and educational web sites by students, university faculty, and commercial software companies.§ Work with other federal agencies, schools, and teachers to expand the Federal Resources for
Excellence in Education Web site.
Coordination with other federal agencies
n White House National Economic Council, White House Office of Science and TechnologyPolicy, Department of Commerce, Department of Labor, and Department of Housing andUrban Development. The Department is cooperating with numerous agencies on an ongoing basisto increase school and community access to educational technology and to encourage its effective use.
n Census Bureau. The Department supplements the Census Bureau’s Current Population Survey (CPS)with questions on computer and Internet access at home.
n National Science Foundation and National Institute of Child Health and Human Development.The Department has requested $25 million for an interagency research initiative with the NationalScience Foundation and the National Institute of Child Health and Human Development which wouldinclude a focus on the use of information and computer technologies in improving school readinessfor reading and mathematics, initial teaching of reading and mathematics, and teacher preparation inreading, mathematics and science. With the National Science Foundation, the Department iscosponsoring a study of educational technology and instructional practice.
n Federal Communications Commission and its Schools and Libraries Division. The Departmentis collaborating with the FCC and the Schools and Libraries Corporation for effective implementationof the universal service rate for educational access for schools and libraries (the E-Rate).

U.S. Department of Education FY 2000 Annual Plan, Volume 1 Page 65
Programs supporting this objective
Formula grant programs for servicesand equipmentn Technology Literacy Challenge Fundn Goals 2000n ESEA Title In IDEA State Grants
Discretionary grant programs for servicesand equipmentn IDEA Technology and Media Servicesn Community-based Technology Centers
Technical Assistancen Regional Technology in Education Consortian Eisenhower Math/Science Regional Consortia
Demonstrationsn Migrant Education Technology grantsn Telecommunications Demonstration Project
for Math
Development and disseminationn Technology Innovation Challenge Grantsn Star Schoolsn National Institute on Disability andn Rehabilitation Research (NIDRR)n Assistive Technology Programn Eisenhower Professional Development
Federal Activitiesn Universal Service Discount for Schoolsn Teacher Training in Technologyn Teacher Quality Enhancement Grantsn Middle School Teacher Trainingn Learning Anywhere Anytime Partnershipsn Software Development initiative
Researchn Research on the Effectiveness of Educational
technology (joint ED-NSF)n National Research Institutes
Performance Indicators and Charts
Indicator 37. Students will increasingly have access to high-quality educationaltechnology in core academic subjects.
Indicator background and context. The benefits of computers in schools and classrooms can bemultifaceted, ranging from increased student motivation to improved teachers’ skills and studentachievement. Of key importance is the extent to which computers in classrooms serve as learning toolsthat improve student achievement and whether students acquire the technology literacy skills needed forthe 21st century. According to NAEP, the use of computers in instruction has increased dramatically.
In 1978, 14% of eighth graders and 12% of eleventh-graders used computers when learning math. By1996, these percentages increased to 54% and 42% respectively (see figure 41). For writing instruction,15% of eighth-graders and 19% of eleventh-graders used computers in 1978 whereas by 1996, 92% ofeighth-graders and 96% of eleventh-graders used computers (see figure 42).

U.S. Department of Education FY 2000 Annual Plan, Volume 1 Page 66
Figure 41 Figure 42
Limitations of the data. NAEP data do not include a precise measure of the intensity with which thetechnology is used, of the effectiveness with which teachers use educational technology, or of itsalignment with instruction. Trend data on student achievement using educational technology areproblematic unless they address these issues, and control for the changing composition of the studentpopulation with access to educational technology.Verification/validation of measures. NAEP items for educational technology and achievement are basedon substantial development work and pre-testing.Data source(s): NAEP trend data.
Indicator 38. The ratio of students per modern multimedia computer will improve to5:1 by 2001.
Indicator background and context. To make technology a viable instructional tool requires schools tohave enough computers to provide full, easy access for all students. Citing Glennan and Melmed (1996),Getting America’s Students Ready for the 21st century (U.S. Department of Education, 1996) notes thatmany studies suggest that full, easy access requires a ratio of about five students to each multimediacomputer. In 1987, the ratio of students per instructional use computer was 37 :1. By 1997, this ratio hadimproved to 7:1 (see figure 43).
Figure 43
Use of Computers in MathematicsInstruction
14%
54%
12%
42%
0%
20%
40%
60%
80%
100%
1978 1996 1978 1996
Grade 8 Grade 11
Use of Computers in WritingInstruction
1 5 %
9 2 %
1 9 %
9 6 %
0 %
2 0 %
4 0 %
6 0 %
8 0 %
1 0 0 %
1 9 7 8 1 9 9 6 1 9 7 8 1 9 9 6
Grade 8 Grade 11
Number of Students Per Instructional and Multimedia Computer
37
19
7 6 5
2114
50
10
20
30
40
1986-87 1991-92 1996-97 1997-98 2001-02
Instructional Use Computer Multimedia Computer
Goal

U.S. Department of Education FY 2000 Annual Plan, Volume 1 Page 67
Limitations of the data. Market Data Retrieval data do not have consistently high response rates, andresponse rates vary substantially across sites. Accuracy of responses may vary considerably acrossdistricts and states.Verification/validation of measures: The estimates are roughly consistent with information from othersources such as QED and FRSS.Data source(s): Computer access trend data from Market Data Retrieval, 1997 (public school findings).
Indicator 39. The percentage of public school instructional rooms connected to theInternet (Information Superhighway) will increase from 14% in 1996 to higherpercentages thereafter.
Indicator background and context. Connections to the Internet make computers versatile and powerfullearning tools by introducing students and teachers to new information, people, places, and ideas fromaround the world to which they might not otherwise be exposed. In 1993, only 3% of instructional roomswere connected to the Internet. By 1997, 27% of class rooms were connected to the Internet (see figure44).
Figure 44
Limitations of the data. The sample size limits ability to report for subnational units such as individualstates, and for subgroups.Verification/validation of measures: Items have been pretested and used repeatedly. Results are roughlyconsistent with results from other sources.Data source(s). National Center for Education Statistic (NCES), Survey of AdvancedTelecommunications in U.S. Public Elementary and Secondary Schools, March 1998. Next update:February 1999.
3%8%
14%
27%
50%
75%
100%
0%
20%
40%
60%
80%
100%
1 9 9 4 1 9 9 5 1 9 9 6 1 9 9 7 1 9 9 8 1 9 9 9 2 0 0 0
Percentage of Instructional Rooms with InternetAccess in the Classroom
Goals

U.S. Department of Education FY 2000 Annual Plan, Volume 1 Page 68
Indicator 40. By 2001, at least 50% of teachers will integrate high-quality educationaltechnology, high-quality software, and the Internet (Information Superhighway) intotheir school curricula.
Indicator background and context. Computers, effective software, on-line learning resources, and theInternet hold promise to improve learning; increase the amount of time students spend learning; andengage students in problem solving, research, and data analysis. Teachers’ integration of the use oftechnology into the curricula is a major determinant of technology’s contribution to student learning, onceaccess to computers is provided. In 1998, 20% of teachers reported that they were fully prepared tointegrate technology in their instruction (see figure 45).
Figure 45
Limitations of the data. The Advanced Telecommunications Survey that provides these data is a surveyof schools (not of teachers). The NAEP items do not provide good measurement of how intensivelyeducational technology is used, or of how tightly it is aligned with curriculum.Verification/validation of measures: NSF-OERI study of instruction and computer use by Becker-Anderson will provide detailed information on instructional use of educational technology for a nationalsample of schools.Data source(s). NCES, Teacher Quality: A Report on the Preparation and Qualifications of Public SchoolTeachers, January 1999. Next update: January 2000.
Indicator 41. Students in high-poverty schools and students with disabilities will haveaccess to advanced technology (including assistive technology for students withdisabilities) that is comparable to the access had by students in other schools by 2001.
Indicator background and context. Providing students with access to computers and using computersto support instruction require significant investments in hardware, software, wiring, and professionaldevelopment, yet school districts vary greatly in their capacity to fund additional expenses. One of themost formidable challenges to meeting the nation’s technology goals is ensuring that no community is leftbehind. Research has documented differences in access between high-and low-poverty schools, but alsoshows that access in all schools is increasing. In 1995, 31% of high-poverty schools and 62% of low
Percentage of Teachers Fully Prepared to Integrate Technology in Instruction
20%
40%
60%
80%
0%
10%
20%
30%
40%
50%
60%
70%
80%
90%
1998 1999 2000 2001

U.S. Department of Education FY 2000 Annual Plan, Volume 1 Page 69
poverty schools had access to the Internet (see Figure 46). By 1997, the percentage of schools withInternet access had increased to 63% for high-poverty schools and to 88% for low poverty schools.
Figure 46
Limitations of the data. Measures are based on free and reduced-price school lunch data, which mayunderestimate school poverty levels, particularly for older students and immigrant students.Verification/validation of measures. The Advanced Telecommunications Survey that provides this datais a survey of schools (not of teachers).Data source(s). NCES, Advanced Telecommunications School Survey (FRSS), March, 1998. Nextupdate: February 1999.
Indicator 42. At least 60% of teachers, school administrators, and school librarianswill have been trained on use of computers and the Internet to help students learn by2001.
Indicator background and context. Professional development is key to effective technology integrationand to increased student learning. Teachers need access to technology and ongoing support while theylearn and they need adequate time to acquire new skills to integrate technology into their schools’programs and activities. In 1993-94, 51% of teachers participated in professional development activitiesin the uses of technology for instruction (see Figure 47). In 1998, 78% of teachers participated inprofessional development activities related to the integration of education technology in the grades orsubjects taught by the teachers.
Percentage of High- and Low-Poverty Schools withInternet Access
31
53
63
75
85
100
62
78
88 9095
100
0
20
40
60
80
100
1995 1996 1997 1998 1999 2000
High-Poverty
Low-Poverty
Goals
High-poverty schools: 71% or more low incomeLow-poverty schools: 11% or less low income

U.S. Department of Education FY 2000 Annual Plan, Volume 1 Page 70
Figure 47
Data source(s). NCES: Teacher Quality: A Report of the Preparation and Qualifications of PublicSchool Teachers (1999).Limitations of the data. Survey questions for the 1993-94 and 1998 data are similar but not identical.The indicator does not directly address the ability of staff to effectively use technology. This questionwill be addressed in future surveys.Verification/validation of measures: Measurement Error Studies at the NCES (NCES 97-464).
Percent of Teachers Who Participated in ProfessionalDevelopment in Educational Technology During the Past
School Year/12 Months
78%
51%
0%
10%
20%
30%
40%
50%
60%
70%
80%
90%
100%
1993-94 1998
ProfessionalDevelopment in Uses ofTechnology forInstruction
ProfessionalDevelopment inIntegration ofEducationalTechnology in Gradeor Subject Taught

U.S. Department of Education FY 2000 Annual Plan, Volume 1 Page 71
Goal 2. Build a solid foundation for learning for all children.
In its pursuit of educational improvement, the Department of Education (ED) concentrates on twointerrelated aims: excellence and equity. As part of this effort, we have identified several areas that mustbe addressed in order to build a solid foundation of learning for all children. One essential is to focus onkey transition points in a child’s educational journey. In addition, we must ensure that students withspecial needs not only have those needs addressed, but also are held to high academic standards, alongwith other students, so that they, too, benefit from the emphasis on excellence. In this way, all studentswill be prepared for productive employment, further education, and full democratic participation. We canachieve this goal by ensuring that:
1. All children enter school ready to learn. Research has made clear that children’s earlyexperiences have a profound effect on long-term learning. Moreover, children are more likely tobe successful in the school environment if they arrive well prepared. A high-quality earlychildhood education is crucial for children with special needs.
2. Every child reads well and independently by the end of the third grade. Besides being animportant skill in its own right, reading is the foundation for all later academic learning.
3. Every eighth grader masters challenging mathematics, including the foundations of algebra andgeometry. Mathematics is an essential skill as well as the entree to learning science andtechnology. Moving to more advanced mathematics before high school is often a key to higheracademic achievement, particularly for disadvantaged students.
4. Special populations participate in appropriate services and assessments consistent with highstandards. If all children are to attain excellence, students with special needs must receive extrasupport, and our measure of success must be defined in terms of their academic achievement, aswell as the performance of students overall.
To address these key areas, we must pursue strategies such as improved professional development,cooperation with state and local efforts to implement high academic standards and linked assessments,and financial support for innovative approaches to assist children with special needs. The Department ofEducation seeks to promote these strategies through its reauthorization proposal to strengthen federalelementary and secondary programs and through its ongoing monitoring, guidance, and leadership.

U.S. Department of Education FY 2000 Annual Plan, Volume 1 Page 72
Objective 2.1: All children enter school ready to learn.
Context: Supporting parents to prepare children for school is important in building a solid foundation forlearning for all children. Children’s experiences within their families and their early childhoodexperiences are critical in fostering emergent literacy. Research on early brain development reveals thatlearning experiences introduced to children at an early age are directly linked to successful learning aschildren mature. Furthermore, children who enter school ready to learn are more likely to achieve to highstandards than children who are inadequately prepared. High-quality early childhood programs areparticularly important for children from families with limited education and for children with disabilities.
Federal programs that serve young children and their families, such as Head Start (including Early HeadStart), Even Start, and IDEA Grants for Infants and Families and Preschool Grants can help to accomplishthis objective. States also provide important preschool services for children. Because other federalagencies are also involved in working toward this objective, collaboration with other agencies that workwith young children and their families is also important. ED also provides leadership in early childhoodeducation by supporting and disseminating research-based knowledge on effective policies and practices.
External factors: Much of the work done with young children—for example, through the Head Startprogram in the Department of Health and Human Services and state-sponsored preschool programs—isoutside the purview of ED. ED will continue to collaborate with Head Start and provide leadership inaligning standards used in all early childhood programs. ED also needs to encourage states to adopt soundpolicies and practices in the programs they support in early childhood education.
Key strategies
n Financial support for children who are educationally disadvantaged or have disabilities.§ ED’s $135 million request for the Even Start program would support projects providing early
childhood education, adult education, and parenting instruction that help prepare disadvantagedchildren to enter school ready to learn.
§ ED is requesting $390 million for the Special Education Infants and Families program to expandthe numbers of children served, increase the focus on providing services in natural environments,and improve the scope and quality of early intervention services for children with disabilities,from birth through age 2, and their families.
§ The $406.4 million request for Special Education Preschool Grants program is intended to helpstates to serve additional children and help ensure that 3 to 5-year-old children with disabilitiesenter school ready to learn reading and math.
§ Continue funding for the research and development activities of the National Institute on EarlyChildhood Development and Education, which include supporting the National Center for EarlyDevelopment and Learning at the University of North Carolina at Chapel Hill.
n Provide leadership through the development and dissemination of research-based knowledge.Support the implementation of good practice based on new knowledge of brain development, earlyintervention, and high-quality nurturing.§ ED is requesting $25 million for the interagency Education Research Initiative to conduct joint
research with NSF and NICHD on school readiness-related issues.§ Develop a coordinated research agenda through the interagency Early Childhood Research
Working Group convened by the National Institute on Early Childhood Development andEducation (OERI). In addition to Department of Education members, this group includesmembers from the National Institutes of Health, Head Start, the Department of Agriculture, theChild Care Bureau, and the Bureau of Indian Affairs.

U.S. Department of Education FY 2000 Annual Plan, Volume 1 Page 73
§ Support a National Research Council (NRC) study on early childhood pedagogy that will identifywhat children between two and five years old should know in order to do well when they enterschool.
§ Develop a comprehensive information system for early childhood education, including acompilation of how state funds are used to support preschool services.
§ Continue to support the Office of Special Education Programs’ early childhood researchinstitutes. These institutes address culturally and linguistically appropriate services; measuringgrowth and development; inclusion of preschool children in child care, Head Start, public school,and community settings; increasing learning opportunities that parents, caregivers, andcommunity members can use to enhance learning; service and utilization patterns; and servicecoordination.
n Continuous improvement of ED’s early childhood education programs.§ Encourage agreements between Even Start participating parents and Even Start projects that
would establish developmentally appropriate outcomes for children and provide for mutualresponsibility for achievement of those outcomes.
§ Facilitate and assess approaches to continuous program improvement in Even Start projects basedon clear outcome goals for children and families, program quality standards, rigorous andobjective assessment of program results, and the use of evaluation results to monitor progress andenhance program quality. Help Even Start projects to set appropriate performance goals andmeasure progress accordingly. Provide assistance to projects to conceptualize progress indicatorsfor the entire Even Start age range.
§ Strengthen monitoring and assistance in early childhood education programs for children withdisabilities to focus on identifying areas in need of improvement and good practices.
n Collaboration with other objectives in ED’s Strategic Plan.§ Work with the Partnership for Family Involvement and the Reading Excellence Act program to
provide training for tutors to work with special populations, such as children from low-incomefamilies, or children with limited English proficiency or disabilities.
Selected Accomplishments
Hosted Reading Summit• All the major program offices contributed to planning and sponsoring a Reading Summit for
state teams which described the findings of the National Research Council’s (NRC) report,Preventing Reading Difficulties in Young Children. Over 650 individuals attended the summitfrom 50 states and territories.
Partnered to get the word out• Department staff collaborated with Head Start in the development of materials to encourage
early childhood professionals to use the arts as a learning vehicle.
Set out to improve agency and department coordination• The Federal Interagency Coordinating Council (FICC) developed a three-year strategic plan to
improve coordination among agencies and departments involved in early childhood educationpolicy and program implementation.
• Several ED offices, along with Head Start, have held a series of meetings to develop jointfunding strategies to increase early literacy and language skills in young children at-risk forreading failure.
Recognized importance of early intervention• OSERS and OBEMLA have sponsored a strand on the importance of early intervention for
children at risk for reading difficulties at the annual conference of the National Association forBilingual Education (NABE). Nearly 100 individuals attended the early intervention strand.

U.S. Department of Education FY 2000 Annual Plan, Volume 1 Page 74
Coordination with other federal agencies
n Coordination of indicators. Work with the Head Start Bureau to more closely align indicators ofprogress and quality between the Even Start program and the Head Start program.
n HHS initiative. Work with HHS to coordinate ED’s preschool programs with the efforts of theproposed “Early Learning Fund,” which, if passed, would provide funds to improve the safety andquality of child care, and enhance early childhood development.
n Information exchange, research coordination.§ Use the interagency Early Childhood Research Working Group convened by the National
Institute on Early Childhood Development and Education to exchange and share research-basedinformation about young children and their families and to provide opportunities for interagencyresearch collaboration. Use the findings from this exchange, such as the information provided bythe National Institute of Child Health and Human Development on language and literacydevelopment, to improve programs across federal departments.
§ Facilitate collaboration by making federal legislation among programs compatible andencouraging interagency agreements at the state level; examine how collaborative efforts areevolving at the state and local levels.
§ Continue work with NSF and NICHD on the interagency research initiative that will focus onschool readiness.
§ Children’s Health Insurance Program (CHIP): Work with the White House, HHS, and otherfederal agencies to conduct outreach to educators and families about the availability of free andlow-cost insurance for children.
n Coordination of strategies for education services to young children. Use the Federal InteragencyCoordinating Council (FICC) to coordinate strategies for children with disabilities and their families.
Programs supporting this objective
Grants for servicesn Head Startn Title In IDEA Grants for Infants and Families (Part
C)n IDEA Preschool Grants (Part B)n IDEA State Grants (Part B)n Even Startn Inexpensive Book Distribution (Reading Is
Fundamental)n Ready to Learn Television
Researchn National Education Research Initiativesn IDEA: Research and Innovation (Part D)n Statistics and Assessment
Technical assistance and disseminationn Comprehensive Regional Assistance Centersn IDEA Parent Training and Information
Centersn IDEA Technical Assistance and
Dissemination (Part D)n Goals 2000 Parent Information and Resource
Assistance Centers

U.S. Department of Education FY 2000 Annual Plan, Volume 1 Page 75
Performance indicators and charts
Performance indicators in the Strategic Plan for objective 2.1 focus on indicators that track the access tolearning activities for children prior to kindergarten.
Indicator 43. Kindergarten and first-grade teachers will increasingly report that theirstudents enter school ready to learn reading and math.
Indicator background and context. There are currently no available data for this indicator. NCES’Early Childhood Longitudinal Study: Kindergarten Cohort will ask teachers to evaluate the sampledkindergarten children’s skills in language and literacy and mathematics, including those of children withdisabilities. This study will also directly assess children’s skills. These data will be available for the year1998-99.
Limitations of the data. The ECLS data are longitudinal; no follow-up data collected on subsequentcohorts of children entering kindergarten through this study are planned at this time.Verification/validation of measures.Data source. National Center for Education Statistics, Early Child Longitudinal Study; KindergartenCohort.
Indicator 44. The disparity in preschool participation rates between children fromhigh-income families and children from low-income families will become increasinglysmaller.
Indicator background and context. In 1991, 22 percent of 3- and 4-year-olds from low-income familieswere enrolled in preschool programs, compared with 32 percent of those from middle-income familiesand 53 percent of those from high-income families (see figure 48). In 1994, 37 percent of 3- and 4-year-olds from low-income families were enrolled in preschool programs, compared with 40 percent of thosefrom middle-income families and 59 percent of those from high-income families. Despite the importanceof improving preschool participation rates for at-risk children, the disparity in preschool participationrates had not improved by 1997.
Figure 48
Preschool Participation of ChildrenFrom Low-, Middle-, and High-Income
Families
0
10
20
30
40
50
60
70
80
90
100
1991 1992 1993 1994 1995 1996 1997 1998 1999 2000
Percentparticipatinginpreschoo
High Income
MiddleIncome
Low Income
GOAL

U.S. Department of Education FY 2000 Annual Plan, Volume 1 Page 76
Limitations of the data. Starting in 1994, these data were collected using new procedures. Thus, databefore 1994 may not be comparable with figures after 1994. In addition, these data measure onlyenrollment in preschool programs, not the quality of the programs.Verification/validation of measures. The Current Population Survey (CPS) provides estimates of schoolenrollment and social and economic characteristics of students. The sample of 60,000 households isscientifically selected to represent the civilian non-institutional population. Interviewers (both bytelephone and personal visit) usually obtain responses from more than 93 percent of their eligible cases.Each October, the CPS includes supplemental questions on the enrollment status of the population age 3and older.Data source. U.S. Department of Commerce, Bureau of the Census, Current Population Survey,unpublished tabulations, updated annually.
Indicator 45. The percentage of 3-to-5-year-olds whose parents read to them or tellthem stories regularly will continuously increase.
Indicator background and context. Reading to children helps them build their vocabularies, animportant factor in school success. Thus, frequent reading by parents to their children is an importantactivity in preparing children for school. Only two-thirds of preschoolers were read to or told storiesregularly in 1993 (see figure 49). By 1996, the proportion of preschoolers whose parents read to them ortold them stories regularly had increased to 72 percent.
Figure 49
Limitations of the data. Parents may over-report reading to their children, as it is the socially acceptableanswer.Verification/validation of measures. The National Household Education Survey (NHES) is a datacollection system of the National Center for Education Statistics (NCES) that is designed to address awide range of education-related issues. The NHES:93 survey identified and screened more than 64,000households.Data source. National Center for Education Statistics, National Household Education Survey, 1993, 1996(to be updated in 1999).
66%72%
0%
20%
40%
60%
80%
100%
1993 1994 1995 1996 1997 1998 1999 2000
Percentage of 3-5 Year-Olds Whose ParentsReport Reading or Telling Stories to Them
Regularly
èè èè Goal èè èè

U.S. Department of Education FY 2000 Annual Plan, Volume 1 Page 77
Objective 2.2: Every child reads well and independently bythe end of the third grade.
Context: Reading is the foundation of all other skills essential for learning, yet the 1998 NationalAssessment of Educational Progress reports that only 62 percent of 4th graders read at the basic level orhigher. This is alarming because research shows that students who fail to read well by 4th grade are atgreater risk of educational failure. Mastering basic skills like reading is the essential first step to reachingchallenging academic standards in all subjects.
The Department of Education’s key strategies to accomplish this objective include improving K-3 readinginstruction through support for the Reading Excellence program, Title I, Even Start, and other programssupporting reading; expanding community-wide extended learning time programs in reading;coordinating Department and other federal agency programs to ensure high quality services for specialpopulations; coordinating and promoting reading strategies, programs, and research within and outsideED; and promoting early childhood literacy activities in families and communities as well as in child caresettings and preschools.
External factors: Increasing the reading skills of American children depends not only on improvingclassroom instruction, but also on encouraging parents to take a more active role in their children’sreading from early childhood onward. While we know much more about what contributes to effectiveteaching in reading, getting this information out to colleges and universities that prepare teachers for theclassroom and to teachers already in classrooms remains a challenge. The National Research Councilreading research synthesis, “Preventing Reading Difficulties in Young Children,” reports that manyteachers do not have the necessary skills to teach reading. The Reading Excellence Act providesimportant, new support to strengthen reading at home and in school. Furthermore, the Department’sresearch and dissemination, as well as special program activities in reading, will further support andstrengthen teacher preparation, as well as school and home activities in reading.
Key strategies
n Improvement in K-3 reading instruction. Implement the Reading Excellence Act at $260 million,which will improve the instructional practice of K-3 reading teachers in local communities across thecountry. Expand dissemination of high quality reading instruction and interventions from theNational Research Council study. Provide $1.4 billion to the Class Size Reduction and TeacherFinancing Initiative to help ensure that every child receives individualized reading attention.
n Community-wide extended learning time programs in reading. Expand the 21st CenturyCommunity Learning Centers program to $600 million to support approximately 7,700 after-schoollearning centers that include help in reading and literacy-related services; provide $934 million forFederal Work-Study to 100,000 Work-Study students for ARC sites and other community extendedlearning, literacy efforts. (The Reading Excellence Program also supports local tutorial assistancegrants that fund extended learning time programs.) Develop new family-school-community Compactfor Reading materials for use by schools and communities in strengthening family involvement andsupport of school reading activities. Encourage summer reading programs in schools, camps,libraries, and community-based organizations.

U.S. Department of Education FY 2000 Annual Plan, Volume 1 Page 78
n Services for special populations. Encourage coordination among regular education, Title I, specialeducation, and bilingual education reading programs for children to strengthen services to special
Selected Accomplishments
Passed Reading Excellence Act• Proposed, and Congress passed, the Reading Excellence Act to improve reading instruction in
the early grades and extend learning time through tutorial programs.
Increased the availability of extended learning opportunities• Expanded the 21st Century Community Learning Centers program to provide extended
learning opportunities before and after school to 380,000 children .
Led new consensus on practices through reading research• Supported the development of the National Research Council’s report, "Preventing Reading
Difficulties in Young Children." This major synthesis of the research on reading indicates anew consensus for teaching preparation, practice, teacher training, and family involvementamong other areas.
Hosted Reading Summit• Hosted the first National Reading Summit, which further disseminated the findings of the
National Research Council’s report, "Preventing Reading Difficulties in Young Children."Over 650 individuals attended the summit with teams from 50 states and territories.
Expanded technical assistance• Expanded Summer Pilot Sites from 14 to 59 (at least one in each state) and developed the
America Reads Challenge Tool Kit. The Tool Kit provides over 50 different basic materialsand resources needed to develop and implement large or small community-based literacyefforts for children K-3.
Signed On over 1,200 colleges and universities to America Reads• Expanded the Federal Work-Study component of America Reads by signing on over 1,200
colleges and universities to the America Reads Challenge, hosting 16 regional trainingsessions, awarding 61 subcontracts for reading partnerships across the country, and producingrecruitment materials for colleges and universities.
Increased the President’s Coalition to over 275 organizations• Expanded the President's Coalition to include over 275 organizations and increased their
involvement with America Reads and their commitment to literacy. Examples include: PhiTheta Kappa has chosen the America Reads Challenge as its two-year international serviceprogram; the General Federation of Women's Clubs has made literacy a priority for all of itsstate and local chapters; 7-Eleven and the creators of the television show Wishbone on PBScollaborated on creating tutor recruitment materials for the FWS program.
Increased availability of materials through Web site development• Developed and expanded a Department Web site to increase the availability of reading-related
materials. These materials are accessible through the America Reads homepage,http://www.ed.gov/inits/americareads.
Launched new research initiative• With NSF and NICHD, launched the Interagency Education Research Initiative to fund
research on school readiness for learning reading and mathematics; K-3 learning in readingand math; and teacher training in content areas and the science underlying cognitivedevelopment and learning.

U.S. Department of Education FY 2000 Annual Plan, Volume 1 Page 79
populations. Provide $8 billion in Title I Grants to local educational agencies to support state andlocal efforts to help more than 12 million disadvantaged students; provide $4.7 billion for the SpecialEducation Grants to States and Preschool Grants programs to help states and school districts improvethe quality of education provided to students with disabilities; provide $50 million for a new SpecialEducation Primary Education Intervention program to help states to intervene early with children whohave marked developmental delays in learning to read and in other areas; provide $259 million toBilingual Education Instructional Services to help increase the proportion of children with limitedEnglish proficiency that meet or exceed the basic level in reading.
n Early childhood literacy activities in child care settings and preschools. Partner America Readscommunity efforts with Even Start and Head Start family literacy programs and Ready to LearnTelevision. Disseminate quality early literacy materials to family/home child care settings andpreschools. Provide $145 million to Even Start to support family literacy projects for children frombirth through age 7.
n Research, evaluation, and dissemination. Implement a coordinated research and evaluation agendafor reading that builds on current and past research. Promote the implementation of NationalAcademy of Sciences (NAS) reading findings; collaborate with National Institute of Child Health andHuman Development (NICHD) in this research effort. Support the NAS study on early childhoodpedagogy and disseminate findings. Develop an expert research panel on reading at OERI to identifyand validate research-based models of effective practice. Request $25 million in 2000 to add toNSF’s $22 million interagency Education Research Initiative (ERI) that is being jointly implementedby NSF, ED, and NICHD.
n Coordination and collaboration. More effectively coordinate and promote reading strategies,programs, and research within and outside ED. Continue to develop interagency collaborations andleverage key reading professional organizations like the International Reading Association, NationalCouncil for Teachers of English, National Reading Conference and American Library Association.Encourage community-level coordinated system reform in reading by disseminating “A Compact forReading.”
Coordination with other federal agencies
n Corporation for National Services (CNS). Coordinate the America Reads Challenge (ARC)President’s Coalition members with CNS grantee sites using CNS volunteer tutors; coordinateinformation and assistance to Challenge sites from State Commissioners and State Education Agencyassistance to CNS sites; encourage cross-use of CNS and Department publications for the Challengeas well as collaboratively develop materials; encourage cross-use of CNS and Department web sites;and encourage cross-use of College Work Study students to support CNS and Department ARC sites.
n Health and Human Services (HHS). Coordinate development and dissemination of readingpublications; coordinate outreach to early childhood caregivers (Head Start and Resource andReferral Network); and coordinate community collaboration of HHS and Department fundedactivities for reading and early childhood.
n National Academy of Sciences (NAS). Support dissemination and outreach based on NAS study,"Preventing Reading Difficulties in Young Children." Support NAS study on early childhoodpedagogy.

U.S. Department of Education FY 2000 Annual Plan, Volume 1 Page 80
n National Institute for Literacy (NIFL). Collaborate with NIFL on application reviews anddissemination for the Reading Excellence Act.
n National Science Foundation (NSF)/National Institute of Child Health and HumanDevelopment (NICHD). Collaborate with NICHD and NSF on the Education Research Initiative(ERI) interagency research program (see above).
n National Institute of Health (NICHD). Collaborate with NICHD on application reviews for theReading Excellence Act. Also collaborate on a five-year study on the acquisition of English and onthe teaching and learning of reading.
n Army. Collaborate with the Army to train staff directors to use ARC: READ*WRITE*NOW!interventions and material in the Army’s extended learning programs.
n Bureau of Indian Affairs. Coordinate with the Department of the Interior's Bureau of Indian Affairsschools to encourage extended learning in reading programs that support the Challenge.
Programs and funding supporting this objective:
Grants supporting reading servicesn Title In Even Startn Reading Excellencen Bilingual Educationn IDEA State Grants (Part B)n Inexpensive Book Distributionn Ready to Learn Television
Tutoring and after-school programsn Federal Work-Studyn 21st Century Community Learning Centers
Standards for reading instructionn Goals 2000 Educate America Act
Technical assistancen Comprehensive Regional Assistance Centers
Initiatives supporting readingn Class-Size Reduction Initiativen HHS' Childcare Initiativen IDEA Primary Education Intervention
Teacher trainingn Eisenhower Professional Developmentn IDEA: Personnel Preparationn National Writing Project
Researchn Regional Education Labsn Statistics and Assessmentn IDEA: Research and Innovationn National Education Research Institutes
Performance indicators and charts
Performance indicators in the Strategic Plan for objective 2.2 focus on expected outcomes in studentachievement in reading, as well as indicators that track the implementation of recent programs to advancethese outcomes.

U.S. Department of Education FY 2000 Annual Plan, Volume 1 Page 81
Indicator 46. Increasing percentages of fourth-grade students will meet basic andproficient levels in reading on the National Assessment of Educational Progress(NAEP). By 2002, 66% of 4th grade students will score at or above the basic level inreading on the NAEP, and 32% of 4th grade students will score at or above theproficient level in reading on the NAEP.
Indicator background and context. Over the last 30 years, NAEP scores for 4th graders have beenrelatively flat (around 60% at basic or higher levels). These statistics are disturbing because they indicatethat, since the l970s, around 40% of the 4th grade population cannot read at the basic level of proficiency(see Figure 50).
Figure 50
Limitations of the data. NAEP data are not available annually. They are or will be available for 1994,1998, 2000, and 2002.Verification/validation of measures. NAEP data are rigorously analyzed for reliability andvalidity.Data source. NAEP (1992-present); next collection in 2000.
Indicator 47. By 2001, increasing numbers of colleges and universities will employAmerica Reads tutors through the Federal Work Study Program.
Indicator background and context. On July 1, 1997, the U.S. Department of Education encouragedFederal Work-Study students to serve as reading tutors by waiving the requirement that employers paypart of their wages. To date, 1130 colleges and universities employ America Reads tutors (see Figure 51).
Percent of 4th Graders Scoring at the Basic andProficient Levels on the NAEP
6 2 % 6 0 % 6 2 % 6 6 %
3 3 %3 1 %3 0 %2 9 %
0 %
2 0 %
4 0 %
6 0 %
8 0 %
1 0 0 %
1992 1994 1998 2002
BasicProficient
Goal

U.S. Department of Education FY 2000 Annual Plan, Volume 1 Page 82
Figure 51
Limitations of the data. None. Data on the numbers of colleges and universities employing FederalWork Study students are available on an annual basis.Verification/validation of measures. Data are verified through annual counts.Data sources. Fiscal Operations Report and Appreciation to Participate, 1998.
Indicator 48. Increasing percentages of teachers of students in pre-kindergartenthrough third grade will receive ongoing, intensive professional development to enablethem to successfully teach reading to diverse students, including those who experiencedifficulties in learning to read and those with disabilities.
Indicator background and context. The National Research Council (NRC) report on reading confirmsthat professional development is the single most powerful in-school factor affecting the children’sperformance in reading.
Limitations of the data. No data currently available.Verification/validation of measures. N/A.Data sources. No data is currently available. Data elements will be added to the teacher survey of theNational Longitudinal School Survey. Data elements could also be added to the Staff and School Surveyto obtain information on hours of pre-service and in-service, follow-up training using teacher mentors,and so forth.
1 , 1 3 0
1 , 8 0 0
2 , 5 0 0
3 , 3 0 0
0
500
1,000
1,500
2,000
2,500
3,000
3,500
1998 1999 2000 2001
Nu
mb
er o
f C
olle
ges
an
d U
niv
ersi
ties
Number of Colleges and UniversitiesParticipating in the Federal Work Study
Tutor Program
Goal

U.S. Department of Education FY 2000 Annual Plan, Volume 1 Page 83
Indicator 49. Increasing numbers of children participating in Head Start, Even Start,Title I Programs will make significant gains on measures of language developmentand reading readiness, so they are well prepared for grade-appropriate readinginstruction.
Indicator background and context. Findings from the NRC study on reading showthat preparation for school—at home and in early childhood programs–-is essential to theperformance of children in reading.
Limitations of the data. While some data are available from the National Even Start Evaluation (1995-96) on the performance of children in school readiness and language development, there is currently nocomparable assessment that can provide trend data for this indicator. Furthermore, no current data areavailable on pre-K Title I or Head Start student performance.Verification/validation of measures. Even Start evaluation data is determined reliable and valid.Data sources. The Department will be discussing the development of baseline and trend data for thisindicator shortly.

U.S. Department of Education FY 2000 Annual Plan, Volume 1 Page 84
Objective 2.3: Every eighth-grader masters challengingmathematics, including the foundations of algebra andgeometry.
Context: Mathematics is the gateway to learning many advanced skills and a prerequisite for success inmany careers. Results from the Third International Mathematics and Science Study (TIMSS), whichcompared the mathematics and science achievement of students from the U.S. with that of students inother countries, demonstrated our weak performance in middle and high school mathematics.Achievement in middle school clears the way for students to take rigorous high school mathematics andscience courses—keys to college entrance and success in the labor force. However, many elementary andmiddle school mathematics teachers are poorly prepared to teach higher level mathematics, and do notreceive sufficient professional development. The curriculum in the United States is broader than higherperforming countries, yet it lacks depth. In addition, teachers have less time for planning their lessons,reflecting on their teaching strategies, and using other teachers as resources.
The ED Mathematics Initiative, now referred to as “America Counts,” represents an effort to strengthenthe discipline focus among various programs within the Department. The challenge is to createopportunities within Congressional guidelines and appropriations that support the goal of higher studentachievement in mathematics.
External factors: ED is working closely with NSF to better coordinate federal efforts to improvemathematics education, but states and districts will need to simultaneously intensify their efforts in orderto improve student achievement in mathematics.
Key strategies
n Eisenhower Professional Development Federal Activities budget request. Support the ED-NSF“America Counts” Action Strategy to improve mathematics instruction and achievement through the$30 million request in funding for Eisenhower Professional Development Federal Activities. (This iscoupled with an NSF request and their intensified focus on middle grades mathematics.) A new $6million program would improve teachers’ ability to teach mathematics well by helping schooldistricts identify the professional development needs of their mathematics teachers and helping thembuild the requisite content knowledge and pedagogical skills to effectively teach rigorousmathematics.
n Build public understanding of the mathematics that our students must master.§ Launch ED-NSF national public engagement campaign to improve public understanding of what
challenging middle school mathematics looks like and show how every adult can support effortstoward higher mathematics achievement for all students. For example, The Formula for Success:A Business Leader’s Guide describes ways in which business leaders can actively participate inthe improvement of mathematics and science education.
§ Develop and widely disseminate clear, research-based information on the importance ofchallenging middle school mathematics and the leverage that high quality middle schoolmathematics offers in improving mathematics education, K-16. The request for EisenhowerConsortia includes an additional $2.5 million to support technical assistance in mathematics andscience education. Use the findings from TIMSS to promote increased knowledge about U.S.standards, curriculum and teaching practices.

U.S. Department of Education FY 2000 Annual Plan, Volume 1 Page 85
n Improve the preparation and ongoing professional development of mathematics teachers.§ Emphasize the importance of providing sustained, intensive, high-quality professional
development for mathematics teachers. The $335 million request for Eisenhower ProfessionalDevelopment State Grants helps states train teachers to prepare their students to meet highstandards in all core subjects, but the program reserves $250 million for professional developmentin mathematics and the sciences.
§ Promote the improved preparation of teachers of mathematics by working with professionalmathematics organizations to develop exemplary standards for the mathematical preparation ofK-12 teachers and by supporting partnerships with the Title II funds of the Higher Education Actto improve teacher preparation programs.
n Encourage a more challenging and engaging curriculum for all students. In 1999, an expertpanel will release a list of mathematics programs and instructional materials that have been identifiedas promising or exemplary to help teachers and administrators select and implement high-qualitycurricula. Promote contributions to and use of the Federal Resources for Educational Excellence
Selected Accomplishments
Built public understanding of the mathematics needed by U.S. studentsfor the 21st century• ED developed, produced and sold more than 4,000 copies of Attaining Excellence: A TIMSS
Resource Kit. The kit provides a wealth of information about student achievement, teaching,and curricula from the Third International Mathematics and Science Study (TIMSS), theworld’s largest, most comprehensive, and rigorous international comparison of mathematicsand science education. The Eisenhower Consortia and Clearinghouse provided over 100training sessions on optimal use of these data-rich resource kits to make the findings widelyknown.
Established a national reform agenda and provided technical assistance• ED and the National Science Foundation (NSF) released in February 1998 An Action Strategy
for Improving Achievement in Mathematics and Science, which targeted middle gradesmathematics as a leverage point. As part of this action strategy, the National Academy ofSciences, the National Council of Teachers of Mathematics and the National Middle SchoolAssociation hosted a Convocation on Middle School Mathematics with the goal of establishingan agenda for action appropriate to the content and learning demands of early adolescence.The Eisenhower Regional Consortia and the NSF are coordinating their technical assistanceefforts with a focus on middle grades.
Developed and widely disseminated high quality materials onmathematics• Several high quality mathematics materials – including Improving Mathematics in Middle
School: Lessons from TIMSS and Related Research, Ideas that Work: MathematicsProfessional Development, Mathematics Equals Opportunity, and The Formula for Success: ABusiness Leader’s Guide – have been developed and widely disseminated to ongoing demand.Web site has been developed and updated to improve accessibility.
Worked to ensure coordination of local, state and federal resources insupport of high-quality and coherent mathematics programs• Provided technical assistance to states and districts through fall 1998 regional conferences co-
sponsored with NSF. Forthcoming reports from these conferences will highlight strategiesemerging from a ED-NSF funded study to better coordinate use of federal, state and localresources to improve mathematics achievement. Technical assistance was offered to Title IState Directors to determine the allocation of funds for math.

U.S. Department of Education FY 2000 Annual Plan, Volume 1 Page 86
(FREE) Web site of teaching and learning resources in mathematics and Gateways to EducationalMaterials (GEM) Web site of lesson plans for discipline-specific and grade-specific topics.
n Ensure that local, state, and federal resources are coordinated in support of high-quality andcoherent mathematics programs for all children, including disadvantaged, low-achievingstudents.§ Support state and local efforts to help disadvantaged, low-achieving students meet challenging
state and performance standards in mathematics (states were required to have standards in placeby the 1997-98 school year through the Title I Grants to Local Educational Agencies). TheDepartment is requesting $461 million for Goals 2000 State Grants, which will support thedevelopment of assessments aligned with content and performance standards in mathematics.
§ In partnership with NSF, provide technical assistance to states and districts through regionalconferences and reports on how to better use federal, state and local resources to improvemathematics achievement.
§ Disseminate a report based on a survey and case studies of districts that are demonstrationprojects for the coordinated use of resources. An increase to the Eisenhower Regional Consortiaprogram will expand their technical assistance efforts to teachers and schools particularly in high-poverty areas.
n Provide extra help and additional learning time to students who need it. To encourage collegesand universities to support mathematics tutoring, effective July 1, 1999, the federal government willpay 100% of the wages of Work-Study students who serve as mathematics tutors. The Work-Studywaiver enables college students who have an affinity for mathematics and science to gain valuablework experience as tutors while taking an active role in helping students prepare for algebra andgeometry by 8th grade and rigorous college-preparatory mathematics courses in high school.
n Use research and assessment for continuous improvement. The National Academy of Sciences isconducting a Mathematics Learning Study, scheduled for completion in spring 2000, which willexamine the factors that lead to successful mathematics learning and will provide research-basedrecommendations for the improvement of mathematics teaching and learning. ED promoted the 1999replication of the TIMSS assessment to interested states and districts that want to benchmark theirefforts against international standards. The National Institute on Student Achievement, Curriculum,and Assessment will continue support for research conducted by the National Center for ImprovingStudent Learning and Achievement in Mathematics and Science at the University of Wisconsin.
n Extend mathematics learning time opportunities in GEAR UP and 21st Century CommunityLearning Centers. Ensure that students have access to the gateway mathematics and science coursesthat prepare them for college. The President’s FY 2000 budget includes $240 million for GEAR UPto promote partnerships between higher education and middle or junior high schools in low-incomecommunities that can raise students’ expectations for college and their potential for success. Thebudget also includes $600 million for the 21st Century Community Learning Centers program, whichensures that students are in safe environments after school where learning skills can be enhanced.
Coordination with other federal agencies
n ED-NSF interagency strategy. Coordinate with Departments of Commerce, Interior, Transportation,Defense, Energy, the Environmental Protection Agency, National Institutes of Health, and theNational Aeronautical Space Administration (NASA), in partnership with NSF, to implement aninteragency action strategy for improving achievement in mathematics and science. This strategy will

U.S. Department of Education FY 2000 Annual Plan, Volume 1 Page 87
lay out a coordinated set of activities for NSF and ED, as well as other agencies, and guide budgetaryand programmatic priorities.
Programs supporting this objective
State Grantsn Title In IDEA State Grants (Part B)
Standards for mathematics instructionn Goals 2000: Educate America Act
Technical assistance and disseminationn Fund for the Improvement of Educationn Eisenhower Federal Activitiesn Eisenhower Regional Consortian Comprehensive Regional Assistance Centersn National Dissemination Activities
Teacher trainingn Eisenhower Professional Development State
Grantsn Higher Education Act (HEA), Title II
Researchn National Education Research Institutesn Regional Education Laboratories
Federal Activitiesn IDEA: Research and Innovationn Statistics and Assessment
Performance indicators and charts
Performance indicators for objective 2.3 focus on expected outcomes for students in mathematics and onprogress in implementing key strategies to achieve these results. The Department is assessing progresstoward this objective by monitoring national trends in student achievement in mathematics, teacherpreparation and ongoing professional development, student course taking, and schools’ access to and useof information on best practices for mathematics instruction.
Indicator 50. Increasing percentages of eighth-graders reach the basic, proficient, andadvanced levels in math on the National Assessment of Educational Progress (NAEP);on international assessments, at least 60% will score at the international average by2002.
Indicator background and context. U.S. students have shown progress in their mathematicsachievement on the National Assessment of Educational Progress (NAEP) over the years, yet many stillfail to achieve to the high standards needed for future success. In 1996, 62 percent of students scored at orabove the basic level on NAEP compared with 52 percent in 1996 (see Figure 52). In 1995, 45 percent ofU.S. eighth-graders scored at the international average on the Third International Mathematics andScience Study (TIMSS; see Figure 53). Although U.S. 4th graders performed above the internationalaverage in math, our 8th graders and 12th graders scored below the international average.

U.S. Department of Education FY 2000 Annual Plan, Volume 1 Page 88
Figure 52 Figure 53
Limitations of data. The NAEP main mathematics assessment is presently only given every four years.Verification/validation of measures. The NAEP assessment will be given again in 2000 and the TIMSSreplication is scheduled for the spring of 1999.Data source. National Assessment of Educational Progress (NAEP), 1990, 1992, 1996 MathematicsAssessment. The Third International Mathematics and Science Study (TIMSS), 1995 8th-gradeAssessment.
Indicator 51. Each year more students will have a solid foundation in algebra andgeometry by end of 8th grade.
Indicator background and context. The 8th grade is a critical point in mathematics education.Achievement at that stage clears the way for students to take rigorous high school mathematics andscience courses—keys to college entrance and success in the labor force (Mathematics EqualsOpportunity, White Paper, U.S. Department of Education, October 20, 1997). Understanding basicconcepts in algebra and geometry is a prerequisite for most higher-level mathematics courses.
Figure 54
Goal 45%
55%
0%
20%
40%
60%
80%
100%
1995 1999 2002
Percentage of Eighth-Grade Students Who Scoreat or Above the International Average on TIMSS
(Third International Math and Science Study)
Goal
20%25%
0%
20%
40%
60%
80%
100%
1992 1996 2000
Course-Taking in AlgebraPercent of Students Who Have Taken Algebra by the End
of Eighth Grade
èè èè
Goal èè
èè
52%
58%62%
70%
0 %
2 0 %
4 0 %
6 0 %
8 0 %
100%
1990 1992 1996 2000
Eighth Grade Performance in MathematicsPercentage of Eighth Grade Students Who Perform
at or Above Basic on NAEP
Goal

U.S. Department of Education FY 2000 Annual Plan, Volume 1 Page 89
Limitations of data. None.Verification/validation of measures. The NAEP student background questionnaire will be a componentof the 2000 Mathematics Assessment.Data source. National Assessment of Educational Progress (NAEP) student background questionnaire,1992, 1996 Mathematics Assessment.
Indicator 52. Each year, more new teachers will enter the workforce with adequatepreparation to teach challenging mathematics to students in kindergarten througheighth grade.
Indicator background and context. Teachers must know substantial mathematics and have strongpedagogical skills if they are to be effective in helping their students meet high standards (An ActionStrategy for Improving Achievement in Mathematics and Science, U.S. Department of Education,February 1998). Approximately 60% of 8th grade students had teachers who had majors in mathematicsor mathematics education in 1992 and 1996 (see Figure 55).
Figure 55
Limitations of data. None identified.Verification/validation of measures. The School and Staffing Survey (SASS) will be repeated in 1999-2000.Data Source: SASS, 1993-94; Teacher Quality: A Report on Teacher Preparation and Qualifications ofPublic School Teachers, 1999.
7 7 %8 2 %
0%
20%
40%
60%
80%
100%
1993-94 1998 2000
Teacher QualificationsPercent of Full-Time Public School Mathematics Teachers in
Grades 7 through 12 who Reported Having an Undergraduateor Graduate Major or Minor in Mathematics
èè èè Goal èè èè

U.S. Department of Education FY 2000 Annual Plan, Volume 1 Page 90
Indicator 53. Each year, more teachers of mathematics in grades 5-8 will completeintensive professional development to enable them to teach challenging mathematics.
Indicator background and context. To assist teachers in teaching challenging mathematics, teachersneed in-depth professional development activities that are based on mastery of mathematical content andtied to high-quality instructional materials. In 1993-94, only 28 percent of U.S. teachers of mathparticipated in an in-depth professional development program in mathematics (see Figure 56).
Figure 56
Limitations of data. The data include teachers whose main teaching assignment is science.Verification/validation of measures. SASS will be replicated in the 1999-2000 school year. The 1999Teacher Quality Study is a fast response survey using a nationally representative sample of teachers in1998.Data source. SASS, 1993-94, Teacher Quality: A Report on the Preparation and Qualifications of PublicSchool Teachers, 1999.
Indicator 54. Each year, increasing numbers of schools will have access to, and use,information on best practices for math instruction.
Indicator background and context. The TIMSS results showed that the content of curricula andinstructional materials used in U.S. classrooms in the middle school years in 1995 was less rigorous thanthose in high performing countries were. Schools need access to the best and most current information oninstructional strategies and materials to help their students achieve to high standards. Data show thatprincipals and teachers are making progress in linking their instructional strategies and materials to highstandards (see Figure 57).
31%
22%19%
0%
20%
40%
1 to 8hours
9 to 32hours
Morethan 32hours
Percentage of Teachers Who Participated inan In-depth Professional Development
Program in Mathematics or Science

U.S. Department of Education FY 2000 Annual Plan, Volume 1 Page 91
Figure 57
Limitations of data. None identified.Verification/validation of measures. Future indicator data will draw from the National LongitudinalSurvey of Schools (NLSS), a nationally representative survey of schools’ progress in implementingstandards-based reform.Data source: FRSS, Status of Education Reform in Public Elementary and Secondary Schools,Teachers’ Perspectives, 1999.
67% 69%
0 %
20%
40%
60%
80%
100%
Curricula InstructionalMaterials
Use of Standards in MathematicsPercentage of teachers who report using instructional materials and
curricula aligned with high standards
GoalGoal
1996 2000 1996 2000

U.S. Department of Education FY 2000 Annual Plan, Volume 1 Page 92
Objective 2.4: Special populations participate in appropriateservices and assessments consistent with high standards.
Context: Children with special needs should benefit from the same high-quality schooling as all students,and receive extra supports to help them succeed. These children—who are a focus of key elementary andsecondary education programs—may include students in high-poverty schools, students with limited-English proficiency or disabilities, migrant students, Native American students, and homeless students. Afederal emphasis on ensuring that high standards are set, appropriate assessments are in place, andsupports are available to their schools is critical to ensuring that these students are not left behind.
Federal support to schools plays a key role in ensuring that the needs of special populations are addressed.A January 1998 GAO report found that federal targeting of poor students through Title I and otherprograms has had the “effect of raising the additional funding for (those) students from the state-onlyaverage of $0.62 to a combined state and federal average of $1.10, a 77 percent increase.” In addition totargeting poor children, federal funds support states and districts in serving the needs of disabledpopulations, ensuring compliance with civil rights legislation, and increasing opportunities for otherstudents at risk of failure (e.g., those in the juvenile justice system).
External factors: In 1997, close to 20 percent of children were living below the poverty level. At thesame time, a correlation clearly exists between the poverty concentration of a school and expectations andachievement for students. Yet federal resources alone cannot fully address the needs of specialpopulations. Leveraging change and attention in states, districts, and schools to addressing the needs ofspecial populations is critical and must be considered within differing state and local policy contexts.
Key strategies
n Financial support for special populations.§ Request $8.43 billion for Title I Grants to Local Educational Agencies to help states and school
districts ensure that disadvantaged students in low-income communities are able to meet the samehigh standards expected of all children. The program gives states and schools substantialflexibility. This will be supplemented with an additional $380 million to support services tomigrant children.
§ Request $4.7 billion for IDEA Grants to States and Preschool Grants to improve the quality ofeducation for children with disabilities so that these children can, to the maximum extentpossible, meet the same challenging standards that have been established for all children, whilealso preparing them for employment and independent living.
§ Request $185 million for Bilingual Education Instructional Services, which support projectsdesigned to develop the English language skills of participating students and to help them meetthe same challenging standards expected of all students.
§ Request $74 million for Indian Education programs, which supplement the efforts of states, localdistricts, and Indian tribes to improve educational opportunities for Indian children.
§ Request $600 million for the 21st Century Community Learning Centers program to supportapproximately 4,000 before- and after-school programs—serving over 1.1 million students—which would keep schools open as safe havens while providing extended learning activities toimprove student achievement and prevent juvenile violence and substance abuse. In 2000, prioritywill be given to schools that are working to end social promotion by providing academic servicesfor low-achieving students.

U.S. Department of Education FY 2000 Annual Plan, Volume 1 Page 93
n Financial support for school infrastructure and capacity.§ Request authorization for nearly $22 billion in school modernization bonds for transformation or
renovation of public school facilities. One-half of the bond authority would be allocated to the100 school districts with the largest number of low-income children. The proposal calls for theissuance of $1l.1 billion in interest-free bonds in 1999 and an identical amount in 2000.
§ Request $500 million for the Technology Literacy Challenge Fund to support grants to states tobuy hardware, connect schools to the Internet, train teachers to use technology, and develop andbuy software. Funds are distributed to states on the basis of the Title I formula, and participatingstates are required to include long-term strategies for assisting the school districts with the largestnumbers or percentages of poor children and the greatest need for technology in the classroom.
n Appropriate services for all children.§ Promote attention, through federal monitoring and technical assistance, to tracking and promoting
measures of successful practices in addressing the needs of disadvantaged students.§ Work with states to improve their capacity to report and use disaggregated data on student
performance and other measures.
Selected Accomplishments
Developed and Disseminated Guidance to Improve Practices in TestingAll Students for High-Stakes Purposes• Promoted improved practices and attention to civil rights issues regarding high-stakes testing through the
development and dissemination of guidance to various audiences, and collaboration with nationalexperts—including panels convened by the National Academy of Sciences (NAS)—in determining newapproaches to address problems of discrimination in testing practices.
Promoted Success in Reading for All Students• Supported educators in gaining access to information and strategies for improving practices in reading,
through the wide dissemination of findings from the National Research Council report, Starting OutRight: A Guide to Promoting Children’s Reading Success to educators of students with limited Englishproficiency; establishment of a nationwide “Reading for Success Network” (through the ComprehensiveRegional Assistance Centers) to train reading teachers in Title I schools.
Supported Opportunities for Involving Families and Extending LearningTime for All Students• A significant majority of grantees (85 percent), supported through the 21st Century Learning Centers
program report that they plan to serve students at greatest risk of academic failure through extendedlearning programs held before- and after-school, on weekends and during the summer.
• Encouraged increased family involvement—particularly among Spanish-speaking parents—throughcollaboration with media outlets including UNIVISION, which broadcast “Educacion: La Tarea DeTodos” (Education: The Work of All) on stations throughout the country.
Developed Guidebooks on Turning Around Low Performing Schools andEnding Social Promotion• Prepared, in response to Presidential directives, guides for state and local leaders on transforming low-
performing schools and ending social promotion. Guidebooks highlight strategies for improving studentperformance through greater support and accountability for results.
Promoted Access and Accountability for Children with Disabilities.§ Final regulations implementing the 1997 Amendments to the Individuals with Disabilities
Education Act produced.

U.S. Department of Education FY 2000 Annual Plan, Volume 1 Page 94
n Appropriate assessments for all children.§ Prepare and disseminate guidance to states in submitting “final” assessment plans, which are to
include all children (including those with disabilities and limited English proficiency), as requiredunder Title I of the Elementary and Secondary Education Act and section 612 (a)(17) of IDEA.
§ Continue to disseminate and implement guidance on testing and assessments, developed by theOffice for Civil Rights, which may include high-stakes assessments of special populations.
§ Draw on the resources and expertise of a panel convened by the National Academy of Sciences,as well as identify and disseminate promising practices for assessing students (with limitedEnglish proficiency) at the state and local levels.
§ Disseminate results of research—conducted through the Office of Bilingual and MinorityLanguages Affairs, Office of Special Education and Rehabilitative Services, and the Office ofEducational Research and Improvement—that will inform the development of assessments for allchildren and strategies for accommodations.
§ Monitor to ensure that all children with disabilities are included in general assessments, asappropriate, and that children with disabilities who do not participate in general assessments areincluded in alternate assessments by July 2000.
n Highly qualified teachers.§ Promote the training and recruitment of teachers to serve children with special needs (e.g., limited
English proficiency and special education) and for high-poverty areas, as part of the President’sClass-Size Reduction Initiative.
§ Review and work with states and districts to encourage teacher recruitment and placementpractices that engage the least qualified staff to teach the most disadvantaged.
§ IDEA State Improvement Grants to States to implement their plans for system reform andrespond to their needs for highly qualified personnel.
n Research, dissemination, and implementation of effective practices.§ Expand the scope of ED-supported dissemination regarding the implementation of strategies to
support the education of students with special needs and in high-poverty districts, including thosesupported through the Comprehensive School Reform Demonstration program.
§ Request funding to support new research projects that develop designs to improve reading inEnglish for Spanish speakers.
§ Develop and implement a comprehensive Department-wide strategy for disseminating promisingpractices and guidance to targeted districts and schools (e.g., those serving the highestconcentrations of poor and limited English proficient students).
§ Continue to fund NIDRR Research and Training Centers focusing on children with disabilitiesand children with behavioral disorders.
§ Provide $50 million for a new Special Education Primary Education Intervention program toprovide competitive grants to school districts to develop, demonstrate, and evaluate research-based model interventions for children with developmental delays ages 3 through 9.
§ Continue the 5-year $10 million initiative begun in 1998 to provide training and disseminateinformation to state and local administrators, teachers, parents, and others on the implementationof the IDEA amendments of 1997, including access to challenging curricula, programs based onhigh expectations, and general assessments.
n Extending opportunities for learning.§ Continue to support after-school activities through 21st Century Community Learning Centers
that are of particular benefit to special populations, through financial support, technicalassistance, information sharing, and development of a guide on continuous improvement projectmanagement.

U.S. Department of Education FY 2000 Annual Plan, Volume 1 Page 95
Coordination with other federal agencies
n Children of families with special needs. Expand coordination efforts with the Departments ofHealth and Human Services and Labor to ensure that children from families moving from welfare towork and others with special needs (e.g., migratory workers, homeless families) receive opportunitiesto participate fully in educational activities—including the Child Health Insurance Program.
n Research. Continue to support the efforts of the National Institute for Child Health and Development(NICHD) in studying ways in which Spanish-speaking children can best learn English.
n President’s Hispanic Education Initiative. As the lead agency for the President’s HispanicEducation Initiative, build upon public and private partnerships to support increased family andcommunity involvement in education. For example, with the Partnership for Family Involvement,promote America Reads and other efforts to support a greater emphasis on reading through Spanishlanguage television (e.g., UNIVISION), radio, and print media.
n Executive Order on American Indian and Alaska Native Education. Support programmaticstrategies—including dissemination and support for the implementation of comprehensive reformstrategies—and conduct research related to the education of Native Americans, as determined by aninteragency task force.
n Support for homeless and migrant children. Continue to participate—as a member of a federalinteragency council on homelessness—in developing collaborative strategies to address the uniqueneeds of homeless children that pose barriers to student achievement. Support migrant technologygrants and multi-state consortia established to develop materials and implement procedures, acrossstates, for addressing the needs of migrant children—particularly those related to their mobility.
n Juvenile justice. Coordinate with the Department of Justice in supporting and disseminatingimproved state-level strategies for the collection, analysis and use of data regarding youth who areplaced in juvenile facilities.
n Improving services for children with disabilities. Continue to collaborate with the Public HealthService in providing technical assistance and disseminate information to improve mental healthservice delivery in schools.
Programs supporting this objective
Grants to states, districts and schools for directservicesn Goals 2000 Grants to Statesn Title I Grants to Local Educational Agenciesn Comprehensive School Reform
Demonstrationsn 21st Century Community Learning Centers
Research and evaluationn National Education Research Institutesn IDEA: Research and Improvementn Statistics and Assessmentn National Institute on Disability and
Rehabilitative Research (NIDRR)
Targeted grants to support special populationsn Even Startn Title I Migrant Educationn Title I Neglected or Delinquentn Education of Homeless Children and Youthn IDEA State Grants programs (Part B & C)n Indian Educationn Bilingual Educationn Adult Educationn TRIO Higher Education Programsn IDEA Priority Education Interventionn IDEA Technical Assistance and
Disseminationn IDEA State Improvement

U.S. Department of Education FY 2000 Annual Plan, Volume 1 Page 96
n Disseminationn Regional Labs
Programs in other agenciesn Bureau of Indian Affairs (Interior)n Homeless Assistance Programs (HHS, HUD,
USDA, Labor)n Migrant Assistance Programs (HHS and
Labor)n School Modernization Bonds (Treasury)
Program Supportn Office for Civil Rights
Performance indicators and charts
ED is monitoring this objective by examining progress by states, districts and schools in implementingeffective strategies for teaching students with special needs, and tracking the results. Outcomes aremeasured by examining trends in the achievement of students in high-poverty schools compared tooverall national achievement.
Indicator 55. Increasing percentages of students in high-poverty schools will reach thebasic level or higher levels of proficiency in reading and math on the NationalAssessment of Educational Progress (NAEP), compared to those for the nation.
Indicator background and context. School poverty has a substantial impact on student achievement, asillustrated by the low percentages of fourth graders in high-poverty schools scoring at or above the basiclevel in reading and math on NAEP. The goal is to bring the scores closer to that for all schools.
Figure 58 Figure 59
(High-poverty schools are defined as those in which more than 75% of the students are eligible for free or reduced-price lunch. Low-poverty schools enroll fewer than 25 % students eligible for free or reduced-price lunch.)
Trends in NAEP Reading PerformanceAverage Scale Scores
9-Year-Old Public School Students by Poverty Level of School (1988 to 1996)
217221 220 220
225
190 189180 184
188
211 209 209 209 210
160
180
200
220
240
260
1988 1990 1992 1994 1996
(Pre-reauthorization)
Low Poverty Schools High Poverty Schools All Schools
Scaled scores are 0-500.
NA
EP
mea
n s
cale
sco
re 228237 236 239 238
208213
208215 217219
230 228 229 230
160
180
200
220
240
260
1986 1990 1992 1994 1996
(Pre-reauthorization)
Low-poverty Schools High-poverty Schools All Schools
Trends in NAEP Mathematics PerformanceAverage Scale Scores of 9-Year-Old Public School Student
by Poverty Level of School (1986-1996)
Scale scores are 0-500

U.S. Department of Education FY 2000 Annual Plan, Volume 1 Page 97
Reading. While students in low-poverty schools improved their reading scores from 1988 to 1996, scores ofstudents in high-poverty schools have only begun improving since 1992. From 1992 to 1996, scores of 9-year-oldsin high-poverty schools rose by 8 scale score points, or close to a grade level of improvement.
Math. Improvement in mathematics has occurred most appreciably for students in high-poverty schools since 1992,rising by 9 points, or one grade level. The Department of Education’s target is to improve the mathematics andreading performance of students in high poverty schools, such that by the year 2000, at least 50% of these studentsperform at or above the basic level on NAEP.
Figure 60
Limitations of the data. Main NAEP data for reading and math can only be reported every four years.Verification/validation of measures. National Center for Education Statistics.Data source(s). U.S. Department of Education, Planning and Evaluation Service. (1998, September).School Poverty and Academic Performance: NAEP Achievement in High-Poverty Schools. A SpecialEvaluation Report for the National Assessment of Title I. U.S. Department of Education, National Centerfor Education Statistics (1999 February), National Assessment of Educational Progress (1998 Reading).
Indicator 56. States will implement appropriate procedures for assessing and reportingprogress towards achieving to high standards by students who have disabilities, havelimited English proficiency, or are children of migrant workers, by 2001.
Indicator background and context. By 2000-2001, Title I of ESEA requires that states developassessment systems, that include appropriate procedures for assessing and reporting progress of studentswho have disabilities, have limited English proficiency, or are children of migrant workers. In addition,the recent reauthorization of IDEA requires that states include students with disabilities in theirassessment systems.
Percentage of 4th Grade Students in High-Poverty Public Schools Scoring at or Above the
Basic Levels in Math and Reading
42%50%
32%
50%
0%
10%
20%
30%
40%
50%
60%
1996 Math 1998 Reading 2000 Math 2002 Reading
Goal

U.S. Department of Education FY 2000 Annual Plan, Volume 1 Page 98
Figure 61
Limitations of the data. Data were collected in 1997, and current results could differ as a result ofchanging policies. In addition, the results reported address at least one component of state testingprogram. States may have other testing components that do not include accommodations.Verification/validation of measures. The CCSSO collects data directly from State AssessmentDirectors, who are responsible for the systems that are reported.Data source(s). Council of Chief State School Officers. (1998). Trends in State Student AssessmentPrograms, Fall 1997.
Indicator 57. The number of schools using comprehensive, research-based approachesto improve curriculum and instruction, and support services for at-risk students willincrease annually.
Indicator background and context. A key principle of Title I and other federal programs supportingspecial populations is that all children receive an “enriched and accelerated instructional program,” that isbased on challenging standards.
Figure 62
38
46
11 10
05
101520253035404550
LEP IEP
TestingAccommodation
AlternativeAssessment
Testing Accommodations for Limited-English ProficientStudents and Students with IEPs (1997)
Year 2000 targetfor all
accommodations:50 states
49%
37% 34%
66%
44%
54%
Strategic Plan Assessments linked tocontent standards
Assessments used foraccountability
Low - Poverty Schools 0-34 FRPL High - Poverty Schools 75%-100% FRPL
Year 2000 targetfor all reform
strategies: 75%
100%
80%
60%
40%
20%
0%
Percentage of Principals who Reported that Their School isImplementing the Following Reform Strategies to a Great Extent

U.S. Department of Education FY 2000 Annual Plan, Volume 1 Page 99
Limitations of the data. Baseline data reported serve as a proxy for indicator. They do not address theimplementation of research-based strategies, which will be covered in subsequent reports.Verification/validation of measures. Subsequent independent evaluations conducted by the Planningand Evaluation Service will report on progress in implementing reforms among high-poverty schools andschools serving large concentrations of LEP children.Data source(s). Follow-up Survey of Schools, 1997-98, unpublished tabulations.
Indicator 58. Increasing percentages of administrators and educators working with at-risk children will have access to and use high-quality information and technicalassistance on effective practices.
Indicator background and context. A key principle of Title I and other federal programs supportingspecial populations is that staff in high-poverty schools will have opportunities for appropriateprofessional development. The indicator reports on those sources of information that are described asmost helpful by principals.
Figure 63
Limitations of the data. Data reported address ‘helpfulness,’ but not the quality of various sources ofassistance.Verification/validation of measures. Current case studies will be examined to validate findings.Additionally, subsequent independent evaluations conducted by the Planning and Evaluation Service willreport on the quality of federally supported assistance, along with other types of assistance.Data source(s). Baseline: NCES. (1998). Status of Education Reform in Public Elementary andSecondary Schools: Principals’ Perspectives. Follow-up Survey of Schools, 1997-98, unpublishedtabulations.
Indicator 5. Increasing percentages of teachers will be equipped with strategies toenable students with limited English proficiency or disabilities to meet challengingstandards.
Indicator background and context. The growing number of limited English proficient students requiresan increase in the number of teachers trained to address their particular needs. At the same time, increased
35%27%
32%36%
23%19%
0%
20%
40%
60%
80%
100%
School districts Professionalassociations
Publications
1996 (FRSS)
1998 (Follow -up Survey)
Sources and Technical Assistance on Comprehensive ReformFound “Very Helpful” by Principals in High-Poverty Schools(Principals in schools serving 75% or more low-income children)

U.S. Department of Education FY 2000 Annual Plan, Volume 1 Page 100
accountability for all students requires greater attention to the training of teachers serving students whoare most at risk.
Figure 64
Limitations of the data. Baseline data serve as a proxy for the indicator and are dated (1993-94). The(1999) Schools and Staffing Survey will provide an update.Verification/validation of measures. National Center for Education Statistics.Data source. NCES (1997, January). A Profile of Policies and Practices for Limited English ProficientStudents (SASS 1993-94).
Indicator 60. Federal technical assistance and other support to states will result inannual increases in the number of states and local school districts with the capacity todisaggregate and report on assessment data aligned with standards for at-risk students.
Indicator background and context. By 2000-2001, Title I of ESEA requires that states establishaccountability systems that track the progress of students from special populations (e.g., limited Englishproficient), and report to parents and local communities.
Figure 65
Number of States that ReportPerformance Results for At-Risk Students
50 50
1611
0
10
20
30
40
50
Limited Englishproficient children
Children from LowIncome Families
1998 2000 1998 2000
Goal Goal
States
Teachers with Training in Teaching LEP Students, by Percent ofLEP Students in Class: 1994
Percent of LEP Students in Class
19%
48%
87%
0%
20%
40%
60%
80%
100%
Less than 10% 10% to 50% More than 50%
Year 2000 target for100% of teachers inclasses with >50%
LEP students

U.S. Department of Education FY 2000 Annual Plan, Volume 1 Page 101
Limitations of the data. Updated information reflect what was reported to ED through the Title Iperformance report. Edit checking is underway.Verification/validation of measures: Independent program evaluations by the Planning and EvaluationService will validate state-reported program information.Data source(s). Council of Chief State School Officers. State Education Indicators with a Focus on TitleI, 1997; Title I Performance Report for 1996-97 (preliminary data).

U.S. Department of Education FY 2000 Annual Plan, Volume 1 Page 102
Goal 3. Ensure access to postsecondary education andlifelong learning.
Postsecondary education is becoming increasingly important to both the individual and thenation's well being. Given current trends, at least two years of postsecondary education will beincreasingly necessary in the next century to gain higher earnings and improved job opportunities.Although American higher education is the envy of the world, almost 40% of our own highschool graduates do not immediately attend postsecondary education. Moreover, postsecondaryenrollment and completion rates are significantly lower for blacks and Hispanics and for studentsfrom lower- and middle-income families than for whites and those from higher-income families.Although enrollment rates have been rising in recent years, postsecondary education remains anelusive option for too many American high school graduates.
Besides helping to ensure postsecondary training for our young people, it is also essential that weencourage lifelong learning, whether it be graduate school or adult basic education, advancedtechnical training or training in job entry skills. This includes many for whom lifelong learningopportunities are of special importance, such as persons with disabilities, adults lacking basicskills, and those whose job skills need upgrading or who require retraining because of labormarket changes. Persons with disabilities are at least twice as likely as people without disabilitiesto be unemployed which is estimated to cost society in excess of $2 billion annually. In addition,the National Adult Literacy Survey of 1992 showed that at least 21% of adults age 16 and olderlacked basic reading and math skills needed for well-paying jobs or entry into higher education.
To help guarantee access to postsecondary education and lifelong learning, we need to continueto make progress in four key areas, ensuring that:
1. All students leave high school with the academic background and preparation to pursuepostsecondary education. Movement toward achievement of Goals 1 and 2 will go a longway toward making this a reality. We also need to help motivate students to continuetheir education beyond high school by providing them with earlier and better informationabout what the benefits of postsecondary education are, what admission requirements are,how much college costs, and how they can get financial aid to help pay postsecondarycosts.
2. All students motivated and academically ready to attend postsecondary education havethe financial resources and support services needed to do so.
3. The student aid delivery system is efficient, financially sound, and customer-responsive.
4. Best practices are identified and performance data systems are updated.These steps greatly enhance the quality of the rehabilitation and adult education programsby providing feedback for program development, supporting coordination with otherfederal agencies, and improving employment outcomes for adults on welfare, withdisabilities, and/or low levels of skills and education.

U.S. Department of Education FY 2000 Annual Plan, Volume 1 Page 103
Use of Evaluations and Assessments in Developing Goal 3
In developing our goals, objectives, and strategies in Goal 3, ED relied on a number ofevaluations, research studies, and management analyses, including:
• A number of research studies have been and are being conducted using data collected by theNational Center for Education Statistics and the Census Department and targeted studies ofspecific populations affected by changes in legislation or policy. These studies are being usedto assess the educational effects of the student aid programs and to help pinpoint wherebarriers to postsecondary education and lifelong learning remain for certain groups within thepopulation. Strategies are then developed to help overcome these barriers.
• A series of management analyses -- including the Direct Loan evaluation, customersatisfaction surveys, and studies of the “gatekeeping” process that determines whichpostsecondary institutions are eligible to participate in the student aid programs -- aided in theidentification of successes and problems in the management of the student aid programs.Another major source of information has been the General Accounting Office (GAO) reportson student financial aid management.
• Evaluations of the Upward Bound, Student Support Services, adult education, and vocationalrehabilitation programs were used to identify critical strategies for program improvement. Forexample, prior studies on adult education made it clear that the field urgently needsinformation on effective practices and improved state and local performance data, both ofwhich are plan strategies as well as current evaluation priorities.

U.S. Department of Education FY 2000 Annual Plan, Volume 1 Page 104
Objective 3.1: Secondary school students get theinformation, skills, and support they need to preparesuccessfully for postsecondary education.
Context: The Department of Education supports significant levels of postsecondary student financialassistance--estimated to exceed $52 billion for FY 1999. Research has shown, however, that informationabout the benefits of college, academic requirements, and the availability of financial aid can be as critical asensuring financial assistance in motivating students and families to begin planning early for collegeeducation. The major strategy to achieve objective 3.1 is to disseminate information and provide supportservices to a broad range of students and families, focusing on students and their families beginning in themiddle-school years and continuing throughout secondary school.
External factors: Student preparedness for college is dependent on many factors, including schoolexperiences in grades K-12, family and outside influences, and individual motivation and expectations. Although family and other influences will continue to have a strong bearing on student success, theDepartment of Education will work to provide information and support to as many students and families aspossible through publications, Web sites, and promotion of family involvement through the new GEAR UPprogram. In addition, the ability of the Department to provide faster electronic notification of financial aideligibility is dependent on approval of the electronic signature.
Key strategies
n Support services to help students prepare for postsecondary education.§ As authorized in the 1998 Higher Education Amendments, the new GEAR UP program will provide
low-income children with additional counseling, mentoring, academic support, outreach, andsupportive services as well as information on the benefits of college, academic requirements, andfinancial aid opportunities through state programs and partnerships of colleges, middle and juniorhigh schools, businesses, and community organizations. The $240 million budget request for GEARUP in FY 2000 would provide services to almost 381,000 students in high-poverty schools.
§ The $630 million request for TRIO programs would increase support for the Upward Bound andTalent Search programs, which identify disadvantaged middle-school and high school students andprovide academic and career counseling, information, and assistance on postsecondary admission andfinancial aid, and tutoring services. The FY 2000 budget request of $630 million for TRIO wouldprovide services to almost 377,000 Upward Bound and Talent Search students.
§ The budget includes $55 million for the School-to-Work Opportunities program, which helps statesimplement systems connecting secondary school classrooms to the world of work and preparingstudents for a wide range of postsecondary education opportunities.
n Foundation partnership to support the GEAR UP program.§ The Department will work with the Ford Foundation to promote the GEAR UP program, provide
information to help GEAR UP grantees implement high-quality projects, and support continuousprogram improvement.
n National campaign for middle-school students.§ A new $15 million Preparing for College program would develop a series of media products
including videos and publications, to support the GEAR UP program and to inform middle- and high

U.S. Department of Education FY 2000 Annual Plan, Volume 1 Page 105
school students and their families, as well as the general public, about the steps needed to attendcollege and financial aid opportunities. A major product will be a toolkit for schools and communityorganizations containing reference information about postsecondary education costs, benefits, andpreparation. In addition, this program would encourage adult learners to take advantage of the newtax credits for postsecondary education by going back to school to learn new skills.
§ The Think College Early Web site will continue to provide information to the public aboutpostsecondary education.
n A student- and family-focused system to support postsecondary education using computer andinformation technologies.§ Simplify the process of electronically applying for student financial aid through the World Wide
Web.§ Coordinate with partners in the community, including schools, lenders, and guarantee agencies, to
establish industry standards for data exchanges needed to operate the system.
n Vocational education support for technical skill training.§ The Department's budget request for $1.142 billion for Vocational Education State Grants and Tech-
Prep Education will support state and local efforts to increase students' technical skills, integrateacademic and vocational education, link secondary and postsecondary education, relate classroomlearning to experiences outside the classroom in the workplace, and develop models of high schoolreform.
Coordination with other federal agencies
n Public awareness campaigns. Continue to obtain input and support from numerous public and privateorganizations, such as the National Middle School Association, College Board, and Boy Scouts ofAmerica (Learning for Life), in designing and implementing the Preparing for College program, ED-NSFnational mathematics public engagement campaign, and GEAR UP program. In addition, work to ensurethat the three programs are well coordinated and mutually reinforcing.
n Dissemination of research. Coordinate the TRIO clearinghouse with other ERIC clearinghouses tobetter disseminate research on the preparation of disadvantaged youth for postsecondary education.
Selected Accomplishments
Created new early intervention program to prepare students for college.§ Enacted under the Higher Education Amendments of 1998, GEAR UP (Gaining Early Awareness
and Readiness for Undergraduate Programs) will provide grants to states and to local partnershipsof colleges, middle and secondary schools, and community-based organizations to providecomprehensive mentoring, tutoring, information, and other support to help disadvantaged studentsprepare for college beginning in the middle school grades.
Promoted public understanding through “Think College Early” campaign.§ Department-wide effort resulted in the development of a Web site for middle-grade students,
parents, and educators; a “listserv” for institutions of higher education, community-basedorganizations, guidance counselors, principals, and other providers of early college awarenessinformation and programs; and the development of publications for middle-grade students and fororganizations interested in establishing mentoring programs to promote college-going.

U.S. Department of Education FY 2000 Annual Plan, Volume 1 Page 106
Programs supporting this objective
Information and support servicesn GEAR UPn Preparing for Collegen TRIO (Upward Bound and Talent Search)n School-to-Work Opportunitiesn Migrant education (HEP and CAMP)n IDEA State Grants (Part B)n IDEA Technical Assistance and Dissemination
(Part D)n National Technical Institute for the Deafn Gallaudet University
Researchn Statistics and Assessmentn IDEA Research and Innovation (Part D)
Vocational Educationn Vocational Education State Grantsn Tech-Prep Education
Performance indicators and charts
The performance indicators included in the Strategic Plan for objective 3.1 relate to expected outcomes of theearly college awareness postsecondary education programs and improvements in the student financial aidapplication system, including increasing college enrollment rates, particularly for low- income students;creating greater awareness of the costs of attending college, the availability of financial aid and the academicrequirements of college enrollment; and reducing the time needed to process financial aid applications.
Indicator 61. Postsecondary education enrollment rates will increase each year for allstudents, while the enrollment gap between low- and high-income and minority andnon-minority high school graduates will decrease each year.
Indicator background and context. From 1975 through 1996, the postsecondary education enrollmentrates of both low- and high-income students tended to increase. However, despite some fluctuations, the gapin enrollment rates between these groups has remained fairly stable over this period. The Preparing forCollege program, GEAR UP program, TRIO programs, and reform efforts at the elementary and secondaryschool level are designed to increase student interest in, and preparation for, postsecondary education, therebyleading to continued increases in postsecondary enrollment rates, particularly for low-income students.
Figure 66

U.S. Department of Education FY 2000 Annual Plan, Volume 1 Page 107
Limitations of the data. The October CPS data are based on fairly small samples, which may result in largeyear-to-year fluctuations, particularly among subgroups.Verification/validation of the data. The October CPS data collected by Census are subject to strictmethodological standards.Data source(s). U.S. Department of Commerce, Bureau of the Census, October Current Population Surveys,updated annually.
Indicator 62. Increasing percentages of students from age 12 through high school andtheir parents will have an accurate assessment of the cost of attending college and theaid available for college by 2002.
Indicator background and context. Parent and student estimates of the cost of postsecondary education canreasonably be expected to influence student preparation for college and enrollment behavior. Significantoverestimation of college costs by parents and students may indicate a perceived barrier to postsecondaryenrollment that could affect student behavior and academic preparation.
Figure 67
Limitations of the data. No data about student perceptions of college costs are currently available. Generallyspeaking, it is significantly more difficult to survey students than parents. Beginning in 1999, data on parent
Estimates of College Tuition by Parents ofMiddle-School Children, 1998
$1,500$3,110
$13,660
$6,550
$10,200
$19,840
$0
$5,000
$10,000
$15,000
$20,000
$25,000
2-Year Public 4-Year Public 4-Year Pr ivate
Co
lleg
e T
uit
ion
Actual tu i t ion Parents ' es t imate
Percentage of High School Graduates (ages 16-24)Enrolled in College, by Family Income
1975-1997
0%
20%
40%
60%
80%
100%
75 77 79 81 83 85 87 89 90 91 92 93 94 95 96 97
(Low income-bottom 20%, High income =top 20%)
High-Income
Low-Income
ContinuouslyImprove and
Close Gap

U.S. Department of Education FY 2000 Annual Plan, Volume 1 Page 108
and student perceptions of college costs will be obtained biannually through the National HouseholdEducational Survey (NHES).Verification/validation of measures. Gallup’s methods for selecting samples and conducting telephonesurveys have been tested through extensive use and are subject to strict methodological standards.Data Source(s). Gallup survey of parents of middle school students, 1998. Beginning in 1999, parent andstudent data will be gathered through NHES, which is conducted biannually by NCES.
Indicator 63. The percentage of students from age 12 through high school and theirparents who obtain information on the academic requirements for college orpostsecondary vocational enrollment will increase annually.
Indicator background and context. Research indicates that academic preparation, including course-takingpatterns in middle school and high school, are associated with an increased likelihood of going to college.Greater awareness of the academic requirements for college and of the importance of challenging courseworkis likely to increase students’ academic preparation for college.
Figure 68
Limitations of the data. No data about the extent to which students’ obtain information on the academicrequirements for postsecondary education are currently available. Generally speaking it is significantly moredifficult to survey students. Beginning in 1999, data on parents’ and students’ ability to obtain informationon academic preparation for college will be obtained biannually through NHES.Verification/validation of measures. Gallup’s methods for selecting samples and conducting telephonesurveys have been tested through extensive use and are subject to strict methodological standards. Beginningin 1999, parent and student data will be gathered through NHES, which is conducted biannually by NCES.Data Source(s). Gallup survey of parents of middle school students, 1998.
Indicator 64. By October 2001, there will be a single point of contact that allowsstudents to get information on federal student aid, apply for aid, and have their
18%27% 31%
39%31%
52%
0%
20%
40%
60%
80%
100%
Under $20,000
$20,000-$34,999
$35,000-$49,999
$50,000-$74,999
$75,000-$99,999
$100,000-and over
Parents of Middle School Children’s Desire for Information AboutAcademic Preparation for College: By Income Level, 1998
(% of parents reporting that they have enough information about courses their childshould take for college)
Long-term target: To increase the availability of information on the academicrequirements for college, particularly for low-income students and families.

U.S. Department of Education FY 2000 Annual Plan, Volume 1 Page 109
eligibility for aid determined within four days of electronic application, cutting in halfthe current processing time. (Requires congressional approval of electronic signature.)
Indicator background and context. The current processing time for electronic applications for federalstudent financial aid is eight days. A streamlined mechanism for electronically applying for student financialaid through the World Wide Web will give prospective students and their families a single electronic point ofcontact for all federal student aid programs, and eventually, with the cooperation of the postsecondaryeducation community, this system will respond to all their financial aid questions, including estimates oflikely federal aid amounts and costs associated with attending specific schools. Note that a reduction in theprocessing time for electronic applications from eight to four days can only be achieved with approval fromCongress of the electronic signature.
Figure 69
Limitations of the data. None.Verification/validation of performance measures. The Department obtains management informationsystem (MIS) reports on the number of applications received through various mechanisms (paper, electronic,etc.).Data source(s). Program data.
8 days
4 days
1997 20010
2
4
6
8
10
Processing Time for Electronic StudentFinancial Aid Applications
Goal
Requires approval of electronic signature
Days

U.S. Department of Education FY 2000 Annual Plan, Volume 1 Page 110
Objective 3.2: Postsecondary students receive the financialaid and support services they need to enroll in and completea high quality educational program.
Context: Progress made toward achievement of Goals 1 and 2 and Objective 3.1 will help ensure that allstudents are prepared for college. The major strategy being used to achieve Objective 3.2 is to providestudents with the financial and support services they need to achieve their postsecondary educationalobjectives. This assistance is designed to help overcome the financial and other barriers that make it difficultfor lower- and middle-income students to attend and complete postsecondary education.
External factors: The affordability of postsecondary education depends not only on the amount of studentfinancial assistance provided by the federal government but also on decisions made by States, postsecondaryinstitutions, and other organizations concerning what students are charged to attend school and the amount ofnon-federal student aid made available. While the Department cannot control what other actors in the systemdo, we can and will use public pressure to try and keep postsecondary costs low and the availability of non-federal aid high. We will also continue to publish information concerning postsecondary institutions soconsumers can make cost-effective enrollment decisions. In addition, general economic conditions affectpostsecondary affordability and, therefore, the Department incorporates expected future economic conditionsinto our forecasts of funding requirements for the Title IV student aid programs.
Key strategies
n Student financial assistance. If enacted, the Department’s FY 2000 budget would provide more than$52 billion in grant, loan, and work-study assistance to 8.8 million postsecondary students:§ A $7.5 billion request for Pell Grants would increase the maximum award by $125 to $3,250, the
highest ever, and provide grants to nearly 3.9 million students.§ A $934 million request for Work-Study (an increase of $64 million) would allow approximately 1
million students work their way through college.§ Modification of the allocation formula for the three campus-based aid programs (Work-Study,
Supplemental Educational Opportunity Grants, and Perkins Loans) would gradually distribute alarger share of appropriated funds on the basis of institutional need.
§ The Federal Family Education Loans and Federal Direct Student Loan programs would support9.5 million loans to postsecondary students totaling an estimated $41.2 billion.
§ The new D.C. Resident Tuition Support initiative would allow graduates from D.C. public andprivate high schools to pay in-state tuition at all Maryland and Virginia colleges.
§ The Distance Learning Demonstration program would assess on an experimental basis the expansionof student aid eligibility for distance learners by waiving certain restrictions contained in the currentstudent aid law.
§ The Byrd Honors Scholarships and Graduate Assistance in Areas of National Need programs wouldreward high levels of academic achievement by providing more than $80 million in scholarships tosupport outstanding undergraduate and graduate students.
n Support services for postsecondary students. Besides providing financial assistance to help studentsenroll in and complete postsecondary education, the Department also supports programs that providestudents with the non-financial services needed to achieve their educational objectives.§ The $630 million request for TRIO would enhance the Student Support Services and McNair
programs, which are designed to encourage individuals from disadvantaged backgrounds to completecollege and pursue graduate studies. The request would fund services to an estimated 182,000disadvantaged postsecondary students.

U.S. Department of Education FY 2000 Annual Plan, Volume 1 Page 111
§ The new College Completion Challenge Grants program would provide $35 million to helpinstitutions of higher education increase the persistence rate of students who are at risk of droppingout of college.
§ Improve the provision of support services to students by redesigning performance reports anddisseminating information regarding effective practices.
n Improve the quality of postsecondary education. While most of the Department’s efforts support thedirect provision of assistance to students, whether it is financial or non-financial, the Department alsoplays a significant role in helping to improve the quality of postsecondary education.§ The FY 2000 request of $521 million (a $41 million increase over FY 1999) requested for the Aid
for Institutional Development, Developing Hispanic-Serving Institutions, and Howard Universityprograms will help enable institutions serving high percentages of minority and disadvantagedstudents to provide these students a high quality postsecondary education. In addition, continuedefforts will be made to promote sharing of “best practices” among institutions.
§ The $27.5 million requested for the Fund for the Improvement of Postsecondary Education (FIPSE)will enable the Department to continue to promote successful postsecondary education reformefforts. Priorities for FY 2000 funding will be grants aimed at helping to control the cost ofpostsecondary education and at enhancing dissemination activities.
§ A doubling of funding (from $10 million to $20 million) for the recently created Learning AnywhereAnytime Partnership program will continue to encourage the development of innovative techniquesto enhance the delivery of high quality postsecondary education and lifelong learning opportunitiesfor all citizens, in all settings.
Use of tax expenditures
There are a number recently enacted changes in the tax law designed to make postsecondary education moreaffordable. These include the HOPE Scholarship tax credit, the Lifetime Learning tax credit, expanded
Selected AccomplishmentsReauthorization of the Higher Education Act§ Agency-wide efforts resulted in the enactment of the Higher Education Amendments of 1998.
This reauthorization included several key administrative initiatives:§ Increasing college access by reducing interest rates for students.§ Increasing college access by promoting high-quality distance education initiatives.
Opening the Doors of College to all AmericansThe Fiscal Year 1998 and 1999 budgets provided for substantial increases in student aid as well asseveral major tax initiatives helping to make college affordable for all Americans.§ Increased funding for the Pell Grant Program from $5.9 billion in FY 1997 to 7.7 billion in FY
1999; an increase of $425 in the maximum Pell award during this period. This represented thelargest increase in the maximum award in 25 years.
§ Increased funding for the Federal Work-Study (FWS) program helping approximately 930,000students work their way through college. In addition, encouraged hundreds of colleges to provideopportunities for work-study students to participate in the America Reads Challenge to helpensure all children can read well by the third grade.
§ Worked with the Treasury Department to pass and implement several tax initiatives to helpfamilies pay for college, including the Hope Scholarship and Lifetime Learning tax credits, whichcould benefit some 13 million families.
Outreach to Postsecondary Institutions§ Sponsored a national conference attended by 700 college presidents and senior administrators to
promote sharing of "best practices" in retention, recruitment, and access at Title III institutions.§ Conducted various outreach efforts to raise awareness of Year 2000 computer issues at
postsecondary institutions including establishing a web-site that receives over 18,000 hits amonth, sending a Year 2000 Readiness Kit to all schools, and making presentations at over 35professional conferences.

U.S. Department of Education FY 2000 Annual Plan, Volume 1 Page 112
opportunities for saving for college, and tax deductions for interest paid on student loans. A more detaileddiscussion of these items is contained in the section on the use of tax expenditures at the end of the report.
Coordination with other federal agencies
n Work with the Treasury Department.§ Consult with the IRS regarding publications for students and schools regarding steps needed for
taxpayers to claim the Hope Scholarship and Lifetime Learning tax credits, and student loan interestdeduction.
§ Consult with the Treasury Department on the setting of student loan interest rates.
Programs supporting this objective
Student grants and loansn Pell Grantsn Campus-based programsn Federal Family Education Loansn Direct Student Loansn D.C. Resident Tuition Support Program
Aid to higher education institutionsn Aid for Institutional Developmentn Howard Universityn Developing Hispanic-Serving Institutionsn National Technical Institute for the Deafn Gallaudet University
Student Fellowshipsn International Education and Foreign Language
Studiesn Byrd Honors Scholarshipsn Graduate Assistance in Areas of National Need
Student Supportn TRIO (Student Support Services and McNair)n College Completion Challenge Grants
Research, innovation and improvementn Fund for the Improvement of Postsecondary
Educationn Statistics and Assessmentn Learning Anytime Anywhere Partnerships
Performance indicators and charts
The performance indicators included in the Strategic Plan for objective 3.2 relate to expected outcomes forfour postsecondary education programs such as increasing graduation rates, particularly for low incomestudent; reducing unmet need and debt burden; and ensuring that recipients of the TRIO programs benefitfrom the services they receive. Indicators relating to the Department’s delivery of the postsecondary educationprograms are included under objective 3.3. The Department is currently undertaking several efforts to obtainmore timely data for each of the indicators
Indicator 65. Unmet need (the percentage of a student’s total cost of education that isnot met by student and family contribution and all sources of financial aid) -- ameasure of opportunity or access to postsecondary education -- will show decreasesover time, especially for low-income students.

U.S. Department of Education FY 2000 Annual Plan, Volume 1 Page 113
Indicator background and context. Trends in unmet need provide a good measure of how the affordabilityof postsecondary education is changing over time. Not surprisingly, lower- and middle-income students havehigher amounts of unmet need than do higher-income students. Continued strong funding support for theFederal Pell Grant and other student aid programs will help make postsecondary education more affordablefor low - and middle-income students and their families.
Figure 70
Limitations of the data. While trends in unmet need are a good measure of changes in postsecondaryaffordability, the value of unmet need itself is not a reliable measure of how people pay for college. Unmetneed represents the amount of additional aid a student could possibly receive under student aid regulationsand does not really reflect the resources students and their families actually use to pay for college. Inaddition, under current NCES plans, data from the National Postsecondary Student Aid Study (NPSAS) willonly be collected every four years. Work is underway to develop a mechanism for estimating yearly changesin the variables that make up unmet need so that annual interim projections can be made. When operationalin 1999, this mechanism will provide information on unmet need with a one-year lag. In other words, data onthe 1997-98 award year will be estimated in 1999.Verification/validation of measures. The NPSAS data collected by NCES are subject to strictmethodological standards. Yearly updates to the NPSAS data will be subject to estimation errors. When newNPSAS data becomes available, estimates will be verified against the actual data and appropriate changesmade in the estimation methodology.Data Source(s). National Postsecondary Student Aid Study, 1996, and 2000. Annual updates will be madeby estimating yearly changes in the variables that make up unmet need.
Indicator 66. The percentage of borrowers with student loan debt repaymentsexceeding 10% of their income will remain stable or decline over time.
Indicator background and context. In general it is believed that educational debt in excess of 10 percent ofincome will negatively affect a borrower’s ability to repay his or her student loan and to obtain other credit.The greater availability of flexible repayment options, better debt counseling for borrowers, and the taxdeductibility of student interest payments are expected to help prevent any further increases in the percentageof borrowers with student loan debt repayments in excess of 10 percent of their income.
Unmet Need in 1995-96 by Dependency Status and Income
Percentage of total cost of attendance not met by aid and expected familycontribution
49%
37%
24%
14%
5%
53%
40%
29%
17%
4%
0%
10%
20%
30%
40%
50%
60%
Under $15,000
$15,000-$29,999
$30,000-$44,999
$45,000-$59,999
$60,000 and over
Under $5,000
$5,000-$9,999
$10,000-$19,999
$20,000-$29,999
$30,000 and overDependent Independent
Long term target: To decrease unmet need, particularly for low-income students

U.S. Department of Education FY 2000 Annual Plan, Volume 1 Page 114
Figure 71
Limitations of the data. Under current NCES plans, data from the Baccalaureate and Beyond Study (B&B)will only be collected every eight years. In addition, self-reported income data, as is collected in the B&Bsurvey, are unreliable and the measure only reflects graduating college seniors. Work is underway to developa mechanism for measuring debt burden annually for all students by combining ED’s administrative loanrecords with earnings data collected by the Social Security Administration (SSA). The greatest difficulty tobe overcome is to ensure the confidentiality of the earnings data while still providing accurate estimates ofdebt burden. We anticipate being able to obtain estimates by matching ED and SSA records in 1999.Verification/validation of measures. The B&B data collected by NCES are subject to strict methodologicalstandards but do rely on self-reported income. Because SSA data does not capture earnings data beyond theannual Social Security earnings ceiling, estimates of debt burden for students with very high debts will needto be adjusted.Data source(s). Survey of Recent College Graduates, 1986 and 1990; Baccalaureate and Beyond Study,1993. Beginning in 1999, the Department will be obtaining annual debt burden data for a representativesample of all borrowers using administrative records.
Indicator 67. Graduation rates for all students in four-year and two-year colleges willimprove, while the gap in completion rates between low- and high-income and minorityand non-minority students will decrease.
Indicator background and context. Aiding students in completing their postsecondary educations is at leastas important as helping them to enroll. Funding increases for the student aid and support service programs areexpected to reduce both financial and non-financial barriers that may prevent students, particularly low-income students, from completing their postsecondary educations.
Figure 72
Percent of Graduating College Seniors Whose MonthlyEducation Loan Payments Exceed 10% of
Their Income in the Year Following Graduation
1 4 %
2 0 %
2 9 %
0 %
5 %
1 0 %
1 5 %
2 0 %
2 5 %
3 0 %
3 5 %
1 9 8 6 1 9 9 0 1 9 9 3 1 9 9 9
29% or lower
GOAL

U.S. Department of Education FY 2000 Annual Plan, Volume 1 Page 115
Limitations of the data. Under current NCES plans, data from the Beginning Postsecondary Student Study(BPS) will only be collected every eight years. Postsecondary institutions are just starting to report graduationrates annually through the Integrated Postsecondary Education Data System (IPEDS) and these data will beused in the future. IPEDS data will not provide information on differences in graduation rates by income,although it does have breakdowns by race/ethnicity, or on the outcomes of students who transfer from oneinstitution to another.Verification/validation of measures. Both the BPS and IPEDS data collected by NCES are subject to strictmethodological standards. IPEDS data will not capture transfer activity but this will not affect temporalcomparisons.Data source(s). Beginning Postsecondary Student Study, 1990/94; next update, 2002. IntegratedPostsecondary Education Data System, annual beginning with the 1997 year currently being processed.
Indicator 68. Participants receiving support services through the TRIO programs willenroll in and complete postsecondary programs at rates higher than comparable non-participants.
Indicator background and context. Redesigned performance reports will allow the Department to measurewith more accuracy the success of funded projects in meeting the goals of the Federal TRIO programs. EDstaff will use the data to provide better feedback to grantees on project and student performance that may beused to improve the quality and effectiveness of funded projects. Also, ED will be disseminating informationon effective practices and strategies obtained from research studies and national evaluations.
Percent of Students Entering Four-Year Colleges in1990 Who Graduated Within 5 Years
34%
40%
47%
57%
0 % 10% 20% 30% 40% 50% 60% 70%
Highest Income Quartile
Third Income Quartile
Second Income Quartile
Bottom Income Quartile
Long term target: To increase graduation rates while reducing the gap between low- and high-income students

U.S. Department of Education FY 2000 Annual Plan, Volume 1 Page 116
Figure 73
Limitations of the data. Major program evaluations, while providing rigorous information comparingrecipients and non-recipients, are only conducted very infrequently. We are currently assessing the feasibilityof combining program performance reports with data on student aid recipients to assess the success of theTRIO programs in getting students to enroll in and complete college.Verification/validation of measures. Evaluations are subject to strict methodological standards. Datareported by grantees on their annual performance reports on the performance of the TRIO programs will beverified against the evaluation results.Data source(s). Student Support Services evaluation, 1997; next update in 1999 will include data ongraduation rates. Upward Bound evaluation, data on college enrollment available in 1999. Programperformance reports, annual.
Findings from the Student Support Services Evaluation
Among students beginning college in 1991, the Student SupportServices (SSS) program had a small but positive and statisticallysignificant effect on the following three measures of studentoutcomes:
§ SSS recipients were 7 percentage points more likely to returnto the same school for the second year than were comparablenon-SSS recipients (67% vs. 60%). They were also 3percentage points more likely to complete two years of collegeat any school (77% vs. 74%).
§ SSS recipients, on average, had a GPA .11 points higher thancomparable non-SSS recipients in the first 3 years of college.
§ SSS recipients, on average, earned 2.25 more credits thancomparable non-SSS recipients in the first 3 years of college.

U.S. Department of Education FY 2000 Annual Plan, Volume 1 Page 117
Objective 3.3: Postsecondary student aid delivery andprogram management is efficient, financially sound, andcustomer-responsive.
Interim plan, final to be submitted in September 1999
Context: The Department of Education works with 6,000 postsecondary institutions, 6,100 lenders, and36 guaranty agencies to deliver over $52 billion in grant, loan, and work-study assistance to almost9 million students who rely on federal student aid to pay for college. The Department has identified themodernization of the student aid delivery system as one of its highest priority management objectives.This modernization will be managed by a newly authorized Performance-based Organization (PBO).
The PBO, created to improve the management of the student financial aid systems, became operationalon December 8, 1998. The PBO is currently in the process of developing performance measures and afive-year performance plan consistent with the Higher Education Act that will be submitted to Congressin September 1999. The development of the five-year plan will involve an extensive collaborationeffort with our partners. Much of that work will take place throughout the winter and spring under theChief Operating Officer’s Customer Service Task Force Initiative. Until this work is completed laterthis year, and as required by law, the PBO will be operating under an interim plan as described below.This plan reflects the performance agreement between the Chief Operating Officer of the PBO and theSecretary of Education.
External factors: Because this objective involves primarily internal ED initiatives, there are no externalfactors that should affect achievement of the objective.
Key strategies
The interim plan developed by the PBO identifies three key objectives that will guide its work until thefinal plan is completed in the fall.
§ Improve Customer Satisfaction
§ Reduce the Overall Cost of Delivering Student Aid
§ Transform the Student Financial Assistance Office into a Performance Based Organization
Coordination with other federal agencies
§ Data matches. Continue to work with Selective Service and the Immigration and NaturalizationService to perform data matches to efficiently and effectively determine eligibility for student aid.
§ Income information. Work with the Internal Revenue Service to implement a new provision in TheHigher Education Amendments of 1998 authorizing the Secretary of Education, in consultation withthe Secretary of the Treasury, to verify tax information reported to the Department by students andapplicants with information reported on Federal tax returns.

U.S. Department of Education FY 2000 Annual Plan, Volume 1 Page 118
§ Tracking defaulters. Work with other federal agencies, such as the Social Security Administration,U.S. Postal Service, and the Departments of Defense, Justice, and Housing and Urban Developmentto better track defaulted borrowers and return them to repayment.
§ New initiatives. Work with National Performance Review to participate in Access America, a pilotprogram to use information technology to deliver government services and to increase governmentproductivity.
Performance indicators and charts
As discussed above, the PBO is in the process of developing a performance plan for the succeeding 5years, as required in the Higher Education Act, that establishes measurable goals and objectives for theorganization. The 5-year performance plan will be submitted to Congress in September 1999 afterextensive consultation with all interested parties. In the interim, the following set of indicators has beendeveloped to describe the specific actions the PBO will take in the next 7 months to ensure thecontinued efficient operation of the student aid delivery system and to set the stage for futuremodernization and improvement.
Selected AccomplishmentsCreation of a Performance-Based OrganizationThe Higher Education Amendments of 1998 (HEA) created a performance-based organization(PBO) to improve the management of the Title IV student financial assistance programs.• The PBO has started work on performance measures and a five-year budget consistent with
the requirements of the HEA that will be submitted to Congress in late Spring 1999.• A Customer Services Task Force has been created to develop customer service
recommendations that will become the basis of the PBO’s five-year plan.
Y2K ComplianceThe Department has made great strides in ensuring that the student aid delivery system willcontinue to function in the Year 2000.• The Department’s mission-critical computer systems are directly related to the delivery of
student financial aid. Year 2000 compliance work has already been completed on 10 of 11 ofthese systems and work on the remaining 1 will be completed by March 1999.
• Contingency plans are being made to ensure the timely delivery of student aid even if Y2Kcomputer problems do occur.
Making Better Use of TechnologyED has continued to utilize the latest technology in the delivery of student aid.• The Department is well on its way to meeting its goal of receiving 3 million electronic
applications by September 30, 1999, more than one year ahead of the original schedule.• All publications relating to the delivery of student aid are available on the Internet and all
student aid financial transactions must be done electronically.• Eligibility checks performed through the National Student Loan Data System have prevented
the award of over $1 billion in loans to ineligible borrowers since the system came on-line in1994.
• Since the system was completely redesigned in the latter part of 1997, turnaround times forDirect Loan consolidation applications have improved by over 60% while volume hasincreased dramatically.
Reduce Defaults and Increase Collections• Since 1990, the cohort default rate in the largest student loan program has decreased by over
half from 22.4% to 9.6% in 1996.• Collections on defaulted student loans have more than doubled from $1 billion in 1992 to $2.2
billion in 1998.

U.S. Department of Education FY 2000 Annual Plan, Volume 1 Page 119
Subobjective 1: Improve Customer Satisfaction
§ Put the new Recipient Fund Management System in place by 8/30/99 and ensure that users do notexperience any degradation in service.
§ Process Free Application for Federal Student Aid applications within an average turnaround time ofeight days or less (through 9/30/99). Current benchmark is 8 days.
§ Enable qualified Direct Loan schools to disburse money to qualified students while they wait (by9/30/99).
§ Continue to process completed Direct Loan Consolidation applications within an averageturnaround time of 60 days or less (From 1/1/99 - 9/30/99). Current benchmark is 54 days.
§ Process all transactions with schools so that disruptions for students and schools are minimal(through 9/30/99).Benchmarks:-- After implementing RFMS, make Pell funds available to school within 36 hours of submission.-- Process all audits within six months.-- Complete reimbursement requests within 30 days.-- Respond to student complaints within 10 days.-- IPOS completes all transactions within established timeframes 95% of the time.
§ Complete, validate and put in use all Y2K systems conversions (by 3/31/99).
§ Establish a program to collect customer preferences and the PBO performance on an on-going basis(by 9/30/99).
§ Attract three million new electronic filings from aid applicants for the twelve-month period ending9/30/1999. Currently, we anticipate receiving 2.6 million electronic FAFSA by 9/30/99; additionalvolume will come from borrowers electronically submitting their loan consolidation applicationsand schools submitting their eligibility applications. Three million is equal to approximately one-third of the annual volume of aid applications, an ambitious target originally established for the2000-2001 award year.
Figure 74
Electronic Applications for Student Aid,1996-1999
0500,000
1,000,0001,500,0002,000,0002,500,0003,000,0003,500,000
FY 96 FY 97 FY 98 Goal FY 99
Actual
GOAL

U.S. Department of Education FY 2000 Annual Plan, Volume 1 Page 120
§ Create five new positive experiences in services delivered to our customers and partners (by9/30/99).
§ Introduce five new electronic products and services - at least as pilots - which move us toward theEASI vision (by 9/30/99).
Subobjective 2: Reduce the Overall Cost of Delivering Student Aid
§ Establish a baseline estimate of the overall costs of delivering student aid (by 9/30/99).
§ Create a core measure or measures for judging cost reduction performance (e.g. total deliverydollars spent per assistance dollar outstanding by 9/30/99).
§ Design a complete, subsidiary-style financial management system for the PBO (by 9/30/99).
§ Provide all necessary support needed to achieve clean audits for FY 98 and FY 99, with FY 99documentation delivered on time to support a March 2000 publication date.
§ Maintain default recovery rate at ten percent or more of prior year-end outstanding balances(through 9/30/99). Current benchmark is 10% reflecting the FY98 rate.
§ Maintain cohort default rate at ten percent or less (through 9/30/99). Current benchmark is 9.6%reflecting the FY 96 rate.
§ Use performance based contracts in all major new contract awards (through 9/30/99).
§ Extend current contracts, where that is necessary, early enough to avoid cost impacts (through9/30/99).
§ Review PBO operations to identify cost cutting actions in delivering student aid (by 4/1/99).
§ Develop incentives to encourage high performance by partners.
Figure 75
'89 '90 '91 '92 '93 '94 '95 '96 '97 '98 '99 '00 '01 '02
10.0%
15.0%
20.0%
25.0%
Loan default rate
Federal Family Education Loan Default RatesProgram (FFEL) FY 1990-FY 2002
22.4%
17.8%
15.0%11.5%
10.7%10.4%
9.6%
EstimatedActual
Goal

U.S. Department of Education FY 2000 Annual Plan, Volume 1 Page 121
Subobjective 3: Transform the Student Financial Assistance Office into aPerformance Based Organization
§ Conduct collaborative working sessions with partners – schools and the financial community – onhow to improve services to students and cut overall program costs (by 4/30/99, feed ideas to thecustomer service task force). These collaborative working sessions are an essential part of the driveto identify the improvements most desired by our customers and partners.
§ Find best in the business organizations that we can use to benchmark our processes, systems andpeople (make initial comparisons by 7/31/99).
§ Deliver a task force report on how to make specific, top to bottom improvements in customerservice and satisfaction (by 7/1/99).
§ Complete a systems architecture and acquisition strategy for all-major PBO business processes andcomputer systems, to support our improved service and cost management objectives (by 7/31/99).
§ Deliver a preliminary budget plan for the PBO by 4/1/99, (we will seek congressional concurrenceat a later date for a comprehensive plan in order to use results from the customer service task forceand architecture projects).
§ With employees, develop a human resources and organizational plan for the PBO (by 9/30/99).
§ With employees, develop a system to measure employee satisfaction (by 9/30/99).
§ Deliver the five-year performance plan for the PBO, including recommendations for additionallegislation to improve service and reduce cost (by 9/30/99).
§ Hire an Ombudsman and build a complaint “cherishing” system (by 9/30/99). This function isrequired of the PBO under HEA reauthorization.

U.S. Department of Education FY2000 Annual Plan, Volume 1 Page 122
Objective 3.4: All adults can strengthen their skills andimprove their earning power over their lifetime throughlifelong learning.
Context: To keep pace with the changing economy, many workers need to upgrade theirknowledge and skills, and some need to be retrained for entirely new jobs. Objective 3.4 focuses onproviding adults with educational opportunities—through postsecondary education, adult basiceducation, or vocational rehabilitation—to acquire the knowledge needed for the new world of workand to lengthen their productive years. In addition to benefiting the individual worker, the economyas a whole will be strengthened through the creation of a more flexible and highly trainedworkforce. Federal programs attempt to improve literacy, enhance workforce skills, and providepostsecondary education and training opportunities to a diverse population of adult learners throughan equally diverse cluster of organizations that operate in varied state contexts.
External factors: The target for indicator 1 is based on the receipt of sufficient funds to at leastmaintain current services in the VR state grants program. The Rehabilitation Act requires a stateVR agency to implement an approved order of selection if it cannot serve all eligible individualsand serve first those persons with the most significant disabilities. About half of the state VRagencies are operating under an order of selection. We expect the number of persons withsignificant disabilities to continue to rise as a result of recent amendments that streamline VReligibility requirements for Social Security beneficiaries.
Indicators 3 and 4 target the most educationally disadvantaged adults, including those with learningdisabilities and English as a Second Language (ESL) learners who have limited literacy skills intheir native language. Providing services that produce literacy gains for these adults is challenging,but the Department is pursuing a number of strategies targeted at this population, including studiesof adult basic education and English as a Second Language to identify effective instructionalpractices, and a project to ensure more effective diagnosis of learning disabilities.
Key strategies
n Financial support for postsecondary and employer-provided education§ Offer grants of up to $3,250 to adults seeking postsecondary education and training with the
$7.9 billion request for the Pell Grant program (adults make up an estimated 10 percent ofPell Grant recipients).
§ Pilot the use of technology and other innovations in non-traditional education to improvethe delivery of postsecondary education and lifelong learning opportunities for all citizenswith the $20 million proposal for Learning Anytime Anywhere Partnerships.
§ Through the $2.6 billion request for the Lifetime Learning tax credits, help an additional 7.1million students obtain postsecondary education.
§ Encourage adult learners to go back to school to learn new skills with the new $15 millionEarly Awareness Information program and the $30.5 million request for TRIO’sEducational Opportunity Centers.

U.S. Department of Education FY2000 Annual Plan, Volume 1 Page 123
n High-quality adult basic education (ABE) and secondary education§ Target the $103 million increase for Adult Education State Grants to help states enhance the
capacity of adult education programs to improve learner retention and achievement,particularly for Hispanics and other adults with limited English proficiency.
§ With $70 million of the National Leadership request, launch Common GroundPartnerships–an English as a Second Language (ESL) and civics program designed tosupport states and communities with large concentrations of immigrants.
§ Use $23 million in National Leadership funds for Technology Challenge for Adult Learninggrants that would help states incorporate technology applications into adult education andfamily literacy curricula.
§ With $2 million in National Leadership funds, support a High Skills CommunitiesCampaign to help states and communities create strategies to promote lifelong learning andliteracy and accelerate progress in meeting state and national goals related to adulteducation and lifelong learning.
§ Continue studies of “what works” in adult basic education and ESL programs to improvethe quality of services.
§ Support State and private partnerships to develop a technology-based distance learningfamily literacy project.
Selected AccomplishmentsEmphasized program accountability and performance.§ The reauthorized Adult Education and Family Literacy Act (Title II of the Workforce
Investment Act) streamlines the program and places greater emphasis on program quality,performance, and accountability.
§ Development and pilot-testing of a reporting system that meets the performance accountabilityrequirements for the Adult Education and Family Literacy Act are near completion.
§ The reauthorized Rehabilitation Act (Title IV of the Workforce Investment Act) providesgreater access to training and employment services, enhances consumer choice in theVocational Rehabilitation (VR) State Grants program, streamlines the state VR servicedelivery system, and improves program accountability.
§ RSA has implemented strategies to improve the effectiveness of its program monitoring,including a new state monitoring system based on performance outcomes and meetings withprogram stakeholders to gather input on how it can enhance the utility of its monitoringreports.
Demonstrated economic benefits to employers.§ OVAE initiated a project with the U.S. Conference Board to demonstrate to employers,
unions, and employees, the economic benefits of improving workers’ literacy skills to enhanceworkplace performance.
§ RSA’s National Conference on Employment focused on developing effective relationshipsbetween state VR agencies and employers to improve consumer outcomes.
Implemented long-term technology and adult literacy initiatives.§ ED is building state alliances and leveraging local funds in developing family literacy projects.
OVAE and OESE continued a collaborative project that included the implementation of familyliteracy demonstration projects that feature broad-based collaboration and the use of Even Startand Adult Education resources to leverage local resources.
§ Staff at One-Stop Employment and Training Centers are using the toolkit developed by theNational Adult Literacy and Learning Disabilities Center to diagnose learning disabilities.
§ The Learning Anytime Anywhere Partnerships program helps ensure that high-quality learningopportunities are available to distance education students.

U.S. Department of Education FY2000 Annual Plan, Volume 1 Page 124
n State and local program management in adult education§ Continue development work on a national performance based reporting system for the adult
education delivery system.§ To validate economic, educational, and other outcomes for adult learners; and develop and
field-test a data-sharing methodology that will combine data from adult education programswith data from other state education, welfare, training, and employment programs.
n Adult education an integral part of reformed welfare systems§ Disseminate information and provide technical assistance to key state and local adult
education contacts on best practices and models for integrating preemployment and workreadiness activities in basic skills programs
n Employment for individuals with disabilities§ Work with other agencies to fund grants to let state and local consortia identify and work
toward eliminating barriers to employment for individuals with disabilities.§ Use the $2.316 billion request for Vocational Rehabilitation State Grants to support
education and employment-related services, including vocational training and jobplacement.
§ Issue performance standards to increase accountability of state VR agencies in assistingindividuals with disabilities to achieve high quality outcomes.
n Access to assistive technology for individuals with disabilities§ Use the $15 million request for the Assistive Technology program to support grants to
states to establish alternative loan programs enabling individuals with disabilities to borrowfunds to purchase assistive technology.
§ Target $8 million of the request for the National Institute of Disability and RehabilitationResearch to support research and demonstration activities that will increase the accessibilityof information technology and telecommunications.
Coordination with other federal agencies
n Department of the Treasury. Coordinate with the Department of the Treasury to implementthe Lifetime Learning tax credit.
n Department of Labor. The Rehabilitation Services Administration (RSA) will work with theDepartment of Labor and the School-to-Work office to ensure that students with disabilitiesreceive appropriate School-to-Work transition services.
n Social Security Administration. RSA will address with the Social Security Administration(SSA) the disincentives to work that affect SSA beneficiaries.
n National Institutes of Health, the National Adult Literacy and Learning DisabilitiesCenter, and the Office of Special Education and Rehabilitative Services. The Office ofVocational and Adult Education (OVAE) will work with the National Institutes of Health, theNational Adult Literacy and Learning Disabilities Center, and the Office of Special Educationand Rehabilitative Services to develop information concerning learning accommodationstrategies to facilitate the participation of adults with disabilities in literacy programs.

U.S. Department of Education FY2000 Annual Plan, Volume 1 Page 125
n Coordination within ED§ National distance learning project in family literacy. OVAE and the Office of
Elementary and Secondary Education will join forces to launch a national distance learningproject in family literacy.
§ National adult literacy survey. OVAE will partner with the National Center for EducationStatistics to support the development and execution of a second National Adult LiteracySurvey.
Programs supporting this objective
Vocational and Adult Educationn Adult Education State Grantsn Adult Education National Leadershipn National Institute for Literacyn Star Schoolsn Community-Based Technology Centersn State Grants for Incarcerated Youthn Offenders
Vocational Rehabilitationn Vocational Rehabilitation State Grantsn Independent Livingn Projects with Industryn Supported Employment
Postsecondary Educationn Pell Grantsn Campus-based programsn Federal Family Education Loansn Direct Student Loansn TRIO’s Educational Opportunity Centersn Learning Anytime Anywhere Partnerships
Researchn National Institute on Disability and
Rehabilitation Researchn National Education Research Institutes
Performance indicators and charts
Indicators of lifelong learning (objective 3.4) include measures of the effects of federally fundedprograms and tax credits on encouraging adult literacy and employment, the percentage of personswho receive vocational rehabilitation services and then obtain and maintain employment, and thepercentage of students in adult basic education who achieve proficiency in basic skills.
Indicator 69. In vocational rehabilitation, the percentage of all persons whoobtain employment after receiving vocational rehabilitation services will bemaintained at 61 percent.
Indicator background and context. Vocational Rehabilitation (VR) state grants provide servicesto help persons with disabilities prepare for and engage in employment to the extent of theircapabilities. The program includes services such as vocational evaluation, counseling, mental andphysical restoration, education, vocational training, work adjustment, job placement, and postemployment services. Priority is given to serving individuals with the most significant disabilities.In recent years, the percentage of individuals with significant disabilities as a proportion of allindividuals achieving an employment outcome has risen; the cost of rehabilitating individuals withsignificant disabilities has been consistently higher than for other individuals with disabilities. As agroup, persons who achieve employment as a result of VR services show gains in their ability tofunction in economic terms (see Figure 76).

U.S. Department of Education FY2000 Annual Plan, Volume 1 Page 126
Figure 76
Limitations of the data. Data are reported by the states and are not independently verified.Verification/validation of measures. Routine monitoring and on-site reviews of VocationalRehabilitation programs will specifically address procedures to verify grantee reports.Data source(s). Rehabilitation Services Administration (RSA) state data. Next update: annually.
Indicator 70. By fall 2000, adults at the lowest levels of literacy (those inbeginning ABE and beginning ESL) will comprise 45%-50% of the total nationalenrollment. (Adult Education State Grants and Knowledge Development programplan)
Indicator background and context. Consistent with its predecessor law, the new Adult Educationand Family Literacy Act emphasizes serving the most educationally disadvantaged adults. Forexample, a state’s needs assessment must include individuals most in need or hardest to serve. And,in making subgrants, states are to consider the applicant’s past effectiveness in improving theliteracy skills of those adults with the lowest levels of literacy. The indicator highlighted hereunderscores the importance of targeting services to an increasing percentage of educationallydisadvantaged learners in the adult education system, despite the fact that it may be more difficultand time-consuming to achieve outcomes for this population than for other adults in the system whohave slightly higher skills.
Percentage of all Persons Who Obtain an EmploymentOutcome After Receiving Vocational Rehabilitation Services
60.4%
60.7%60.8%
61.0%
0.6
0.6
0.6
0.6
0.6
0.6
0.6
1995 1996 1997 1998 1999 2000
Goal
Num
ber
of s
tate
s

U.S. Department of Education FY2000 Annual Plan, Volume 1 Page 127
Figure 77
Limitations of the data. Data are reported by the states and are not independently verified.Verification/validation of measures: Routine monitoring and on-site reviews of Adult Educationprograms will specifically address state procedures to verify grantee reports. An ongoing study ofAdult Basic Education providers will provide some independent information regarding programoutcomes.Data source(s). Adult Education Management Information System. Next update: annually.
Indicator 71. By 2000, 40 percent of adults in beginning-level ABE programs willcomplete that level and achieve basic skills proficiency. (Adult Education: StateGrants and Knowledge Development program plan)
Indicator background and context. Adults who enroll in ABE at the beginning level tend to be themost educationally disadvantaged, with literacy skills roughly below the sixth-grade level.Currently, fewer than one-third of adults who enroll in beginning-level ABE in a given yearcomplete that level within the year. Building on the previous indicator, this indicator stresses that itis not sufficient to ensure that educationally disadvantaged adults simply have access to appropriateadult education programs. The programs must be of sufficient quality to ensure that these learnerssucceed in them.
50%46%44%42%
1995 1996 1997 2000
Goal
100%
80%
60%
40%
20%
0%
Percent of Adult Education Students Enrolled in Beginning AdultBasic Education or Beginning English as a Second Language
Instruction

U.S. Department of Education FY2000 Annual Plan, Volume 1 Page 128
Figure 78
Limitations of the data. Data are reported by the states and are not independently verified. Datasubmitted by California are not included, because of problems in tracking student outcomes.Verification/validation of measures. Routine monitoring and on-site reviews of Adult Educationprograms will specifically address state procedures to verify grantee reports. An ongoing evaluationof Adult ABE providers will provide some independent information regarding program outcomes.Data source(s). Adult Education Management Information System. Next update: annually.
Indicator 72. By 2002, 40 percent of adults in beginning ESL will complete theintroductory level and achieve basic English literacy. (Adult Education: StateGrants and Knowledge Development program plan, indicator 2.2).
Indicator background and context. Well over half of all ESL learners enroll at the beginninglevel, but less than one-third of these students complete that level each year. This indicatorhighlights the importance the Department places on ensuring that English language and literacyinstruction provided through federally funded Adult Education programs is of high-quality andleads to significant learner outcomes.
Figure 79
Percent of Beginning-Level ABE Students Who Complete that Level
2 8 % 2 7 % 2 3 %
4 0 %
0%
25%
50%
75%
100%
1995 1996 1997 2000
Goal
Percent of Beginning - Level ESL Students WhoComplete the Introductory Level
2 5 %3 0 %
2 3 %
4 0 %
0 %
2 0 %
4 0 %
6 0 %
8 0 %
1 0 0 %
1 9 9 5 1 9 9 6 1 9 9 7 2 0 0 2
GOAL

U.S. Department of Education FY2000 Annual Plan, Volume 1 Page 129
Limitations of the data. Data are reported by the states and are not independently verified. Datasubmitted by California are not included, because of problems in tracking student outcomes.Verification/validation of measures: Routine monitoring and on-site reviews of Adult Educationprograms will specifically address state procedures to verify grantee reports. An ongoing evaluationof Adult ESL providers will provide some independent information regarding program outcomes.Data source(s). Adult Education Management Information System. Next update: annually.

U.S. Department of Education FY 2000 Annual Plan, Volume 1 Page 130
Goal 4. Make ED a high-performance organization byfocusing on results, service quality, and customersatisfaction.
The Department’s fourth goal, “Make ED a high-performance organization by focusing onresults, service quality, and customer satisfaction," cuts across all programs and is critical to allgoals and objectives described in ED's strategic plan. Goal 4 is organized around seven keythemes: customer service, flexibility of programs, research, technology, employee development,financial management, and performance measurement.
Our progress and our Annual Plan for the Year 2000 reflect a focus on anticipating the needs ofcustomers, both external and internal, and preparing for the next millenium. The plan reflects acommitment to investing in the training and technology available to the Department’s employeesso that better advice and service will be provided to the state and local education officials,students, teachers, parents and other customers of the Department. Our activities includeidentifying and training staff and managers in core competencies to promote high-performingemployees. To achieve our goal of making ED a high-performance organization, work is underway to further clarify the Department's goals and to improve our ability to measure ourperformance. By 2000, the Department hopes to see improvements in its employees’ perceptionsabout work readiness, performance, equity, workplace services, and the other issues measured inour Employee Survey.
In addition, the Department will continue to find ways to build on its successes in usingtechnology to improve the quality and timeliness of its products and services. These servicesinclude information dissemination and administering grants and loans. Internally, we will usetechnology in new ways to facilitate communication between employees about the quality of theirwork, the services they provide to customers, and the ways in which they are able to grow anddevelop professionally. The ubiquity of the Internet offers tremendous possibilities forimprovements in our business processes and improvements in customer service. We will beexploring these possibilities.
Strategies in Goal 4 were developed from a variety of sources: results of employee surveys,feedback from external customers, reviews of effective practices in management literature,reviews of successes achieved by government and industry, and reports from the GeneralAccounting Office and the Office of Inspector General. During 1998-9, progress was made oneach of the Goal 4 objectives:
1. Customer service. During 1998, the Department improved its ability to deliver high-qualityinformation services through its toll-free phone numbers and Web site. During 1999, theDepartment will make substantial progress on improving its service to customers requestingpublished information through “ED Pubs,” a centralized distribution system for Departmentpublications recently described in Government Executive magazine. In addition, greateremphasis will be placed on developing customer feedback systems that are used to improveprogram management, service delivery, and policy development.
2. Flexibility of programs. During 1998, progress continued on finding ways for theDepartment to reduce its regulatory and paperwork burden on grantees and other customers

U.S. Department of Education FY 2000 Annual Plan, Volume 1 Page 131
without reducing the level of program performance. During 1999, the Department will focuson writing regulations and policies in plain English, integrating program review and technicalassistance across "stovepipe" programs, and building partnerships, where possible, to achievecritical program results.
3. Research. During 1998, the Department made substantial progress on directing resources toresearch on achieving national education priorities. It is critical that the nation possess ahealthy knowledge base to support systemic education reform and equity. Adequate capacity,a relevant research agenda, high quality research, and useful findings and products arenecessary for a sustained knowledge base. The Department of Education supports researchprimarily through the Office of Educational Research and Improvement. Key strategiesinclude forming partnerships with other agencies to conduct cutting edge research andfocusing research on solving critical problems in educational policy and practice.
4. Technology. In addition to improving student financial aid administration (described in Goal3 of this plan), ensuring that the Department’s systems are Year 2000 compliant remains ahigh priority. Thirteen of the Department fourteen mission critical systems have completedtheir Y2K conversion. The single remaining mission critical system will be Y2K compliantby March 1999. The Department is expanding its Internet presence and building an Internet toimprove workflow processes and communications.
5. Employee development. During 1998, the Department continued to offer better training toemployees. The Department’s Training and Development Center benchmarked its operationswith other high-performing organizations and identified strategies for greater effectiveness. Acontinuing dialogue on race relations in the Department provided insights aboutcommunication and employee life issues, which will be addressed during 1999. Strategies toreinforce high organizational performance include increased management training andorganization performance reviews.
6. Financial management. In 1998, the Department received a clean audit opinion on itsfinancial statements, and another is planned for in 1999. Also, during 1999, work willcontinue on improving the delivery of timely and reliable financial information to bettermanage the Department and its programs. Improvements will continue in the contracts andpurchasing processes to support strategic Departmental objectives.
7. Performance measurement. The Department’s five-year Strategic Plan received high marksfor being “user friendly” and for providing a coherent framework of goals, objectives andindicators to provide for the measurement of progress and accountability. ED hasimplemented performance agreements with senior staff to hold them accountable forachieving the goals of the Strategic Plan.

U.S. Department of Education FY 2000 Annual Plan, Volume 1 Page 132
Objective 4.1: Our customers receive fast, seamless serviceand dissemination of high-quality information and products.
Context: To accomplish its mission of ensuring equal access to information and promoting educationalexcellence throughout the Nation, the Department of Education must support the efforts of states, post-secondary institutions, school districts, school boards, schools, community and business organizations,principals, teachers, parents, and students. All of these customers look to ED for fast, accurate informationand assistance to meet their various education needs. ED is taking advantage of information technology toprovide improved services to customers.
External factors: Rapid increases in the introduction of new technology make it easier to provide betterservices to a greater number of customers. Electronic distribution of publications will enable the Departmentto provide increased numbers of products - by an order of magnitude - than was possible with printdistribution.
Key strategies
n Equip employees with the resources they need to respond to customer requests.§ Develop a descriptive referral list of where to find key information and services for all ED
employees.§ Integrate customer service into all training and orientation for staff, managers and new employees.
Identify specific customer service related training needs for ED employees.§ Establish Front Line Forum on Intranet to facilitate staff participation in discussions about
challenging customer service problems and solutions, updated information, and customer feedback.
n Establish a system that enables customers to easily obtain materials and information products.§ Continue to use the ED-PUBS system to improve the efficiency of the dissemination of materials
produced by ED, including publications and grant applications, and to operate as a call center.§ Develop a centralized mailing list.§ Develop a products catalog of hard copies of publications for ED-PUBS.§ Develop mini-catalogs that target a specific area of interest for the ED-PUBS System. (e.g.
publications in Spanish, publications on Special Education)§ Alliance with USA Today has resulted in the Partnership for Family Involvement in Education web
site being hosted by USA Today and made accessible through their main news site which receivesmore than 75 million hits a day, greatly expanding the visibility of ED’s publications and on-lineservices.
n Ensure that customers with disabilities have access to services and information.§ Ensure that customers have access to the information and services they need in the ways that they
need them including live service and self-service, convenient hours, bilingual staff and Spanish menuprompts, TTY access, and products in Braille and large print.
n Develop a system for using feedback for improving customer service.§ Incorporate customer-satisfaction measures into key policy and organizational activities and annually
report on customer satisfaction by key customer groups (e.g., teachers, grantees).§ Develop communication structure for ED managers to report up and down on customer service.§ Develop integrated systems for creating customer-driven culture and operations and create best-
practices database.

U.S. Department of Education FY 2000 Annual Plan, Volume 1 Page 133
§ Introduce an automated customer-quality survey system into ED’s call centers, including ED-PUBSand ED’s Student Financial Aid Information number (1-800-4FED-AID) . Expand customer surveysat major ED conferences, visits, speeches and other customer contacts.
§ Include in performance agreements of Senior Officers a measure of progress on customersatisfaction.
§ Include a customer survey as part of a system of electronically transmitted grantee performancereports.
Coordination with other federal agencies
n National Partnership for Reinventing Government (NPRG). Continued to work NPRG to networkwith other federal agencies on best practices for customer service delivery.
n Federal Publisher’s Committee. Continue work with the Federal Publisher’s Committee (FPC) to keepED aware of the changes in the printing requirements and printing technologies for government agencies.
n Government Printing Office’s (GPO) Depository Library System. Continue work with this librarysystem to ensure all ED documents printed by GPO are deposited in the public domain for use by alltaxpayers and citizens.
Selected Accomplishments
Dramatically increased customer contact on web and over phone• The ED Home Page’s total number of page views for 1998 is more than double last year’s total and is
up to over 3.2 million.• The Student Financial Aid Information’s number (1-800-4FED-AID) total call volume for 1998
indicated a 51% increase from the 1997 total.• ED-PUBS publications-request facility became operational in May with activity increasing monthly.
The center receives approximately 700 calls and 300 on-line requests a day from customers orderingED materials and information products.
Received customers’ praise and listened to feedback resulting in new,targeted approaches• Teachers named ED web site as the most frequently used site according to the third annual study of
teacher Internet use by Quality Education Data (QED). ED-sponsored Educational ResourcesInformation Center (ERIC) web site was named the second most frequently used site.
• The Planning and Evaluation Service and the Office of Postsecondary Education collaborated on astudy of customer satisfaction among financial aid applicants. Results indicated that applicants weregenerally pleased with the process
• Menu options for 1-800-USA-LEARN information call center changed to route customers to staffmore directly and quickly.
• ED web site was redesigned with particular attention on improving search tools and finding aids inresponse to customer survey findings. The site also was made more accessible to customers withdisabilities.
• "Educacion-La Tarea De Todos" was broadcast on Univision television stations throughout thecountry. A total of 770 calls were received requesting two of ED's Spanish publications.
• Alternate Format Center began producing documents in Braille and audiotape, and provided quickturnaround on several Notices of Proposed Rulemaking and new regulations.
Chartered Customer-Service Strategy Teams• Customer service strategy teams with department-wide representation chartered to develop tools to

U.S. Department of Education FY 2000 Annual Plan, Volume 1 Page 134
n General Services Administration’s Consumer Information Center (CIC). Continue work with theCIC to develop, promote, and distribute ED publications to the public.
Performance indicators and charts
The data presented below describe ED’s provision of direct public access to web resources and call centers.
One of the most important aspects of this objective and the initiatives outlined is the need for customerservice to be integrated not only into our most popular and used services, but throughout ED. In order for theDepartment to incorporate concepts and best practices related to customer focus into daily operations, we aredeveloping cross-cutting approaches for meeting this objective. The indicators in this objective seek to trackperformance on meeting ED’s customer service standards and in providing quality products and services tothe public that are timely and accessible.
In 1999, ED is coming out with a comprehensive report that summarizes customer satisfaction by majorcustomer service areas.
Indicator 73. The Department continues to increase public access to information asmeasured by WEB page visits and number of calls received by call centers.
Indicator background and context. Customer use of ED’s Home Page and information call centers (seeFigure 80) is significantly increased and, in some cases, has more than doubled. The ED Home Page’s totalnumber of page views for 1998 is more than double last year’s total. The Student Financial Aid Information’snumber (1-800-4FED-AID) total call volume for 1998 indicated a 51% increase from the 1997 total
ED’s main information line (1-800-USA-LEARN) shifted its publication distribution services to ED PUBS.This caused a decrease in its call volume but not nearly as much as was anticipated due to the growth ininformation calls to the center.

U.S. Department of Education FY 2000 Annual Plan, Volume 1 Page 135
Figure 80
Limitations of the data. Web page visits count repeat visitors and do not reflect unduplicated customers.Verification/validation of measures: System-generated data.Data source(s). Information Resource Center (IRC) data systems, National Library of Education (NLE) datasystems, Student Financial Aid Information System.
Indicator 74. By 2001, at least 90% of customers, internal and external, will agree thatED products, services, and information, including those on the Department’s web site,are of high quality, timely, and accessible.
Indicator background and context. A 1998 Internet online customer survey indicated that overallsatisfaction with ED’s Internet services is high:
ED’s WEB Site Ratings by Visitors on a Scale of 1 (lowest) to 5 (highest)
§ 3.87 on a scale of 1 to 5 with even higher scores given to clarity of writing,accuracy, and timeliness.
§ The year 2000 target is to increase customer satisfaction (receive a 4 on a scaleof 1 to 5) while continuing to expand the volume of information on the homepage.
Limitations of data. Data reported from self-selected respondents of visitors to ED’s web site.Verification/validation of measures. System generated reports from respondent data.Data source(s). National Library of Education.
Number of Customer Contacts
0
500
1000
1500
2000
2500
3000
3500
1995 1996 1997 1998 1999 2000
USA-LEARN calls
FED-AID calls
Home page visits
GOAL

U.S. Department of Education FY 2000 Annual Plan, Volume 1 Page 136
Indicator 75. Department employees and front-line service centers will meet or exceedthe Department’s customer service standards by 2000.
Indicator background and context. ED’s main call centers have shown significant improvements in thereduction of wait times for customers (see Figure 81). For ED’s main information line (1-800-USA-LEARN)the wait time for 1998 decreased by 45% from the 1997 average. The Student Financial Aid Informationnumber (1-800-4FED-AID) had experienced problems earlier this year with its telephone system and wasable to rectify the problems by June 1998. Installing more phone lines and adding more staff brought aboutan 18-second (23.3%) decrease in waiting time.
Figure 81
Limitations of the data. Data on standards is mostly limited to ED’s call centers. There are few mechanismsin place that gather data for the balance of ED’s employees. Standards shown are set by the service provider.Verification/validation of measures. Most of ED’s main call centers operate on technologically advancedsystems that capture system data.Data source(s). Information Resource Center (IRC), Student Financial Aid System (1-800-4FED-AID), andthe National Library of Education (NLE) data systems.
Indicator 76. Quarterly evaluation reports for the “ED PUBS” (formerly One-Pubs)system, based on quality assurance surveillance, will indicate that high standards ofperformance are achieved for dissemination of ED’s information products by 2000.
Indicator background and context. In response to poor ratings for ED’s publications distribution, acentralized, one-stop shop for publications (ED-PUBS) was developed to disseminate ED materials andproducts, including publications and grant applications and to operate as a customer call center. The
Customer Service StandardsResponse Time for ED's Three Largest Call Centers
30
45 454640
24
77
40
13.2
59
4
0
10
20
30
40
50
60
70
80
90
Information Resource Center (IRC)
1-800-USA-LEARN
Student Financial Aid Information-
1-800-4FED-AID
The National Library of Education
1-800-424-1616 (1996 data not available)
*no data available for Dec due to change in location of the
call center.
1996 1997 1998 1996 1997 1998 1996 1997 1998*

U.S. Department of Education FY 2000 Annual Plan, Volume 1 Page 137
performance-based calls for the contractor’s performance to be evaluated on a regular basis to ensurecustomer satisfaction and process improvement. The initial data indicate that:
Average call-waiting time for ED-PUBS call center
§ The average wait time for customers accessing the center via telephone was 4.1seconds in December, 11 seconds in November, and 10.9 seconds in October,well below the 45-second industry standard.
Limitations of the data. The ED-PUBS system has only been operational since May 1998. Qualitative datawill be available after the customer satisfaction survey is in place (projected April 1999).Verification/validation of measures. An independent contractor operates the system under a performance-based contract that has performance measurements built into the contract.Data source(s). ED-PUBS Contracting Official Technical Representative (COTR), ED-PUBS system.

U.S. Department of Education FY 2000 Annual Plan, Volume 1 Page 138
Objective 4.2: Our partners have the support and flexibilitythey need without diminishing accountability for results.
Context: When the Nation’s governors, including then-governor Bill Clinton, met at the 1989 EducationSummit at Charlottesville, Virginia, a top priority was to secure greater flexibility in the administration offederal education programs in exchange for greater accountability for improved student achievement. UnderPresident Clinton, the Department has worked hard to remove statutory and regulatory impediments toinnovative education reforms, while continuing to ensure protection of basic civil rights and the properexpenditure of taxpayer dollars.
External factors Education programs are, in many cases, bound by statutory provisions for which ED cannotoffer flexibility. We are working with the Congress to use simplified language, to the extent possible, in newlegislation.
Key strategies
n Technical assistance system. Create a strategic framework for technical assistance providers andcoordination across technical assistance centers, conferences, integrated reviews, online services, andother activities. We continue to examining the issues in targeting technical assistance to the customers ingreatest need for this assistance.
n Regulatory/legislative reinvention.§ Promote efficient implementation and provide greater flexibility for grantees in implementing the
Individuals with Disabilities Education Act Amendments of 1997.§ Simplify legislation during reauthorization while designing programs to be more results-oriented.§ Promote efficient implementation of the Workforce Investment Act and provide flexibility for
grantees.§ Redesign regulations covering postsecondary student aid and higher education programs following
the reauthorization of the Higher Education Act.§ Implement President’s initiative on Plain Language to ensure all regulations are understandable.§ Increase opportunity for educational community to have their concerns addressed in developing
regulations through the use of negotiated rulemaking
n Program streamlining and flexibility.§ Use the Department's waiver authorities to provide flexibility in cases where federal requirements
may interfere with plans for improving teaching and learning.§ Support ED-FLEX states as they implement their delegated authority to waive federal requirements.§ Encourage consolidated planning at the state and local level.
n Comprehensive Regional Assistance Centers. Through the 15 Comprehensive Regional AssistanceCenters, increase the effectiveness of technical assistance aimed at integrating the various Elementary andSecondary Education Act programs in support of state and local education reforms including focussingassistance on high priority areas such as reading.
n Improved audit resolution. Expand to 25 states in FY 1999 the Cooperative Audit Resolution andOversight Initiative (CAROI), a federal-state partnership that aims to improve education programs andstudent performance at the state and local levels through better use of audits, program monitoring, andtechnical assistance.

U.S. Department of Education FY 2000 Annual Plan, Volume 1 Page 139
n Integrated program reviews. In collaboration with the states, use joint technical assistance andmonitoring activities for elementary and secondary education programs to support a self assessmentprocess to encourage continuous improvement in states' administrations of these programs. Coordinatewith the Council of Chief State School Officers to develop procedures for consolidated performancereporting.
n Civil rights partnerships. Establish constructive and collaborative relationships with state and localeducation agencies, parents and community groups, and other stakeholders to achieve the sharedobjectives of civil rights compliance and securing timely improvements for students.
n Improve the timeliness of grants awards. Ensure that formula and discretionary grants are issued toour partners in time for state and local program planning and operations, by requiring that programoffices award grants by May 1 wherever beneficial to grantees.
Selected Accomplishments
Established a multi-program coordination review strategy for working withstate agencies• ED implemented a Department-wide program coordination review program. Instead of 11 separate
State-agency program reviews, cross-program teams of staff from multiple program offices provide
a single integrated review and technical assistance. These cover varied areas including information
on recent changes in audit requirements and information about standards, assessment and
accountability during site visits to state and local educational agencies.
Targeted assistance to large, high-complaint district—with results• The Office for Civil Rights and the once high-complaint Chicago Public Schools (CPS) have
formed a collaborative working relationship that has greatly benefited the 420,000 students
enrolled in the district’s 567 schools. The partnership saw a decrease in the number of complaints
filed against the district, faster complaint resolution, and increased communication and sharing of
information.
Removed barriers to school reform• ED has approved 55% of 648 requests for waivers of statutory or regulatory provisions that pose
barriers to standards-driven reform. The majority of the remaining requests were withdrawn as the
applicants already had flexibility under the existing laws and regulations to undertake their desired
actions. These waiver activities are helping local educational agencies to reach their school reform
goals.
• Twelve states, the maximum authorized, are participating in the ED-Flex demonstration program
which allows the Department to give States with strong accountability mechanisms the authority
to approve waivers of certain federal statutory and regulatory requirements that impede effective
local-level reform.
• States have the option of submitting a single consolidated application for the majority of ESEA
programs, which states report has reduced paperwork requirements by 85 percent.

U.S. Department of Education FY 2000 Annual Plan, Volume 1 Page 140
Coordination with other federal agencies
n In providing support and flexibility for our partners, ED coordinates primarily with state and localagencies. Goals 1, 2 and 3 outline ED’s coordination activities with other federal agencies.
Performance indicators and charts
The following indicators measure the Department’s progress in providing the support and flexibilitycustomers need. Collectively the indicators show progress at varying levels in the areas of technicalassistance, reducing the number of separate programs, granting flexibility and increasing understanding ofprogram rules and requirements, and issuing grants on a timely basis.
Indicator 77. Surveys of states and school districts will increasingly rate theDepartment's technical assistance, including assistance from the ComprehensiveCenters and integrated reviews, as very useful in improving their performance.
Indicator background and context. In 1998, the Department implemented a Department-wide ProgramCoordination Review program and completed three program coordinated reviews in the spring. In response tocustomer satisfaction information, the Department changed the integrated review process by incorporating aself-appraisal guide with clear performance standards. Federally-supported Comprehensive RegionalAssistance centers provide assistance to grantees in implementing and integrating federal programs with theirreform efforts.
Figure 82
Limitations of the data. The integrated review team and customer service teams are revising their servicesso that past customer satisfaction rates may not reflect current satisfaction. Verification/validation of measures. Documented data to date collected by independent contractor.
State-agency satisfaction with Comprehensive Center services and Federal integrated program reviews,
1998
66
31
0
20
40
60
80
Comprehensive centers Integrated reviews

U.S. Department of Education FY 2000 Annual Plan, Volume 1 Page 141
Data source(s). Department-wide Program Coordination Reviews Summary and Analysis, Spring 1998. TheIntegrated Review Process, 1996. States’ Perspectives of OESE Integrated Reviews, 1998.
Indicator 78. Customers will increasingly report that they have greater flexibility andbetter understanding of rules and requirements of education programs.
Indicator background and context. Waivers provide customers greater flexibility in administering federaleducation programs. Since the reauthorization of ESEA in 1994, the Department has received 648 requestsfor waivers from states and local districts and granted a total of 357 waivers (see Figure 84). Overall, theDepartment has approved 55 percent and disapproved 8 percent of all waivers requested. Of the remainder,28 percent were withdrawn largely because districts learned that they had sufficient latitude or flexibilityunder existing law to proceed without a waiver, demonstrating that the ESEA is more flexible than manypeople thought even without the waiver authority.
Figure 83
Limitations of the data. In reporting baseline data on greater flexibility, there is difficulty in measuringcustomers’ perception of flexibility based solely on the number of waiver requests the Department receives asthere are a number of factors contributing to whether a waiver is even requested.Verification/validation of measures. District and state survey data were obtained from an independentassessment under contract with the Department. An update of that survey will be conducted. Programmonitoring activities will explicitly address coordination and flexibility issues and will be independentlyverified by program evaluations at state, district, school and institutional levels conducted through thePlanning and Evaluation Service.Data source. Reports on Reform from the Field: District and State Survey Results, 1997. Waivers: IncreasedFlexibility in Exchange for Increased Accountability, 1998.
Indicator 79. New discretionary grants processed using the re-engineered grant-making process will be awarded each year on a timely basis.
Action on Requests for Waivers, 1994-98
Approved requests
55%
Able to accomplish
without a waiver28%
Other9%
Disapproved8%

U.S. Department of Education FY 2000 Annual Plan, Volume 1 Page 142
Indicator background and context. In the past, the grant making cycle was unduly influenced by the timingof the federal fiscal year. Our re-engineered grant process is based upon making grants in an timely fashionthat is not bound by the parameters of the fiscal year. ED is committed to making new grant awards in time sothat grantees can plan for successful implementation. The Department has set a May deadline for thecompletion of grant awards.
Percentage of new grants awarded by May§ 1998 32 percent § 1999 48 percent (goal)§ 2000 60 percent (goal)
Limitations of the data. Limitations are minor and have little overall impact.Verification/validation of measures. Data are validated against data runs done by the Grants Policy andOversight Staff from the Grants Administration and Payment System.Data source(s). Self-reports from Principal Offices; Grants Administration Payment System Reports.
Indicator 80. Reports from program monitoring teams and audit reports under theSingle Audit Act will show a reduction in significant findings.
Indicator background and context. Recurring findings identified during program monitoring reviews andsingle audits, such as those under the Single Audit Act, provide one measure of the success of correctiveaction taken by grantees to better manage federal education funds and adhere to grant terms. CooperativeAudit Resolution and Oversight Initiative (CAROI) efforts to resolve audits to date, in specific States, haveyielded reductions in instances of time distribution violations, and other significant recurring findings. TheDepartment plans to continue to employ the CAROI approach to effectively address audit issues and preventfindings from recurring in subsequent years. Data collection to create baseline data for future performancemeasurement began in late 1998. The FY 1996 Single Audit reports received by the Department identified 89findings repeated from prior years.
Limitations of the data. CARS, ED’s automated Central Audit Resolution System, tracks the number ofsingle audit findings and can now identify audit findings from one year to the next. ED will begin retrievingfrom CARS the number of findings by State reported in FY 1996 single audits and chart the number ofrecurring findings beginning with the FY 1997 single audit reports and for each year thereafter. With regardto program monitoring, most Program Offices currently do not have databases that track findings identifiedduring program reviews. To measure recurring findings identified during program monitoring reviews,databases in the Program Offices will need to be created.Verification/validation of measures. OMB requires that single audit reports contain a section on recurringfindings. These recurring findings are verified and validated by independent auditors. During programmonitoring reviews, review teams comprised of ED staff identify and report findings. Reports are maintainedin various program offices.Data source(s). Single Audit reports, ED’s Central Audit Resolution System and ED program monitoringreview reports.
Indicator 81. The number of states participating in the Cooperative Audit Resolutionand Oversight Initiative (CAROI) will increase to meet the needs of our partners.

U.S. Department of Education FY 2000 Annual Plan, Volume 1 Page 143
Indicator background and context. As of August 1998, there are 13 states participating in CAROI (seeFigure 85). The target level of participation is 40 states by 2000. The Department projects that by the end ofFY 1999, at least 25 states will be participating. CAROI serves as a collaborative method that links program,finance, auditing, and legal staffs at the federal and state levels to provide alternative and effectiveapproaches to resolve findings and recurring problems identified through audits. The goal of CAROI is toimprove education programs and the management of those programs at state and local levels through betteruse of audits, monitoring, and technical assistance. A primary objective of addressing issues in astraightforward and collaborative manner is to minimize costly litigation.

U.S. Department of Education FY 2000 Annual Plan, Volume 1 Page 144
Figure 84
Limitations of the data. This indicator measures the number of states participating in CAROI rather thandesired outcomes.Verification/validation of measures. Signed participation agreements are on file at the Department ofEducation.Data source(s). Office of Inspector General's database system(s).
States Assisted Under the Cooperative Audit Resolution and Oversight Initiative (CAROI)
1013
25
40
0
5
10
15
20
25
30
35
40
45
1997 1998 1999 2000
Goal
Goal

U.S. Department of Education FY 2000 Annual Plan, Volume 1 Page 145
Objective 4.3: An up-to-date knowledge base is availablefrom education research to support education reform andequity
Context: It is critical that the nation possess a healthy knowledge base to support systemic educationreform and equity. Nearly all states and districts have drawn on research findings to help frame theirschool improvement efforts. The nation’s student population is growing more diverse. Parents and thepublic are expecting schools to help all students reach high standards. Consequently, high qualityresearch is needed to meet the demand for specific, evidence-based guidance and effective strategies tohelp improve student achievement and close the achievement gap.
Adequate capacity, a relevant research agenda, high quality research, and useful findings and products arenecessary for a sustained knowledge base. The Department of Education supports research primarilythrough the Office of Educational Research and Improvement (OERI). Key areas of education researchinclude: at-risk students, education governance and finance, assessment, early childhood development,postsecondary education, professional development and effective teaching, early reading, andmathematics and science instruction. In addition, the Department funds research and developmentactivities in the areas of special education, bilingual education, adult literacy, and vocational education.
External factors: While conducting educational research and collecting data is an acknowledged federalrole, limited resources for research and development activities often restrict the capacity of the federalgovernment to sufficiently address the wide range of important educational problems facing the nation.Currently, less than 0.1 percent of the $300 billion spent annually on public K-12 education supportseducational research. This is in sharp contrast to the 23 percent that the pharmaceutical industry, forexample, spends on developing and testing prescription and non-prescription medications. And it is farless than the federal investment in health research which is estimated to be 30 times larger than theinvestment in education research.
Key strategies
n Form partnerships with other agencies to conduct cutting edge research.
§ OERI, NSF, and NICHD have announced a new interagency Education Research Initiativedesigned to bring together researchers from various disciplines.
§ NCES and NSF are jointly funding a replication of the Third International Math and ScienceStudy (TIMSS) in 8th grade in spring, 1999 to help states and districts benchmark studentperformance.
§ OERI and NICHD have initiated a joint effort to study how Spanish-speaking children learn toread English.
§ The National Center for Education Statistics, the Department of Agriculture, and the Departmentof Health and Human Services will add a birth cohort to the Early Childhood Longitudinal Study.
n Strengthen internal research capacity.
§ Continue to recruit visiting scholars through a partnership with the National Research Council.§ Initiate a new post-doctoral fellowship program to strengthen intramural research.

U.S. Department of Education FY 2000 Annual Plan, Volume 1 Page 146
§ Recruit new, diverse staff with extensive research background to agency.
Selected Accomplishments
Informing policies and practices in systemic, standards-based reform§ The OERI-supported Consortium for Policy Research in Education (CPRE) has provided research
and helped design standards-based reforms in several states including MI, DE, MA, and MO.§ The OERI-supported National Center for Research on Evaluation, Standards, and Student Testing
(CRESST) has helped states develop new assessment systems aligned to their state content standards,including CA, WA, KY, MD, HI, AZ, CO, TX, VT, and WY.
§ NCES and NSF are jointly funding a replication of the Third International Math and Science Study(TIMSS) in 8th grade in spring, 1999 to help states and districts benchmark student performance.
§ Comprehensive approaches to educating students at-risk of academic failure like Success for Allhave been developed by the OERI-supported Center for Research on the Education of StudentsPlaced At Risk (CRESPAR). These approaches have been adopted in over 1,100 schools in 44 states,with the adoptions continuing to increase.
§ NCES publications, such as the Condition of Education and the Digest of Education Statistics areextensively used by states as statistical resources on educational trends. NAEP data are being usedby over 40 states to benchmark state results to national data and are issued on a more timely basis.
§ CRESST is working directly with the Los Angeles Unified School District and Chicago PublicSchools in revising their assessment systems and revamping their management information systemsto track students’ progress, enhance reporting (particularly for Title I students), and make informeddata base decisions.
§ The National Academy of Sciences report “Preventing Reading Difficulties in Young Children”,which was supported by the Department, is being used by states and districts to improve readinginstruction.
Building research capacity to solve critical problems in education§ OERI, NSF, and NICHD have announced an interagency Education Research Initiative (ERI) to
foster innovative research, including large-scale intervention studies, on school readiness, K-3learning in reading, math, and science, and pre K-12 teacher education in reading, math, and science.
§ OERI and NICHD are developing a research program to learn more about effective ways to teachSpanish speaking children to read in English.
§ Initiated, with the National Research Council, a visiting scholars program to help improve OERI’sinternal capacity to plan and direct research.
§ ED (NCES), USDA, and HHS are jointly undertaking an early childhood longitudinal study.
Enhancing research quality by setting standards and strengtheningpeer review• Completed all mid-point peer reviews of OERI’s Research and Development Centers.• Improved standards for data collection, analysis, and reporting by NCES.• OERI has commissioned an expert panel to develop guidelines for judging the quality of educational
research.• Improved peer review system initiated for the current Field Initiated Studies competition to ensure
support of the highest quality proposals.

U.S. Department of Education FY 2000 Annual Plan, Volume 1 Page 147
n Focus research on solving critical problems in educational policy and practice.§ OERI’s advisory board, the National Educational Research Policy and Priorities Board, has
contracted with the National Academy of Education to develop a research agenda to help closethe achievement gap.
§ The OERI, NSF, NICHD interagency Education Research Initiative will focus on developingreading and mathematics skills in young children, improving school readiness, improving the useof technology, and improving professional development for educators, leading to large-scaleinterventions.
§ Include state and local policy makers, practitioners, and representatives from appropriateorganizations in the development of research plans.
§ Work with associations of policymakers and practitioners to develop a new system to evaluate therelevance of OERI-funded research efforts.
n Ensure that research and development activities are of high quality.§ Develop guidelines for judging the quality of educational research.§ Improve procedures for peer review of field-initiated studies to ensure funding of the highest
quality proposals.§ Work with NICHD on peer review standards and procedures for jointly funded activities.§ Work with OERI supported research and development centers to follow-up on mid-point reviews.§ Work with associations of researchers to develop a new system to evaluate the technical
soundness of OERI-supported research.
Coordination with other federal agencies
For coordination efforts, please see section above, “Key Strategies.”
Programs supporting this objective
n National Education Research Institutesn Regional Educational Laboratoriesn National Center for Research in Vocational Educationn National Programs in Adult Educationn National Institute on Disability and Rehabilitation Researchn IDEA: Research and Innovation (Part D)
Performance indicators and charts
Indicator 82. Education research is responsive to high priority needs of educationpolicy makers and practitioners.
Indicator background and context. All applications for education research funding are currentlyevaluated by peer reviewers for national significance, and only those judged significant are funded.
Limitations of the data. The definition of national significance has been left to the judgment ofindividual reviewers.Verification/validation of measures. OERI will develop a process to validate the results of the newsystem described below.

U.S. Department of Education FY 2000 Annual Plan, Volume 1 Page 148
Data source. Working with representative professional organizations of education policy makers andpractitioners, OERI will develop a new system to evaluate the relevance of the research it funds to solvingcritical problems faced by education policymakers and practitioners. Collected throughout the year andreported annually beginning in fall, 1999.
Indicator 83. Education research meets standards of fully acceptable scientific quality.
Indicator background and context. There is more frequent use of peer review standards to guideinternal competitions for OERI research funds. A major OERI initiative to develop commonlyaccepted standards of evidence for judging research quality is beginning. Mid-point reviews of OERIsupported research and development centers have been completed. In general, reviewers found theactivities of the centers to be of high quality.
Limitations of the data. No common standards are used to rate activities so inter-rater reliability isunknown.Verification/validation of measures. OERI will develop a process to validate the results of the newsystem described below.Data Source. Using the new standards of evidence, OERI will work with representative professionalorganizations of education researchers to develop a new system to evaluate the technical soundness of thework it supports. Collected throughout the year and reported annually beginning in fall, 1999.
Indicator 84. OERI supported research and products are useful to policy makers andpractitioners.
Indicator background and context. A 1997 NCES Customer Survey found that 86 percent ofcustomers believed that NCES products were useful; 80 percent of consumers of regional laboratoryproducts found them to be useful.
Limitations of the data. Customer surveys are a valid of method of determining utility of OERIproducts.Verification/validation of the data. OERI will develop a process to validate the results of theprocedures described below.Data sources. OERI will convene a panel of practitioners and policy makers to assess the usefulness ofstudies and products developed by the R&D centers, fall 1999. NCES will periodically conduct surveysof customer satisfaction. Usefulness of regional laboratory products and services will be assessed throughan independent evaluation. Results will be available in fall 1999.

U.S. Department of Education FY 2000 Annual Plan, Volume 1 Page 149
Objective 4.4: Our information technology investments aresound and used to improve impact and efficiency.
Context: The Department must be committed to carrying out the mandates of the Information TechnologyManagement Reform Act of 1996 (Clinger-Cohen Act). The Clinger-Cohen Act requires the Department tosignificantly improve the acquisition and management of information technology in order to advance missionperformance and service delivery. The Department is also addressing the need for all major informationsystems to become Year 2000 compliant, mission-justification of major information system investments,network and web support and the reduction of paperwork burden.
External factors:
§ Year 2000 efforts will be ongoing as the industry discovers new compliance issues.§ ED requires additional training in the management of a complex network and personal computer
infrastructure and in financial analysis.§ Highly trained technical and information technology management professionals command higher salaries
in the private sector than the federal government can offer; thus they are difficult to recruit. The ChiefInformation Officers Council (CIO) is weighing a separate pay scale for government informationtechnology employees.
§ ED, like all federal agencies, awaits a final policy on electronic records management from the NationalArchives and Records Administration. The policy may affect resources devoted to expanding Internetservice offerings.
Key strategies
n Year 2000 compliance.§ To continue to implement a major Department effort to become Year 2000 data compliant--to ensure
that ED's data users and customers are not affected by data corruption resulting from hardware,software, and devices with embedded technology that cannot correctly process date-relatedinformation.
§ The Department is pursuing extensive contingency planning and end-to-end testing (the testing ofdata exchanges between Department systems and external trading partners). Detailed contingencyand risk mitigation plans for all core business processes are expected to be completed by March 31,1999
§ The Department received $11.996 million in FY 1999 to ensure that all 175-computer systems areYear 2000 compliant by March 1999.
n Use information technology to increase the efficiency and effectiveness of ED’s operations.§ To ensure that the Department has a cost-effective, efficient, accessible, and reliable network
infrastructure by continuing to implement a Product Support Plan (PSP) that provides guidance ofstandard hardware and software products supported by ED.
§ To continue to provide a reliable and secure Internet service by implementing ED's redesigned Website, which incorporates interactive forms, new products and technologies, and additional customerfeedback opportunities.
§ The request includes $26.3 million to maintain automated data processing systems, includingnetwork operations, and provide the latest technology to increase productivity and to provide bettercustomer service.
§ In response to a challenge from the Deputy Secretary, ED is embarking on a strategy to transformitself into a high-performance service and learning organization. This strategy proposes using

U.S. Department of Education FY 2000 Annual Plan, Volume 1 Page 150
technology to reengineer business process and customer service. The Internet Working Group (IWG)devised the strategy and will take the lead in implementing.
§ As a part of this strategy, ED will expand its Intranet to bring workflow and informationdissemination tools to all ED employees.
§ The Chief Information Officers Council has worked in partnership with Training and DevelopmentCenter to create the Learning Network, which provides computer and policy training at the desktopof all ED employees in headquarters and in the regions.
§ The Chief Information Officers Council and Training and Development Center together will examineemployee core competencies in technology. The results of the project will allow for better targetingfor training. The project should be completed within the next 12 months.
§ The Internet Working Group began a redesign of the Web site in September 1998. The focus of theeffort is to improve our ability to answer customer questions.
§ OVAE is participating in the Virtual Office pilot.
n Cost-effective major systems that deliver for ED and its customers.§ To assess current and proposed major information systems, such as student financial systems and
financial systems as described in objectives 3.3 and 4.6, by continuing the Information TechnologyInvestment Review Board's systematic and careful review of the acquisition and implementation ofinformation technology.
§ To implement a capital planning and investment control process as required by the Clinger-CohenAct.
n Data collection.§ To continue to improve data collection by increasing ED's use of information technology tools to
help us better manage the Department's data collections. This will reduce paperwork burden to thepublic.
§ To increase the percentage of data collections allowing electronic responses, with the goal ofallowing all data collections to be electronic.
n Legislative or regulatory.
Selected AccomplishmentsAddressed Y2K compliance in ED and in schools.Major progress realized in Y2K compliance§ 13 out of 14 mission critical systems compliant, validated and implemented as of February 18, 1999.
The remaining mission-critical system will be completed by March 15, 1999.§ 99 percent of non-mission critical systems are Y2K compliant. The one non-compliant non-mission
critical system will be completed by March 31, 1999.§ Broad outreach campaign to assist education community in achieving Y2K compliance including end-
to-end testing (the testing of data exchanges between Department systems and external tradingpartners).
Improved Technology Infrastructure.§ Stabilized network services by conversion to common platform, reduction in number of servers, and
other configuration management efforts.§ Developed and disseminated IT Architecture Framework, providing guiding principles for IT
investment, management and decisions, Volume 1§ Strengthened IT internal review board and related technology management processes to broaden
participation in technology planning and use across the Department.§ Established connectED, which is the Department's Intranet.
Expanded Internet Presence.§ Built ED.GOV and related Web sites to reach large numbers of customers with high quality and timely
information.§ Distributed ED initiatives and other electronic communications to over 13 thousand people in schools,
state and local governments, and others in the education community.§ Increased integration of the Internet in grants management processes such as application distribution,

U.S. Department of Education FY 2000 Annual Plan, Volume 1 Page 151
§ The Department is committed to addressing accessibility and reasonable accommodationrequirements under the Rehabilitation Act of 1973.

U.S. Department of Education FY 2000 Annual Plan, Volume 1 Page 152
S & E resources supporting this objective
§ The Department received $11.996 million in FY 1999 to ensure that all 175-computer systems are Year2000 compliant by March 1999.
§ Information Technology Architecture Development -$100,000 budgeted for FY 2000.§ Data Coordination Committee - $750,000 budgeted for FY 2000.
Other S&E resources supporting this objective for FY 2000:
n Organizational units with a significant role in accomplishing this objective.§ OCF&CIO’s Information Technology Investment and Capital Planning Group.§ The Information Technology Investment Review Board (ITIRB) advises the Secretary of Education
on the Information Technology (IT) investments to be funded. The ITIRB is also charged with theresponsibility to review progress of ongoing IT initiatives and to evaluate performance andoutcomes.
§ The Department also created an Information Technology Architecture Working Group, which isresponsible for overseeing development of the ITA.
n Special staff training§ In order to successfully implement the IT Investment Management Process, IT project managers will
be trained in financial analysis and a performance-based project management system, such as earned-value project management. Training will be an important resource to fully develop these skills.
§ The Department developed an implementation plan for compliance with the Clinger Cohen Actwhich includes: the development of information technology competencies for IT professionals,executives and managers; the assessment of skills against the competencies; and training to buildskills. Needed knowledge has been identified and training begun for the Department’s InformationTechnology and Information Resources Board (ITIRB).
Performance indicators and charts
Indicator 85. All major information systems needing repair will be converted to Year2000 compliance by March 1999 (giving time for testing during 1999).
Indicator background and context. Each federal agency is required by the Office of Management andBudget (OMB) to ensure that its information systems are fully compliant by March 31, 1999. OMB andGAO have provided guidance to assist agencies in planning, managing, and evaluating their Year 2000programs through a four phased process: assessment, renovation, validation, and implementation.
The Department has established a Year 2000 project team, designated coordinators in each office, developedcapacity for technical solutions, and hired KPMG and Booz-Allen and Hamilton as management consultantcontractors. The chart below illustrates the Department's mission-critical systems and their progress to date.The Department identified 14 mission-critical systems. As of February 12, all but one is fixed andimplemented. The last one will be fully implemented by March 15. Non-critical systems—161 in allare also undergoing the same four phases: assessment, renovation,validation and implementation (see Figure 86). As of February 18, 1999, all but one of the 161 non-criticalsystems had completed the four-phase process. The final system will be completed by March 1999.

U.S. Department of Education FY 2000 Annual Plan, Volume 1 Page 153
In addition, the Department is pursuing extensive contingency planning and end-to-end testing (the testing ofdata exchanges between Department systems and external trading partners). Detailed contingency and riskmitigation plans for all core business processes are expected to be completed by March 31, 1999. Most dataexchange testing with other Federal agencies will also be completed by the end of March, while data exchangetesting with postsecondary institutions and other external trading partners will extend into the summer.
Figure 85
Status of U.S. Department of Education Year 2000 Conversionsfor Mission-Critical Systems, as of February 12, 1999
(Shading = Completed)Y2K Phases
# Mission Critical System Ass
essm
ent
Ren
ovat
e
Val
idat
e
Impl
emen
t(t
arge
t da
te)
Stat
us
Student Financial Aid Systems1 Central Processing System (CPS) Completed
2 Direct Loan Central Database Completed
3 Direct Loan Origination System Completed
4 Direct Loan Servicing System Completed
5 Postsecondary Education Participants System (PEPS) Completed
6 Multiple Data Entry System (MDE) Completed
7 Title IV Wide Area Network (TIVWAN) Completed
8 Campus-Based System (CBS) Completed
9 Federal Family Education Loan Program System (FFEL) 3/99
10 Pell Recipients and Financial Mgmt System (PELL) Completed
11 National Student Loan Data System (NSLDS) Completed
Other Program Systems12 Impact Aid Payment System Completed
ED Administrative Systems13 ED Central Automated Processing System (EDCAPS) Completed
14 Education's Local Area Network (EDLAN) Completed
Limitations of the data. Until the revised systems are active in a live environment, with data exchanges fromexternal customers, Y2K compliance cannot be established with certainty.Verification/Validation of measures. All mission-critical systems are independently verified and validatedby a third-party contractor.Data source(s). Monthly and Quarterly Progress Reports to OMB, based on ED's inventory of systems,Y2K assessments, and subsequent monitoring of the renovation, validation, and implementation phases.
Indicator 86. At least 90 percent of all employees will assess productivity as"significantly improved" as a result of available technology, as shown by the employeesurvey in 2000.

U.S. Department of Education FY 2000 Annual Plan, Volume 1 Page 154
Indicator background and context. According to the 1996 employee survey, 70.2 percent of ED employeesmostly or strongly agree that their productivity has improved as a result of available technology
Limitations of the data. New data supporting this indicator will not be available until the year 2000. TheCIO hopes to increase that level of agreement to 90 percent by the year 2000. Verification/validation of measures. Success in these functions will be assessed by customer satisfactionsurveys now being developed and possibly by other indirect means. As a result, interim data may be availablebefore information from the Employee Survey 2000 becomes available.Data source(s). Employee Survey 2000, Customer Satisfaction Surveys, and other data gathering methods asdecided.
Indicator 87. All Information Technology Investment Board assessments will showthat major information systems are mission-driven, cost-effective, and consistent withour information technology architecture, and supported by performance-basedcontracts.
Indicator background and context: All Information Technology Investment Review Board (ITIRB)assessments will show that major information systems are mission driven, cost-effective, consistent with ourinformation technology architecture, and supported by performance-based contracts. In order to use thisindicator, a baseline of cost, schedule, and performance goals for each of our major IT projects will becreated. At specific intervals thereafter--e.g., six months or one year--the Department will measure actualproject results against the project estimates for each major project to calculate variances of cost, schedule, andperformance. The Department’s goal is that 80 percent of our major IT projects will be within a 10 percentvariance of their cost, schedule, and performance goals by FY 2001.
IT Projects within a 10 Percent Variance of Cost,Schedule, and Performance Goals
n The Information Technology Investment Review Board (ITIRB) is initiating the systematicconsideration of all proposed IT projects for funding decisions. In spring 1999, the ITIRB willbegin the IT Investment management process, e.g., selection, control, and evaluation, for all majorIT projects proposed within the Department for the 2001 budget.
n The ITIRB has made decisions on the following issues:§ Y2K centralized PC replacement, allowing lease or purchase option;§ Long-term electronic mail solution (Microsoft Exchange);§ Use of Lotus Notes as an application development tool;§ Selection of standard office suite software (Microsoft Office);§ Central management of Web servers; and§ Adoption of the Product Support Plan, which introduced product standardization.
n Completed the Enterprise Information Technology Architecture, The Architecture Framework,Volume I, in September. The document is published on connectED, and the ITIRB has been briefedon the architecture process.
n Developed the IT Architecture Principles Guidance, which provides development and managementinstructions for IT project sponsors.
n Developed ITIRB core competencies and began training to the competencies.n Completed Exhibit 42 Data on Information Technology for budget submission. This Exhibit
classifies Department IT project spending in three categories: mission area, infrastructure and officeautomation, and IT architecture and planning. The exhibit indicates, by category subtotals, the

U.S. Department of Education FY 2000 Annual Plan, Volume 1 Page 155
percentage of IT projects under development, or in modernization, and the funding sources for ITprojects.
Note: The 10 percent variance is based on OMB guidance for implementation of the Clinger-Cohen Act,which states that IT projects should be within a 10 percent variance of expected goals.
Limitations of data. Calculating the performance variances may prove difficult. The level of difficulty andthe utility of using this measure will not be known with certainty until we initiate its use. Calculating theother variances should be uncomplicatedVerification / validation of measures. Data will be obtained for each of the Department’s major ITprojects. The data will forecast the project’s cost, schedule, and performance goals. The data will constitutethe baseline or reference point for the IT project. At a specified time interval or milestone--e.g., six monthslater--the project’s progress, (e.g., cost-to-date, schedule-to-date, and performance-to-date) will be measured. Variances will be determined by comparing the actual results against the forecast or baseline. By trackingvariances to determine project progress for all of our major IT projects and considering the project dataavailable at the time the ITIRB made funding decisions, the Department can assess the performance of theITIRB and the validity of our measures.Data source(s). The data will come from each IT project sponsor and will be validated by a review of thePrincipal Office ADP budget.
Indicator 88. Data reporting burden on public will be reduced annually.
Indicator background and context. The Paperwork Reduction Act of 1995 (PRA) set a 10 percentreduction goal for FY 1996 and FY 1997, and 5 percent for FY 1998 through FY 2001, for federal agenciesto reduce the burden of information collections on the public. Since the PRA was enacted, the Departmenthas exceeded its goals (see Figure 87). The Department reduced data-reporting burden by 8.4 million hours(14.7%) in FY 1996, and 5.4 million hours (11%) in FY 1997. As of September 1998, the Department hasreduced its burden by 2.8 million hours (6.5%) surpassing the FY 1998 goal. These significant burdenreductions can primarily be attributed to the Department’s increased use of information technology,successful regulatory reinvention efforts, and numerous programs reinventing and streamlining theirinformation collection efforts.

U.S. Department of Education FY 2000 Annual Plan, Volume 1 Page 156
Figure 86
Limitations of the data. Burden hours are estimated for all information collections. Based on experience,estimated burden hours tend to be more accurate for older collections, which are renewed on numerousoccasions. Burden hour estimates for newer collections are probably less accurate. However, all informationcollections are subject to the Information Management Group (IMG), OMB, and public reviews, and allcomments made must be addressed by law.Verification/validation of measures. Paperwork burden hours for Departmental information collections areverified/validated on a continuous basis by the Information Management Group (IMG). IMG is responsiblefor reviewing and approving information collection packages submitted by Principal Offices for OMBclearance. In addition, the Department’s collection burden hours are verified against the Department’sInformation Collection Inventory, issued monthly by the Office of Management and Budget, Office ofInformation and Regulatory Affairs.Data source(s). Information Collection Budget of the United States Government, Fiscal Year 1998, issuedby the Office of Management and Budget, Office of Information and Regulatory Affairs (OMB/OIRA), July20, 1998; Monthly Information Collection Inventory issued by OMB/OIRA, as of July 31, 1998; InformationCollection Clearance Packages submitted by Principal Offices.
Goals and Actual Paperwork Reduction in Millions of Hours
5.74.9
2.2 2.04 1.9
8.4
5.4
2.8
0
1
2
3
4
5
6
7
8
9
FY 1996 FY 1997 FY 1998 FY 1999 FY 2000Reduction GoalActual Reduction

U.S. Department of Education FY 2000 Annual Plan, Volume 1 Page 157
Objective 4.5: The Department’s employees are highly skilledand high-performing.
Context: To effectively lead educational reform, the Department must provide its workforce with criticalskills and tools, as well as a quality workplace. GAO reports have highlighted the need for the Department todevelop strategic management systems, including those for human resources. Recent employee surveys haveidentified the need for quality, cost-effective learning opportunities, especially for current and prospectivemanagers, and improving the quality of the work environment. To ensure the continuous development andhigh performance of all Department employees, planned activities through 2000 and beyond will build uponrecent innovations, such as the automated, multi-rater (“360”) performance appraisal system and an online,computer-based learning network.
External factors: The implementation of new technology in the workplace will profoundly impact theDepartment’s ability to meet changing work requirements, serve its customers efficiently and effectively, andincrease accountability for results. The Department’s plan incorporates innovative uses of technology tosupport employee development.
Key strategies
n High staff and organizational performance.§ Provide professional development opportunities to ED managers and employees to improve
performance. Examples of opportunities include mobility assignments, mentoring, executivecoaching, programs in project management, technology, and leadership and managementdevelopment.
§ Provide intact teams of managers with training to improve skills in managing a diverse workforce,dealing effectively with work performance issues, and setting and achieving strategic goals.
§ Provide employees with training identified as high priority for work critical to the Department’smission: using technology, project management, and analysis.
§ Provide managers and employees, both in headquarters and regional offices, with a wide range ofdevelopmental opportunities, including work-site, work-related courses for college credit; access to“best in business” developmental programs sponsored by the Office of Personnel Management,Federal Executive Institute and other providers; and career development and career planning servicesavailable through the Department’s Training and Development Center.
§ Encourage employees to participate in the mobility assignment program, mentoring, upwardmobility, and other developmental opportunities, including training in communication skills andinterpersonal relations.
§ Effectively use technology investments, including the Department’s automated, multi-rater (“360”)performance appraisal system and linked individualized development planning system, the LearningNetwork, and distance learning technologies to ensure employee professional development and highperformance.
§ Implement recommendations from 1998 benchmarking of Department’s training and developmentservices.
§ Ensure that organizations are prepared to meet tomorrow’s workforce, program, and managementchallenges through strategic workforce and/or succession planning.
n A healthy, safe, secure and accessible workplace for all employees.§ Ensure employees who move to newly renovated headquarters and regional facilities are satisfied
with workplace services, including those related to the actual moves.

U.S. Department of Education FY 2000 Annual Plan, Volume 1 Page 158
§ Ensure measures of workplace quality, including air and water quality, are consistently high, as aremeasures of satisfaction with the responsiveness of services requested through the Department’scustomer service center.
§ Ensure that the Department’s programs and activities are accessible to employees and customerswith disabilities.
n A fair, efficient, responsive, and productive environment for all employees.§ Assess whether the recently opened Informal Dispute Resolution Center (IDRC) and related efforts
have been successful in helping employees and managers to avoid and/or promptly resolve EEOcomplaints or other matters of dispute.
§ Encourage resolution of formal complaints at the earliest stage possible by rendering final agencydecisions in-house and thereby minimizing the caseload at EEOC.
§ Develop and implement a proactive organization performance review process to enhanceorganization productivity.
§ Expand work/life programs and services to ensure a family friendly work environment forheadquarters and regional employees.
n An appreciation for diversity.§ Continue the dialogue about race relations started in 1998 under the President’s Initiative on Race
and implement ideas generated during these discussions. Sponsor cultural awareness activities,including employee discussion groups, cultural fairs and speaker series to enable employees toexchange information and perceptions about race relations and means to improve them.

U.S. Department of Education FY 2000 Annual Plan, Volume 1 Page 159
Coordination with other federal agencies
n The Department coordinates building services through the General Services Administration (GSA) andsome human resource staffing and administrative change services through Office of PersonnelManagement. The Department has also developed a relationship with the National Academy of PublicAdministration as members of the Human Resources and Performance Consortia for improving overallperformance.
Performance indicators and charts
The following indicators were selected to measure progress with regard to improving the quality andproductivity of the Department’s workforce and workplace. Taken together, these indicators represent thefoundation of a strategic management system that will help the Department carry out its leadership role inimproving education in America.
Indicator 89. By 2000, 75% of survey respondents will agree that manager andemployee knowledge and skills are adequate to carry out the Department’s mission.
Selected AccomplishmentsInitiated an ongoing Department-wide dialogue on race relations. § Under the President’s Race Initiative, the Department convened listening and dialogue sessions
for headquarters and regional employees to discuss race-related concerns. To date, components ofthe Department have established staff meetings, suggestion boxes, and surveys, to improveoverall communications and teamwork in the agency. These efforts will continue, and will leadto longer-term recommendation, to improve working relations in the Department.
Put The Learning Network on-line . § The Learning Network, (TLN) allows employees to access needed training from their desktops.
Over 10,000 “visits” have been made to TLN, where self-paced, on-line courses are available toenable employees to improve skills using computer software .
Established an Informal Dispute Resolution (IDR) Center. § In October 1997, the Department’s one-stop shop for information about and assistance with
employee concerns became fully operational. Headquarters employees can call or visit the Centerto obtain information, counseling or mediation services related to matters of concern to them. InFY 1998 there were 164 cases handled.
Consolidation of work-life programs.§ The Department established the Work/Life Programs Group to provide a focal point for
researching, developing and implementing initiatives designed to help improve the quality of thework-lives of the Department’s employees. The Group includes programs to provide flexibleworkplace arrangements, a child care center and transit subsidies, to ensure the workplace healthand safety of employees.
Improved physical security. § In June 1998, the Department elevated its building security to a level 5 status in all of its occupied
buildings. As a result, additional security guards were hired, post orders were revised, and newsecurity devices were installed.
Renovated headquarters facilities. § In October 1998, the Department moved approximately 1300 of its headquarters employees into
renovated quarters, providing them with modular, well-lighted, technology-friendly workspaces. The new facility is designed to maximize employee productivity and improve the quality ofworklife for Department employees. During 2000, the Department plans to complete its work on

U.S. Department of Education FY 2000 Annual Plan, Volume 1 Page 160
Indicator background and context. Survey and focus group data and information from the GAO indicatesthat agency managers lack confidence, staff knowledge and skills to adequately manage employeeperformance and large systems. Training and developing current and future managers in the Department willremain a high priority through 2000 and beyond.
One example highlighted by the Employee Survey is that the ability to lead effectively remains a concern ofemployees. The 1996 Employee Survey indicated 42.7% agree that management provides effective leadershipin their organizational unit. An April 1998 survey of ED managers revealed that only 58% of ED managersagree that staff possesses knowledge and skills adequate to carry out ED’s mission. Additionally, the 1998National Partnership for Reinventing Government (NPRG) Survey reported similar results withapproximately 53% of Education employees agreeing that they receive the training they need to perform theirjobs.
Following implementation of the strategies outlined above, an extensive employee survey effort is planned for2000, including external customer input, and to assess overall progress in meeting performance targetsrelated to improving employee satisfaction with training opportunities and readiness to perform the work ofthe Department.
Figure 87
Limitations of the data. The major data source to measure employee satisfaction levels will not be availableuntil the 2000 Employee Survey. Training and Development Center (TDC) staff conducted the April 1998survey of managers and manually tabulated the results.Verification/validation of measures. Independent contractors will administer official Department employeesurveys and conduct evaluations. Just-in-time surveys and focus groups are conducted in-house by theresponsible organization to track intermediate progress. In addition, other relevant administrative records andinformation system reports will be used to determine the quality of employee responses and services tocustomers.Data source(s). 1993 & 1996 Employee Surveys, April 1998 TDC Survey of Managers, 1998 NationalPartnership for Reinventing Government Survey
Managers and Employees Express Need for ImprovedSkills and Knowledge
5 7 . 9 %6 0 %
4 2 . 7 %
7 5 %
0 . 0 %
1 0 . 0 %
2 0 . 0 %
3 0 . 0 %
4 0 . 0 %
5 0 . 0 %
6 0 . 0 %
7 0 . 0 %
8 0 . 0 %
9 0 . 0 %
1 0 0 . 0 %
1996 2000 1998 2000Managers and employees whoagree that management in myorganizational unit provides
effective leadership.”
Managers who agree their staffpossess knowledge and skills
adequate to carry out theDepartment’s mission.
Goal
Goal

U.S. Department of Education FY 2000 Annual Plan, Volume 1 Page 161
Indicator 90. By 2000, most employees will indicate satisfaction with their workenvironment (e.g. physical surroundings, noise level, air quality), security andaccessibility.
Indicator background and context. The work environment is a critical contributing element to agency andemployee performance. From 1993 to 1996 there was a 14% average increase in employee satisfaction levelsin the areas of physical environment, building security and accommodations for persons with disabilities (seeFigure 88). The Department is committed to improving its work environment by relocating employees tomore modernized and newly renovated workspaces. The 1996 Government-wide Organizational AssessmentSurvey (OAS) (administered by the Office of Personnel Management (OPM)) highlighted a 60% satisfactionrating with the physical work conditions of Department workspace. (Note: Upon review of OPMgovernment-wide customer satisfaction data, the performance goal for this indicator has been revisedfrom data reported in the FY 1999 Annual Plan.)
As a result of recent threats of international terrorism, the Department has increased the scope and breadth ofbuilding security for all employees. In addition, efforts are being made to provide employees with disabilitiesthe same access to services, information and products as other employees. These efforts should significantlycontribute to achieving our 75% employee satisfaction target with the work environment by FY 2000.
Figure 88
Sat isfact ion With Work Environment Increasing
3 1 %
3 9 %
4 8 %4 9 % 5 0 %
6 2 %
7 5 %7 5 %7 5 %
0 %
1 0 %
2 0 %
3 0 %
4 0 %
5 0 %
6 0 %
7 0 %
8 0 %
1993 1996 2000 1993 1996 2000
“My physical workenvironment”
“Securi tyarrangements in my
building”
“Accommodat ions forpersons withdisabil it ies”
Goal GoalGoal
1993 1996 2000
Per
cen
t G
oo
d/V
ery
Go
od
Res
po
nse
s

U.S. Department of Education FY 2000 Annual Plan, Volume 1 Page 162
Limitations of the data. The major data source to measure employee satisfaction levels will not be availableuntil the 2000 Employee Survey. ED is working on developing additional indicators such as measures of airand water quality and using customer help desk reports to track work environment quality improvementsVerification/validation of measures. Independent contractors will administer official Department employeesurveys and conduct evaluations. Just-in-time surveys and focus groups are conducted in-house by theresponsible organization to track intermediate progress. In addition, other relevant administrative records andinformation system reports will be used to determine the quality of employee responses and services tocustomers.Data source(s). 1993 and 1996 Employee Survey, 1996 OPM Organizational Assessment Survey, andCustomer Service Center Help Desk data
Indicator 91. By 2000, most employees and managers will express high satisfactionwith assistance on resolving disputes, balancing work and life responsibilities andaddressing organizational and employee problems
Indicator background and context. This indicator seeks to measure the Department’s expanded view ofimproving the quality and productivity of its work environment. With regard to dispute resolution, the 1996Employee Survey indicated 72% of employees know where to go receive assistance in resolving disputes (seeFigure 89). The opening of the Informal Dispute Resolution Center (IDRC) and reengineering of the EEOoffice has improved service delivery for customers and the percentage of disputes resolved informally hasincreased significantly from 63% in 1997 to 79% in 1998.
The Department’s Work/Life Program is designed to provide ED employees with a range of options to bemore productive in their work, family and personal lives. Currently, this program provides options includingalternative work schedules, voluntary leave transfers, volunteer initiatives, flexiplace, childcare, Parenting atthe Workplace Program, and the Employee Assistance Program. An October 1997 assessment of flexiplaceemployees by an independent contractor reported numerous qualitative benefits including increased morale,work performance and productivity.
The 1996 Employee Survey indicated the need for performance management improvements: only 37% ofemployees agreed that high performing employees receive deserved recognition and only 8% agreed that poorperforming employees were dealt with effectively. The Department is employing a new strategy foraddressing systemic management or organizational problems in its principal offices. Beginning in FY 1999,the Department will provide technical assistance for internal customers on resolving performance issues,executive coaching and action planning. This will position the Department to be more proactivein detecting and preventing management and organizational problems that could adversely affect servicedelivery.

U.S. Department of Education FY 2000 Annual Plan, Volume 1 Page 163
Figure 89
Limitations of the data. The major data source to measure employee satisfaction levels will not be availableuntil the 2000 Employee Survey. The 2000 Employee Survey will be revised to collect data on employeeperceptions about work-life programs.Verification/validation of measures. Independent contractors will administer official Department employeesurveys and conduct evaluations. Just-in-time surveys and focus groups are conducted in-house by theresponsible organization to track intermediate progress. In addition, other relevant administrative records andinformation system reports will be used to determine the quality of employee responses and services tocustomers.Data source(s). 1996 Employee Survey, EEOC 462 Reports, IDRC Reports, Family Friendly – AWS andFlexiplace Assessment October 30, 1997.
6 3 %
4 0 %
7 2 % 6 8 %
7 9 %
7 0 %
9 0 %
0 %
1 0 %
2 0 %
3 0 %
4 0 %
5 0 %
6 0 %
7 0 %
8 0 %
9 0 %
1 0 0 %
G o a l
G o a l
In form a l D ispute Reso lu t ion ( IDR) Center Successfu l inReso lv ing More Compla in ts In fo rma l l y
E m p l o y e e S u r v e y : I k n o w w h e r eto go to rece ive ass is tance wi th
mat te rs concern ingdiscr iminat ion , harassment or
other matters per ta in ing tosuperv isory /employee re la t ions .
Percentage ofemployee d ispute
cases c losed orresolved informal ly
1 9 9 6 1 9 9 61 9 9 32 0 0 0 2 0 0 01997* 1 9 9 8
* R e v i s e d f r o m F Y 1 9 9 9 A n n u a l P l a n .

U.S. Department of Education FY 2000 Annual Plan, Volume 1 Page 164
Objective 4.6: Management of our programs and servicesensures financial integrity.
Context. Ensuring financial integrity of ED's programs and services is achieved through compliance withfinancial regulations while focusing on results, service quality, and customer satisfaction. To achieve thisobjective and ensure financial integrity, the Office of the Chief Financial and Chief Information Officer isimplementing the following systems and policies: a core financial management system, the EducationCentralized Automated Processing System (EDCAPS); financial policies and procedures designed to enhanceinternal controls, reconciliation and reporting processes; and improvements to the agency's acquisition systemto support mission critical departmental and program office objectives.
External factors. Any improvements the Department makes in the performance of its contract resourcesrequires equal commitment from its business partners and agreement on meaningful performance objectivesand measures.
Key strategies
n Provide accurate and timely financial data.§ Provide timely and reliable financial information for program and support offices to use in managing
their responsibilities. During fiscal year 1999, the OCFO will reconcile all general ledger accounts ona monthly basis and use EDCAPS to provide this data to users on a daily basis.
§ Continue to provide training of staff in core financial management competencies.§ Reconcile all recipient accounts in EDCAPS and provide recipients with accurate data.
n Increase financial integrity.§ Continue to obtain a clean audit opinion.§ Eliminate material weaknesses, reportable conditions, and material non-conformances by correcting
systemic problems and implementing polices and procedures.
n Implement performance-based contracting.§ Each contract should be stated in terms of results that support ED’s Strategic Plan.§ Control costs by implementing performance-based contracting and by repatriating work contracted
out when effective and possible within staff ceilings.§ Review every contract for the maximum use of effective performance objectives and measures to
assess the value provided in order to determine extent to which the goods and services theDepartment is receiving represent better than successful performance.
§ Continue to provide training to all ED procurement and technical personnel in their capability toproductively manage the performance of contractors.
n Increase staff skills.§ Provide training and incentives for both financial and program staffs to acquire core financial
management competencies.
n Minimize regulations.§ The Department will continue to minimize the need for specific agency acquisition rules and
regulations; in like manner, the Department will work with the Office of Federal Procurement Policyto maximize the effectiveness of procurement reform.

U.S. Department of Education FY 2000 Annual Plan, Volume 1 Page 165
S & E resources supporting this objective
n Organizational units with a significant role in accomplishing this objective.§ Every principal office which acquires goods and services from the private sector to fulfill its
responsibilities and the Department’s Contracts and Purchasing Operations office, which isresponsible for the overall agency acquisition, system performance, and oversight.
n Special staff training§ All ED personnel performing a significant role in the acquisition of goods and services must possess
sufficient knowledge of the technical and procurement area in order to specify, manage, and achievethe appropriate results, requirements, and measures both in the process of acquiring and actualperformance of the contract requirement.
§ This is accomplished through agency certification programs for procurement professionals andtechnical staff in their particular disciplines and increased emphasis on project management andachievement of meaningful results.
Coordination with other federal agencies
n Office of Federal Procurement Policy and the General Services Administration. The Departmentwill continue to maximize the use of government-wide acquisition system resources and work with theOffice of Federal Procurement Policy and the General Services Administration in areas that promote amore single face to industry and benefit from combined resources of multiple agencies such ascommodities used across the government and electronic commerce.
Selected AccomplishmentsImplemented first fully integrated financial management system§ Education fully implemented EDCAPS (Department of Education Central Automated Processing
System) in May of 1998. For the first time, The Office of the Chief Financial Officer has a fullyintegrated financial management system.
§ By mid January 1999, Education converted to EDCAPS and reconciled nearly all of its 230appropriations to ensure that account relationships exist within appropriations, elucidate andcorrect systematic errors, and provide management with additional financial monitoring on a real-time basis.
Received clean audit opinion for the first time§ For the first time, the Department received a clean opinion on the Department-wide annual
financial statements for FY 1997.
Conversion to performance-based contracts§ In fiscal year 1997, ED pledged 66 future recompetitions for conversion to performance based
service contract requirements. As of the end of fiscal year 1998, 28 of those conversions haveoccurred and 15 new requirements have been put in place. The systems life value of thesecontracts is over a billion dollars.
§ Over 250 ED personnel with acquisition responsibilities have received basic training in theprincipals of performance based service contracting.
§ All future contract support for the Student Financial Aid Performance Based Organization will beperformance based.
§ New capabilities to collect and report contract performance data in EDCAPS is being put intoproduction or is under development.

U.S. Department of Education FY 2000 Annual Plan, Volume 1 Page 166
Performance indicators and charts
Indicator 92. By 2000 the Education Central Automated Processing System(EDCAPS) will be fully implemented and providing assistant secretaries, the ChiefFinancial and Chief Information Officer, and program managers with consistent,timely and reliable financial and program information.
Indicator background and context. During fiscal year 1999, the OCFO & OCIO will establish policies andprocedures that provide for the monthly reconciliation and reporting of financial data. Using EDCAPS, thisdata will be available for program and other managers to use in their day to day operations for decision-making and funds control.
Education is completing the EDCAPS conversion and testing to ensure that account relationships exist withinthe appropriations, determine and correct systemic errors, and give management additional tools to monitorfinancial activity on a more real-time basis. Estimated completion of the project is January 1999. Comprehensive testing and account reconciliations are currently underway and will be completed in the 2nd
quarter of FY 1999. These efforts will ensure that the performance indicator will be monitored and met.
Limitations of the data. ED will be unable to assess the reliability of the data until the system is in place,and reconciliation is complete.Verification/validation of measures. Annual audits for FY 1998 and FY 1999 as well as customerfeedback.Data source(s). Program data provided by all program offices and program recipients then processed byOCFO. Administrative data provided by all Education offices and processed by OCFO.
Indicator 93. Evaluation of contracts will indicate that better than fully successfulperformance, including quality, cost control, timeliness, and other factors, is beingreceived by the government and the taxpayer.
Indicator background and context. A contract's terms and conditions are a representation of how thegovernment's particular needs are to be fulfilled and the basis by which performance will be measured andcompensated. There are numerous indicators that provide analytical data to determine the value of the workthat is done for the agency. The value is determined by a variety of factors, but there are a few factors thatuniversally are key: (1) timeliness in the award of a contract; (2) continual efforts at cost containment andreduction; and (3) the best quality solution and performance. These factors taken collectively for all contractsprovide a basis for how well the resources the agency acquires from the private sector perform overall.

U.S. Department of Education FY 2000 Annual Plan, Volume 1 Page 167
Figure 90
Limitations of the data.. Several contracts are long term and were put in place prior to the measurementperiod and lack performance measures.Verification/validation of measures. Administrative reports prepared by ED staff independently evaluatedby random sampling and reviewData source(s). U.S. Department of Education Contract Data. Next update: annually.
Indicator 94. Auditors will issue a clean opinion on the Department-wide annualfinancial statements every year.
Indicator background and context. By fiscal year 2000 there will be a significant reduction in the numberof material weaknesses and reportable conditions identified in the auditor’s reports. This reduction willprovide the Department with the ability to continue to obtain a clean opinion on its financial statements. Toachieve the reduction in material weaknesses and reportable conditions, financial management systems andinternal controls will indicate improved financial management.
Limitations of the data. None.Verification/validation of measures. The indicator of a "clean audit opinion" will be obtained from anindependent audit, as required by statute. The Inspector General participates in the conduct of the audit andthe reporting/tracking of material weaknesses. Administrative reports prepared by project monitors oncontractor performance will be externally evaluated by random sampling and external review of contracts.
Audit MilestonesBaselineNumber of material weaknesses as of September 1997: 4Number of reportable conditions as of September 1997: 3
GoalNumber of material weaknesses as of September 1999: 2Number of reportable conditions as of September 1999: 5
Number of material weaknesses as of September 2000: 0
Percentage Improvement in the Key Areas of Contract Performance
0
2
4
6
8
10
12
1997 (Baseline) 1998 1999 2000
Fiscal Year
Lead Time to Award
On Time Delivery
Contract $'s Based onPerformance Objectives
Cost to Complete OverInitial Estimate
Contractor PastPerformance Rating

U.S. Department of Education FY 2000 Annual Plan, Volume 1 Page 168
Data source(s). Annual Auditor’s reports. Next Audit expected August 1999.

U.S. Department of Education FY 2000 Annual Plan, Volume 1 Page 169
Objective 4.7: All levels of the agency are fully performance-driven.
Context. ED has established a functional strategic planning system for the agency, has moved to integrate itsemployee performance rating and reward system with the accomplishment of strategic goals, and isimproving the quality and availability of data for its performance indicators. These activities will remain keystrategies for FY 2000.
External factors. Developing the tools for managing based on performance is a difficult challenge for federalagencies such as the Department of Education (ED), which depend on actions by many education partners toachieve key goals. Leadership, including the development of appropriate goals and performance indicators,and use of advanced technology are two key ways we are attempting to ground the agency’s ability to useperformance data.
Key strategies
n Sound implementation of the Strategic PlanThe Department will:§ Develop a new electronic reporting system to track progress on performance indicators and strategies
and simplify reporting of progress§ Align performance appraisals and rewards for assistant secretaries, senior managers, and employees
with Strategic plan objectives, including reviewing appraisals on a sample basis.§ Develop a specific action plan to recognize performance improvements and strengthen areas needing
assistance including through monetary awards and recognition programs.§ Implement an effective communication strategy, including through the Department’s Intranet, to
communicate plan priorities and to work collaboratively to identify challenges and improvementstrategies.
§ Conduct an independent evaluation of the usefulness of the Strategic Plan for decision making andcontinuous improvement, through employee and manager surveys, benchmarking with federal andstate agencies and relevant business practices.
n Strong budget support for planning and performance measurement. The structure of ED’s FY 2000budget request reflects the Strategic Plan and includes funding for evaluations, performancemeasurement, statistics, and assessments needed to comply with the Results Act. Salary and Expenseresources are distributed among the “management” objectives, showing where we are placing prioritiesfor use of resources. In FY 2000, the Department will continue to:§ Link performance reporting budget and strategic objectives.§ Align resource allocations with agency priorities and performance, including support in the budget
for evaluations, performance measurement, statistics and assessments.§ Conduct an assessment of training needs to implement performance measurement and align training
resources to support development of skills needed by Department employees for implementation ofperformance measurement.
n Ensuring assessment of the quality of data systems. The quality of a performance measurementprocess is no better than the quality of the data collected. By FY 2000 all managers will have attested tothe quality of their performance data or have concrete improvement plans in place and beingimplemented. During FY 2000, ED will:§ Implement data quality standards for the Department’s largest programs that account for 90 percent
of ED’s budget.

U.S. Department of Education FY 2000 Annual Plan, Volume 1 Page 170
§ Monitor program managers’ improvement plans for key performance data systems.§ Update guidance for ED managers on developing and monitoring quality data systems and the use of
data to manage program performance.§ Working with the Office of Inspector General, use program evaluations and IG reviews to assess the
quality of information systems that are critical for obtaining the data needed to meet the Results Act.Specific priorities are to evaluate data quality for State-grant programs and student aid data systems.
Major programs that have evaluation set-asides supporting thisobjective or that are authorized to fund evaluations
n Title I Evaluationn Magnet Schools Programn Charter Schools Programn TRIO Program
n Vocational Education National Programsn IDEA National Activitiesn Adult Education National Activitiesn Postsecondary education
Performance indicators and charts
Performance indicators in Objective 4.7 identify the extent to which sound performance data are effectivelyused throughout the agency. These indicators address employee understanding of their contribution to ED’sgoals and objectives, the existence of adequate performance measurement systems, managers’ use ofperformance data for improvement, and evidence that policy, budget and resource allocation decisions arealigned with ED’s strategic priorities.
Indicator 95. By the year 2000, ED will have achieved at least two-thirds of itsStrategic Plan performance goals and will improve continuously thereafter.
Selected AccomplishmentsStrengthened ED's Annual PlanSubstantially increased the number of annual plan objectives and programs with baseline measuresfrom initial FY1999 plan.§ The 2000 plan includes baseline information for most indicators for objectives in the annual plan
compared with 44 indicators with baselines in the 1999 plan.§ The 2000 plan includes at least one outcome indicator with baseline data for 59 program plans
compared with 38 program plans in the FY1999 plan.
Improved Data Quality§ Developed a draft of data quality standards for all GPRA information in ED’s plan (see section on
Data Quality).§ Implemented Strategic Plan including regular update meetings with the Deputy Secretary.
Provided support to other agencies§ Served as resource to other Executive agencies on strategies for effective development and
implementation of their strategic plan.
Performance Agreements§ Developed first-ever performance agreements with each member of ED's senior staff to hold them
accountable for achieving the goals of the strategic plan.

U.S. Department of Education FY 2000 Annual Plan, Volume 1 Page 171
Indicator background and context. ED's Strategic Plan contains a number of performance indicators andgoals. Many of these are carried out by state and local education agencies, institutions of higher education,and financial institutions with federal support. While it is unrealistic to expect all target goals to be reached, asubstantial number should be reached or assumptions re-examined.

U.S. Department of Education FY 2000 Annual Plan, Volume 1 Page 172
Figure 91
Limitations of the data. Some judgements will have to be made in reporting progress.Verification/validation of measures. ED will openly report data and results on the achievement of itsperformance goals to OMB, Congress, and any other interested organizations and individuals. Data will beavailable for examination by the public as well.Data source(s). (future) Annual Performance Report, March 2000.
Indicator 96. External customers such as Congress, OMB, or national associationswill rate the Department’s Strategic and Annual Plans highly for quality andusefulness.
Indicator background and context. Independent, external reviews of key documents and processes are veryhelpful in developing and managing federal activities such as strategic planning. Criteria may include:
relevance, quality, and utility/productivity.
Limitations of the data. Panel reviews are inherently subjective and benefit from procedures to increaseraters' inter-reliability (setting standards and review criteria, training in review process). Nevertheless, whileeffective use of planning products is probably the best indicator of quality, reviews by users and by experts inplanning provide helpful information and guidance.Verification/validation of measures. ED will openly report data and results on the achievement of itsperformance goals to OMB, Congress, and any other interested organizations and individuals. Data will beavailable for examination by the public as well.
Ratings of ED Plans and Reports
n House staff rated ED's Strategic Plan 1998-2002 as secondhighest among federal agencies in terms of overall quality andresponsiveness to Results Act requirements.
n House staff rated ED's FY 1999 Annual Plan as third highestamong federal agencies.
0
5
10
15
20
25
30
35
40
K-12 end
outcomes
Goal 1 Goal 2 Goal 3 Goal 4
Nu
mb
er o
f In
dic
ato
rs
Strategic Plan Indicators’ Goals for FY 2000-- Goal for FY 2000 is to achieve at least 67 percent
67%
67%
67%
67%
67%
7
35
18
12
26

U.S. Department of Education FY 2000 Annual Plan, Volume 1 Page 173
Data source(s). (future) Annual Performance Report, March 2000.
Indicator 97. Employees will recognize the Strategic Plan as meaningful andunderstand how their work supports achieving the Plan’s goals and objectives.
Indicator background and context. Critical to agency performance on this objective is the extent to whichemployees understand, support and actively work toward achieving the agency’s goals and objectives. From1993 to 1996 there was an increase of 15% percentage points in reported employee understanding of how thegoals and strategies support the mission of the Department. In part this increase may have been due to thedevelopment and release of the Department’s first Strategic Plan in 1994. Distribution of ED’s 1998-2002Strategic Plan kicked off implementation efforts that for the four year period from 1996 to 2000 shouldproduce at least a similar increase.
Figure 92
Limitations of the data. Opinion data are subjective and often subject to outside influences. Trend lines arehelpful–the more data points, the better.Verification/validation of measures. Other measures are being undertaken to validate and probe thefindings for this indicator, including conducting an interim employee survey that will permit use of morefocused questions and confirmation of the trend line.Data source(s). U.S. Department of Education Employee Survey, 1993, 1996. Next update: 1999.
Indicator 98. By 2000, all ED program managers will assert that the data used fortheir program’s performance measurement are reliable, valid, and timely, or will haveplans for improvement.
Indicator background and context. This indicator depends heavily on development of program data systemquality standards. It is part of the ED’s effort to ensure that the data provided by programs and offices arevalid and can be relied on by policy-makers and program administrators.
If problems are identified by managers, they will be required to develop an improvement plan, for review bythe Deputy Secretary. Implementation of the plan will be tracked under the Strategic Plan reporting system.
60%
74%
85%
0 %
20%
40%
60%
80%
100%
1993 1996 2000
Employee understanding of goals and strategies
Employee Responses to Strategic Plan

U.S. Department of Education FY 2000 Annual Plan, Volume 1 Page 174
Use of Tax Expenditures
In addition to the many programs that ED administers, tax expenditures targeted for educational benefitsalso significantly support the objectives of the ED Strategic Plan in 1999. While they are under thejurisdiction of the Department of the Treasury, the postsecondary education tax credits and deductionsauthorized by the Balanced Budget and Taxpayer Relief Acts of 1997 and the proposed SchoolModernization Bonds support several Department of Education objectives.
Elementary and secondary schools
This interest-free bond program supports Objective 1.3: Schools are strong, safe, disciplined, and drug-free.
• School Modernization Bonds (for school construction). States, territories, and school districts—especially those serving large numbers of low-income children—would be eligible for $9.7 billion in1999 in zero-interest bonds to support the construction and renovation of public school facilities.Since no bonds have yet been issued, tax expenditure estimates have yet to be made by the TreasuryDepartment.
Postsecondary education
All of the following tax credits, deductions, and forgiveness provisions were authorized by the BalancedBudget Act of 1997 or the Taxpayer Relief Act of 1997. All support Objective 3.2: Postsecondarystudents receive the financial aid and support services they need to enroll in and complete theireducational program. The Lifelong Leaning tax credit and employer-provided higher education assistancetax deduction also support Objective 3.4: Adults can strengthen their skills and improve their earningpower over their lifetime through lifelong learning.
Help for postsecondary students
• HOPE Scholarship. The "HOPE Scholarship" tax credit helps make the first two years of college orvocational school universally available. These non-refundable tax credits will reimburse families forup to $1,500 for each of the first two years of postsecondary education. An estimated 5.5 millionstudents will receive $4.2 billion in HOPE tax credits in 1999.
Subject to certain income limitations, students will receive a 100% tax credit for the first $1,000 oftuition and required fees and a 50% credit on the second $1,000. This credit is available for tuitionand required fees less grants, scholarships, and other tax-free educational assistance and is availablefor payments made after December 31, 1997, for college enrollment after that date. A high schoolsenior going into his or her freshman year of college in September 1999, for example, could beeligible for as much as a $1,500 HOPE tax credit.
The credit can be claimed in two years for students who are in their first two years of college orvocational school and who are enrolled on at least a half-time basis in a degree or certificate programfor any portion of the year. The taxpayer can claim a credit for his own tuition expense or for theexpenses of his or her spouse or dependent children.

U.S. Department of Education FY 2000 Annual Plan, Volume 1 Page 175
• Lifetime Learning tax credit. Lifetime Learning credits will make postsecondary education moreaffordable for students beyond their first two years of study, as well as for those taking class part-timeto upgrade their job skills. Subject to certain income limitations, this tax credit is targeted to adultswho want to go back to school, change careers, or take a course or two to upgrade their skills, and tocollege juniors, seniors, and graduate and professional degree students. It offers a 20 percent non-refundable tax credit for the first $5,000 of tuition and fees each year through 2002 and a 20 percentnon-refundable tax credit for the first $10,000 thereafter. An estimated 7.2 million students willreceive $2.7 billion in Lifelong Learning tax credits in 2000.
• Tax deduction for employer-paid higher education expenses. For adults going to school whilethey work, recent tax legislation extends Section 127 of the tax code for three years. This provisionallows workers to exclude up to $5,250 of employer-paid education benefits from their income. Theassistance must be for undergraduate courses beginning prior to June 1, 2000. This provision willenable many Americans to pursue their goals of lifelong learning.
Expanded opportunities to save for college
• New education IRAs and use of regular IRAs for education expenses. Parents and grandparentscan now create education IRAs and make penalty-free withdrawals from other IRAs.– Beginning January 1, 1998, taxpayers can withdraw funds from an IRA, without penalty, for their
own higher education expenses or for those of their spouse, child, or even grandchild.– In addition, for each child under age 18, families may deposit $500 per year into an Education IRA
in the child's name. Earnings in the Education IRA will accumulate tax-free and no taxes will bedue upon withdrawal if the money is used to pay for postsecondary tuition and required fees. Oncethe child reaches age 30, unused Education IRA funds must be closed or transferred to a youngermember of the family.
• Support for state-sponsored prepaid tuition plans. In order to provide greater flexibility forfamilies saving in qualified state tuition plans, when a family uses a qualified state-sponsored tuitionplan to save for college, no tax is due in connection with the plan until the time of withdrawal.Furthermore, families may use these plans to save not only for tuition but also for certain room andboard expenses for students who attend on at least a half-time basis. These benefits became availableon January 1, 1998.
Tax relief for borrowers repaying loans
• Student loan interest deduction. For many college graduates, one of their first financial obligationsis to repay their student loans, which average about $13,500 per student. The new student loaninterest deduction will reduce the burden of the repayment obligation by allowing students or theirfamilies, subject to certain income limitations, to take a tax deduction for interest paid in the first 60months of repayment on student loans. The deduction is available even if an individual does notitemize other deductions. The maximum deduction is $1,000 in 1998, $1,500 in 1999, $2,000 in 2000,and $2,500 in 2001 and beyond.
• Community service loan forgiveness. This provision excludes from income the student loanamounts forgiven by nonprofit, tax-exempt charitable or educational institutions for borrowers whotake community service jobs that address unmet community needs. For example, a recent graduatewho takes a low-paying job in a rural school will not owe any additional tax if his or her college oranother charity forgives a loan it made to the student. This provision applies to loans forgiven afterAugust 5, 1997.

U.S. Department of Education FY 2000 Annual Plan, Volume 1 Page 176
Tax Expenditure Benefits andCosts
Tax expenditures create substantialbenefits to students and families byincreasing the value of the student aidreceived, by providing additional savingsfor college, or by reducing the cost ofindebtedness. Among these benefits, theHOPE Scholarship and Lifetime Learningtax credits are the two largest, comprisingnearly 90 percent of total benefits. ForFY 2000, the Department of the Treasuryestimates that 5.5 million students couldbenefit from HOPE, while 7.2 millioncould benefit from the Lifetime Learningcredit.
Tax Expenditures are projected to increase from $680 million in FY 1998 to $9.325 billion in FY 2002.The chart (see Figure 94) illustrates the trends for major tax expenditure components between FY 1998and FY 2002.
Postsecondary Education TaxExpenditures
TAX EXPENDITURE ESTIMATES 1998-2002
0
1000
2000
3000
4000
5000
6000
FY 1998 FY 1999 FY2000 FY2001 FY2002$
MIL
LIO
NS
HOPE
LIFETIMELEARNING
ALL OTHER
Figure 93

U.S. Department of Education FY 2000 Annual Plan, Volume 1 Page 177
Limitations of the data. Data available when requirement takes effect in year 2000.Verification/validation of measures. External reviews of the quality of data systems, including those by theInspector General and evaluation contracts, will verify the managers’ assessments. ED Planning andEvaluation staff, Budget Service staff, and other units that use the data as well will also review theattestations.Data source(s). ED report.

U.S. Department of Education FY 2000 Annual Plan, Volume 1 Page 178
Role of Evaluation in GPRA
Evaluations are defined by GAO as “individual systematic studies conducted periodically or on an ad hocbasis to assess how well a program is working.” In FY 1998, the Department spent approximately $34million on evaluations, with over 85 percent of the funds being directed by the Planning and EvaluationService (PES). Approximately two-thirds of evaluation funds were spent in the elementary and secondaryeducation programs with the remainder evenly distributed between the postsecondary, vocational andadult, and special education and vocational rehabilitation areas.
In response to GPRA and the availability of new technologies, the Department is in the process ofreengineering its approach to evaluation. The revamped evaluation strategy will emphasize improving thetimeliness of the collection, validating performance reporting through routine program collections, usingevaluations to independently measure performance, strengthening information on the effectiveness ofprogram strategies, and studying external factors.
1. Improving the timeliness of performance information
The advent of the Internet and other forms of electronic information and the increased accountability forresults have heightened expectations for the availability of useful, real-time information on programperformance. This means that we can no longer wait several years for evaluation findings regardingwhether a program is working. Program managers and others need useful, real time data on how theirprograms are performing, particularly regarding the many new initiatives that were passed in FY 1999.Efforts being made to restructure evaluations to help provide useful data in a timely fashion include thefollowing:
Electronic submission of all evaluations and performance reports for major programs by the end ofFY 2000. Currently, most ED programs do not have grantees submit their performance reportselectronically. PES is working with the Chief Information Officer (CIO) to develop a system to enablefull electronic submission of performance data for all programs. Pilot studies will begin in FY 1999 toprovide technical assistance in terms of the development of indicator measures, form design, and qualitycontrol. Electronic submissions of performance reports will expedite the receipt of information and makeit much easier to analyze the data. The current paper-based system not only is slow but also makes itdifficult to identify trends in the data and to compare performance across groups.
Development of panel networks: The creation of networks of program grantees and end-customers willallow the receipt of real-time information from a sample of service providers regarding the operation ofour programs. These providers would be electronically networked to ED and to each other. They couldshare information about ongoing management issues and stand ready, per a prior agreement with ED andpre-approved OMB clearance, to respond in real time to survey questions. Two different types of panelstructures are being considered:
§ Specific program panels to allow for instantaneous feedback concerning the operation andmanagement of the program. This feedback would be particularly helpful in implementing newprograms which grantees often have difficulty getting started; moreover, the ability to identify andcorrect problems as they occur, as well as to share successful strategies among grantees, would be ofgreat value.

U.S. Department of Education FY 2000 Annual Plan, Volume 1 Page 179
§ Cross-cutting samples of end-customers such as kindergarten through third grade reading teachers,fifth- to -eighth-grade math teachers, or high school principals. These panels would help keep EDinformed of what is going on in the field related to key initiatives of having all children readingindependently by third grade; knowing math, including algebra, by the eighth grade; and beingprepared for college.
Speeding-up forms clearance. Although some progress has been made in obtaining speedier clearance,the typical evaluation still requires about 7 months to proceed through all the approval processes. Bycontrast, a typical customer survey for a large corporation would take about 3 months from start to finish.The Department will be working with OMB to expedite the process within the framework of legislativerequirements.
Development of ED systems for electronic storage and analyses. The Department is proceeding ondeveloping a data warehousing system to facilitate efficient data storage and analyses. Data warehousingwill also improve integration of information across data collections, reducing reporting burden byavoiding the unnecessary collection of duplicative or similar information.
2. Validating performance reporting through routine programcollections
The section on the “Quality of Performance Data” in this plan lays out standards for program performanceinformation. Once in place, assessments will evaluate how well data collections meet standards.
Data system development: Program data systems may not collect the types of data or have dataorganized in a manner needed for performance measurement. Evaluation studies can help identifysituations in which existing data can be compiled in a manner that is indicative of program performance.For example, studies comparing student performance across states and student default rates acrossinstitutions not only led to major policy shifts but also to the creation of data systems to routinely capturethese data. Currently, several evaluation studies are under way to improve the systems used to report dataon the elementary and secondary education programs specifically the Even Start, Eisenhower ProfessionalDevelopment, and Safe and Drug-Free School programs.
Verification: The quality of performance data provided by program data system is sometimes unknown.The Inspector General is launching pilot evaluations of data quality in several state grant programs.Program evaluations will build on the work of the IG and conduct data quality verifications for a numberof major programs. For example, the National Student Loan Data System (NSLDS) Verification studyalready compared loan data provided by lenders and Guarantee Agencies against the data maintained bythe Department in the NSLDS and found a relatively high frequency of mismatches. This informationwas then used to help improve the procedures by which data were entered into NSLDS. Along withstudent aid, data submissions will be validated for major elementary and secondary education programsincluding Title I, Safe and Drug-Free Schools, Eisenhower Professional Development, vocationaleducation, and adult education.
3. Using evaluations to independently measure performance
Routine collection of performance information through grantee reporting and management informationsystems will be supplemented with periodic, independent performance evaluations. These evaluationsmay provide rigorous information on net impact that is not feasible to get through routine reporting, andexternal benchmarks to validate the regularly reported performance information. In addition, evaluation

U.S. Department of Education FY 2000 Annual Plan, Volume 1 Page 180
studies can provide detailed descriptions of program operations and performance that are not feasible toget through routine reporting mechanisms.
Net impact studies: Evaluations of the net impact of a program attempt to measure the amount by whichoutcomes for the recipients of a given program differ from those that would have occurred in the absenceof the program. Net impact studies tend to be done on large (over $100 million) or important programswhere direct services can be provided to only a subset of the eligible population. Examples include thefollowing:
§ The Student Support Services (SSS) evaluation, which is measuring the net impact of the SSSprogram on college retention and graduation, grade-point average, and transfer behavior (from 2-yearto 4-year institutions). Outcomes are being compared between students receiving SSS services and acontrol group consisting both of students at the SSS institutions who did not participate in theprogram and students at matched institutions not participating in the SSS program.
§ The Upward Bound evaluation, which is measuring the net impact of the Upward Bound program onstudents’ preparation for college, high school graduation, and college entry and achievement.Students were randomly assigned to treatment and control groups, and their outcomes are beingcompared as they progress through high school and enter college.
§ Two new studies are beginning that will be looking at net impacts. The Assessment of VocationalEducation will evaluate the impact of vocational education in a number of areas including studentoutcomes. The Gaining Early Awareness and Readiness for Undergraduate Programs (GEAR-UP)evaluation will evaluate the short-term (course-taking patterns, student and parent expectations, highschool retention, etc.) and long-term (high school completion, college attendance, etc.) impacts ofGEAR UP.
Gap-closing studies: Many of ED’s programs are targeted at disadvantaged populations. One way toassess the effectiveness of these programs is to evaluate whether the gap in key outcomes between thepopulation served by the program and a more advantaged group is narrowing. Gap-closing studies arepractical for major programs that might be expected to have results that affect the overall educationalsystem and where net impacts are difficult to assess. Examples include:
§ The federal student financial assistance programs in which all persons meeting the eligibility criteriacan participate, making it difficult to create a comparison group of people not receiving services.Outcomes being measured in the student aid programs include narrowing the gap in college accessand completion rates between low- and high-income students and assessing the contribution thatfinancial aid makes in equalizing the ability to pay for college across income groups.
§ The Title I program where funding is commingled at the recipient level making it difficult to linksspecific activities with a given funding stream. A number of evaluations have been conducted of theTitle I program assessing whether Title I funding is contributing to a closing of the learning gapbetween high-poverty and low-poverty schools. The Reanalysis of the National Assessment ofEducation Progress (NAEP) study also compared performance on NAEP for students enrolled inhigh- and low-poverty schools.
Descriptive studies: An assessment of program outcomes does not necessarily require comparisonsbetween those who receive the program services and those who do not. Detailed descriptions of theservices received by program recipients can also provide useful information on program performance.For example, a key dimension of many programs is determining which populations should receiveservices. Evaluation studies that look at which groups receive services and whether the effect of these

U.S. Department of Education FY 2000 Annual Plan, Volume 1 Page 181
services differs across groups are very valuable in determining whether the targeting strategy beingfollowed is effective. Examples include the following:
§ The Study of Education Resources and Federal Funding analyzes the uses of federal resources fromsix major elementary and secondary programs. The study focuses on the targeting of funds amongschool districts and, for Title I, among schools.
§ The Third National Evaluation of the Even Start Literacy Program describes the characteristics of theprogram and participants and measures literacy outcomes for parents and children.
§ The National Evaluation of School-to-Work provides a detailed description of how the program isoperating at the state and local levels based on student surveys, transcripts, and case studies of 8 statesand 39 communities.
Customer satisfaction studies. ED is working to have most of its customer satisfaction evaluationactivities become an integral part of program delivery activities rather than being administered centrally.ED is now integrating program monitoring, measurement of customer satisfaction, and evaluations ofprogram results in a coordinated system. However, there is a role for evaluation studies to play inproviding an independent assessment of customer satisfaction, particularly in programs that provide directservices to individuals as opposed to programs that operate through intermediaries such as state and localeducation authorities. Examples include these:
§ The Direct Loan evaluation, in which the success of this new program was judged against its keyobjectives of providing improved customer satisfaction and ease of use. Customer satisfaction wasmeasured over time for postsecondary institutions and student and parent borrowers participating inthe Direct Loan program compared with the satisfaction of participants in the existing Federal FamilyEducation Loan (FFEL) program.
§ The Comprehensive Assistance Centers evaluation, which is looking at customer satisfaction, amongother outcomes, for all 15 Comprehensive Centers, 800 state district and school customers, 750participants in Centers’ activities, and 800 non-customers.
§ Postsecondary Customer Satisfaction Surveys, which assessed postsecondary institutions’ satisfactionwith the Title IV delivery system, TRIO grantees’ satisfaction with the operation and management oftheir program, and student aid applicants’ satisfaction with the application process.
4. Strengthening information on the effectiveness of programstrategies
Simply assessing the performance of a program will not necessarily lead to strategies for programimprovement. Studies finding negative outcomes may not contain information on how to fix the problem,and findings of positive outcomes do not mean that further improvements are not possible. As discussedin the paragraphs that follow, ED is undertaking several different types of evaluation studies designed toidentify strategies for improving programs.
Implementation studies: The start-up of new programs or major revisions to existing programs putconsiderable pressure on all participants to develop procedures for successfully implementing theprogram. Studies that are conducted as the program begins or shifts operations and can provide quickfeedback on the success of efforts to implement the program. Results from these studies can be very

U.S. Department of Education FY 2000 Annual Plan, Volume 1 Page 182
useful in helping to assess the implementation process and to identify potential problems and correctiveaction strategies. Examples include these
§ The Baseline State, Follow-Up State, and District Implementation studies, which look at how theESEA and Goals 2000 programs are being implemented at the state and local levels Key issuesinclude standards development, assessment and accountability systems, state support for schoolimprovement, and district efforts to support implementation of the programs within the context ofstate and local reforms.
§ The Study of Local Education Agency (LEA) Activities under the Safe and Drug-Free Schools(SDFS) Program provides information on LEA implementation of the SDFS program. Issues ofinterest include the use of funds, project goals and objectives, and evaluation activities.
§ The Department is planning implementation studies for several new programs recently authorized,including the 21st Century Scholars, GEAR-UP, and Teacher Quality programs.
§ Small-Group Observations represent new approaches to evaluation currently being explored to obtainin-depth observations on selected providers in a timely manner. They include the use of reports (sentback continuously via e-mail) from trained staff visiting various sites, anonymous testers who wouldsimulate the experience that ED clients face interacting with our programs, and standing focus grouppanels to respond to emerging issues. These initiatives would help enable us to uncover the keyprocesses that help determine a program’s performance and feed them back into program operation ina timely manner.
Best practice studies: Many ED programs provide funds to other organizations (states, school districts,postsecondary institutions, community groups, etc.) which are then used to provide services to programparticipants. Often the organizations providing services will have a great deal of flexibility in theprocedures they employ and the specific nature of the services they provide. This variability amongproviders creates a large demand for evaluation studies that can identify successful program models andprocedures that can then be disseminated. Once identified, performance measures can then be establishedto measure the frequency with which service providers are following practices associated with successfuloutcomes. Examples include these:
§ The “What Works” Study for Adult English as a Second Language Literacy Students and theEvaluation of Effective Adult Basic Education Programs and Practices, both of which are trying toidentify approaches to teaching adults with little or no education that result in significant learninggains.
§ The 21st Century Community Learning Centers evaluation, which will try to identify characteristics ofafter-school programs that lead to significant positive changes in achievement, course-taking patterns,class participation, behavior, and attendance.
5. Studying external factors
GPRA explicitly calls for strategic plans to take into account external factors that may influence plansuccess. Evaluations can help us understand how outside factors affect the attainment of our goals andlead to strategies for counteracting these factors. Examples of such studies include these:

U.S. Department of Education FY 2000 Annual Plan, Volume 1 Page 183
§ The Quality and Impact of SDFS Program Activities study, which analyzes the factors affecting thesuccess of research-based approaches to reducing violence and alcohol and other drug use amongschool-age youth.
§ The Study of Factors Related to College Enrollment, which attempted to identify the key factors thatexplained college enrollment, particularly among high-ability, low-income students. Findings fromthis study were used to develop several of the strategies employed in attempting to achieve objective3.1 of the strategic plan, “secondary school students get the information skills, and support they needto prepare successfully for postsecondary education.”
§ The Longitudinal Study of the Vocational Rehabilitation (VR) Service Program, which assesses theimpact of local economic and environmental factors on VR services and outcomes.
In summary, the Department of Education uses evaluation studies in many ways in the GPRA process.Evaluation studies are used to assess the outcomes of programs, identify program improvement strategies,and improve performance measurement data. Individual evaluation studies used in preparing this AnnualPlan are listed in Volumes 1 and 2 and descriptions of these studies are provided in Appendix B.

U.S. Department of Education FY 2000 Annual Plan, Volume 1 Page 184
Quality of Performance Data: How Data Will BeVerified and Validated
Effectively reporting the performance of the Education Department (ED) in achieving its Strategic Plangoals and objectives requires simultaneously developing a new integrated data system and fixing oldones. The new system will streamline and integrate existing data systems to improve their timeliness andutility. Existing data systems will be strengthened by the implementation of data quality standardsthroughout the Department. These activities will be applied to the two major performance indicatorsystems: one for the elementary and secondary system and another for student aid. Collectively, thesesystems account for about three-quarters of the Department’s funds.
ED’s comprehensive set of activities to improve data is built around three strategies:
n Implementing data quality standards throughout ED.n Developing an integrated data system for elementary and secondary program data collections, andn Improving postsecondary data quality.
Actions being taken to achieve these strategies are described below, followed by highlights of thestrategies being taken to improve the quality of elementary/secondary and postsecondary data.
Implementing data quality standards
The quality of ED’s performance measures can be no better than the quality of the data from which theyare generated. Inadequate attention to data quality produces inaccurate information and misleadingresults. The lack among many program staff of formal training in information processing, evaluation, andreporting is a further impediment to obtaining high-quality information.
To ensure the quality of performance indicator information, ED is proceeding on a four-part improvementstrategy:
n Develop Department-wide standards for performance indicator measurement. Since 1998, ED hasundertaken a major effort to define Department-wide data quality standards that apply to all GPRAdata systems. These standards are summarized in Exhibit 1. These standards have been developed byPlanning and Evaluation Service working in close consultation with the Office of the InspectorGeneral, National Center for Education Statistics, and several program offices.
n Require programs to systematically review the quality of their data collection systems. Data systemswithin each of the Department’s principal operating components will be graded on the quality of theirdata. Assistant secretaries will be required to develop an improvement plan for their data systems.
n Develop and implement training of ED program data managers in the application of the datastandards for performance measurement. Department-wide training on data quality standards forprogram data managers will include identification of data system weaknesses and development ofconcrete plans for their improvement, followed by individual coaching to help improve these systems.

U.S. Department of Education FY 2000 Annual Plan, Volume 1 Page 185
Exhibit 1
Strategies for Ensuring High-Quality Informationfor Strategic Plan and Program Performance Indicators1
By 2000, all ED program managers will assert that the data used for their programs’ performancemeasurement are reliable, valid, and timely, or will have plans for improvement.
By 2000, all program data collections will be required to demonstrate evidence that they meet thedata collection standards summarized below:
nn Data collection standards1
§ Occurrence/completeness. Ensure that performance information is accurate andcomplete.
§ Comparability. Ensure that performance data are comparable and consistent over timeand among respondents.
§ Editing. Ensure that performance data are accurately entered from original sources.§ Calculation. Ensure that performance measures are accurately computed using the right
numbers and formulas.§ Timeliness. Ensure that performance information is collected on a regular and timely
basis.§ Reporting. Ensure full disclosure of limitations, sources, and methods used for obtaining
performance data.
n Employee training in high-quality performance measurement systems
§ Materials and tools. Train program managers in skills necessary to develop high-qualityperformance measurement data.
§ Coaching. Tailor coaching to individual offices’ data system needs.
nn Monitoring and continuous improvement of data quality§ Staff performance agreements. Require program managers, as part of their
performance agreement, to review the quality of their program performance informationand to implement plans for its improvement.
§ Evaluation of data quality.--Conduct independent reviews of data systems providing data for major programs.--Conduct program-by-program indicator reviews to assess the accuracy of key indicatorinformation.--Issue an annual report card on the quality of key data systems.
§ Inspector General. Support Inspector General reviews of data quality (see exhibit 2).
nn Accountability for data quality§ Attest to data quality. “By the year 2000, all ED program managers will assert that the
data used for their program’s performance measurement are reliable and valid or willhave plans for improvement” (objective 4.7: indicator 31).
§ External validation. Evaluate program managers’ assertions through IG audits andprogram evaluations.
1See Exhibit 3 at end of this section for Draft Standards for Evaluating the Quality of Performance Indicators.

U.S. Department of Education FY 2000 Annual Plan, Volume 1 Page 186
n Monitor data quality. ED will examine GPRA indicators for key programs to determine theiraccuracy and validity, by examining the information provided by all levels of the system. Thefindings of this effort will be used to recommend data system improvements. ED will also useprogram evaluations for data validation. In addition, the Department is working closely with itsOffice of Inspector General to independently monitor the reliability of its data quality in high priorityareas. See Exhibit 2 on Inspector General’s activities.
n Managers attest to the reliability and validity of their performance measures or submit plans for dataimprovement. Internal ED evaluations of the accuracy and validity of GPRA indicators will befollowed by program managers attesting to the quality of their data systems or providing explicitplans for their improvement.
Exhibit 2
Inspector General’s Support forData Verification and Validation
The Office of Inspector General (OIG) has participated in an advisory capacity in thedevelopment of ED’s Strategic Plan and Annual Plan and will continue to provide thisservice to Department managers.
On September 23, 1998, the OIG issued an audit report titled “Moving Towards a Results-Oriented Organization,” (Audit Control Number 17-70007). The objectives of the auditwere to assess the status of ED’s implementation of the Results Act and the development ofsystems for the timely and accurate reporting of performance indicators.
During the development of the Strategic Plan, the OIG recommended that ED programmanagers assert that the data used for their program’s performance measurement are reliable,and if they are not reliable, to detail plans for improving the data or finding alternativesources. ED agreed with the OIG’s recommendation and included it as a performanceindicator in the Strategic Plan. Subsequently, audit work will focus on assessing thereliability of performance data for selected programs and indicators. The OIG is currentlyvisiting four State Education Agencies (SEAs) to identify controls that ensure the reliabilityof performance data submitted by SEAs to ED. The OIG will also identify limitations orweaknesses in the performance data and the barriers or obstacles to improving the quality ofthat data.
Cooperating with State agencies in an integrated performance andCooperating with State agencies in an integrated performance andbenchmarking system (IPBS) for elementary and secondary programbenchmarking system (IPBS) for elementary and secondary programdata collectionsdata collections
An important component of ED’s information improvement strategy is a long-term 5-year plan to createan Integrated Performance and Benchmarking System for elementary and secondary program datacollections (IPBS). The goal of this system is to reduce paperwork and to streamline the federaleducation program reporting system in such a way that it provides states, districts, school boards, andparents with accurate, comparable information about how federal programs results. A key component will

U.S. Department of Education FY 2000 Annual Plan, Volume 1 Page 187
be to enable schools and districts to compare their results with others in the country. The system will beelectronically based and designed in cooperation with States to develop a set of mutually needed coreperformance indicators and increase the compatibility of the data collection systems. Piloted with a fewstates in 1999, when fully implemented in 2004, this system will:
• Replace currently overlapping, burdensome, and antiquated education program reporting systems,making federal education data more coherent, timely, and comparable across units and over time.
• Increase the usefulness of federal data to states, districts, and the general public through improvingdata timeliness, accuracy and alignment with State systems.
• Facilitate the development of annual schools, state, and district report cards, which allow comparisonand benchmarking between states and districts.
Specifically IPBS will:• Use a core set of key performance indicators both for federal program accountability and state,
district, and school profiles.• Be owned and maintained by states, districts, and schools, who sign on to an Internet site and report
the data needed for the key performance indicators.• Protect student confidentiality to make individual identification of students impossible.
Improving the quality of postsecondary data
Validity and accuracy of postsecondary performance measures. Data used to measure progresstoward achievement of the performance indicators come from several sources, including program data,surveys conducted by the National Center for Education Statistics (NCES), and evaluation studies. Stepsbeing taken in 1999 and 2000 to strengthen the quality of these data include these:
n Improving the coordination of data related to postsecondary education through the NationalPostsecondary Education Cooperative (NPEC), which is sponsored by NCES with the mission “topromote the quality, comparability, and utility of postsecondary data and information that supportpolicy development, implementation, and evaluation.” NPEC will help improve the efficiency andusefulness of the data reported on postsecondary education by standardizing definitions of keyvariables, avoiding duplicate data requests, and increasing the level of communication between themajor providers and users of postsecondary data.
n Continuing to support and strengthen NCES’s major postsecondary data collection activities,including the Integrated Postsecondary Education Data System (IPEDS), the National PostsecondaryStudent Aid Study (NPSAS), the Beginning Postsecondary Student Study (BPS), the Bachelor’s andBeyond Study (B&B), and the National Education Longitudinal Study (NELS). A major area ofexpected improvement in the quality of these data collections is the use of the Internet to obtain datafrom institutions. The use of the Internet will also reduce the burden on institutions of providing datato ED.
n Using evaluation methods and findings for the TRIO and Title III programs to help improve the datacollected in the annual program performance reports, to provide a more accurate and more completepicture of the activities and outcomes of the two programs.
Accuracy and efficiency of program data systems. In FY 1999, the Department of Education willprovide nearly $51 billion in federal student aid funds. To properly distribute and account for these funds,the Department of Education needs to process and store data from over 8 million student aid applications,93 million individual student loans with a value of more than $150 billion, 6,000 postsecondary

U.S. Department of Education FY 2000 Annual Plan, Volume 1 Page 188
institutions, 4,800 lenders, and 36 state guarantee agencies. Ensuring the accurate and efficient collectionof these data is a key component in the successful delivery of the student aid programs and achievementof Goal 3 in ED’s Strategic Plan, to “ensure access to postsecondary education and lifelong learning.”
The Higher Education Amendments of 1998 established a performance-based organization (PBO) tomodernize the delivery of student financial aid. This is an historic milestone in the Administration’sefforts to improve services to millions of students and the postsecondary institutions they attend. ThePBO will make it possible to meet these challenges and to keep pace with the rapid rate of technologicalchange in the financial services industry. Customer service will improve, and the public’s confidence inthe administration of student aid programs will grow. Steps being taken by the PBO to improve theefficiency and quality of the student aid delivery system include the following:
n Improving data accuracy by:
§ Continuing or expanding interagency coordination on data matches–with the Internal RevenueService; the Social Security Administration; the Immigration and Naturalization Service; theSelective Service; the U.S. Postal Service; and the Departments of Defense, Justice, and Housingand Urban Development–to help improve data accuracy and reduce burden on respondents,
§ Establishing by December 1999 industry-wide standards for data exchanges to stabilize datarequirements, improve data integrity, and reduce costly errors,
§ Receiving individual student loan data directly from lenders rather than through guaranteeagencies and by expanding efforts to verify the data reported to the National Student Loan DataSystem, and
§ Working with the Internal Revenue Service to establish procedures for verifying income tax dataprovided students and their families in applying for federal student financial assistance.
n Strengthening indicators of customer satisfaction to provide early warnings of possible deliverysystem problems. This step will build on ED’s successful on-going evaluations of its institutional andstudent aid customers.
n Refining a risk management system that encompasses all relevant data regarding postsecondaryinstitutions operation and management of the student aid programs, so that compliance andenforcement activities can be targeted on poorly performing institutions.
n Preparing a system architecture for the delivery of federal student aid by December 1998 that willhelp integrate the multiple student aid databases based on student-level data, in order to improve theavailability and quality of information on student aid applicants and recipients.
Challenges
Several challenges face ED as it moves to improve the quality of its performance data. The mostsignificant challenges include, time, expertise, resources, and commitment.
n Modernization of outdated systems. Most program data collection systems were designed beforethe electronic era, and have not been substantially revised. Revision requires sustained attention ofpersonnel at all levels of the federal government, and collaboration with states and districts.

U.S. Department of Education FY 2000 Annual Plan, Volume 1 Page 189
n Time. The scope of revisions required to develop a high-quality, integrated electronic data collectionsystem that is useful to federal, state, and local policymakers will require several years to develop andimplement.
n Personal and financial resources. An undertaking of this scale and complexity will requiresubstantial financial and personnel resources each year. There must be an unprecedented level ofcommitment on the part of ED’s leadership and program staff as well as of those in related ExecutiveBranch departments and the state and local educational agencies. The lack of internal expertise withthe Education Department in the management of large-scale data systems will require a considerableinvestment in staff development. In some offices, it will also necessitate a cultural change thatrecognizes, as an office priority, the need to obtain sound and timely program performance data.
Reference
Hatry, Harry, and Kopczynski, Mary. Guide to Program Outcome Measurement for the U.S. Departmentof Education. Washington, DC: U.S. Department of Education’s Planning and Evaluation Service, 1997.

U.S. Department of Education FY 2000 Annual Plan, Volume 1 Page 190
Exhibit 3: Data Quality Standards: Definitions and ExamplesStandard Definition Examples Meeting the Standard
and Failing to Meet the StandardPossible Data Checks
Occurrence—It Happened • The recorded transactions, events,conditions on which the measures arebased actually occurred or existedduring the reporting period.
• The measures correspond or agreewith the phenomena that they purportto represent.
Meeting:• A counted student actually receives
services.• Data are measured for the correct
time period.Failing:• Students are double–counted.• Data overlap the beginning or end of
a fiscal year.
• From where is the number coming?Is this source appropriate? Is it best?
• Do original records confirm that theyconsist of accurate data?
• Have random checks been madeagainst accurate original records incases where there is evidence of aproblem?
• Has each measure been assessed todetermine whether experts, dataproviders, and users believe that theitem measures what it is intended tomeasure?
Completeness—No Omissions For Universe Data• All transactions, events, conditions,
etc., applicable to the reportedmeasures are included.
For Sample Data• Population from which sample is
drawn is clearly defined.• Samples are taken of the appropriate
unit of analysis.• Samples are of sufficient size to
enable generalizations to thepopulation to be made.
• Samples are appropriatelyrepresentative.
Meeting:• All teachers are included in the
count.Failing:• Certain types of schools (e.g., charter
or private) or students (e.g., LEP,children with disabilities) areomitted.
Meeting:• Survey respondents meet the
definition of sampling units.Failing:• If statements are made about
teachers, teachers and not schoolswere sampled.
• Are all data elements required orneeded for indicators present?
• Are there any missing units ofanalysis?
• Are there any missing data?• For sample data: Has a reasonable
response rate been achieved?
Comparability—Data Are The Same • Measures as collected arecomparable over time and between
Meeting:• Student data from a new test can be
• Are data consistent across reportingunits?

U.S. Department of Education FY 2000 Annual Plan, Volume 1 Page 191
Standard Definition Examples Meeting the Standardand Failing to Meet the Standard
Possible Data Checks
respondents. compared with data from a previoustest.
Failing:• States combine data that have
different definitions.
• Will aggregation be consistent acrossunits?
• Have the data been compared withother databases reporting the same orsimilar statistics?
• Are all variables, response categoriesand definitions consistent over time?
Editing—Data Are Clean • Data elements are accurately enteredfrom original sources.
Meeting:• Sum of percentages is 100%.Failing:• Entries are out of range.
• Are there any “bad” data elements inwhich data are “unreasonable” or outof range?
• Have the data collected, processed,and reported been systematicallyreviewed and corrected any errorsfound?
• Have the data been checked forconsistency over time to ensure that:the magnitude of the data is“reasonable”; the percentage changein elements from year to year is“reasonable; there are consistenttrends in the data?
• Have the data been checked forinternal consistency: totals, ratios,products match; there are no codingviolations?
• Have edit checks been made fromlevel to level when data areaggregated (e.g., from school to LEAto SEA)?
Calculation—The Math is Right • Measured amounts (numbers,percentages, ratios, etc.) areaccurately computed using the rightnumbers and formulas.
Meeting:For Universe Data• The divisor for a ratio is properly
chosen.• Percentage served is a ratio of
number served to targetedpopulation, not general population asappropriate for the given indicator.
• Rounding is done correctly.
• Do all respondents use the same unitof data gathering reporting?
• Is the period for which data arecollected the same for allrespondents?
• Do respondents use a standard formatfor reporting program data that hasnot changed over the life of theprogram/data base?

U.S. Department of Education FY 2000 Annual Plan, Volume 1 Page 192
Standard Definition Examples Meeting the Standardand Failing to Meet the Standard
Possible Data Checks
For Sample Data• Sample weights are properly applied.• Portrayal of measured amounts is
free of unwarranted inference ofprecision.
Failing:For Universe Data• A formula for computing dropout
rates is misapplied.• The increase from 3% to 13% is 10
percentage points, not 10 percent.For Sample Data• Non-response rates are not properly
calculated.• The wrong significance test is used.
• Is each component of the formulacorrectly defined?
Timeliness—Data Are Recent • All steps possible are taken to ensuredata are reported in a timely fashion.
Meeting:• Data are collected and reports are
forwarded as soon as possible afterthe close of the data collectionperiod.
Failing:• Reporting of data is delayed for
several years.
• Are performance data collected on aregular and timely basis?
• Are findings disseminated tointended users, so that they can beused in a timely fashion?
• Is the time between the date of datacollection and reporting short?
• Is automation used as much aspossible, including maintaining thedata in machine-readable form?
Reporting—Full Disclosure • What was done is clearly explained.• Limitations are clearly stated.• Findings are fairly and impartially
summarized.• Portrayal of measured amounts is
factual.• Measures are impartial–free from
measurement bias and neutral of anyeffect on a particular interest;departures from this are disclosed.
• Graphics/Report exhibits areproperly documented, including
Meeting:• States supply documentation on data
collection processes.• Reports are based on actual data;
there are no unsupported inferences.• Data are rounded to the appropriate
number.• Measures are unbiased; no measures
are used that favor a particular ethnicgroup.
Failing:• Source and time frame for
graphics/exhibits is omitted.
• Are data bases well documented andis documentation thorough, current,accurate, and readable?
• Are routine procedures for correctingproblem data and resolving datainaccuracies documented?
• Are problems clearly and publiclydocumented?
• Are conclusions reached explicitlyjustified so that stakeholders canassess them?
• Are performance indicatorsappropriately disaggregated down to

U.S. Department of Education FY 2000 Annual Plan, Volume 1 Page 193
Standard Definition Examples Meeting the Standardand Failing to Meet the Standard
Possible Data Checks
complete legends, scales, sources,time frames, etc.
• Achievement scores are imputedunjustifiably.
key operational units (e.g., States forState grant programs)?
• Do measures remain consistent withthose agreed by experts to measuregood practice?
• Are questions asked of theappropriate respondents at theappropriate level (State, LEA,school)?
• Is someone reviewing the report andchecking it for accuracy?
• Are you documenting any reportsfully and providing completecitations?

U.S. Department of Education FY 2000 Annual Plan, Volume 1 Page 194
Appendix A. CoordinationAppendix A. Coordinationwith Other Federal Agencieswith Other Federal Agencies
U.S. Department of Education – Coordination with Federal Agencies
DepartmentsWhite House • Family and Community Involvement. Work with the White House Cabinet Affairs office to successfully implement the Partnership’s national
initiative, America Goes Back to School, through participation of every federal agency. Participate in White House activities promoting their StrongFamilies, Strong Communities initiative in such areas as fatherhood, family involvement in education, and Family Reunions. (Objective 1.5)
• Technology. Working with the White House National Economic Council, White House Office of Science and Technology Policy, and otheragencies, the Department is working to increase school and community access to educational technology and to encourage its effective use.(Objective 1.7)
• Children’s Health Insurance Program (CHIP). Work with the White House, HHS, and other federal agencies to conduct outreach to educatorsand families about the availability of free and low-cost insurance for children. (Objective 2.1)
• President’s Hispanic Education Initiative. As the lead agency for the President’s Hispanic Education Initiative, ED works with the White Houseto build upon public and private partnerships to support increased family and community involvement in education. For example, with thePartnership for Family Involvement in Education, ED promotes America Reads and other efforts to support a greater emphasis on reading throughSpanish language television (e.g., UNIVISION), radio, and print media. (Objective 2.4)
• Executive Order on American Indian and Alaska Native Education. Support programmatic strategies—including dissemination and support forthe implementation of comprehensive reform strategies—and conduct research related to the education of Native Americans, as determined by aninteragency task force. (Objective 2.4)
• National Partnership for Reinventing Government (NPRG). Continued to work NPRG to network with other federal agencies on best practicesfor customer service delivery. (Objective 4.1)
AgricultureUSDA
• After-school programs. The Family-School Partnership Initiative, USDA, and other agencies participate in the Federal Support to CommunitiesInitiative, which was established to coordinate after-school programs. (Objective 1.5)
• Research. The National Center for Education Statistics (NCES) is implementing an early childhood longitudinal study with HHS and USDA.(Objective 4.3)

U.S. Department of Education FY 2000 Annual Plan, Volume 1 Page 195
U.S. Department of Education – Coordination with Federal Agencies
Commerce • Technology. The Department is cooperating with Commerce and other agencies to increase school and community access to educationaltechnology and to encourage its effective use. (Objective 1.7)
• Math and science achievement. Coordinate with the Department of Commerce and others to implement an interagency action strategy forimproving achievement in mathematics and science. (Objective 2.3)
DefenseDOD
• Standards and accountability. The Department of Defense is represented on the Department of Education’s Standards and Accountability Team.(Objective 1.1)
• Children’s reading. OIIA and the America Reads Challenge (ARC) Office will collaborate with the U.S. Army’s Extended Learning Program totrain its program directors in using READ*WRITE*NOW! Strategies and materials. (Objective 2.2)
• Math and science achievement. Coordinate with the Department of Commerce and others to implement an interagency action strategy forimproving achievement in mathematics and science. (Objective 2.3)
• Defaulted borrowers. OPE will work with DOD to better track defaulted borrowers and return them to repayment. (Objective 3.3)Health and HumanServicesHHS
• Drug prevention activities. OESE’s Safe and Drug-Free Schools (SDFS) office will continue to pursue joint projects, including efforts to providetraining and technical assistance to educators, communities, and states with the Center for Substance Abuse Prevention, Maternal and Child HealthBureau, and National Institute on Drug Abuse (NIDA). (Objective 1.3)
• Research. ED has requested $25 million for an interagency research initiative on educational technology and instructional practice. (Objective 1.7)• Coordination Council. Use the Federal Interagency Coordination Council (FICC) to coordinate strategies for children with disabilities and their
families. (Objective 2.1)• Children’s Health Insurance Program (CHIP). Work with the White House, HHS, and other federal agencies to conduct outreach to educators
and families about the availability of free and low-cost insurance for children. (Objective 2.1)• Research. Continue work with NSF and NICHD on the interagency research initiative that will focus on school readiness (Objective 2.1, Objective
2.2)• Defaulted borrowers. Work with HHS to better track defaulted borrowers and return them to repayment. (Objective 3.3)• SSA beneficiaries. RSA will address with SSA the disincentives that affect SSA beneficiaries. (Objective 3.4)• Research. Several ED offices (OESE, OERI, OUS, and OSERS) have announced a new interagency Education Research Initiative designed to
bring together researchers from various disciplines. (Objective 4.3)• Prevention Activities. OESE’s SDFS office will support the Initiative on Youth Substance Abuse Prevention with HHS’s Substance Abuse and
Mental Health Services Administration, National Institute on Alcoholism and Alcohol Abuse, and NIDA (Objective 1.3)• Evaluation. OESE and PES cooperate with HHS on evaluation projects like School Health Policies and Program’s Study. (Objective 1.3)• Data. OESE and PES maximize use of data including NIDA’s Monitoring the Future and the Center for Disease Control’s (CDC) Youth Risk
Behavior Surveillance System. (Objective 1.3)• After-school programs. Family-School Partnership Initiative, HHS, and other agencies participate in the Federal Support to Communities
Initiative, which was established to coordinate after school programs. (Objective 1.5)• Alignment of indicators. OESE works with the Head Start Bureau to align indicators of progress and quality between the Even Start program and
Head Start programs. (Objective 2.1)• Early learning programs. OESE coordinates preschool programs and efforts of the proposed “Early Learning Fund,” which is proposed to
support programs that improve early learning and the quality and safety of childcare. (Objective 2.1)• Information sharing. OESE will use the Early Childhood Research Working Group to exchange/share current information, provide opportunities
for interagency research collaboration, and use findings to improve programs. (Objective 2.1)

U.S. Department of Education FY 2000 Annual Plan, Volume 1 Page 196
U.S. Department of Education – Coordination with Federal Agencies
Health and HumanServicesHHS (Continued)
• America Reads initiative. OUS will coordinate publication development and dissemination with Head Start and Resource and Referral Network.(Objective 2.2)
• Reading outreach. The ARC Office will coordinate outreach with Head Start and Resource and Referral Network to early childhood caregivers.(Objective 2.2)
• Reading and early childhood collaboration. OESE, OIIA, and the ARC Office will coordinate community collaboration of Head Start andResource and Referral Network and Department funded activities for reading and early childhood. (Objective 2.2)
• Study on acquisition of English. OBEMLA will be collaborating with NICHD to launch a five-year study on acquisition of English and teachingand learning of reading. (Objective 2.2)
• Research. Continue to support the efforts of NICHD in studying ways in which Spanish speaking children can best learn English. (Objective 2.4and Objective 4.3)
• Participation in educational activities. OESE, OBEMLA, and OSERS will expand coordinated efforts to ensure that children from familiesmoving from welfare to work and others with special needs receive opportunities to participate fully in educational activities aimed at helping themreach high standards in school. (Objective 2.4)
• Learning accommodation strategies. The Division of Adult Education and Literacy (DAEL) will work with the NIH and the Division of NationalAdult Literacy and Learning Disabilities Center to develop information concerning learning accommodation strategies to facilitate the participationof adults with disabilities in literacy programs. (Objective 3.4)
• Early Childhood Longitudinal Study. NCES will add a birth cohort to the Early Childhood Longitudinal Study with HHS and USDA. (Objective4.3)
Housing and UrbanDevelopmentHUD
• After-school programs. The Family-School Partnership Initiative, HUD, and other agencies participate in the Federal Support to CommunitiesInitiative, which was established to coordinate after-school programs. (Objective 1.5)
• Technology. ED is cooperating with HUD and other agencies on an ongoing basis to increase school and community access to educationaltechnology and to encourage its effective use. (Objective 1.7)
• Defaulted borrowers. OPE will work with HUD to better track defaulted borrowers and return them to repayment. (Objective 3.3)

U.S. Department of Education FY 2000 Annual Plan, Volume 1 Page 197
U.S. Department of Education – Coordination with Federal Agencies
InteriorDOI
• Challenging standards. ED is working with the Bureau of Indian Affairs to develop standards and assessments for the Bureau’s schools to helpIndian students reach challenging standards. (Objective 1.1)
• Reading programs. OIIA, OESE, and the ARC Office will coordinate with the Bureau of Indian Affairs schools to encourage extended learning inreading programs that support the America Reads Challenge. (Objective 2.2)
• Mathematics and science achievement. ED-NSF is coordinating with Interior, as well as many other agencies, to implement an action strategy forimproving achievement in mathematics and science. (Objective 2.3)
JusticeDOJ
• Prevention activities. OESE’s SDFS office will continue to pursue joint projects, such as the truancy and hate crimes initiatives with DOJ’s Officeof Juvenile Justice and Delinquency Prevention (OJJDP) (Objective 1.3)
• Data. OESE and PES work with DOJ to develop and implement the President’s Report Card on School Violence. (Objective 1.3)• After-school programs. The Family-School sector of the Partnership for Family Involvement in Education continues to work with DOJ and other
agencies to make the most of out-of-school time. (Objective 1.5)• Census of juvenile facilities. OESE, OVAE, and PES will coordinate in developing a multidisciplinary project to collect information on juveniles
in detention and correctional custody, including data on education. (Objective 2.4)• Defaulted borrowers. OPE will work with DOJ to better track defaulted borrowers and return them to repayment. (Objective 3.3)• Student aid eligibility. OPE will work with Immigration and Naturalization Service (INS) to perform data matches to efficiently and effectively
determine eligibility for student aid (Objective 3.3)• Student loan repayment. OPE will work the Internal Revenue Service (IRS) to obtain adjusted gross income and other tax information on
borrowers regarding the repayment of their student loans including tax refund offset for defaulted borrowers. (Objective 3.3)• Evaluation. OSES and PES will cooperate on evaluation projects such as the National Study on School Violence, conducted in cooperation with
the National Institute for Justice and the National Study of Delinquency Prevention in Schools. (Objective 1.3)• Prevention technical assistance. OESE’s SDFS office with OJJDP, and DOJ’s Office for Victims of Crime will jointly pursue projects, including
providing training and technical assistance to educators, communities, and states. (Objective1.3)• Data. OESE and PES seek to maximize use of National Crime Victimization Survey data in reporting on school crime. (Objective1.3)
LaborDOL
• School-to-work program. OVAE and DOL jointly administer the School-to-Work program and, through the national School-to-Work Office, arecoordinating efforts to improve program management by aligning grant making, audit, technical assistance, and performance reporting functions.(Objective 1.2)
• School-to-work concepts. Job Corps Centers are being encouraged to emphasize adoption of School-to-Work concepts. (Objective 1.2)• Technology. ED is currently working with the DOL, the White House National Economic Council, White House Office of Science and Technology
Policy, and other agencies, to increase school and community access to educational technology and to encourage its effective use. (Objective 1.7)• Participation in educational activities. OESE, OBEMLA, OSERS expand coordinated efforts to ensure that children from families moving from
welfare to work and others with special needs receive opportunities to participate fully in educational activities aimed at helping them reach highstandards. (Objective 2.4)
• Student with disabilities. Rehabilitation Services Administration (RSA) and the School-to-Work office are working to ensure that students withdisabilities receive appropriate School-to-Work transition services. (Objective 3.4)
• Waiver authority ED jointly administers waiver authority with the School-to-Work Office. (Objective 4.2)

U.S. Department of Education FY 2000 Annual Plan, Volume 1 Page 198
U.S. Department of Education – Coordination with Federal Agencies
TreasuryTREAS
• Information dissemination. Internal Revenue Service prepares publications in consultation with OPE regarding steps needed for taxpayers toclaim the Hope Scholarship and Lifetime Learning tax credits (Objective 3.2)
• Student loan interest rates. Consult with the Treasury Department on the setting of student loan interest rates. (Objective 3.2)• Defaulted borrowers. Work with IRS to implement a proposed data matching agreement to verify key need analysis reported by applicants and
their families; obtain adjusted gross income and other tax information on borrowers regarding repayment of student loans. (Objective 3.3)• Tax credits. OPE coordinates to implement the Lifetime Learning tax credit. (Objective 3.4)
Independent AgenciesCollege Board • Early awareness programs. Work in conjunction with the College Board and many other organizations in designing and implementing the Early
Awareness Information program and GEAR UP to help middle-school students prepare for college. ED also receives input and support from theCollege Board for the ED-NSF national mathematics public engagement campaign. (Objective 1.5, Objective 3.1)
Corporation forNational ServicesCNS
• After-school programs. The Family-School Partnership Initiative, USDA, and other agencies participate in the Federal Support to CommunitiesInitiative, which was established to coordinate after-school programs. (Objective 1.5)
• America Reads Challenge (ARC) sites. ARC coordinates 65 ARC Pilot Sites with CNS grantee sites using CNS volunteer tutors. (Objective 1.5,Objective 2.2)
• Publication development. The ARC office will coordinate cross-use of CNS and ED publications for the ARC and collaborative development ofmaterials. (Objective 2.2)
• College Work-Study support. The ARC office will cross-use College Work-Study students to support CNS and Department ARC sites.(Objective2.2)
FederalCommunicationsCommissionFCC
• E-rate. The Office of Educational Technology will work with the FCC and the Schools and Libraries Corporation to effectively implementeffective use of the “E-rate,” which will greatly expand the use of technology in schools. (Objective 1.7)
Federal InteragencyCoordinating CouncilFICC
• Services. ED is using FICC to coordinate strategies to provide educational services to children with disabilities and their families. (Objective 2.1)
General ServicesAdministrationGSA
• Information dissemination. OERI continues to work with the Consumer Information Center (CIC) to develop, promote, and distribute informationto the public. (Objective 4.1)
• Building services. ED works with GSA to coordinate building services. (Objective 4.5)• Acquisition system resources. ED continues to coordinate with GSA in maximizing the use of government-wide acquisition system resources and
promoting a “single face” to industry. (Objective 4.6)Government PrintingOfficeGPO
• Depository Library System. OERI continues to work with this library system to ensure that all documents printed by GPO are deposited, puttingED documents in the public domain for use by all taxpayers and citizens. (Objective 4.1)
Job Corps • School-to-Work. Job Corps Centers are incorporating tenets of STW to improve the effectiveness of services for out-of-school youth. (Objective1.2)
National Academy ofSciences
• Assessment techniques. ED is working with NAS to disseminate information on state of the art assessment techniques. (Objective 1.1)• Outreach. ED supports the dissemination and outreach based on NAS study, “Preventing Reading Difficulties in Young Children.” (Objective 2.2)• Research. Support NAS study on early childhood pedagogy. (Objective 2.2)

U.S. Department of Education FY 2000 Annual Plan, Volume 1 Page 199
U.S. Department of Education – Coordination with Federal Agencies
National Aeronauticaland SpaceAdministrationNASA
• Teachers of mathematics. OERI will work with NASA and others agencies to implement an interagency action strategy for improvingachievement in math and science. (Objective 2.3)
National EducationGoals Panel
• Standards in the classroom. ED is working with the National Education Goals Panel, as well as many other organizations, to promote strategies ofintroducing and maintaining standards in the classroom. (Objective 1.1)
National ScienceFoundationNSF
• Professional development. OERI, ODS, OESE, in coordination with NSF, fund projects of national significance to upgrade professionaldevelopment in mathematics. (Objective 1.4)
• Challenging mathematics. ODS and other ED offices work on the ED-NSF action strategy to launch a national information and engagementcampaign on the importance of mathematics and jointly award grants to strengthen the coordination of federal programs in supporting challengingmathematics. (Objective 2.3)
• Research priorities. OERI, NSF, and NICHD will establish a collaborative research agenda to address issues such as the development of readingand mathematics skills in young children, the improvement of school readiness, the development of science concepts and the use of technology, andthe improvement of professional development for educators. (Objective 4.3)
• Research. Several ED offices (OESE, OERI, OUS, and OSERS) support the Early Childhood Research Working Group (HHS, DOD, DOJ, DOL,and NSF) in coordinating research priorities and databases. (Objective 4.3)
National StaffDevelopment CouncilNSDC
• National Awards Program. ED is coordinating with NSDC in the dissemination of information about the lessons from the award-winning sitesunder ED’s National Awards Program for High-Quality Professional Development. (Objective 1.4)
Office of Science andTechnology PolicyOSTP
• Learning technologies. The Office of Educational Technology will work to complete interagency action plan on learning technology research anddevelopment. (Objective1.7)
• Community access to technology. Working with the White House National Economic Council, White House Office of Science and TechnologyPolicy, and other agencies, the Department is working to increase school and community access to educational technology and to encourage itseffective use. (Objective 1.7)
Office of National DrugControl PolicyONDCP
• Prevention activities. OESE’s SDFS office supports the Initiative on Youth Substance Abuse Prevention with HHS, and ONDCP. (Objective 1.3)• Performance indicators. OESE’s SDFS office is coordinating performance indicators with ONDCP and other agencies. (Objective 1.3)
Selective Service • Student aid eligibility. OPE works with Selective Service to perform data matches to efficiently and effectively determine eligibility for studentaid. (Objective 3.3)
Social SecurityAdministrationSSA
• Social security. RSA will address with the SSA the disincentives to work that affect SSA beneficiaries. (Objective 3.4)
U.S. Postal ServiceUSPS
• Defaulted borrowers. OPE will work with USPS to better track defaulted borrowers and return them to repayment. (Objective 3.3)

U.S. Department of Education FY 2000 Annual Plan, Volume 1 Page 200
Appendix B. Descriptions of ProgramAppendix B. Descriptions of ProgramEvaluations and Other StudiesEvaluations and Other Studies
The Government Performance and Results Act requires agency strategic plans to describe the program evaluationsused in establishing and revising general goals and objectives and a schedule for future program evaluations.
The Department has an active evaluation program, national statistical and assessment studies, and grantee/institutioninformation systems to provide information supporting the Strategic Plan. Our studies and surveys provideinformation on student progress, education system improvement, the effects of specific programs and initiatives,financial aid, and the management of the Department. We also use data from other federal agencies’ studies andsurveys where available.
This section describes the key studies that will inform the implementation of goals and objectives in the Department’sstrategic plan, including providing data for the performance indicators. The table includes the study’s title, whatagency sponsors it and who carries it out, the sample population, the nature of the data collected, and when the dataare or will be collected. It is grouped by evaluations, statistical and national assessment studies, grantee performancesystems, and other studies.

U.S. Department of Education FY 2000 Annual Plan, Volume 1 Page 201
Descriptions of Program Evaluations and Other StudiesDescriptions of Program Evaluations and Other Studies
Study or Survey Sponsor/DataCollector Data Providers Data Collected Collection
Date(s)
Elementary and Secondary Education Program Evaluations1.
Baseline State ImplementationStudy
(Objectives 1.3,1.4, 2.4, 4.2)
Planning andEvaluation Service(PES)
Contractor: PolicyStudies Associates,Inc.
All states, federal programdirectors, and state researchor evaluation specialists instate education agencies
Initial information on implementation of new provisions of state-administered ESEA and Goals 2000 programs. Key issues includestandards development, assessment systems, technical assistance,and state supports for school improvement. Focus is on howlegislative framework and federal resources are incorporated intothe context of state school improvement efforts.
1996
2. Follow-Up State ImplementationStudy
(Objectives 1.3, 1.4, 1.7, 2.4, 4.2)
PES
Contractor:Policy StudiesAssociates, Inc.
All states, federal programdirectors, and state researchor evaluation specialists instate education agencies
Follow-up information on implementation of new provisions ofESEA programs and Goals 2000. Focus is on how legislativeframework and federal resources are incorporated into the contextof state school improvement efforts. Key issues include standardsdevelopment, assessment and accountability systems, technicalassistance, and state supports for school improvement.
1998
3. District Implementation Study(Reports on Reform from the Field)(Objectives 1.1, 2.4, 4.2)
PES
Contractor: UrbanInstitute, Inc.
District administrators ofFederal ESEA and Goals2000 programs(nationally representativesample)
Baseline information on districts’ efforts to support theimplementation of ESEA programs, particularly Title I, and Goals2000 within the context of state and local reforms.
1997
4. Cross-cutting District Survey andCase Studies
(Objectives 1.1, 2.4, 4.1, 4.2)
PESContractors: PolicyStudies Associates,Inc. and UrbanInstitute, Inc.
District administrators ofFederal ESEA and Goals2000 programs(nationally representativesample)
Information on districts’ efforts to support the implementation ofESEA programs, particularly Title I, and Goals 2000 within thecontext of state and local reforms. Focuses on programgovernance, supports for effective instruction, andfamily/community partnerships.
1998
5. Public School Surveys onEducation Reform
(Objectives 1.1, 1.4, 1.5, 1.7)
PES and NCES
Contractor:Westat, Inc.
Public school principals andteachers(nationally representativesample)
Baseline data on principals’ and teachers’ perceptions of systemiceducation reform and the extent to which reform activities arebeing implemented in their schools. Focus is on high standards forall students and alignment of curricula, instruction, textbooks,innovative technologies, and student assessment with these highstandards. Surveys also addressed parent involvement,information needs, and effective sources of information forprincipals and teachers. The teacher survey also collects initialdata about professional development. The principal surveyspecifically addresses changes in Title I since reauthorization.
1996

U.S. Department of Education FY 2000 Annual Plan, Volume 1 Page 202
Descriptions of Program Evaluations and Other StudiesDescriptions of Program Evaluations and Other Studies
Study or Survey Sponsor/DataCollector Data Providers Data Collected Collection
Date(s)
6. Follow-Up Survey of Schools
(Objectives 1.1, 1.4, 1.5, 1.7)
PES
Contractor:Westat, Inc.
Public school principals(nationally representativesample)
Information on school-level understanding and implementation ofstandards-based reform and Title I and Goals 2000 supports forreform, including implementation of state-established content andperformance standards.
1997
7. Longitudinal Evaluation of SchoolChange and Performance
(Objectives 1.1, 1.4, 1.5, 1.7)
PES
Contractor:Westat, Inc.
71 elementary schools in 18moderate to high povertyschool districts in 7 states
Information on the impact of implementation of Title I’sreauthorization on teaching and learning, focusing on thecurriculum and instruction enacted in classrooms, on studentperformance as measured by a nationally uniform instrument, andon how these change over time.
Spring 1997,1998, 1999
8. National Longitudinal Survey ofSchools
(Objectives 1.1, 1.4, 1.5, 1.7, 2.1, 2.2,2.3, 2.4)
PES
Contractor:Westat, Inc.
School principals, teachers(nationally representativesample)
Information on how schools are implementing standards-drivenimprovements, with a particular focus on implementation of thenew Title I provisions supporting such improvements. Alsoexamines how schools use their outcome data to change classroompractice and how they measure progress continuously.
1998, 1999, 2000
9. Reanalysis of National Assessmentof Educational Progress (NAEP)National and State-Level Results
(Objectives 1.1, 2.4)
NCES, PES
Contractor:EducationalTesting Service
NAEP national and state-level results (forparticipating states) inreading and math
Comparison of performance on NAEP for students enrolled inhigh- and low-poverty schools.
Analysisconducted in 1998for data collectedfrom 1986 to thepresent. Ongoinganalyses ofsubsequent NAEPassessments.
10. Study of Education Resources andFederal Funding
(Objectives 1.1, 1.3, 1.4, 1.5, 1.7, 2.4)
PES
Contractor:AmericanInstitutes forResearch
All state educationalagencies (50); nationalsample of school districts(180), schools (720),teachers, and aides
Uses of federal resources from six major federal programs: TitlesI, II, III, IV, and VI of ESEA and Goals 2000. Targeting of thesefunds among school districts and, for Title I, among schools.Federal role in providing support for professional development,technology, and standards and assessments.
1997-98 schoolyear
11. Study of Local Education AgencyActivities under the Safe and Drug-Free Schools Program(Objective 1.3)
PES
Contractor:Westat, Inc.
National sample of schooldistricts
Information on LEA implementation of the SDFS program, suchas planning, uses of funds, evaluation, and goals and objectives,including information relevant to the Principles of Effectiveness.
1999 (may berepeated)
12. Goals 2000 State Planning andImplementation Reports(Objectives 1.1, 1.4, 1.7)
PESContractor: PolicyStudies Associates,Inc.
All states (annual Goals2000 progress reports)
State systemic reform plans and accomplishments to date,especially with respect to the role of Goals 2000.
Fiscal year 1997

U.S. Department of Education FY 2000 Annual Plan, Volume 1 Page 203
Descriptions of Program Evaluations and Other StudiesDescriptions of Program Evaluations and Other Studies
Study or Survey Sponsor/DataCollector Data Providers Data Collected Collection
Date(s)13. Evaluation of the Title I, Part D
Programs for Students Who AreNeglected, Delinquent, or At-Riskof Dropping Out of School(Objective 2.4)
PES
Contractor:Research TriangleInstitute
Universe of state agenciesadministering Part Dprograms; selected state andlocal facility staff
Program planning and administration, services provided, staffingand resources, evaluation.
Winter and spring1999
14. Study of Homeless Education:Follow-Up to the 1995 NationalEvaluation(Objective 2.4)
PES
Contractor:Policy StudiesAssociates, Inc.
Universe of state homelesscoordinators, selecteddistricts providing homelesseducation programs
Educational needs and barriers facing homeless students and waysthey are addressed, how services are provided, differencesbetween districts receiving McKinney funding and those that donot.
Fall 1998
15. Evaluation of Title I Services toPrivate School Students
(Objective 2.4)
PES
Contractor:Policy StudiesAssociates, Inc.
Nationally representativesample of Title I districtadministrators, privateschool representatives
Trends in private school students’ participation in Title I;consultation between Title I administrators, private schoolrepresentatives and parents; procedures used by districts to countthe number of low-income students in private schools; servicesavailable; resource allocations; student assessment and programevaluation.
Spring 1997
16. Third National Evaluation of theEven Start Family LiteracyProgram
(Objectives 1.5., 2.1, 2.2)
PES
Contractor:Abt AssociatesInc.
Universe of Even Start localprojects (project directorsand staff)
Program characteristics: service delivery and intensity.Participant characteristics: demographic information on families,parents, and children.Participation outcomes: participation rates, literacy outcomes forparents and children.
Program years1997-98 through2000-01
17. Even Start Information System(Second National Evaluation of theEven Start Family LiteracyProgram)(Objectives 1.5., 2.1, 2.2)
PES
Contractor:Fu Associates Ltd.
Universe of Even Start localprojects (project directorsand staff)
Program characteristics: service delivery, and intensity.Participant characteristics: demographic information on families,parents, and children.Participation outcomes: participation rates, literacy outcomes forparents and children.
Program years1993-94 through1996-97
18. Comprehensive School ReformEvaluation (through the NationalLongitudinal Survey of Schools, see#6)
PES
Contractor:Westat, Inc.
CSRD schools, principalsand teachers (nationallyrepresentative sample)
Data on implementation of school reform models, effect of modelson school and classroom changes, and progress in attendance andachievement in selected states with trend data.
School years1998-99, 1999-2000, 2000-01
19. Evaluation of the EisenhowerProfessional Development Program
(Objectives 1.4, 2.3)
PES
Contractor:AmericanInstitutes forResearch
Teachers, districtcoordinators, IHE projectdirectors, State staff, districtstaff, principals, professionaldevelopment providers
National surveys of district coordinators, IHE project directors,teachers who participated in Eisenhower; in-depth case studies of5 states and 10 districts and 30 schools within 5 states;Longitudinal study of teacher change of 600 teachers in the casestudy schools. Observations of professional development.
1997 – 1999

U.S. Department of Education FY 2000 Annual Plan, Volume 1 Page 204
Descriptions of Program Evaluations and Other StudiesDescriptions of Program Evaluations and Other Studies
Study or Survey Sponsor/DataCollector Data Providers Data Collected Collection
Date(s)20. Evaluation of the Technical
Assistance & Dissemination Effortsof the Eisenhower Mathematicsand Science Regional ConsortiaProgram: Case Studies(Objective 1.4)
PES
Contractor:SRI International
Consortia staff; participantsin Consortia activities
Interview data and observations of Consortia services. 1998
21. Surveys of Educators Served by theEisenhower Mathematics andScience Regional ConsortiaProgram (Objective 1.4)
PES
Contractor:To be determined
Participants in Consortiaactivities
Survey data from educators who receive assistance and materialsfrom the Consortia.
1999 and early2000
22. Comprehensive Assistance CentersEvaluation
(Objectives 2.4, 4.1, 4.3)
PES
Contractor: PolicyStudies Associates,Inc.
All 15 ComprehensiveCenters; 800 state, districtand school customers; 750participants in Centers’activities; 800 non-customers
Baseline data on customers representing school-wide programs orhigh-poverty districts and BIA funded schools; activitiesproviding integrated, non-categorical assistance; customersatisfaction; professional development activities; and coordinationand collaboration of services across Centers and ED’s TAproviders.
Winter andSpring, 1999
23. Magnet Schools AssistanceProgram (MSAP) Evaluation
(Objective 1.6)
PES
Contractor:AmericanInstitutes forResearch
District administrators for allMSAP grantees (FY98cycle); representative sampleof principals and teachers inMSAP-funded schools;federal program staff
Characteristics of MSAP projects and districts; information aboutthe extent to which MSAP projects reduce the incidence ofminority group isolation, promote systemic reform efforts, featureinnovative education practices, and strengthen studentachievement; and information about how the MSAP contributed tothe development and implementation of magnet projects.
1999-2002
24. Public Charter Schools Program(PCSP) Evaluation
(Objective 1.6)
PESContractor:
SRIInternational
State coordinators,chartering agencies, charterschool directors, principals,teachers; federal programstaff
Information about the operations of the PCSP and the uses andimpacts of the funding and other assistance it provides;characteristics and operations of the charter school universe.
1999-2002
25. Public Charter Schools ProgramInterim Report to Congress
(Objective 1.6)
PES
Contractor:Westat, Inc.
Federal and stateadministrative records,charter school directors(from RPP study); federalprogram staff
Descriptive summary of how the program has funded the start upof charter schools, and how the program has funded nationalactivities (technical assistance, research, and outreach). This reportalso provides characteristics of federally funded charter schoolsand students.
1995-1998
26. Evaluation of EducationalTechnology: Technology LiteracyChallenge Fund and RelatedPrograms: High IntensityTechnology Sites Study(Objective 1.7)
PES
Contractor:AmericanInstitutes forResearch
School principals, schoolstaff, and students (about 10TLCF districts)
Characteristics of school implementation of educationaltechnology, and related instruction and student outcomes.
1999-2001

U.S. Department of Education FY 2000 Annual Plan, Volume 1 Page 205
Descriptions of Program Evaluations and Other StudiesDescriptions of Program Evaluations and Other Studies
Study or Survey Sponsor/DataCollector Data Providers Data Collected Collection
Date(s)27. Congressionally-Mandated Study
of Migrant Student Participation inTitle I School-wide Programs
(Objective 2.4)
PES
Contractor:Westat, Inc.
Nationally representativeschool principals, schoolstaff, from a sample ofschool-wide projects thathave migrant students
Characteristics of migrant students and schools, planning andneeds assessment, instructional and support services provided,migrant parent involvement, and funding.
1997
28. Support for Data Gathering andAnalysis for the Migrant EducationProgram(Objective 2.4)
PES
Contractor:Westat, Inc.
All state coordinators Characteristics of migrant students and schools, participationinformation, services provided, number of school-wide, summer,and extended time projects.
1996-97
29. Eisenhower ProfessionalDevelopment Program: Productionof New Triennial Report andAnalysis of Data from Annual StatePerformance Reports(Objective 1.4, 2.3)
PES
Contractor:Westat, Inc.
State Eisenhowercoordinators
Data on program performance indicators for professionaldevelopment, including baseline and other data.
December 1998
30. Supplemental Study of theTechnology Literacy ChallengeFund
(Objective 1.7)
PESContractor:AmericanInstitutes forResearch
Representative sample ofTLCF districts
Collection of data on TLCF local grantees, supplementing thesample for cross-cutting studies. Analysis of TLCF StatePerformance database in the context of this data.
1999-2000
31. Technology Innovation ChallengeGrants Impact Evaluation
(Objective 1.7)
PES
Contractor:To be determined
School staff, site evaluators. Evaluation being designed.Study of implementation and impacts of Technology InnovationChallenge Grants.
1999 (est.)
32. Performance Indicator System forthe Safe and Drug-Free Schoolsand Communities Program
(Objective 1.3)
PES
Contractor:Westat, Inc.
All SDFS State EducationAgency coordinators andGovernors’ Program statecoordinators
Information on state administration and implementation of theSDFS program, including progress toward achieving statemeasurable goals and objectives, implementation of the Principlesof Effectiveness, and prevalence of youth drug use and violence.
Annual, beginningin 1997
33. Study on School Violence andPrevention
(Objective 1.3)
PES
Contractor:Westat, Inc.
Nationally representativesample of schools
Information on incidents of crime/violence in schools,implementation of violence prevention activities, case studies ofschool safety.
1998 through 2001
34. Quality and Impact ofSDFS Program Activities
(Objective 1.3)
PES
Contractor:To be determined
Districts and schools Factors affecting the effective implementation of the Principles ofEffectiveness and, in particular, the use of research-basedprevention approaches, as well as the outcomes of efforts bydistricts and schools to prevent or reduce violence and alcohol andother drug use among school-aged youth.
1999 through 2001
Postsecondary, Vocational, School-to-Work, and Adult Program Evaluations

U.S. Department of Education FY 2000 Annual Plan, Volume 1 Page 206
Descriptions of Program Evaluations and Other StudiesDescriptions of Program Evaluations and Other Studies
Study or Survey Sponsor/DataCollector Data Providers Data Collected Collection
Date(s)35.
College Preparation Studies
(Objective 3.1)
PES Middle-grade students andtheir parents
The National Education Longitudinal Survey (NELS) was used toidentify key factors affecting which eighth-grade students enrolledin college within two years of expected high school graduationand which did not. In addition, a series of focus groups and asurvey of middle-school parents were conducted to develop abetter understanding of what information parents of middle-schoolstudents have and need concerning the benefits, academicrequirements, cost of college, and the availability of student aid.
Research analyses:1996 and 1997
Surveys and focusgroups: 1997
36. “What Works” Study for AdultEnglish as a Second LanguageLiteracy Students
(Objective 3.4)
PES and OVAE(Office ofVocational andAdult Education)Contractor:AmericanInstitutes forResearch
Adult participants in Englishas a Second Languageprograms who have limitednative-language literacy
Data on learning gains, persistence, and literacy practices. 1999-2000
37. Evaluation of Effective Adult BasicEducation Programs and Practices(Objective 3.4)
PES and OVAE
Contractor: AbtAssociates, Inc.
Participants in low-levelAdult Basic Educationclasses
Data on learning gains, persistence, and learner perceptions ofself-esteem and self-efficacy.
1999-2000
38. Longitudinal Study of theVocational Rehabilitation (VR)Service Program
(Objective 3.4)
PES and OSERS(Office of SpecialEducation andRehabilitativeServices)
Contractor:Research TriangleInstitute Inc.
A sample of 8,500 currentand former VR consumers at37 VR offices
Information on the characteristics of VR consumers and local VRagency offices; the impact of local economic and environmentalfactors on services and outcomes; and short- and long-termoutcomes achieved by VR consumers and their satisfaction withthe program.
1994-1998

U.S. Department of Education FY 2000 Annual Plan, Volume 1 Page 207
Descriptions of Program Evaluations and Other StudiesDescriptions of Program Evaluations and Other Studies
Study or Survey Sponsor/DataCollector Data Providers Data Collected Collection
Date(s)39.
National Direct Student LoanEvaluation
(Objective 3.2)
PES
Contractor: Macro,Inc.
Representative samples ofpostsecondary institutions,students, and parentsparticipating in the DirectLoan and Federal FamilyEducation Loan (FFELP)programs
The evaluation centers on three major issues:
1. Institutions’ Administration of the Direct Loan Program: Thestudy is capturing customer satisfaction data and identifying areaswhere Direct Loan institutions are having problems, andidentifying and disseminating best practices.
2. Borrower Understanding and Repayment Experience: Thestudy is surveying Direct Loan and FFEL borrowers to determinetheir satisfaction with their loan program, as well as theirknowledge and understanding of the loan origination andrepayment processes.
3. ED's Administration of the Direct Loan Program: The studywill focus on the outcomes of ED's administration rather thaninternal processes, with the exception of certain key areas.Outcomes will be assessed mainly through institutions' andborrowers' satisfaction with information provided by ED, andservices obtained in surveys of Direct Loan and FFELPinstitutions and borrowers as well as interviews of ED and otherfederal officials, and reviews of documents and reports.
Case studiesannually from1994 to 1998
Institutionalsurveys annuallyfrom 1995 to 1998
Borrower surveys1995, 1997, and1998
ED interviewsannually from1994 to 1998
40. National Evaluation of School-to-Work
(Objective 1.2)
PES
Contractor:MathematicaPolicy Research,Inc. (MPR)
Surveys of 12th gradestudents; transcripts; follow-ups, surveys of localpartnerships; case studies ofeight states and 39communities
Information on participation, high school programs of study,postsecondary enrollment and employment; STW implementation.
1996-2000; reportto Congress—January 1999.
41. Postsecondary Gatekeeping Studies
(Objective 3.3)
PES Purposive samples ofpostsecondary institutions,accrediting agencies, andstates chosen either becauseof the type of instructionbeing provided or to identifyand disseminate bestpractices
Several studies have been or will be conducted assessing how thegatekeeping process is functioning. Examples of these studiesinclude assessment of the standards used in accrediting Associatesin Applied Sciences Degrees; exploration of the use of secondarydata sources, such as unemployment insurance files, to determineemployment outcomes for students attending vocationally orientedprograms; analysis of the standards employed by accreditingassociations in reviewing graduation and placement rates inproprietary institutions; and a summary of the results of theexperimental sites initiative.
Variabledepending onemerging issues

U.S. Department of Education FY 2000 Annual Plan, Volume 1 Page 208
Descriptions of Program Evaluations and Other StudiesDescriptions of Program Evaluations and Other Studies
Study or Survey Sponsor/DataCollector Data Providers Data Collected Collection
Date(s)42.
Postsecondary CustomerSatisfaction Surveys
(Objective 3.3)
PES and Office ofPostsecondaryEducation (OPE)
Representative samples ofpostsecondary institutionsand students participating inthe postsecondary educationprograms
Surveys have been or are being conducted of postsecondaryinstitutions’ satisfaction with the operation and management of thestudent aid programs, TRIO, and student aid applicants’satisfaction with the application process.
Institutionalsurveys, 1995 and1997 and annuallybeginning in 1999
Applicant survey,1997
43. Postsecondary Data Analyses andPerformance Measures
(Objectives 3.2 and 3.3)
PES Analysis of availableinformation related to theperformance of thepostsecondary educationprograms
Studies use available data from NCES or Census surveys or EDadministrative files to obtain information to help in assessing theperformance of the postsecondary education programs. Dataprovided includes trends in the affordability of postsecondaryeducation, debt burden, default rates, and measures of institutionalcompliance.
Annual, with thetype of analysisdependent onemerging policyissues and dataavailability
44. Targeted Student Aid Studies
(Objective 3.2)
PES Representative samples ofspecific populations who areaffected by changes inlegislation or policy
Small, one-time surveys of specific populations are conducted toassess the effects of major changes in student aid policy.Examples of this type of study are surveys of students affected bychanges in the reauthorization of the Higher Education Act (HEA)and students and institutions participating in the Federal Work-Study (FWS) program.
Study of 1992HEAreauthorizationwas completed in1997.
FWS study: 1998-99
Planned study ofnext HEAreauthorization tobegin in 1999
45. Title III (Higher Education Act)Performance Measurement Study
(Objective 3.2)
PES
Contractor:Math Tech, Inc.
Institutions participating inthe Title III (HigherEducation Act, HEA)program
This study is designed to develop a system of performanceindicators for judging the success of the Title III programs. Thefour goals of the study are to (1) define program goals inmeasurable terms; (2) determine how federal managementactivities contribute to program goals; (3) determine howinstitutional activities contribute to program goals; and (4)establish an annual progress report. Information to accomplishthese goals was obtained from a survey of all Title III participatinginstitutions and case studies at between 30 and 40 selected sites.
Both the surveyand case studieswere conducted in1997

U.S. Department of Education FY 2000 Annual Plan, Volume 1 Page 209
Descriptions of Program Evaluations and Other StudiesDescriptions of Program Evaluations and Other Studies
Study or Survey Sponsor/DataCollector Data Providers Data Collected Collection
Date(s)46.
TRIO-Student Support Services(SSS) Evaluation
(Objective 3.2)
PES
Contractor:Westat, Inc.
A nationally representativesample of 2,900 studentsparticipating in SSS projectsat 30 colleges and a controlgroup of 2,900 studentsconsisting both of students atthe 30 SSS institutions whodid not participate in theprogram and of students at20 matched institutions notparticipating in the SSSprogram. Case studies wereconducted at the 50 schools.
Data are being collected to assess the effects of the SSS programon college retention and graduation, GPA, and transfer behavior(from 2-year to 4-year institutions). A second and equallyimportant focus of the evaluation is the identification of effectiveservices and practices for program improvement.
A baseline surveywas conducted in1991-92 withfollow-up surveysin 1994 and 1997.College transcriptswere collectedwith each survey.Report issued in1997. Next reportin 1999.
47. GEAR UP
(Objective 3.1)
PES
Contractor:To be determined
May include IHEs, schools,teachers, students, andparents.
Initial data collection will identify the difficulties projects have inimplementing high-quality programs, and will establish a baselineagainst which to evaluate long-term program impacts. The impactof program participation on short-term student outcomes will beexamined by collecting data on factors associated with anincreased likelihood of attending college (such as collegepreparatory course-taking, student and parent expectations,attendance and retention) and by collecting long-term outcomedata (including high school graduation and enrollment inpostsecondary education).
1999-2004
48. Title II: Teacher Quality
(Objective 1.4)
PES
ContractorTo be determined
May include States, IHEs,schools, districts, teachersand teaching candidates
Initial data collection will identify the difficulties projects havehad in implementing high-quality projects and in coordinatingamong partners. The impact evaluation will look at changes ininitial teacher certification standards, changes in the quality of theteaching force in selected sites, changes in the quality of pre-service training programs, and the skills of newly minted teachers.
1999-2004

U.S. Department of Education FY 2000 Annual Plan, Volume 1 Page 210
Descriptions of Program Evaluations and Other StudiesDescriptions of Program Evaluations and Other Studies
Study or Survey Sponsor/DataCollector Data Providers Data Collected Collection
Date(s)49.
Assessment of VocationalEducation
(Objective 1.2)
PES
Contractor(s)To be determined
States, school districts,teachers, students, employers
Data will be collected to assess the impact of vocational educationon student outcomes, progress made by states and localcommunities in implementing core strategies emphasized in thePerkins Act, uses of federal funds, and the role of mandatedaccountability requirements in “driving” program improvement.
2000-02.
50. TRIO-Upward Bound Evaluation
(Objective 3.2)
PES
Contractor:MathematicaPolicy Research,Inc.
A nationally representativesample of 67 Upward Bound(HEA) projects hosted bytwo- and four-year colleges,from which 2,700 eligibleapplicants were randomlyassigned to Upward Boundor to a control group
Data are being collected to assess the effects of Upward Bound(HEA) on students’ preparation for college, high schoolgraduation, and college entry and achievement. Impacts areestimated by comparing students in Upward Bound to the controlgroup on a range of measures, including grades, course-taking,attitudes, and educational expectations. Additional data will becollected to assess longer-term impacts on college persistence andgraduation.
Baseline survey inDecember 1992,follow-up surveysundertaken in1994 and 1996,including highschool transcripts.
Future surveyswill capture dataon collegepersistence andgraduation.Report on short-term effects ofprogramparticipationissued in 1997;next report in1999.
National Statistical and Assessment Studies51.
Advanced Telecommunications andU.S. Public Elementary andSecondary School Survey(Objective 1.7)
National Center forEducationStatistics (NCES)
National sample of U.S.elementary and secondaryschools
Information on school and classroom access to Internet, local areanetworks, and computers.
1995, 1996, 1997,1998,annual
52. Baccalaureate and Beyond (B&B)
(Objective 3.2)
NCES A representative sample ofgraduating college seniors.Beginning in 1992-93, everyother National PostsecondaryStudent Aid Study (NPSAS)serves as the basis for a newB&B study.
Information on time to degree, teacher preparation, early careersof professionals (including teachers), debt burden, andgraduate/first professional access and choice. Data are collectedfrom institutional files, ED student aid administrative records, andstudent interviews.
1992-93 cohort:follow-ups in1994, 1997
1999-2000 cohort:follow-up in 2001

U.S. Department of Education FY 2000 Annual Plan, Volume 1 Page 211
Descriptions of Program Evaluations and Other StudiesDescriptions of Program Evaluations and Other Studies
Study or Survey Sponsor/DataCollector Data Providers Data Collected Collection
Date(s)53.
Beginning Postsecondary Students(BPS)
(Objective 3.2)
NCES A representative sample offirst time beginning students,including non-traditionalolder students and recenthigh school graduates.Beginning in 1989-90, everyother NPSAS serves as thebasis for a new BPS study.
Information on persistence, progress, and attainment from initialtime of entry into postsecondary education through leaving andentering the work force. Data are collected from institutional files,ED student aid administrative records, and student interviews.
1989-90 cohort:follow-ups in 1992and 1994
1995-96 cohort:follow-ups in 1998and possibly 2001
54. Child Development Supplement tothe Panel Study of IncomeDynamics
(Objective 1.5)
Department ofHealth and HumanServices’ NationalInstitute for Childand HumanDevelopment(NICHD)
Nationally representativesample of 3,200 birth-to-12-year-old children
Data on the cognitive, behavioral, and health status of 3,200children obtained from the mother, a second caregiver, an absentparent, the teacher, the school administrator, and the child; acomprehensive accounting of parental and caregiver time inputs tochildren as well as other aspects of the way children andadolescents spend their time; teacher-reported time use inelementary and preschool programs; and measures of otherresources, such as the learning environment in the home.
Collected in 1997,to be released byNovember 1998
55. Common Core of Data Surveys
(Goal 1)
NCES Fifty states, the District ofColumbia, and five outlyingareas from the universe ofstate-level educationagencies
Information on staff and students is collected at the school, localeducation agency or school district (LEA), and state levels.Information about revenues and expenditures also is collected atthe state level, and NCES joins the Bureau of the Census incollecting school district finance data.
Annual
56. Current Population Survey (CPS)/Annual Demographic Survey-March Supplement
(Objective 3.1)
Department ofLabor’s Bureau ofLabor Statisticsand Department ofCommerce’sBureau of theCensus
Civilian non-institutionalpopulation including persons16 years of age and olderresiding in the 50 states andthe District of Columbia whoare not inmates ofinstitutions (e.g., penal andmental facilities, homes forthe aged), and who are noton active duty in the ArmedForces
Labor force data including income, labor force participation, andschool enrollment (currently enrolled, level of school, and fulltime/part time status of enrollment).
1940-present,annual

U.S. Department of Education FY 2000 Annual Plan, Volume 1 Page 212
Descriptions of Program Evaluations and Other StudiesDescriptions of Program Evaluations and Other Studies
Study or Survey Sponsor/DataCollector Data Providers Data Collected Collection
Date(s)57.
Early Childhood LongitudinalStudy (ECLS)
(Objective 2.1)
NCES A sample of kinder-gardeners from a widevariety of public and privatekindergarten programs andfrom diverse racial-ethnicand socioeconomicbackgrounds. One cohortwill be followedlongitudinally through the5th grade. Information willbe collected from thechildren and their parents,teachers, and schooladministrators.
Data on the different environments in which children live andlearn -- children's neighborhoods, families, schools, andclassrooms.
1998-2004
Beginning in1998, datacollection willoccur in the falland spring of thekindergarten yearand in the springof first, third, andfifth grades.
58. High School Transcripts Studies(Objective 3.1)
NCES High School Class of 1982,1987, 1990, 1991, 1994,1998.
Changes in course-taking patterns will be measured fromtranscripts collected for high school graduates.
1982, 1987, 1990,1991, 1994, 1998
59. Monitoring the Future (MTF)
(Objective 1.3)
Department ofHealth and HumanServices’ NationalInstitute on DrugAbuse
Grantee:University ofMichigan’sInstitute for SocialResearch
National sample (fromselected nationallyrepresentative LEAs) of 8th,10th, and 12th grade students
National data on alcohol and drug usage and attitudes, and onvictimization in schools.
Annual (12thgrade since 1975;8th and 10th gradesince 1991)

U.S. Department of Education FY 2000 Annual Plan, Volume 1 Page 213
Descriptions of Program Evaluations and Other StudiesDescriptions of Program Evaluations and Other Studies
Study or Survey Sponsor/DataCollector Data Providers Data Collected Collection
Date(s)60.
National Longitudinal Study ofYouth (NLSY)
(Goal 1)
Department ofLabor’s Bureau ofLabor Statistics
Six cohorts of men andwomen who were selected tobe representative of allAmericans born during agiven time. Cohorts include“older men,” “maturewomen,” “young men,” and“young women,” andchildren born to women inthe 1979 survey. Cohortsinclude persons of civilianand military backgrounds.
Information about the life and labor market experiences of sixgroups of men and women at different points in time. Includesbasic demographic, educational, and labor market data on youth(including out-of school youth).
1966-present
Data collections in1966, 1967, 1968,1979, 1981 1986,1990, 1994, 1995,1997
61. National Longitudinal Survey ofYouth: Supplement on School-to-work
(Objective 1.2)
National School-to-Work Officeand Department ofLabor’s Bureau ofLabor Statistics
Nationally representativesample of 12-17 year olds;school administrator survey
NLSY has been supplemented by additional items relevant to theSTW experience; i.e., participation in career majors, jobshadowing, career counseling, work-site activities, andparticipation in various STW programs.
Baseline studentsurvey in 1997;follow up surveysannually
Schooladministratorsurvey in 1997
62. National Postsecondary StudentAid Study (NPSAS)
(Objective 3.2)
NCES A representative sample ofall students enrolled at anytime during the year inless-than-2-year institutions,community and juniorcolleges, 4-year colleges,and major universitieslocated in the United Statesand Puerto Rico at theundergraduate, graduate, andfirst- professional levels
Detailed data on all forms of student financial aid received, as wellas student demographics, family income, education expenses,employment, educational aspirations, parental demographiccharacteristics, parental support, and ways that students and theirfamilies meet the costs of postsecondary education. Data arecollected from institutional files, ED student aid administrativerecords, and student interviews.
1986-87, 1989-90,1992-93, 1995-96,1999-2000, andevery fourth yearthereafter
63. National Adult Literacy Survey(NALS)
(Objective 3.4)
NCES
Contractor forNALS 1992:EducationalTesting Service,Inc. (ETS)
Adults ages 16 and overliving in U.S. households,and inmates from 80 federaland state prisons
NALS 1992 assessed the literacy skills of the U.S. adultpopulation using simulations of three kinds of literacy tasks thatadults would ordinarily encounter in daily life (prose literacy,document literacy, and quantitative literacy). Other data collectedincluded demographic characteristics, educational backgrounds,reading practices, and labor market experiences.
1992, 2002
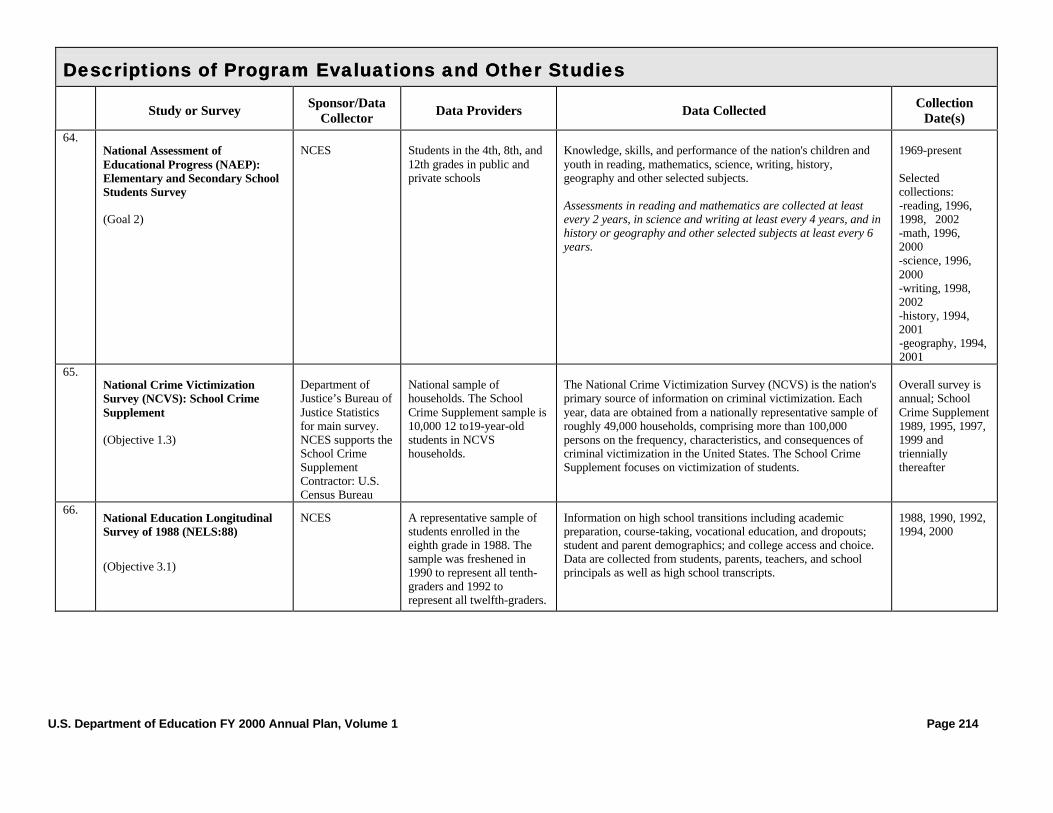
U.S. Department of Education FY 2000 Annual Plan, Volume 1 Page 214
Descriptions of Program Evaluations and Other StudiesDescriptions of Program Evaluations and Other Studies
Study or Survey Sponsor/DataCollector Data Providers Data Collected Collection
Date(s)64.
National Assessment ofEducational Progress (NAEP):Elementary and Secondary SchoolStudents Survey
(Goal 2)
NCES Students in the 4th, 8th, and12th grades in public andprivate schools
Knowledge, skills, and performance of the nation's children andyouth in reading, mathematics, science, writing, history,geography and other selected subjects.
Assessments in reading and mathematics are collected at leastevery 2 years, in science and writing at least every 4 years, and inhistory or geography and other selected subjects at least every 6years.
1969-present
Selectedcollections:-reading, 1996,1998, 2002-math, 1996,2000-science, 1996,2000-writing, 1998,2002-history, 1994,2001-geography, 1994,2001
65. National Crime VictimizationSurvey (NCVS): School CrimeSupplement
(Objective 1.3)
Department ofJustice’s Bureau ofJustice Statisticsfor main survey.NCES supports theSchool CrimeSupplementContractor: U.S.Census Bureau
National sample ofhouseholds. The SchoolCrime Supplement sample is10,000 12 to19-year-oldstudents in NCVShouseholds.
The National Crime Victimization Survey (NCVS) is the nation'sprimary source of information on criminal victimization. Eachyear, data are obtained from a nationally representative sample ofroughly 49,000 households, comprising more than 100,000persons on the frequency, characteristics, and consequences ofcriminal victimization in the United States. The School CrimeSupplement focuses on victimization of students.
Overall survey isannual; SchoolCrime Supplement1989, 1995, 1997,1999 andtrienniallythereafter
66. National Education LongitudinalSurvey of 1988 (NELS:88)
(Objective 3.1)
NCES A representative sample ofstudents enrolled in theeighth grade in 1988. Thesample was freshened in1990 to represent all tenth-graders and 1992 torepresent all twelfth-graders.
Information on high school transitions including academicpreparation, course-taking, vocational education, and dropouts;student and parent demographics; and college access and choice.Data are collected from students, parents, teachers, and schoolprincipals as well as high school transcripts.
1988, 1990, 1992,1994, 2000

U.S. Department of Education FY 2000 Annual Plan, Volume 1 Page 215
Descriptions of Program Evaluations and Other StudiesDescriptions of Program Evaluations and Other Studies
Study or Survey Sponsor/DataCollector Data Providers Data Collected Collection
Date(s)67.
National Employer Survey
(Objective 1.2)
National School-to-Work Officeand U.S. CensusBureau
Contractor:Wharton School
3200 employers Information on employer involvement with schools, and School-to-Work in particular, and measurements of the costs and benefitsto employers of such involvement.
1994, 1997, 1998,2000
68. National Household EducationSurvey (NHES)
(Objective 3.1)
NCES Households in the non-institutionalized civilianpopulation of the U.S
Data on high-priority education topics are collected on a rotatingbasis. Topics have included early childhood education, adulteducation, school readiness, safety and discipline, parent/familyinvolvement in education, and adult/youth civic improvement.
1991, 1993, 1995,1996, 1999;biannual
69. National Voluntary Tests inReading and Mathematics
(Objective 2.3)
EDContract to beawarded
4th- and 8th-graders inparticipating areas
Knowledge, skills, and performance of the nation's children andyouth in reading and mathematics.
Assessments inreading andmathematics willbe collectedannually
70. Schools and Staffing Survey (SASS)
(Objective 1.4)
NCES and U.S.Census Bureau
Principals and teachers;public and private schools;school districts
Demographics of the K-12 student population, varying demand forteachers in all regions of the nation, educational qualifications ofschool teachers and administrators, and working conditions ofteachers. A unified set of surveys allows linkages of data onteachers, schools, school districts, and administrators.
1987-88, 1990-91,1993-94,1999-2000
71. Third International Mathematicsand Science Study (TIMSS)
(Objective 2.3)
InternationalAssociation for theEvaluation ofEducationalAchievement
USA support:NCES and NSF
Students at three grade levelsin 41 countries
TIMSS compared the performance of 500,000 students in 41countries worldwide, including 40,000 Americans, at levelscorresponding to U.S. grades 4, 8, and 12. In addition to tests andquestionnaires, it included a curriculum analysis, videotapedobservations of mathematics classes, and case studies of policyissues.
1995
Grantee Reporting Systems

U.S. Department of Education FY 2000 Annual Plan, Volume 1 Page 216
Descriptions of Program Evaluations and Other StudiesDescriptions of Program Evaluations and Other Studies
Study or Survey Sponsor/DataCollector Data Providers Data Collected Collection
Date(s)72.
Adult Education National DataReporting System
(Objective 3.4)
OVAE
Contractor:AmericanInstitutes forResearch
States and local providers Student participation and program performance and financial datafor the Adult Education State Grant program.
Annual
73. National Student Loan DataSystem (NSLDS)(Objective 3.3)
OPE Administrative records on allstudents borrowing throughthe federal student loanprogram
Information on the characteristics and status of all student loanborrowers. Used both for administrative purposes --verifyingdefaulted loan status, student status confirmations, etc. -- andresearch.
Constantlyupdated withinformation frompostsecondaryinstitutions,lenders, and stateguarantee agencies
74. Safe and Drug-Free Schools ActPerformance Report
(Objective 1.3)
PES and OESE(Office ofElementary andSecondaryEducation)Contractor:Westat, Inc.
State coordinators (SEA andGovernor’s Office) for stateformula grant program
Information on program implementation, prevalence andincidence of drug and alcohol use and violence in schools,progress in achieving measurable goals and objectives.
Annual
75. School-to-Work State ProgressMeasures
(Objective 1.2)
National School-to-Work Office,ED, andDepartment ofLaborContractor:MathematicaPolicy ResearchAssociates, Inc.
School-to-Work (STW)partnerships in states withimplementation grants andall direct federal grantees
In collaboration with the national School-to-Work Office, stateshave led the way in defining measures of student, school, andemployer participation in career awareness, career exposure,career exploration, and work-based learning activities, as well as“leveraged” funding for STW.
1996, annual
76. State annual report cards(Objective 1.7)
OESE State education agencies(voluntary)
Information on state educational technology plan and otheractivities related to the Educational Technology Challenge Fund.
1997, annual.
Other Surveys and Studies

U.S. Department of Education FY 2000 Annual Plan, Volume 1 Page 217
Descriptions of Program Evaluations and Other StudiesDescriptions of Program Evaluations and Other Studies
Study or Survey Sponsor/DataCollector Data Providers Data Collected Collection
Date(s)77.
Advanced Placement (AP)Examination Data(Objective 3.1)
The College Board High school students takingAP exams in public andprivate schools
Knowledge, skills, and performance of high school students on APexaminations.
Annual
78. Key State Education Policies on K-12 Education(Objective 1.1)
Council of ChiefState SchoolOfficers (CCSSO)
State education agencies Information on state development of content standards,graduation, teacher licensure, time and attendance.
Biennial
79. Magnet Schools of America AnnualDirectory
(Objective 1.6)
Magnet Schools ofAmerica, Inc.
Districts/schools withmagnet programs nationally
Name of school, school mailing address, school phone number,district location, name of principal, grades served, type of program(whole school or program within a school), and theme type (e.g.,math, performing/fine arts, Montessori).
Updatedcontinuously
80. Making Standards Matter, 1997(Objective 1.1)
AmericanFederation ofTeachers
State education agencies Information on state development of academic standards in thecore subjects. Report also assesses quality of standards.
1995, 1996,1997,1998, annual
81. Setting Education Standards HighEnough(Objective 1.1)
Southern RegionalEducation Board
Secondary analysis ofstudent assessment data, forgrades 4 & 8
Comparison of performance on NAEP to performance on stateassessments.
1996
82. State Student AssessmentPrograms Database
(Objective 1.1)
OERI and Councilof Chief StateSchool Officers.Grantee: NorthCentral RegionalEducational Lab(NCREL)
State education agencies Information on state assessment systems. 1996, 1997, 1998,annual
83. States’ pass rates on rigorouslicensing exams(Objective 1.4)
PES
Contractor:Westat, Inc.
Teachers taking the NationalTeacher Exam/Praxis in 50states
Pass rates on the National Teacher Exam/Praxis. 1997-2002, annual
84. Textbook and InstructionalMaterials Analysis(Objective 1.1)
OERIIndependentExpert Panel
Textbooks and instructionalmaterials on the market
Percentage of textbooks and instructional materials thatindependent experts consider exemplary and aligned with highstandards.
1998

U.S. Department of Education FY 2000 Annual Plan, Volume 1 Page 218
Appendix C: Relationship of ProgramGoals to Strategic Plan Goals andObjectives
The Department is committed to being held accountable for measuring and reporting results on our goals andobjectives. Like the strategic plan, the individual program performance plans lay out goal objectives,performance indicators and targets, data sources, and key strategies for all programs in the Department.They are directly linked to the Department’s budget for each program area. In some cases, several budgetline items have been aggregated into a single performance plan. The individual programs are separatelyidentifiable, however, with at least one objective specified for each.
The following table links the Department’s programs to the objectives in the strategic plan. It is intended toshow where programs have a significant amount of activities or products supporting an objective.

U.S. Department of Education FY 2000 Annual Plan, Volume 1 Page 219

U.S. Department of Education FY 2000 Annual Plan, Volume 1 Page 220
FY 2000 Request ($000)
$491
,000
$55,
000
$10,
000
$45,
000
$7,0
00
$2,0
00
$177
,000
$560
,000
$600
,000
$7,9
96,0
20
$145
,000
$380
,000
$42,
000
$150
,000
$22,
000
$736
,000
$1,4
00,0
00
$335
,000
$0 $591
,000
$18,
000
$10,
500
$114
,000
$31,
700
$3,0
00
$7,3
34
$0
Relationship of Department ofEducation Programs to
Strategic Plan Objectives
Go
als
2000
(st
ate/
loca
l im
pro
./ p
aren
t as
sist
.)
Sch
oo
l-to
-Wo
rk O
pp
ort
un
itie
s
Reg
ion
al T
ech
no
log
y in
Ed
uca
tio
n
Sta
r S
cho
ols
Rea
dy
to L
earn
Tel
evis
ion
Tel
eco
mm
un
icat
ion
s M
ath
Nat
ion
al a
ctiv
itie
s
Tec
hn
olo
gy
Ch
alle
ng
e (f
un
ds
and
gra
nts
)
21st
Cen
tury
Co
mm
un
ity
Lea
rnin
g C
ente
rs
Tit
le I
Gra
nts
to
loca
l ed
uca
tio
n a
gen
cies
Eve
n S
tart
Tit
le I
Mig
ran
t E
du
cati
on
Tit
le I
Neg
lect
ed a
nd
Del
inq
uen
t
Co
mp
reh
ensi
ve s
cho
ol r
efo
rm d
emo
nst
rati
on
s
Mig
ran
t E
du
cati
on
(H
EP
an
d C
AM
P)
Imp
act
Aid
Cla
ss-S
ize
Red
uct
ion
/Tea
cher
Fin
. In
itia
tive
Eis
enh
ow
er P
rofe
ssio
nal
Dev
. Sta
te G
ran
ts
Inn
ova
tive
Str
ateg
ies
Sta
te G
ran
ts (
Ch
ap. V
I)
Saf
e an
d D
rug
-Fre
e S
cho
ols
Inex
pen
sive
Bo
ok
Dis
trib
uti
on
Art
s in
Ed
uca
tio
n
Mag
net
Sch
oo
ls A
ssis
tan
ce
Ed
uca
tio
n f
or
Ho
mel
ess
Ch
ildre
n a
nd
Yo
uth
Wo
men
’s E
du
cati
on
al E
qu
ity
Tra
inin
g a
nd
Ad
viso
ry S
ervi
ces
(CR
A_I
V)
Elle
nd
er F
ello
wsh
ips
Goal 1: K-12 education system
1.1 States develop and implement standards X X X X
1.2 School-to-work X
1.3 Strong, safe and drug-free schools X X X
1.4 Talented and dedicated teachers X X X X X X X X X
1.5 Families and communities X X X X X X X
1.6 Public school choice X
1.7 Technology X X X X X X X X
Goal 2: A solid foundation for all students
2.1 All children ready to learn X X X X X
2.2 Third grade reading X X X X X X X X X X
2.3 Eighth grade math X X X X X X X X
2.4 Special populations help X X X X X X X X X X X X X X X X
Goal 3: Postsecondary education and lifelong learning
3.1 Secondary students – information & support X
3.2 Postecondary students – fin. aid & support X
3.4 Lifelong learning X X
Goal 4: High-performance organization
4.2 Flexibility with accountability X X
4.3 Research, development and improvement X X X X
Civil rights, direct support X X X

U.S. Department of Education FY 2000 Annual Plan, Volume 1 Page 221
FY 2000 Request ($000)
$20,
000
$10,
000
$130
,000
$32,
000
$20,
000
$286
,000
$77,
000
$259
,000
$6,0
00
$150
,000
$4,3
14,0
00
$402
,435
$390
,000
$45,
200
$64,
508
$44,
556
$82,
139
$22,
535
$34,
523
$50,
000
$2,3
53,7
39
$23,
390
$10,
928
$41,
629
$16,
942
$2,3
50
$2,5
96
Relationship of Department ofEducation Programs to
Strategic Plan Objectives
Ed
uca
tio
n f
or
Nat
ive
Haw
aiia
ns
Ala
ska
Nat
ive
Ed
uca
tio
n E
qu
ity
Ch
arte
r S
cho
ols
Co
mp
reh
ensi
ve R
egio
nal
Ass
ista
nce
Cen
ters
Ad
van
ced
Pla
cem
ent
Tes
t F
ees
Rea
din
g E
xcel
len
ce A
ct
Ind
ian
Ed
uca
tio
n
Bili
ng
ual
Ed
uca
tio
n
Fo
reig
n L
ang
uag
e A
ssis
tan
ce
Imm
igra
nt
Ed
uca
tio
n
IDE
A S
pec
ial E
d. G
ran
ts t
o S
tate
s (P
art
B)
IDE
A P
resc
ho
ol G
ran
ts (
Par
t B
)
IDE
A In
fan
ts a
nd
Fam
ilies
(P
art
C)
IDE
A S
tate
imp
rove
men
t
IDE
A R
esea
rch
an
d In
no
vati
on
IDE
A T
ech
nic
al A
ssis
tan
ce &
Dis
sem
inat
ion
IDE
A P
erso
nn
el P
rep
arat
ion
IDE
A P
aren
t In
form
atio
n C
ente
rs
IDE
A T
ech
no
log
y an
d M
edia
Ser
vice
s
Pri
mar
y E
du
cati
on
Inte
rven
tio
n
Vo
cati
on
al R
ehab
. (V
R)
Sta
te G
ran
ts
RA
Gra
nts
fo
r In
dia
ns
RA
Clie
nt
Ass
ista
nce
Sta
te G
ran
ts
RA
Tra
inin
g
RA
Dem
on
stra
tio
n a
nd
Tra
inin
g P
rog
ram
s
RA
Mig
ran
t an
d S
easo
nal
Far
m W
ork
ers
RA
Rec
reat
ion
al P
rog
ram
s
Goal 1: K-12 education system
1.3 States develop and implement standards X X X X X
1.4 School-to-work X X
1.5 Strong, safe and drug-free schools X
1.6 Talented and dedicated teachers X X X X X X X X X X X X
1.5 Families and communities X X X X X X X X
1.8 Public school choice X X
1.9 Technology X X
Goal 2: A solid foundation for all students
2.3 All children ready to learn X X X X X X X X X X X
2.4 Third grade reading X X X X X X X X X
2.5 Eighth grade math X X X X X X
2.6 Special populations help X X X X X X X X X X X X X X X X X X X X
Goal 3: Postsecondary education and lifelong learning
3.3 Secondary students – information & support X X X X
3.4 Postecondary students – fin. aid & support X
3.5 Lifelong learning X X X X X X
Goal 4: High-performance organization
4.4 Flexibility with accountability X
4.5 Research, development and improvement X X X X X X X
Civil rights, direct support X X X

U.S. Department of Education FY 2000 Annual Plan, Volume 1 Page 222
FY 2000 Request ($000)
$10,
894
$22,
071
$84,
574
$1,9
00
$1,5
87
$8,5
50
$90,
964
$45,
000
$8,9
73
$47,
925
$85,
120
$1,0
13,1
29
$17,
500
$4,1
00
$468
,000
$6,0
00
$12,
000
$7,4
63,0
00
$1,6
95,0
00
$25,
000
$2,2
16,5
40
($10
,325
)
$42,
250
$259
,825
$27,
500
$69,
022
$115
,000
Relationship of Department ofEducation Programs to
Strategic Plan Objectives
RA
Pro
tect
./A
dvo
c. In
div
idu
al R
igh
ts
RA
Pro
ject
s w
ith
Ind
ust
ry
RA
Ind
epen
den
t L
ivin
g
RA
Pro
gra
m Im
pro
vem
ent
RA
Eva
luat
ion
Hel
en K
elle
r N
atio
nal
Cen
ter
NID
RR
Ass
isti
ve T
ech
no
log
y
Am
eric
an P
rin
tin
g H
ou
se f
or
the
Blin
d
Nat
ion
al T
ech
nic
al In
stit
ute
fo
r D
eaf
Gal
lau
det
Un
iver
sity
Vo
cati
on
al E
du
cati
on
Sta
te G
ran
ts
Vo
cati
on
al E
du
cati
on
Nat
ion
al P
rog
ram
s
Tri
bal
ly C
on
tro
l, P
ost
seco
nd
ary
Vo
c. In
st.
Ad
ult
Ed
. (G
ran
ts,
Eva
l., T
ech
. Ass
ista
nce
)
Nat
ion
al In
stit
ute
fo
r L
iter
acy
Inca
rcer
ated
Yo
uth
Off
end
ers
Pel
l Gra
nts
Cam
pu
s-B
ased
Pro
gra
ms
Lev
erag
ing
Ed
uca
tio
nal
Ass
ist.
Par
tner
ship
Fed
eral
Fam
ily E
du
cati
on
Lo
ans
Dir
ect
Stu
den
t L
oan
s
His
pan
ic-S
ervi
ng
Dev
elo
pin
g In
stit
uti
on
s
Aid
fo
r In
stit
uti
on
al D
evel
op
men
t
Fu
nd
fo
r Im
pro
vem
ent
of
Po
stse
con
dar
y E
d.
Inte
rnat
ion
al E
d. &
Fo
reig
n L
ang
uag
e S
tud
ies
Imp
rovi
ng
Tea
cher
Qu
alit
y
Goal 1: K-12 education system
1.5 States develop and implement standards X
1.6 School-to-work X X X
1.7 Strong, safe and drug-free schools
1.8 Talented and dedicated teachers X X X
1.5 Families and communities X
1.10 Public school choice
1.11 Technology X X X
Goal 2: A solid foundation for all students
2.5 All children ready to learn X X
2.6 Third grade reading X X X
2.7 Eighth grade math X X
2.8 Special populations help X X X X X X X X X
Goal 3: Postsecondary education and lifelong learning
3.5 Secondary students – information & support X X
3.6 Postecondary students – fin. aid & support X X X X X X X X X X
3.6 Lifelong learning X X X X X X X X X X X X X X X X X
Goal 4: High-performance organization
4.6 Flexibility with accountability X
4.7 Research, development and improvement X X X X X X
Civil rights, direct support X X

U.S. Department of Education FY 2000 Annual Plan, Volume 1 Page 223
FY 2000 Request ($000)
$0 $5,0
00
$12,
000
$630
,000
$41,
000
$240
,000
$39,
859
$5,0
00
$17,
000
$15,
000
$20,
000
$1,7
50
$219
,444
$108
,782
$65,
000
$24,
500
$122
,000
$30,
000
$139
,500
$6,5
00
$17,
500
$4,0
00
$10,
000
$9,5
00
$7,0
00
$73,
262
Relationship of Department ofEducation Programs to
Strategic Plan Objectives
Urb
an C
om
mu
nit
y S
ervi
ce
Dem
on
s, P
roje
cts
for
Stu
den
ts w
/ Dis
abili
ties
Inte
rest
Su
bsi
dy
Gra
nts
TR
IO P
rog
ram
s
Gra
du
ate
Ass
ista
nce
in a
reas
of
nat
ion
al n
eed
GE
AR
UP
Byr
d H
on
ors
Sch
ola
rsh
ips
Ch
ild C
are
Acc
ess
D.C
. Acc
ess
Pre
par
ing
fo
r C
olle
ge
Lea
rnin
g A
nyt
ime
An
ywh
ere
Par
tner
ship
s
Un
der
gro
un
d R
ailr
oad
Pro
gra
m
Ho
war
d U
niv
ersi
ty
Nat
ion
al E
du
cati
on
Res
earc
h In
stit
ute
s
Reg
ion
al E
du
cati
on
al L
abo
rato
ries
Nat
ion
al D
isse
min
atio
n A
ctiv
itie
s
Sta
tist
ics
and
ass
essm
ent
Eis
enh
ow
er P
rofe
ssio
nal
Dev
elo
pm
ent
Fed
eral
Fu
nd
s fo
r Im
pro
vem
ent
of
Ed
uca
tio
n
Javi
ts G
ifte
d a
nd
Tal
ente
d E
du
cati
on
Eis
enh
ow
er R
eg. M
ath
/Sci
ence
Co
nso
rtia
GP
RA
Dat
a/P
rog
ram
Eva
luat
ion
Nat
ion
al W
riti
ng
Pro
ject
Civ
ic E
du
cati
on
Int’
l Ed
uca
tio
nal
Exc
han
ge
(Go
als
2000
)
Off
ice
for
Civ
il R
igh
ts
Goal 1: K-12 education system
1.7 States develop and implement standards X X X X X X X
1.8 School-to-work X X X
1.9 Strong, safe and drug-free schools X X
1.10 Talented and dedicated teachers X X X X X X X X X
1.5 Families and communities X X X X X
1.12 Public school choice X X X
1.13 Technology X X X X X X X
Goal 2: A solid foundation for all students
2.7 All children ready to learn X X X X X
2.8 Third grade reading X X X X X X X
2.9 Eighth grade math X X X X X X X X X
2.10 Special populations help X X X X X X X X X
Goal 3: Postsecondary education and lifelong learning
3.7 Secondary students – information & support X X X X X X X X
3.8 Postecondary students – fin. aid & support X X X X X X X X X X X X
3.7 Lifelong learning X X X X X X X
Goal 4: High-performance organization
4.8 Flexibility with accountability
4.9 Research, development and improvement X X X X X X X X
Civil rights, direct support X X

U.S. Department of Education FY 2000 Annual Plan, Volume 1 Page 224
Appendix D: Funding andStaffing by Objective
The following table shows the Department’s initial estimated distribution of its funding and staffing byStrategic Plan objective. The Department does not have an accounting system that fully supports thisbreakout. Accordingly, where funds were split between objectives, estimates took into account knowledgeabout program components or evaluation study findings.
Constructing this table for postsecondary education and lifelong learning was relatively easy. Many K-12programs have multiple purposes and functions and did not fit as easily into one or two objectives.
Two objectives were particularly cross-cutting, such that major programs could count as meeting themplus at least one other. These were the professional development objective (Objective 1.4) and support forK-12 special populations (Objective 2.4). For example, Title I is totally aimed at improving education forspecial populations, but, at the same time, it provides billions of dollars for reading and math instructionand thus is the major source of support for Objectives 2.2 and 2.3 (the reading and math objectives).
The funds shown in the unduplicated part of the table for Objective 1.4 and 2.4 include programs or partsof programs, which had little or no overlap with other objectives. We also calculated duplicated totals fortheses two objectives (shown at the bottom of the table) in which were counted all or part of programsthat supported professional development or special populations, regardless of whether the program alsosupported other objectives. As can be seen, a substantial portion of the Department’s K-12 funding goesfor special populations ($13.6 billion out of the $20.2 billion for Goals 1 and 2).

U.S. Department of Education FY 2000 Annual Plan, Volume 1 Page 225
Distribution of FY 2000 Funding and Staffing by ObjectiveProgram ($in millions)
S&E Funding($ in 000s)
Staffing(FTE)
Total--unduplicated $35,137.2 $1,106.5 4,737Goal 1: Help all students reach standards. $7,351.9 $44.2 363Objective 1.1. States develop and implement standards. $412.3 $7.1 41Objective 1.2. School to work $1,768.4 $10.7 98Objective 1.3. Strong, safe, drug-free schools $1,275.0 $7.2 65Objective 1.4. Talented and dedicated teachers $567.6 $4.4 37Objective 1.5. Families and communities $2,127.8 $4.5 32Objective 1.6. Public school choice $244.0 $2.9 26Objective 1.7. Education technology $956.8 $7.4 64Goal 2: A solid foundation for all children $12,902.6 $40.7 354Objective 2.1. All children ready to learn $2,028.9 $3.0 26Objective 2.2. All children able to read by 3rd grade $7,424.3 $11.8 105Objective 2.3. All 8th graders master math $3,449.4 $8.6 78Objective 2.4. Special populations help $17.4 145Goal 3: Postsecondary education and lifelong learning $14,221.5 $757.7 1,962Objective 3.1. Secondary students- information & support $417.8 $3.2 28Objective 3.2. Postsecondary students- financial aid & support $9,123.0 $142.9 1,396Objective 3.3. Postsecondary aid system $574.4 205Objective 3.4. Lifelong learning $4,680.7 $37.2 333Goal 4: ED a high-performance organization $577.5 $189.4 1,327Objective 4.1. Customer service $33.3 196Objective 4.2. Support for ED partners $56.0 $10.1 90Objective 4.3. Research and development $521.5 $52.4 444Objective 4.4. Information technology $4.1 74Objective 4.5. ED workforce/operational support $33.9 173Objective 4.6. Financial integrity $50.0 311Objective 4.7. Performance management $5.6 39Civil Rights $83.6 $74.4 731
Duplicated ObjectivesObjective 1.4 Talented and dedicated teachers $1,325.2 $6.0 51Objective 2.4 Special populations help $14,295.7 $43.7 365