U.S. Department of Defense Services Contract Spending and the
14
1 This research is supported by a grant from the Naval Postgraduate School’s Acquisition Research Program
Transcript of U.S. Department of Defense Services Contract Spending and the

1
This research is supported by a grant from the
Naval Postgraduate School’s Acquisition Research Program

2
Spending by the Department of Defense (DoD) on services contracts, which range from clerical and administrative work to vehicle maintenance to research and development (R&D), has been largely neglected by past studies of DoD spending trends. Yet DoD spending on services contract actions amounted to just under $200 billion in 2011, more than 50 percent of total DoD contract spending and nearly a third of the entire DoD budget. Both the executive branch and Congress have implemented policies to improve acquisitions of services, but the impacts of their efforts remain uncertain without a clear, concise analysis of past spending. And the then Undersecretary of Defense for Acquisition, Technology and Logistics, Dr. Ashton Carter, has stated that: “Most of our services acquires, unlike weapons-system acquires, are amateurs… I intend to help them get better at it” (Speech at the Heritage Foundation, April 20, 2011). The goal of this project is to provide policymakers with an in-depth analysis of trends in DoD spending on services contract actions and the companies that provided them from 1990 to 2011. Using the Federal Procurement Data System (FPDS) and other sources, we will present data on overall DoD services contract spending and on specific service areas. We will then analyze the data by degree of competition, contract vehicle type, DoD component, contractor identity, etc., and by DoD Component (Army, Navy, Air Force and “Other”). A set of recommendations for policymakers will then be developed and vetted with a panel of government, industry and academia experts.

3
The main source of data for this project is the Federal Procurement Data System (FPDS), the official clearinghouse of federal government contracting data. This database includes, amongst other data, all unclassified DoD prime contract actions worth over $2,500 ($25,000 for the years prior to 2005). For each contract action, FPDS includes over two hundred fields of data. Using both the FPDS query tool and the USASpending.gov query function, CSIS identified and downloaded all DoD services contract actions for the period of 1990-2011. This amounts to over three million contract actions over the last 12 years. We then imported the data into a custom-built Microsoft Access database that included only fields that were relevant for our research, amounting to fifty-six fields that include the main categories for analysis in this report. In addition to downloading the data, the CSIS research team undertook a rigorous process to verify and improve the accuracy and quality of the data. Trial queries were run to detect patterns of blank, incomplete, or improperly entered data. Data was also checked against the Bloomberg government contracting database to ensure overall accuracy, and against DoD’s DD 350 Individual Contracting Action Reports to verify accuracy for certain large contracts.

4
In order to show broader trends among similar activities with overlapping industrial bases, CSIS created six service categories. Each category consists of several FPDS service codes and represents a broad area of service activity. The six categories and their respective FPDS service codes are: Information and communications technology (ICT) services – All of service codes D, H, and L, and elements of service codes J, K, N and W; Professional, administrative, management services (PAMS) – All of service codes B, C, R, T, and U, and elements of service codes A, H, and V; Research & development (R&D) – Elements of service code A; Equipment-related services (ERS) – Elements of service codes J, K, N, P, V, and W; Facility-Related Services & Construction (FRS&C) services – All of service codes E, F, M, S, X, Y, and Z, and elements of service code P; Medical services – All of service codes G and Q. While these buckets correspond with similarly-titled DoD “portfolio groups”, their contents were selected by CSIS from FPDS service codes determined to be germane to each bucket’s title, thereby forming narrower definitions of each service category. This addresses a Defense Science Board criticism that the DoD portfolio groups “inappropriately” combine disparate service codes under the same title (such as those for routine education and training with those for expeditionary logistics management under “knowledge-based services”) (Report of the Defense Science Board Task Force on Improvements to Services Contracting. Washington, D.C.: OSD, March 2011, p. 6).

In 2011, DoD spending on service contract actions totaled $198 billion, accounting for slightly under 30 percent of total DoD outlays and 56 percent of total DoD contract spending for the year (up from 50 percent the year before and 48 percent in 2000). During the 12-year period analyzed, DoD services contract spending increased at an compound annual growth rate (CAGR) of 7.2 percent, which is just below the 7.4 percent 11-year CAGR exhibited by all other defense contract spending (which covers primarily DoD contracting for products). Interestingly, during the recent years of defense drawdowns (2008-2011), DoD services contract spending decreased by some $18 billion (a 9 percent decline) while spending on products decreased by $26 billion (almost 13 percent). However, the share of service contract spending as a share of total DoD outlays decreased from 33 percent to under 30 percent.
5

Spending on services across the various DoD Components grew at a rapid pace after 9/11, driven primarily by operations in Afghanistan and Iraq. However, this growth has not been even across the various DoD Components. For much of the past decade, the Army was the primary driver of growth in DoD’s service contract spending, increasing at an average of 8.9 percent per year for the period. After reaching a peak of $89 billion in 2009, Army service contract spending decreased substantially to $76 billion in 2011, largely as a result of the U.S. force drawdown in Iraq. For the past three years, the Army’s spending on service contracts has declined by 2.5 percent per year. Growth in Air Force service contract spending was more moderate, increasing at an 11-year CAGR of 3.9 percent and hovering around $40 billions each year since 2006. Growth in Navy service contract spending was also slow relative to the Army’s, growing at a 5.1 percent 11-year CAGR from $27 billion in 2000 to $51 billion in 2009. Yet, as with all DoD Components, Navy spending decreased after 2009, from $51 billion to $47 billion, and, like the Air Force, Navy spending on services contracts has seen limited growth since 2006. The highest growth rate in spending on services occurred in the “Other” category, which increased at a 13 percent CAGR, from $9 billion to $36 billion between 2000 and 2011. Furthermore, unlike the key military departments, the “Other” category continued to grow after 2009, from $32 billion in 2010 to $36 billion in 2011. [It should be noted that the main elements of the “Other” category are the Defense Logistics Agency and the Missile Defense Agency.] Between 2009 and 2011, Army services contract spending decreased by nearly 15 percent, while that of the Navy and the Air Force decreased by 12 percent and 10 percent, respectively. Spending on services contracts in the Other DoD category, meanwhile, increased by 9 percent.
6

From 2000 to 2011, with record defense budgets and high operational tempo in Iraq and Afghanistan, all service categories experienced growth. MED had the highest growth at almost 16 percent per year on average, followed by PAMS and ERS with 8.9 and 8.2 percent, respectively. MED grew its share of total DoD service contracts from 3 percent in 2000 of to 7 percent in 2011, while PAMS grew from 26 percent to 30.6 percent. The only other service category that saw its share of overall service contracts increase was ERS, which grew from 10.8 percent in 2000 to 12.5 percent in 2011. However, the three larges categories in terms of total dollars spent remained PAMS, FRS&C, and R&D. For the 12-year period, R&D saw the slowest growth (4.7 percent CAGR) of any service area, though it should be noted that contract actions awarded for classified R&D are not included in the FPDS data. As defense spending overall began decreasing in 2009, the biggest cuts in DoD service contracts occurred in FRS&C, which fell from $55.7 billion in 2009 to $43 billion in 2011, largely due to reduced demand for base construction and maintenance in support of operations in Iraq. The second-largest decrease in contract service spending by category was in R&D, which declined from $44 billion in 2009 to $38 billion in 2011. Despite the decline in overall DoD services contract spending in recent years, spending on ERS, ICT and MED increased in 2011. The largest of these increases occurred in ERS, which grew from $20.8 billion in 2010 to $24.7 billion in 2011. This growth can be attributed to higher demand for services to repair and upgrade equipment returned from Iraq and Afghanistan, in anticipation of funds not being made available for acquiring new hardware. ICT grew from $16.1 billion to $17.6 billion and MED grew from $13 billion to $14 billion. Between 2009 and 2011, DoD spending on R&D-related services decreased 13 percent, while spending on PAMS also declined by 4 percent. The largest percentage decrease in services spending during this time occurred in FRS&C with a loss of nearly 25 percent. Spending on MED, meanwhile, decreased only 1 percent. The only categories in which spending increased were ERS and ICT, which grew by 10 percent and 6 percent, respectively.
7

From 2000 to 2011, DoD services contract dollars awarded through definitive contract vehicles grew at a 4.3 percent 11-year CAGR, from $54 billion in 2000 to $85.8 billion in 2011. In parallel, dollars awarded through all IDVs collectively (FSS, Purchase Order, Multiple Award, Single Award, and Unlabeled IDVs) grew more than twice as quickly at a 10.2 percent 11-year CAGR, from $37.5 billion in 2000 to $109.4 billion in 2011. As a proportion of DoD contract dollars spent on services, those carried through definitive contracts declined from 58 percent in 2000 to 43 percent in 2011. Much of the growth in IDVs over the last 12 years has been in the multiple-award IDV subcategory. Contract dollars delivered through this vehicle grew from just $9 billion in 2000 to $47 billion in 2011 at an 11-year CAGR of 16.8 percent. Despite the decline in DoD contract spending over the last two years, the multiple-award IDV subcategory has actually grown in value, from $42 billion in 2009 to $47 billion in 2011. Meanwhile, single-award IDVs have declined over the past two years observed, from $64 billion in 2009 to $56 billion in 2011. Yet, for the entire period observed, the single award IDV subcategory held a 7.4 percent 11-year CAGR, due to strong growth during the first nine years of the decade. Between 2009 and 2011, DoD contract dollars for services delivered through Definitive Contracts decreased by 15 percent, while those delivered through a single-award IDV decreased by 13 percent. Contract dollars in the multiple-award IDV and FSS or Other IDV subcategories, meanwhile, increased by 13 percent and 5 percent, respectively.
8

Between 2010 and 2011, there was a shift away from the use of time and materials funding mechanisms, an increase in the use of fixed price contracts, and no change in the use of cost reimbursement funding mechanisms. Dollars spent on time and materials decreased from $6 billion (6.5 percent of total service contract actions) in 2000 to $8.9 (4.5 percent of total service contract actions) in 2011. The percentage of DoD services contract dollars funded through fixed price contracts increased from $42 billion in 2000 (45.6 percent) to $100 billion in 2011 (50.2 percent). The value of reimbursement contract actions remained constant at 43 percent of total DoD services contract dollars. Combination funding mechanisms, which pose a problem for accountability and transparency because they obscure how many contract dollars were awarded in each category, saw a brief but sudden rise between 2006 and 2009, from $4 billion to $30 billion. However, this category then sharply dropped to $5 billion in 2010 and further decreased to $4 billion by 2011. Similarly, the data show that unlabeled contract funding mechanisms, which pose a similar problem for contracting oversight as that posed by combination mechanisms, have all but disappeared in the last two years. Between 2009 and 2011, the total value of fixed-price contracts for defense services rose 6 percent, while that of cost-reimbursement contracts grew more than 13 percent. Time and materials contracts dropped in combined value by almost 38 percent. Meanwhile, the total value of contracts funded through a combination of these mechanisms fell precipitously, losing almost 87 percent of total value.
9

Overall, DoD’s efforts to encourage more competition has had mixed results. Between 2000 and 2010, DoD increased the level of competition in service contract actions only slightly. During this period, the share of service contracts that were competed and received multiple offers rose from 63 percent in 2000 to 64 percent in 2010, and the share service contract actions that were not competed or received only a single offer dropped from 37 percent in 2000 to 36 percent in 2010. However, the overall share of competed contract actions (i.e. those in the categories of “full and open competition”, “limited competition” and “competition with single offer”) rose at a faster pace, from 70 percent in 2000 to 78 percent in 2010. Over the past year, however, total DoD contract dollars awarded on the basis of competition decreased while the value of contract actions awarded noncompetitively increased. As a result, competitively-awarded contract dollars declined as a percentage of total DoD service contract dollars spent, from 78 percent to 76.2 percent, while noncompetitively awarded contract dollars increased from 22 percent to 23.6 percent of total service contract spending. This rise in non-competed contract dollars is slightly more concerning than in other instances when non-competed contract dollars rose, as 2010-2011 was the first time than competed contract dollars decreased as non-competed contract dollars actually increased year-on-year. A note regarding methodology: in contrast to recent GAO reports on competition in DoD services contracts, CSIS does not include the “fair opportunity/limited sources” variable when determining extent of competition. Also in contrast to GAO, CSIS does differentiate between contracts receiving multiple bids or single bids in competition. Between 2009 and 2011, the level of competition for defense services contracts remained stable. While the total value of contracts competed fully and openly declined by 7 percent, the value of those with limited competition remained unchanged. Meanwhile, the value of contracts competed and then awarded after receiving a single offer declined by 13 percent. Contracts awarded under sole source exception clauses decreased in combined value by 10 percent, while those awarded without competition with another exception remained unchanged in value.
10
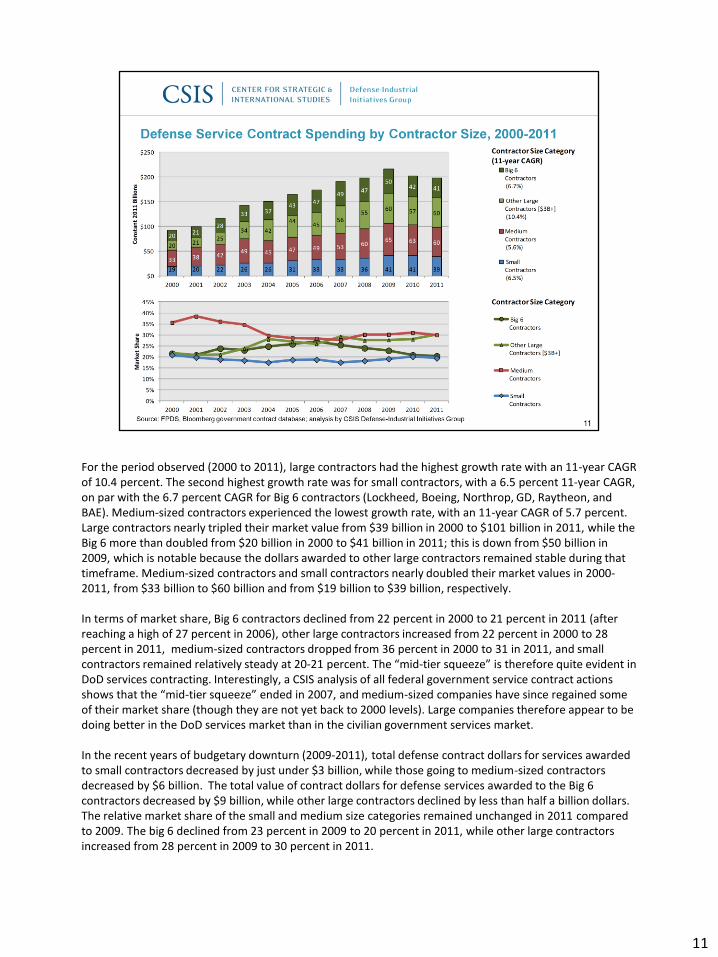
For the period observed (2000 to 2011), large contractors had the highest growth rate with an 11-year CAGR of 10.4 percent. The second highest growth rate was for small contractors, with a 6.5 percent 11-year CAGR, on par with the 6.7 percent CAGR for Big 6 contractors (Lockheed, Boeing, Northrop, GD, Raytheon, and BAE). Medium-sized contractors experienced the lowest growth rate, with an 11-year CAGR of 5.7 percent. Large contractors nearly tripled their market value from $39 billion in 2000 to $101 billion in 2011, while the Big 6 more than doubled from $20 billion in 2000 to $41 billion in 2011; this is down from $50 billion in 2009, which is notable because the dollars awarded to other large contractors remained stable during that timeframe. Medium-sized contractors and small contractors nearly doubled their market values in 2000-2011, from $33 billion to $60 billion and from $19 billion to $39 billion, respectively. In terms of market share, Big 6 contractors declined from 22 percent in 2000 to 21 percent in 2011 (after reaching a high of 27 percent in 2006), other large contractors increased from 22 percent in 2000 to 28 percent in 2011, medium-sized contractors dropped from 36 percent in 2000 to 31 in 2011, and small contractors remained relatively steady at 20-21 percent. The “mid-tier squeeze” is therefore quite evident in DoD services contracting. Interestingly, a CSIS analysis of all federal government service contract actions shows that the “mid-tier squeeze” ended in 2007, and medium-sized companies have since regained some of their market share (though they are not yet back to 2000 levels). Large companies therefore appear to be doing better in the DoD services market than in the civilian government services market. In the recent years of budgetary downturn (2009-2011), total defense contract dollars for services awarded to small contractors decreased by just under $3 billion, while those going to medium-sized contractors decreased by $6 billion. The total value of contract dollars for defense services awarded to the Big 6 contractors decreased by $9 billion, while other large contractors declined by less than half a billion dollars. The relative market share of the small and medium size categories remained unchanged in 2011 compared to 2009. The big 6 declined from 23 percent in 2009 to 20 percent in 2011, while other large contractors increased from 28 percent in 2009 to 30 percent in 2011.
11

To analyze the composition of the DoD service contractor industrial base, CSIS investigated every Dun & Bradstreet Data Universal Numbering System (DUNS) number representing entities awarded $250 million or more in a given year. Using the Defense Logistics Agency’s Business Identification Number Cross-reference System (BINCS), as well as information from Bloomberg and web searches, each DUNS number was associated with the respective parent entity (company, university, or joint venture) (this association is not provided in the FPDS data). CSIS also researched all the mergers and acquisitions by defense contractors as well as joint ventures among DoD service contractors to ensure that obligated dollars were being assigned to the correct parent companies. The makeup of the top 7 defense service contractors has been stable, with the only differences between 2000 and 2011 being the disappearance of TRW (acquired by Northrop Grumman) and the entry of L3 into 7th place in 2011. However, there has been more significant upheaval within the rest of the top 20, with eight of the remaining contractors in 2011 being newcomers compared to 2000. Health care service providers account for three of these new firms: Humana, TriWest Healthcare, and Health Net. The impact of mergers and acquisitions is also evident, as three of the top 20 contractors in 2000 were later acquired by Northrop Grumman: TRW, Litton, and Newport News Shipbuilding. Overall, the top 5 contractors’ share of the market has declined from 21 percent in 2000 to 19 percent in 2011, while the share held by the top 20 has increased from 35 percent in 2000 to 40 percent in 2011.
12

Notes on service codes: H (quality control, testing, and inspection services): primarily attributed to PAMS; exceptions are quality control, testing, and inspection services for ICT systems: communication equipment, fiber optics, and automated data processing equipment and supplies (classified as ICT). J (maintenance, repair, and rebuilding of equipment): primarily attributed to ERS; exceptions are maintenance, repair, and rebuilding services for ICT systems: communication equipment, fiber optics materials and components, and automated data processing equipment and supplies (classified as ICT). K (modification of equipment): primarily attributed to ERS; exceptions are modification services for ICT systems: communication equipment, fiber optics materials, and automated data processing equipment and supplies (classified as ICT). N (installation of equipment): primarily attributed to ERS; exceptions are installation services for ICT systems: communication equipment, fiber optics materials, and automated data processing equipment and supplies (classified as ICT). P (salvage services): demolition of buildings, structures, and facilities classified as FRS&C; disposal of surplus property, salvage of aircraft and marine vessels, as well as other salvage services (classified as ERS). S (utilities and housekeeping services): primarily attributed to FRS&C; exception is utility services for telephones and/or communications (classified as ICT). V (transportation, travel, and relocation services): freight and other transport services for things (listed under the V1** codes) classified as ERS; transport services for passengers (including ambulances, taxicabs, recruitment, lodging, navigational aid and pilotage service, listed under the V2** codes) relocation and travel agent services (listed under V3** codes) and “other listed under V999 code) classified as PAMS. W (lease or rental of equipment): primarily attributed to ERS; exceptions are lease and rental services for ICT systems: communication equipment, fiber optics materials, and automated data processing equipment and supplies (classified as ICT).
13

14