U.S. Crude Exports and Impact on Trade - Latest Oil ... · U.S. Crude Exports and Impact on ......
17
U.S. Crude Exports and Impact on Trade 32 nd Annual Asia Pacific Petroleum Conference Dr. Helen Currie Senior Economist September 7, 2016
Transcript of U.S. Crude Exports and Impact on Trade - Latest Oil ... · U.S. Crude Exports and Impact on ......
U.S. Crude Exports and Impact on Trade32nd Annual Asia Pacific Petroleum Conference
Dr. Helen Currie
Senior Economist
September 7, 2016
The following presentation includes forward-looking statements. These statements relate to future events, such as anticipated revenues, earnings, business strategies, competitive position or other aspects of our operations, operating results or the industries or markets in which we operate or participate in general. Actual outcomes and results may differ materially from what is expressed or forecast in such forward-looking statements. These statements are not guarantees of future performance and involve certain risks, uncertainties and assumptions that may prove to be incorrect and are difficult to predict such as oil and gas prices; operational hazards and drilling risks; potential failure to achieve, and potential delays in achieving expected reserves or production levels from existing and future oil and gas development projects; unsuccessful exploratory activities; unexpected cost increases or technical difficulties in constructing, maintaining or modifying company facilities; international monetary conditions and exchange controls; potential liability for remedial actions under existing or future environmental regulations or from pending or future litigation; limited access to capital or significantly higher cost of capital related to illiquidity or uncertainty in the domestic or international financial markets; general domestic and international economic and political conditions, as well as changes in tax, environmental and other laws applicable to ConocoPhillips’ business and other economic, business, competitive and/or regulatory factors affecting ConocoPhillips’ business generally as set forth in ConocoPhillips’ filings with the Securities and Exchange Commission (SEC). We caution you not to place undue reliance on our forward-looking statements, which are only as of the date of this presentation or as otherwise indicated, and we expressly disclaim any responsibility for updating such information.
Use of non-GAAP financial information – This presentation may include non-GAAP financial measures, which help facilitate comparison of company operating performance across periods and with peer companies. Any non-GAAP measures included herein will be accompanied by a reconciliation to the nearest corresponding GAAP measure on our website at www.conocophillips.com/nongaap.
Cautionary Note to U.S. Investors – The SEC permits oil and gas companies, in their filings with the SEC, to disclose only proved, probable and possible reserves. References in this presentation to “resources” include estimates of quantities of oil, natural gas liquids, natural gas and bitumen that are not classified as “proved reserves”, as defined in SEC regulations, and therefore this term represents a broader description of potentially recoverable volumes than SEC definitions of “probable” or “possible” reserves. Estimates of such unproved resources may change significantly as development provides additional data, and actual quantities that are ultimately recovered may differ substantially from prior estimates. For more information regarding our reserves as calculated pursuant to SEC rules, please read the oil and gas disclosures in our Form 10-K and other reports we file with the SEC. Copies are available from the SEC website and from the ConocoPhillips website.
Cautionary Statement
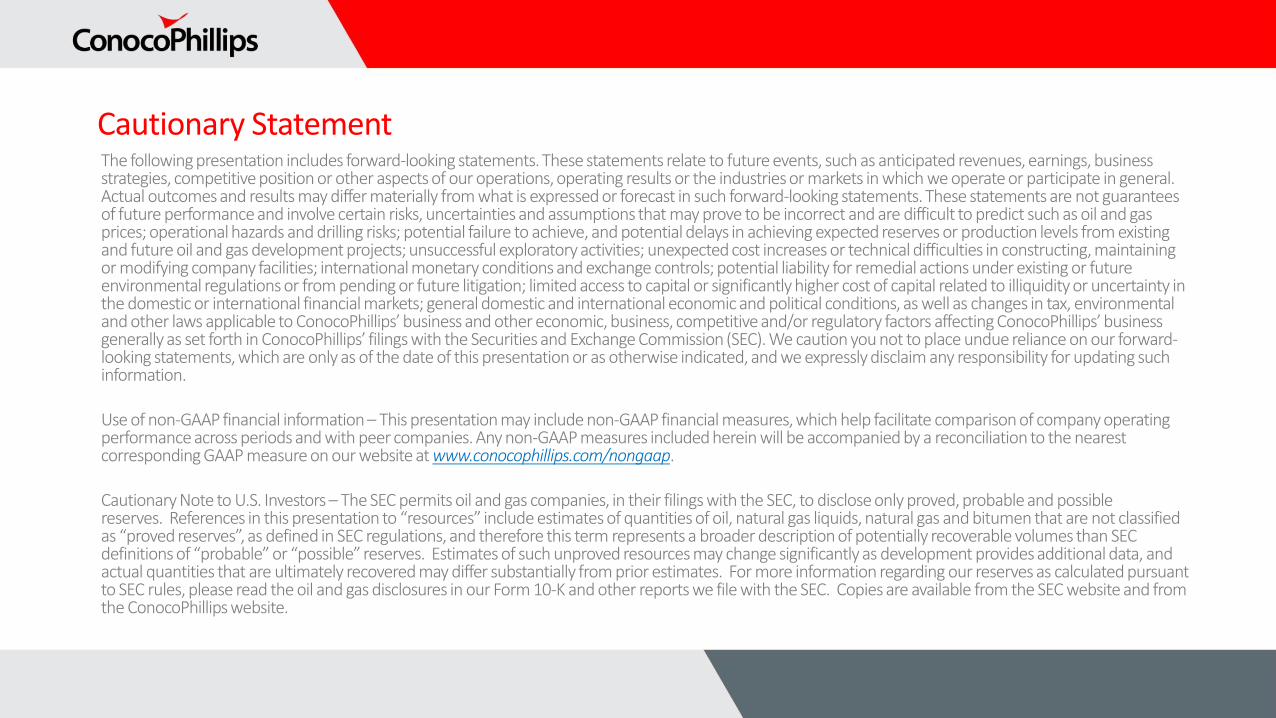
Worldwide Operations
As of June 30, 2016.
3
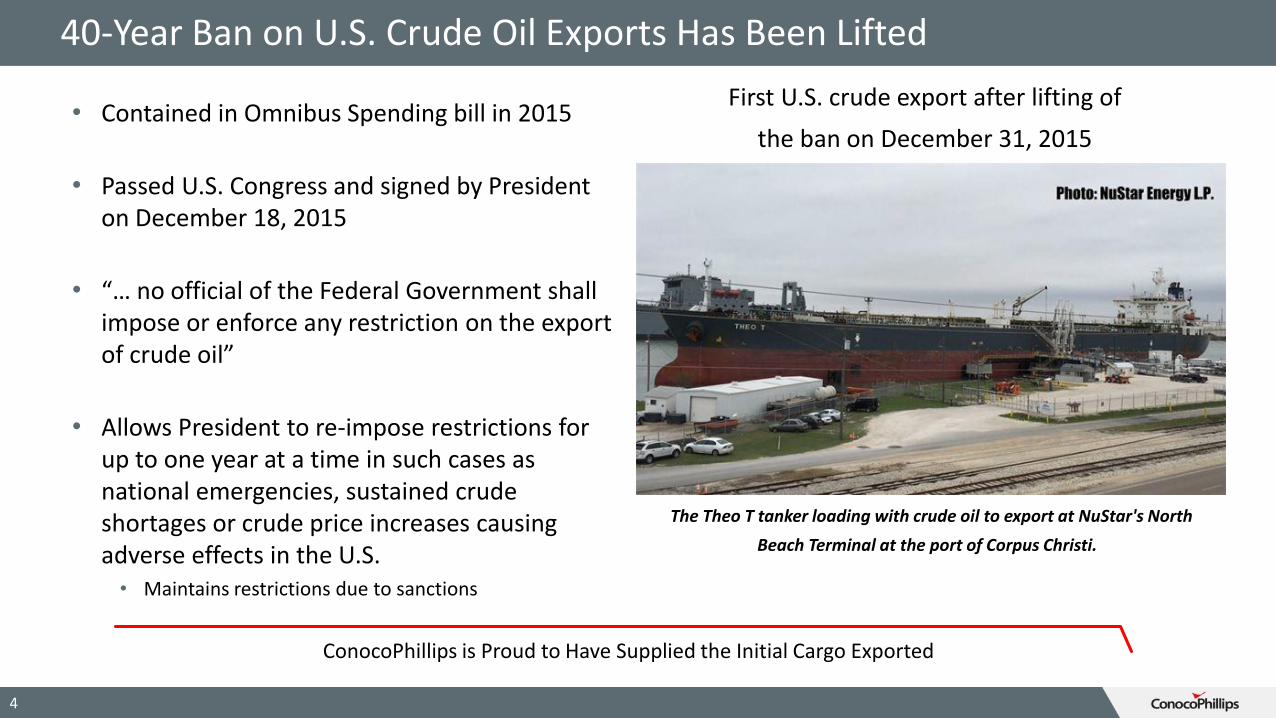
40-Year Ban on U.S. Crude Oil Exports Has Been Lifted
• Contained in Omnibus Spending bill in 2015
• Passed U.S. Congress and signed by President on December 18, 2015
• “… no official of the Federal Government shall impose or enforce any restriction on the export of crude oil”
• Allows President to re-impose restrictions for up to one year at a time in such cases as national emergencies, sustained crude shortages or crude price increases causing adverse effects in the U.S. • Maintains restrictions due to sanctions
The Theo T tanker loading with crude oil to export at NuStar's North
Beach Terminal at the port of Corpus Christi.
First U.S. crude export after lifting of
the ban on December 31, 2015
ConocoPhillips is Proud to Have Supplied the Initial Cargo Exported
4
0
2
4
6
8
10
12
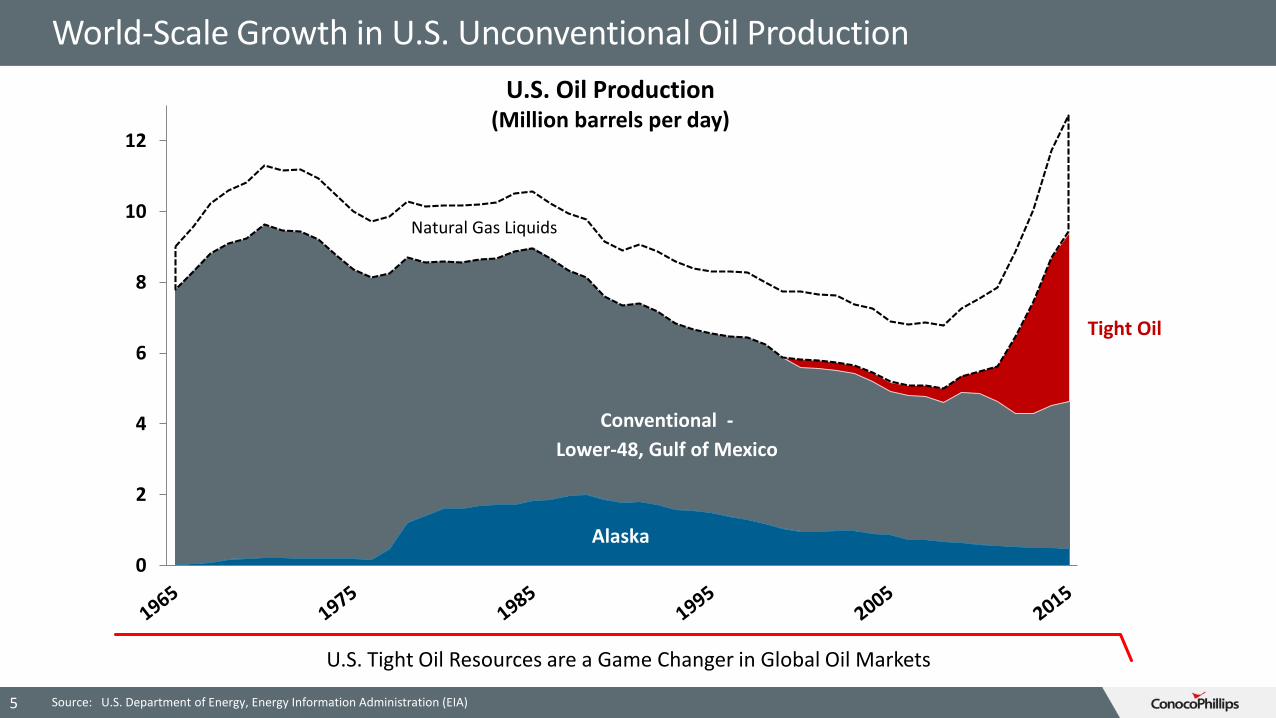
Conventional -
Lower-48, Gulf of Mexico
Tight Oil
Alaska
Natural Gas Liquids
World-Scale Growth in U.S. Unconventional Oil Production
Source: U.S. Department of Energy, Energy Information Administration (EIA)
U.S. Oil Production(Million barrels per day)
U.S. Tight Oil Resources are a Game Changer in Global Oil Markets
5
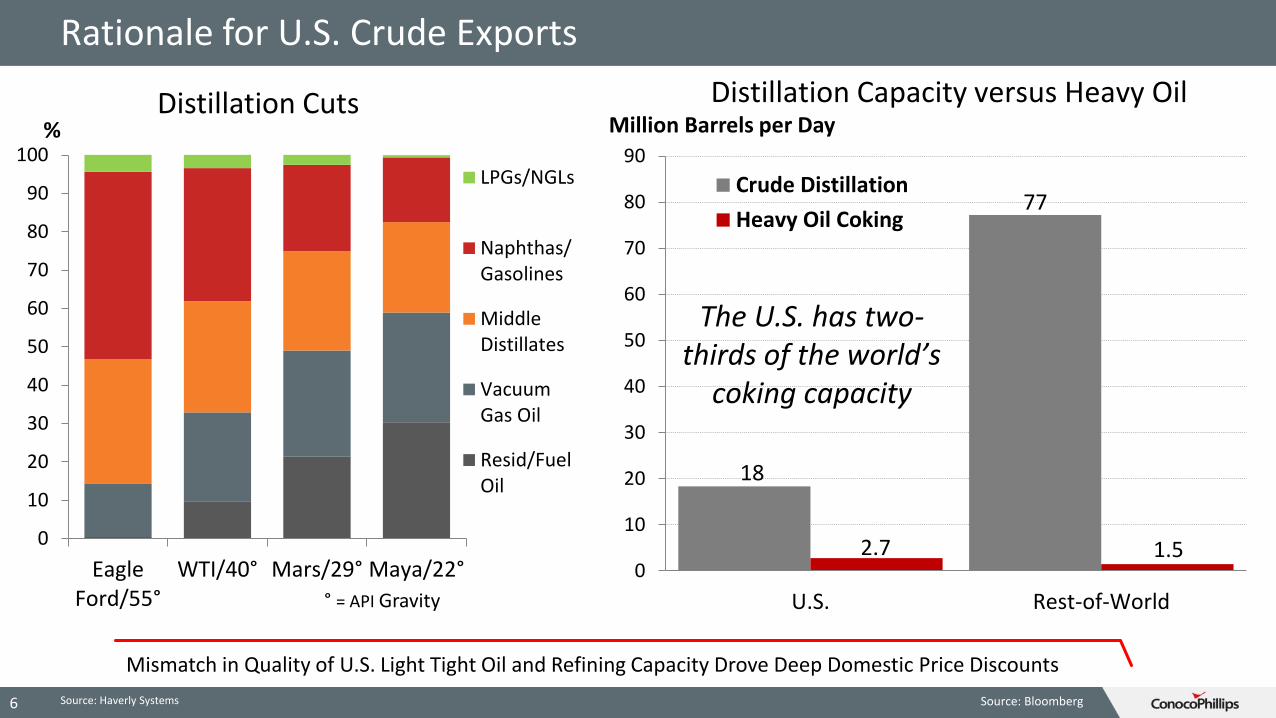
Mismatch in Quality of U.S. Light Tight Oil and Refining Capacity Drove Deep Domestic Price Discounts
6
18
77
2.7 1.50
10
20
30
40
50
60
70
80
90
U.S. Rest-of-World
Crude Distillation
Heavy Oil Coking
Distillation Capacity versus Heavy Oil
The U.S. has two-thirds of the world’s
coking capacity
Million Barrels per Day
Source: Bloomberg
0
10
20
30
40
50
60
70
80
90
100
EagleFord/55°
WTI/40° Mars/29° Maya/22°
%
LPGs/NGLs
Naphthas/Gasolines
MiddleDistillates
VacuumGas Oil
Resid/FuelOil
° = API Gravity
Distillation Cuts
Source: Haverly Systems
Rationale for U.S. Crude Exports

($10)
($5)
$0
$5
$10
$15
$20
$25
$30
$0
$20
$40
$60
$80
$100
$120
$140
$160
2000 2002 2004 2006 2008 2010 2012 2014 2016
Brent and WTI Prices and Spread ($/Bbl)
Brent Price
WTI Price
Lines, Left Axis Area, Right Axis
Brent-WTI Spread
U.S. Oil Price Discount To Global Prices
7 Source: U.S. Energy Information Administration, Short Term Energy Outlook July 2016
Growth in U.S. Production Inverted the Brent-WTI Price Spread
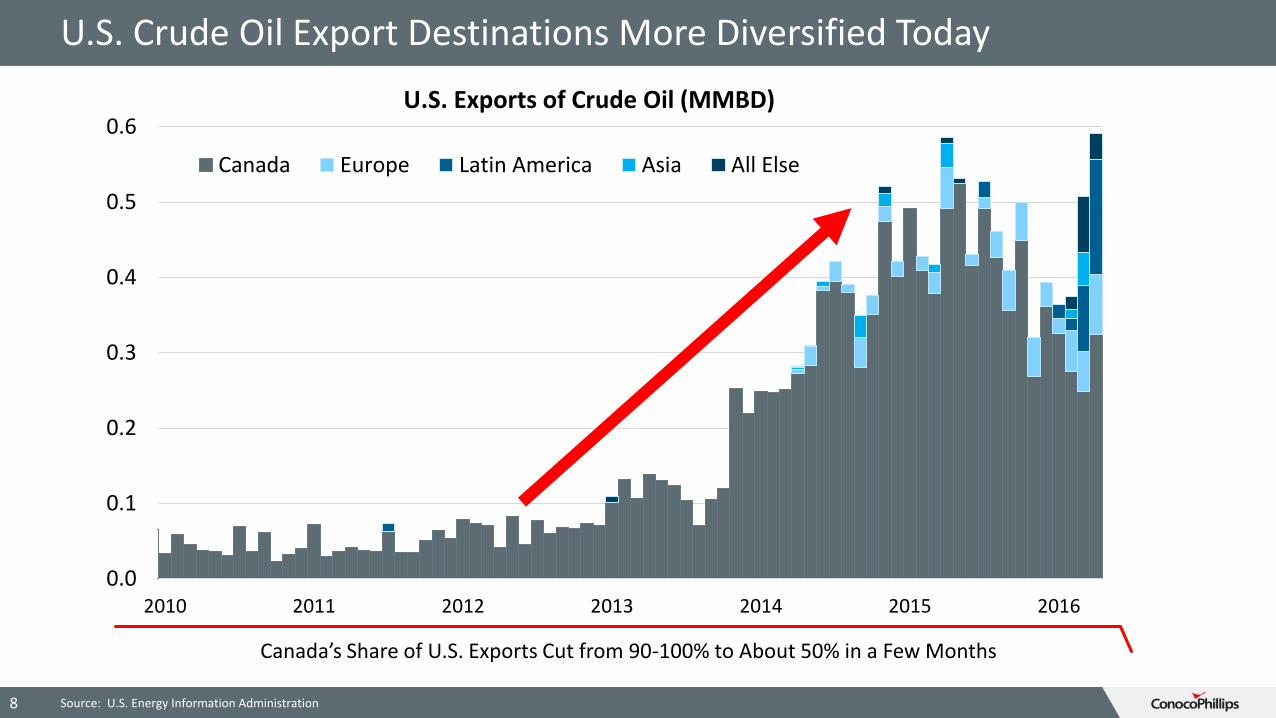
U.S. Crude Oil Export Destinations More Diversified Today
0.0
0.1
0.2
0.3
0.4
0.5
0.6
2010 2011 2012 2013 2014 2015 2016
Canada Europe Latin America Asia All Else
U.S. Exports of Crude Oil (MMBD)
8 Source: U.S. Energy Information Administration
Canada’s Share of U.S. Exports Cut from 90-100% to About 50% in a Few Months

New Refining Centers in Asia and Middle East
Source: IHS Energy. The use of this content was authorized in advance by IHS Markit. Any further use or redistribution of this content is strictly prohibited without written permission by IHS. All rights reserved.
9
U.S. Exports Help to Balance Eastward Shift in Global Refining Capacity
0%
10%
20%
30%
40% North America
0%
10%
20%
30%
40% Europe
0%
10%
20%
30%
40% Asia Pacific
0%
10%
20%
30%
40% Middle East
0%
10%
20%
30%
40% CIS
0%
10%
20%
30%
40% Latin America
0%
10%
20%
30%
40%Africa
201520252035
% Share of Global Refining Capacity
Source: U.S. Department of Energy, EIA, Short Term Energy Outlook
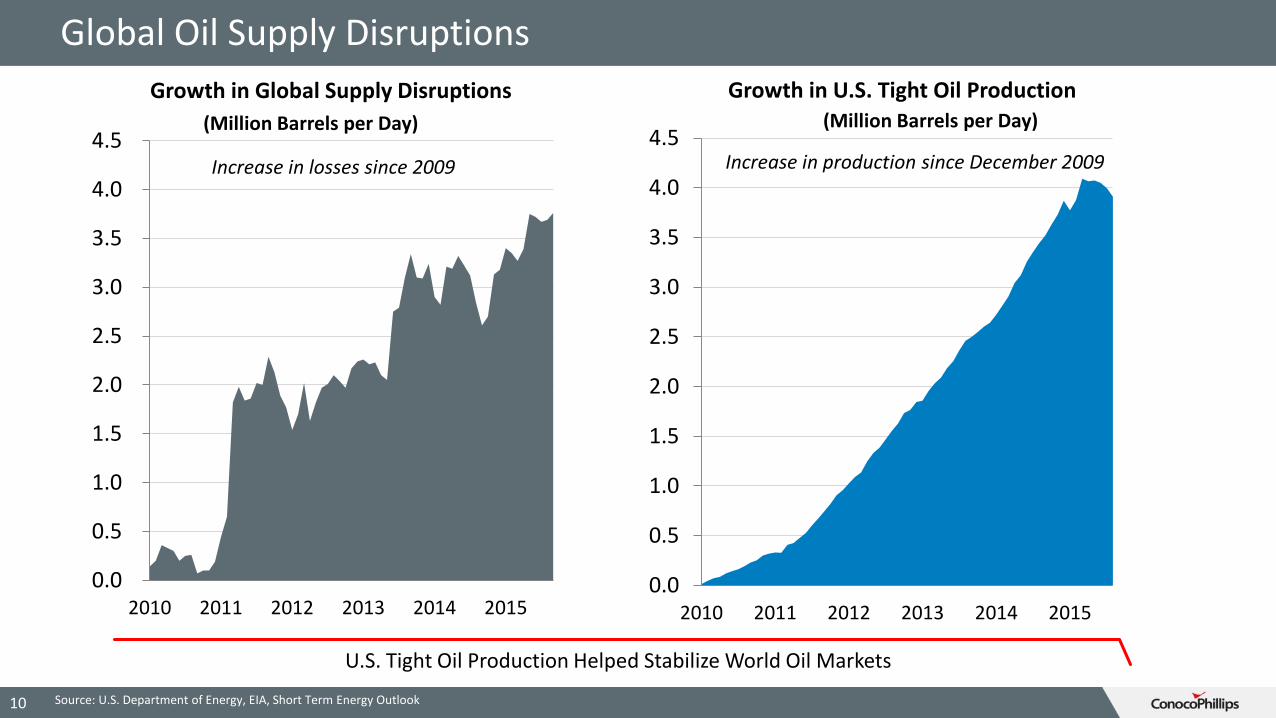
0.0
0.5
1.0
1.5
2.0
2.5
3.0
3.5
4.0
4.5
2010 2011 2012 2013 2014 2015
Growth in U.S. Tight Oil Production
Increase in production since December 2009
0.0
0.5
1.0
1.5
2.0
2.5
3.0
3.5
4.0
4.5
2010 2011 2012 2013 2014 2015
Growth in Global Supply Disruptions
Increase in losses since 2009
(Million Barrels per Day) (Million Barrels per Day)
10
Global Oil Supply Disruptions
U.S. Tight Oil Production Helped Stabilize World Oil Markets
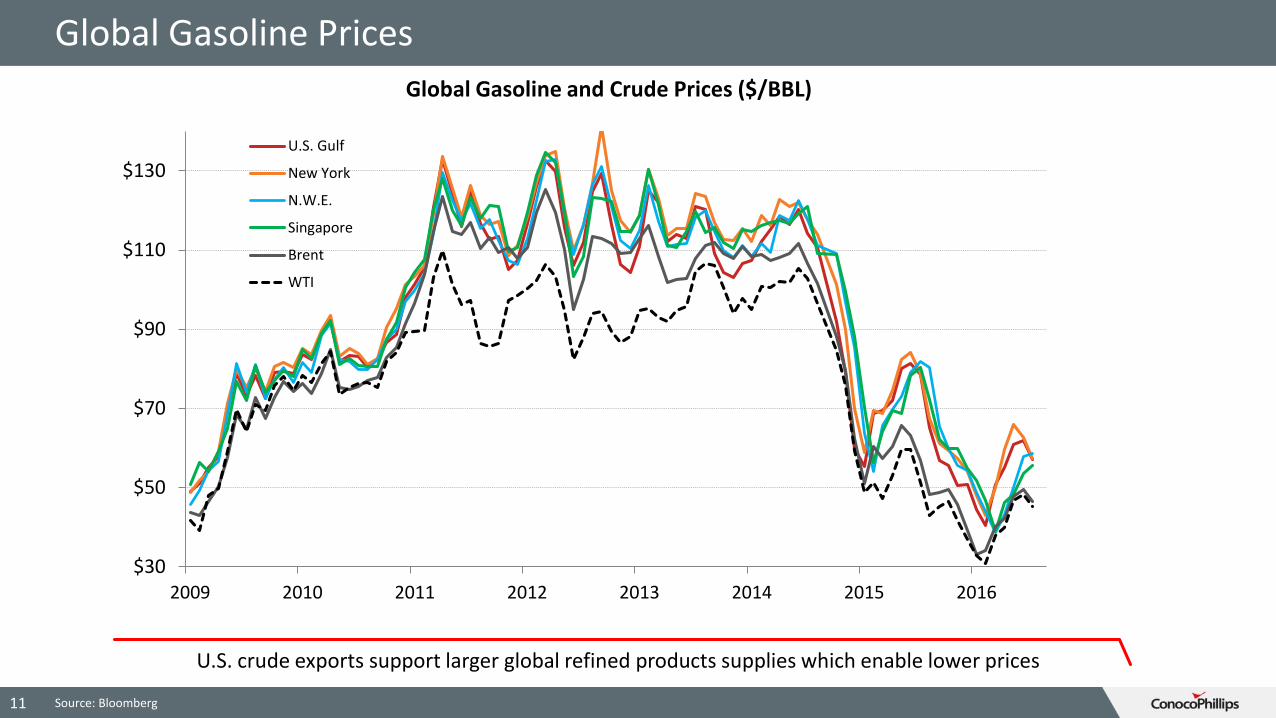
Global Gasoline Prices
$30
$50
$70
$90
$110
$130
2009 2010 2011 2012 2013 2014 2015 2016
U.S. Gulf
New York
N.W.E.
Singapore
Brent
WTI
11
Global Gasoline and Crude Prices ($/BBL)
Source: Bloomberg
U.S. crude exports support larger global refined products supplies which enable lower prices
12
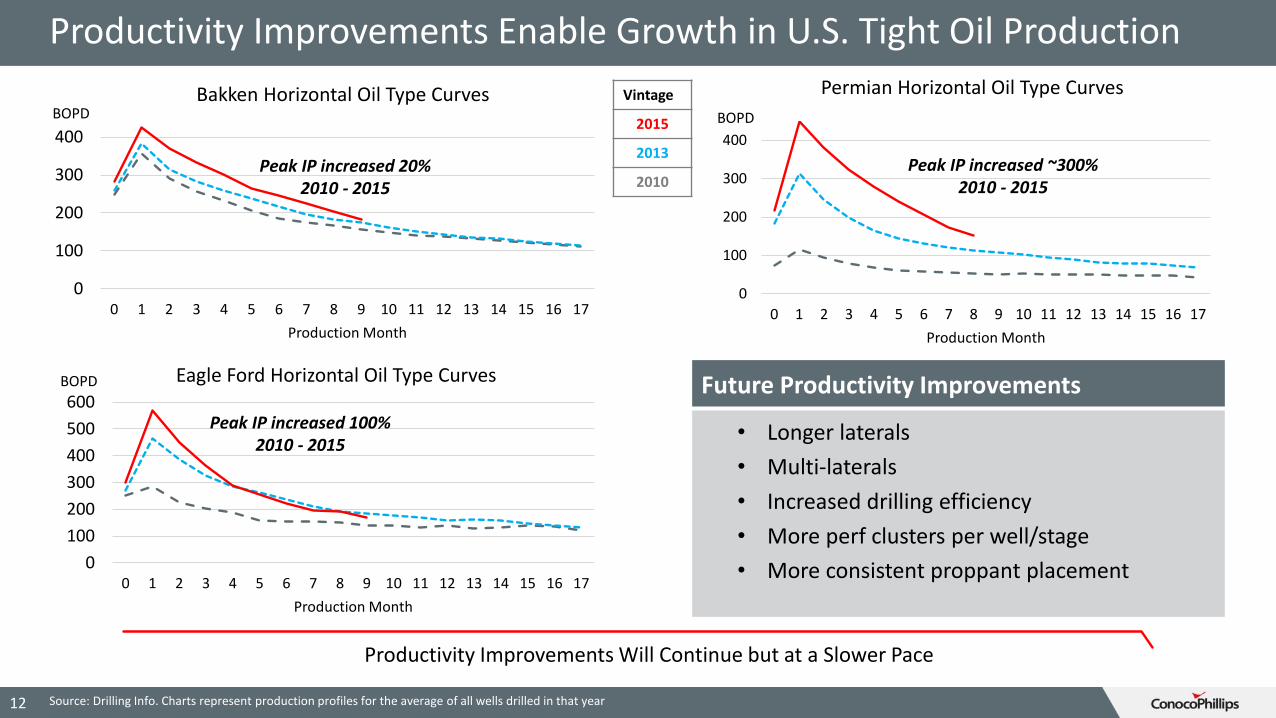
Productivity Improvements Enable Growth in U.S. Tight Oil Production
0
100
200
300
400
0 1 2 3 4 5 6 7 8 9 10 11 12 13 14 15 16 17
BOPD
Production Month
Bakken Horizontal Oil Type Curves
Peak IP increased 20% 2010 - 2015
0
100
200
300
400
0 1 2 3 4 5 6 7 8 9 10 11 12 13 14 15 16 17
BOPD
Production Month
Permian Horizontal Oil Type Curves
Peak IP increased ~300% 2010 - 2015
0
100
200
300
400
500
600
0 1 2 3 4 5 6 7 8 9 10 11 12 13 14 15 16 17
BOPD
Production Month
Eagle Ford Horizontal Oil Type Curves
Peak IP increased 100% 2010 - 2015
Vintage
2015
2013
2010
Productivity Improvements Will Continue but at a Slower Pace
Future Productivity Improvements
• Longer laterals
• Multi-laterals
• Increased drilling efficiency
• More perf clusters per well/stage
• More consistent proppant placement
Source: Drilling Info. Charts represent production profiles for the average of all wells drilled in that year
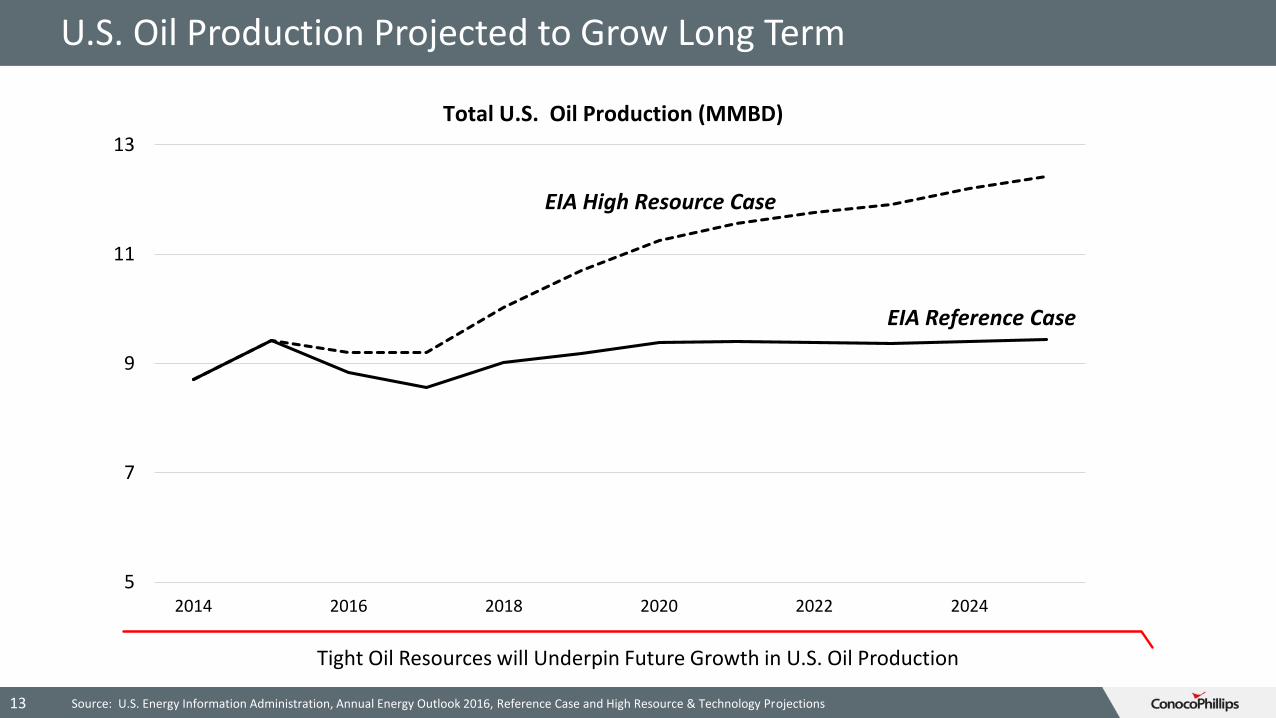
U.S. Oil Production Projected to Grow Long Term
5
7
9
11
13
2014 2016 2018 2020 2022 2024
Tight Oil
Total U.S. Oil Production (MMBD)
EIA High Resource Case
EIA Reference Case
13 Source: U.S. Energy Information Administration, Annual Energy Outlook 2016, Reference Case and High Resource & Technology Projections
Tight Oil Resources will Underpin Future Growth in U.S. Oil Production
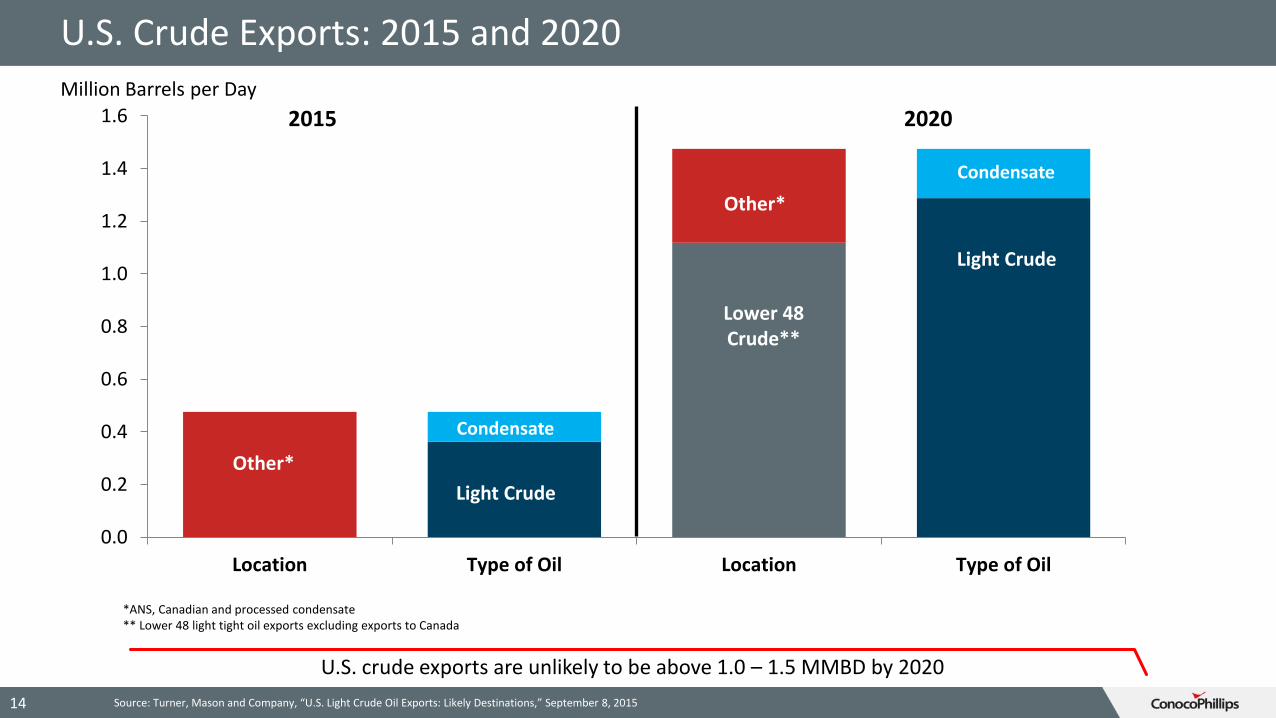
U.S. Crude Exports: 2015 and 2020
0.0
0.2
0.4
0.6
0.8
1.0
1.2
1.4
1.6
Location Type of Oil Location Type of Oil
14
2015 2020
Million Barrels per Day
Other*
Other*
Lower 48Crude**
*ANS, Canadian and processed condensate** Lower 48 light tight oil exports excluding exports to Canada
Source: Turner, Mason and Company, “U.S. Light Crude Oil Exports: Likely Destinations,” September 8, 2015
Light Crude
Light Crude
Condensate
Condensate
U.S. crude exports are unlikely to be above 1.0 – 1.5 MMBD by 2020
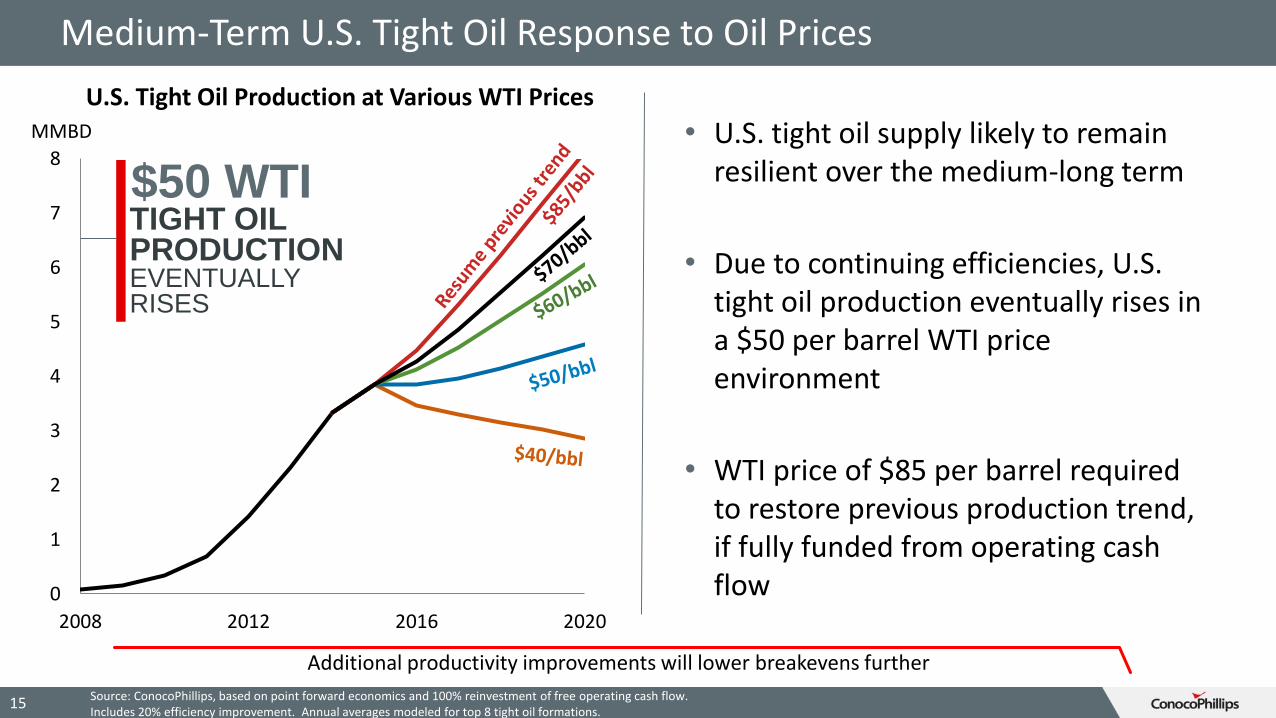
Medium-Term U.S. Tight Oil Response to Oil Prices
0
1
2
3
4
5
6
7
8
2008 2012 2016 2020
Source: ConocoPhillips, based on point forward economics and 100% reinvestment of free operating cash flow. Includes 20% efficiency improvement. Annual averages modeled for top 8 tight oil formations.
U.S. Tight Oil Production at Various WTI PricesMMBD • U.S. tight oil supply likely to remain
resilient over the medium-long term
• Due to continuing efficiencies, U.S. tight oil production eventually rises in a $50 per barrel WTI price environment
• WTI price of $85 per barrel required to restore previous production trend, if fully funded from operating cash flow
$50 WTITIGHT OIL PRODUCTIONEVENTUALLYRISES
Additional productivity improvements will lower breakevens further
15
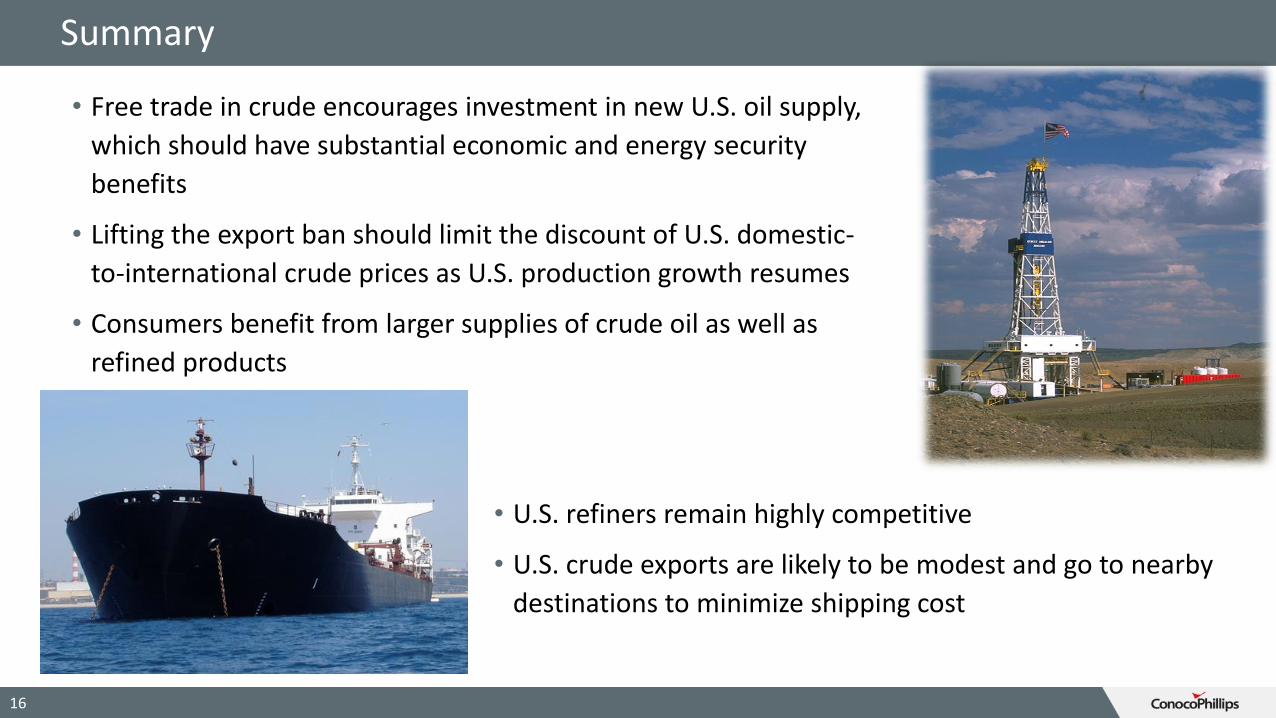
Summary
• Free trade in crude encourages investment in new U.S. oil supply,
which should have substantial economic and energy security
benefits
• Lifting the export ban should limit the discount of U.S. domestic-
to-international crude prices as U.S. production growth resumes
• Consumers benefit from larger supplies of crude oil as well as
refined products
16
• U.S. refiners remain highly competitive
• U.S. crude exports are likely to be modest and go to nearby
destinations to minimize shipping cost
Thank You