US corn drops on Argentine rain, drags wheat lowers3.amazonaws.com/zanran_storage/ fileCBOT March...
21
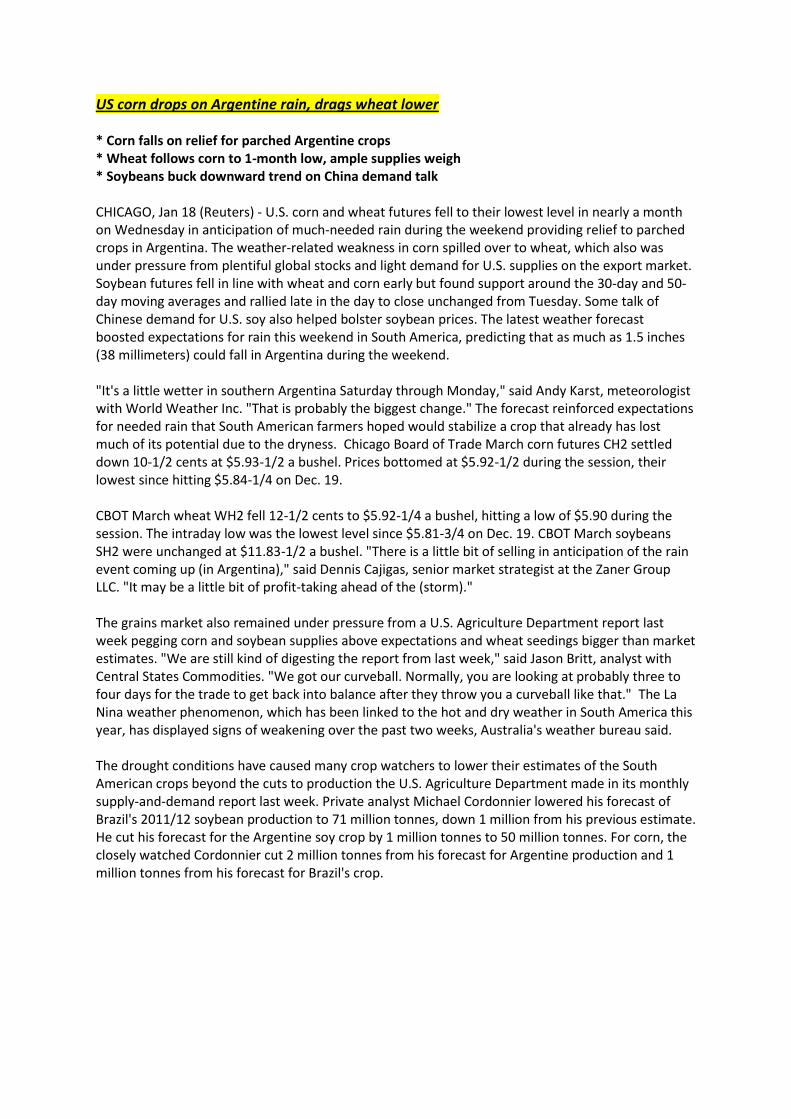
US corn drops on Argentine rain, drags wheat lower * Corn falls on relief for parched Argentine crops * Wheat follows corn to 1-month low, ample supplies weigh * Soybeans buck downward trend on China demand talk CHICAGO, Jan 18 (Reuters) - U.S. corn and wheat futures fell to their lowest level in nearly a month on Wednesday in anticipation of much-needed rain during the weekend providing relief to parched crops in Argentina. The weather-related weakness in corn spilled over to wheat, which also was under pressure from plentiful global stocks and light demand for U.S. supplies on the export market. Soybean futures fell in line with wheat and corn early but found support around the 30-day and 50- day moving averages and rallied late in the day to close unchanged from Tuesday. Some talk of Chinese demand for U.S. soy also helped bolster soybean prices. The latest weather forecast boosted expectations for rain this weekend in South America, predicting that as much as 1.5 inches (38 millimeters) could fall in Argentina during the weekend. "It's a little wetter in southern Argentina Saturday through Monday," said Andy Karst, meteorologist with World Weather Inc. "That is probably the biggest change." The forecast reinforced expectations for needed rain that South American farmers hoped would stabilize a crop that already has lost much of its potential due to the dryness. Chicago Board of Trade March corn futures CH2 settled down 10-1/2 cents at $5.93-1/2 a bushel. Prices bottomed at $5.92-1/2 during the session, their lowest since hitting $5.84-1/4 on Dec. 19. CBOT March wheat WH2 fell 12-1/2 cents to $5.92-1/4 a bushel, hitting a low of $5.90 during the session. The intraday low was the lowest level since $5.81-3/4 on Dec. 19. CBOT March soybeans SH2 were unchanged at $11.83-1/2 a bushel. "There is a little bit of selling in anticipation of the rain event coming up (in Argentina)," said Dennis Cajigas, senior market strategist at the Zaner Group LLC. "It may be a little bit of profit-taking ahead of the (storm)." The grains market also remained under pressure from a U.S. Agriculture Department report last week pegging corn and soybean supplies above expectations and wheat seedings bigger than market estimates. "We are still kind of digesting the report from last week," said Jason Britt, analyst with Central States Commodities. "We got our curveball. Normally, you are looking at probably three to four days for the trade to get back into balance after they throw you a curveball like that." The La Nina weather phenomenon, which has been linked to the hot and dry weather in South America this year, has displayed signs of weakening over the past two weeks, Australia's weather bureau said. The drought conditions have caused many crop watchers to lower their estimates of the South American crops beyond the cuts to production the U.S. Agriculture Department made in its monthly supply-and-demand report last week. Private analyst Michael Cordonnier lowered his forecast of Brazil's 2011/12 soybean production to 71 million tonnes, down 1 million from his previous estimate. He cut his forecast for the Argentine soy crop by 1 million tonnes to 50 million tonnes. For corn, the closely watched Cordonnier cut 2 million tonnes from his forecast for Argentine production and 1 million tonnes from his forecast for Brazil's crop.
Transcript of US corn drops on Argentine rain, drags wheat lowers3.amazonaws.com/zanran_storage/ fileCBOT March...
US corn drops on Argentine rain, drags wheat lower * Corn falls on relief for parched Argentine crops * Wheat follows corn to 1-month low, ample supplies weigh * Soybeans buck downward trend on China demand talk CHICAGO, Jan 18 (Reuters) - U.S. corn and wheat futures fell to their lowest level in nearly a month on Wednesday in anticipation of much-needed rain during the weekend providing relief to parched crops in Argentina. The weather-related weakness in corn spilled over to wheat, which also was under pressure from plentiful global stocks and light demand for U.S. supplies on the export market. Soybean futures fell in line with wheat and corn early but found support around the 30-day and 50-day moving averages and rallied late in the day to close unchanged from Tuesday. Some talk of Chinese demand for U.S. soy also helped bolster soybean prices. The latest weather forecast boosted expectations for rain this weekend in South America, predicting that as much as 1.5 inches (38 millimeters) could fall in Argentina during the weekend. "It's a little wetter in southern Argentina Saturday through Monday," said Andy Karst, meteorologist with World Weather Inc. "That is probably the biggest change." The forecast reinforced expectations for needed rain that South American farmers hoped would stabilize a crop that already has lost much of its potential due to the dryness. Chicago Board of Trade March corn futures CH2 settled down 10-1/2 cents at $5.93-1/2 a bushel. Prices bottomed at $5.92-1/2 during the session, their lowest since hitting $5.84-1/4 on Dec. 19. CBOT March wheat WH2 fell 12-1/2 cents to $5.92-1/4 a bushel, hitting a low of $5.90 during the session. The intraday low was the lowest level since $5.81-3/4 on Dec. 19. CBOT March soybeans SH2 were unchanged at $11.83-1/2 a bushel. "There is a little bit of selling in anticipation of the rain event coming up (in Argentina)," said Dennis Cajigas, senior market strategist at the Zaner Group LLC. "It may be a little bit of profit-taking ahead of the (storm)." The grains market also remained under pressure from a U.S. Agriculture Department report last week pegging corn and soybean supplies above expectations and wheat seedings bigger than market estimates. "We are still kind of digesting the report from last week," said Jason Britt, analyst with Central States Commodities. "We got our curveball. Normally, you are looking at probably three to four days for the trade to get back into balance after they throw you a curveball like that." The La Nina weather phenomenon, which has been linked to the hot and dry weather in South America this year, has displayed signs of weakening over the past two weeks, Australia's weather bureau said. The drought conditions have caused many crop watchers to lower their estimates of the South American crops beyond the cuts to production the U.S. Agriculture Department made in its monthly supply-and-demand report last week. Private analyst Michael Cordonnier lowered his forecast of Brazil's 2011/12 soybean production to 71 million tonnes, down 1 million from his previous estimate. He cut his forecast for the Argentine soy crop by 1 million tonnes to 50 million tonnes. For corn, the closely watched Cordonnier cut 2 million tonnes from his forecast for Argentine production and 1 million tonnes from his forecast for Brazil's crop.
Rudi Swanepoel
Tel: 011-787 3666 Morning Agricultural Market Report
Fax: 011-787 3710
www.farmwise.co.za
CME Corn Mar'12 593 1/2 -10 1/2 596 3/4 3 1/4
CME Corn May'12 600 1/4 -10 1/2 603 1/4 3
CME Corn July'12 604 3/4 -11 608 3 1/4
CME Corn Sep'12 569 3/4 -11 3/4 571 1/2 1 3/4
CME Corn Dec'12 548 3/4 -8 3/4 551 2 1/4
CME Corn Mar'13 561 1/4 -9 3/4 0 0
CME Corn July'13 573 1/4 -10 1/2 575 1 3/4
Gold 06:56 1657.05 Rand/Pound 06:55 12.294
Brent Crude 06:56 111.69 Rand/Euro 06:55 10.2606
Rand/Dollar 07:05 7.958 Dollar/Euro 07:00 12858
Jan Jan Dec Jan
USDA USDA USDA USDA
09-10 10-11 11-12 11-12
86.4 88.2 91.9 91.9
79.5 81.4 83.9 84.0
164.7 152.8 146.7 147.2
1673 1708 1128 1128
13092 12447 12310 12358
8 28 15 15
14774 14182 13453 13501
5125 4793 4600 4600
5961 6428 6405 6405
4591 5021 5000 5000
11086 11220 11005 11005
1980 1835 1600 1650
13066 13055 12605 12655
1708 1128 848 846
13.1% 8.6% 6.7% 6.7%
19 January 2012
US CORN RECAP
CME CORN FUTURES
Net
Change
CME CORN FUTURES MARKET RECAP
Future
Month
Commodity
LATEST SPOT PRICES
US CORN SUPPLY & DEMAND PROJECTION (M/Bu)
Total Supply
Harvested Acres
(M Acres)
Initial Stocks(M/Bu)
Imports
CME MAR'12 CORN - HOURLY SNAPSHOT
Planting Acres
Exports
Total Domestic
Ethanol
Yield (Bu / Acre)
Ending Stocks
Stks/Use Ratio
Production
Total Usage
Net
Change
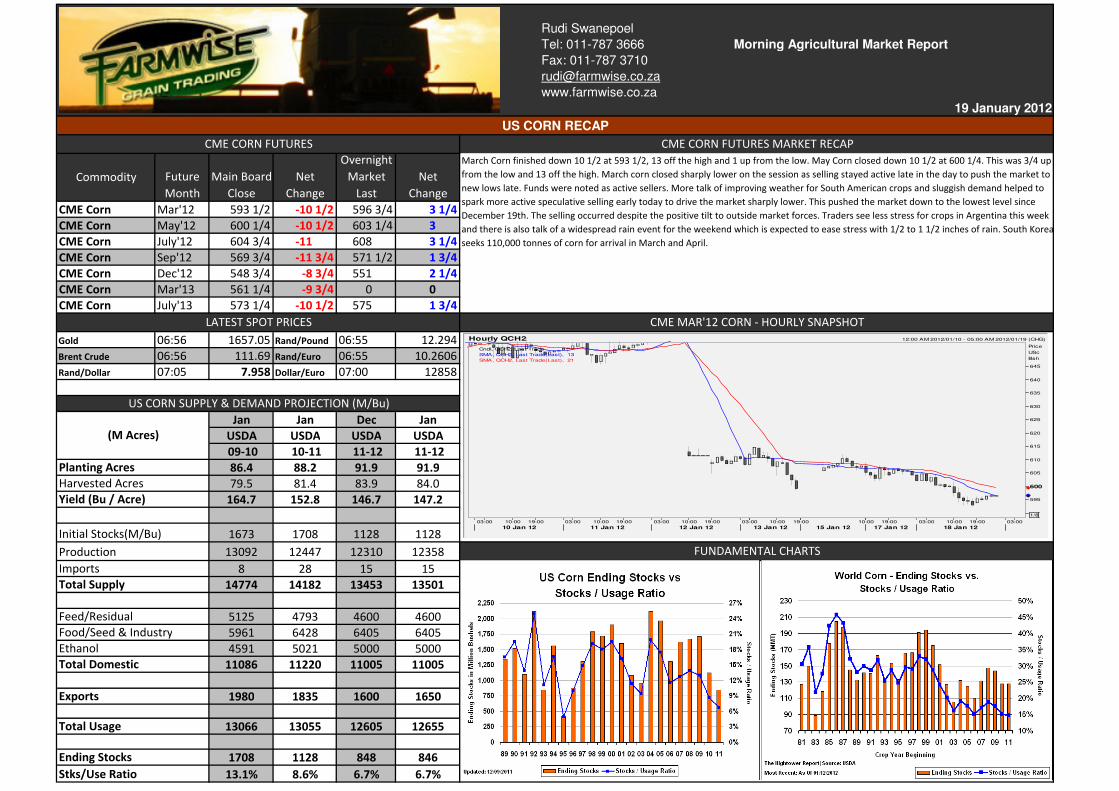
March Corn finished down 10 1/2 at 593 1/2, 13 off the high and 1 up from the low. May Corn closed down 10 1/2 at 600 1/4. This was 3/4 up
from the low and 13 off the high. March corn closed sharply lower on the session as selling stayed active late in the day to push the market to
new lows late. Funds were noted as active sellers. More talk of improving weather for South American crops and sluggish demand helped to
spark more active speculative selling early today to drive the market sharply lower. This pushed the market down to the lowest level since
December 19th. The selling occurred despite the positive tilt to outside market forces. Traders see less stress for crops in Argentina this week
and there is also talk of a widespread rain event for the weekend which is expected to ease stress with 1/2 to 1 1/2 inches of rain. South Korea
seeks 110,000 tonnes of corn for arrival in March and April.
Overnight
Market
Last
Main Board
Close
FUNDAMENTAL CHARTS
Feed/Residual
Food/Seed & Industry
Hourly QCH2 12:00 AM 2012/01/10 - 05:00 AM 2012/01/19 (CHG)
Cndl, QCH2, Last Trade
SMA, QCH2, Last Trade(Last), 13
SMA, QCH2, Last Trade(Last), 21
Price
USc
Bsh
1/8
595
600
605
610
615
620
625
630
635
640
645
03:00 10:00 19:00 03:00 10:00 19:00 03:00 10:00 19:00 03:00 10:00 19:00 10:00 19:00 03:00 10:00 19:00 03:00
10 Jan 12 11 Jan 12 12 Jan 12 13 Jan 12 15 Jan 12 17 Jan 12 18 Jan 12
Mar'12 May'12 July'12 Sep'12 Dec'12 Mar'13
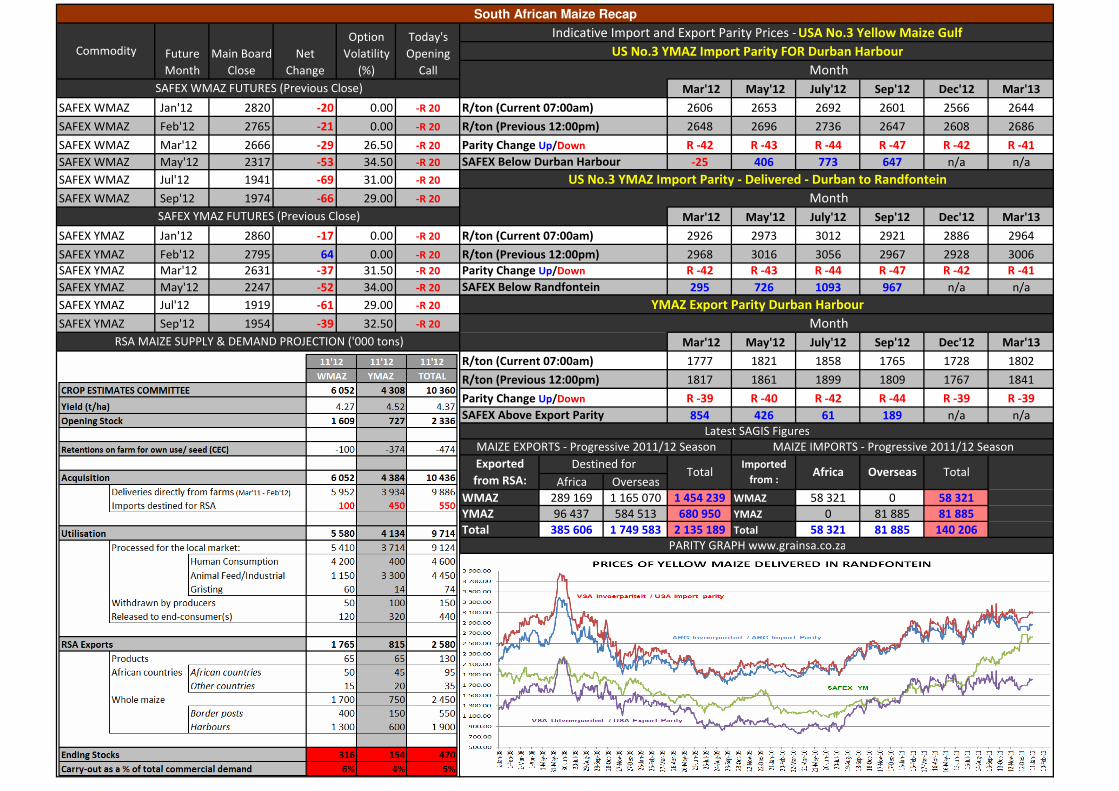
SAFEX WMAZ Jan'12 2820 -20 0.00 -R 20 2606 2653 2692 2601 2566 2644
SAFEX WMAZ Feb'12 2765 -21 0.00 -R 20 2648 2696 2736 2647 2608 2686
SAFEX WMAZ Mar'12 2666 -29 26.50 -R 20 R -42 R -43 R -44 R -47 R -42 R -41
SAFEX WMAZ May'12 2317 -53 34.50 -R 20 -25 406 773 647 n/a n/a
SAFEX WMAZ Jul'12 1941 -69 31.00 -R 20
SAFEX WMAZ Sep'12 1974 -66 29.00 -R 20
Mar'12 May'12 July'12 Sep'12 Dec'12 Mar'13
SAFEX YMAZ Jan'12 2860 -17 0.00 -R 20 2926 2973 3012 2921 2886 2964
SAFEX YMAZ Feb'12 2795 64 0.00 -R 20 2968 3016 3056 2967 2928 3006
SAFEX YMAZ Mar'12 2631 -37 31.50 -R 20 R -42 R -43 R -44 R -47 R -42 R -41
SAFEX YMAZ May'12 2247 -52 34.00 -R 20 295 726 1093 967 n/a n/a
SAFEX YMAZ Jul'12 1919 -61 29.00 -R 20
SAFEX YMAZ Sep'12 1954 -39 32.50 -R 20
Mar'12 May'12 July'12 Sep'12 Dec'12 Mar'13
1777 1821 1858 1765 1728 1802
1817 1861 1899 1809 1767 1841
R -39 R -40 R -42 R -44 R -39 R -39
854 426 61 189 n/a n/a
Africa Overseas
WMAZ 289 169 1 165 070 1 454 239 WMAZ 58 321 0 58 321
YMAZ 96 437 584 513 680 950 YMAZ 0 81 885 81 885
Total 385 606 1 749 583 2 135 189 Total 58 321 81 885 140 206
Overseas TotalImported
from :
Exported
from RSA:
PARITY GRAPH www.grainsa.co.za
Africa
R/ton (Previous 12:00pm)
Destined forTotal
Parity Change Up/Down
SAFEX Above Export Parity
Latest SAGIS Figures
MAIZE EXPORTS - Progressive 2011/12 Season MAIZE IMPORTS - Progressive 2011/12 Season
SAFEX WMAZ FUTURES (Previous Close)
South African Maize Recap
Future
Month
Commodity Main Board
Close
R/ton (Current 07:00am)
R/ton (Current 07:00am)
Net
Change
Option
Volatility
(%) Month
YMAZ Export Parity Durban Harbour
Parity Change Up/Down
R/ton (Previous 12:00pm)
R/ton (Current 07:00am)
SAFEX Below Durban Harbour
SAFEX YMAZ FUTURES (Previous Close)
Today's
Opening
Call
Month
SAFEX Below Randfontein
US No.3 YMAZ Import Parity FOR Durban Harbour
Indicative Import and Export Parity Prices - USA No.3 Yellow Maize Gulf
RSA MAIZE SUPPLY & DEMAND PROJECTION ('000 tons)
US No.3 YMAZ Import Parity - Delivered - Durban to Randfontein
R/ton (Previous 12:00pm)
Month
Parity Change Up/Down
CME Soybeans Mar'12 1183 1/2 0 1185 1 1/2
CME Soybeans May'12 1192 1/4 - 1/4 1193 3/4
CME Soybeans July'12 1201 1/4 - 3/4 1201 1/4 0
CME Soybeans Sep'12 1192 -2 1189 1/2 -2 1/2
CME Soybeans Nov'12 1186 -3 1184 1/2 -1 1/2
CME Soybeans Jan'13 1195 -3 1/2 1194 3/4 - 1/4
CME Soy Meal Mar'12 312.00 1.50 311.90 -0.10
CME Soy Meal May'12 314.10 1.00 314.00 -0.10
CME Soy Meal July'12 316.60 0.40 316.30 -0.30
CME Soy Meal Sep'12 315.60 -0.20 314.80 -0.80
CME Soy Meal Oct'12 311.90 -0.40 310.90 -1.00
CME Soy Meal Dec'12 311.50 -0.50 309.80 -1.70
CME Soybean Oil Mar'12 50.40 -0.37 50.55 0.15
CME Soybean Oil May'12 50.83 -0.36 50.93 0.10
CME Soybean Oil July'12 51.20 -0.35 51.27 0.07
CME Soybean Oil Sep'12 51.42 -0.33 51.46 0.04
CME Soybean Oil Oct'12 51.45 -0.37 0.00 0.00
CME Soybean Oil Dec'12 51.57 -0.40 51.62 0.05
Jan Jan Dec Jan
USDA USDA USDA USDA
09-10 10-11 11-12 11-12
77.5 77.4 75 75
76.4 76.6 73.7 73.6
44 43.5 41.3 41.5
138 151 215 215
3359 3329 3046 3056
15 14 15 15
3512 3495 3275 3286
1752 1648 1625 1615
1499 1501 1300 1275
110 130 120 120
3361 3280 3045 3011
151 215 230 275
4.5% 6.6% 7.6% 9.1%
Future
Month
CME SOYBEAN OIL FUTURES
CME SOYBEAN FUTURES
Stks/Use Ratio
Exports
Use, Total
Ending Stocks
Harvested Acres
US SOYBEAN SUPPLY & DEMAND PROJECTION
(M Acres)
Seed/Residual
Planting Acres
Yield (Bu / Acre)
FUNDAMENTAL CHARTS
Main Board
Close
CME SOY FUTURES MARKET RECAPOvernight
Market
Last
CME MAR'12 SOYBEAN - HOURLY SNAPSHOT
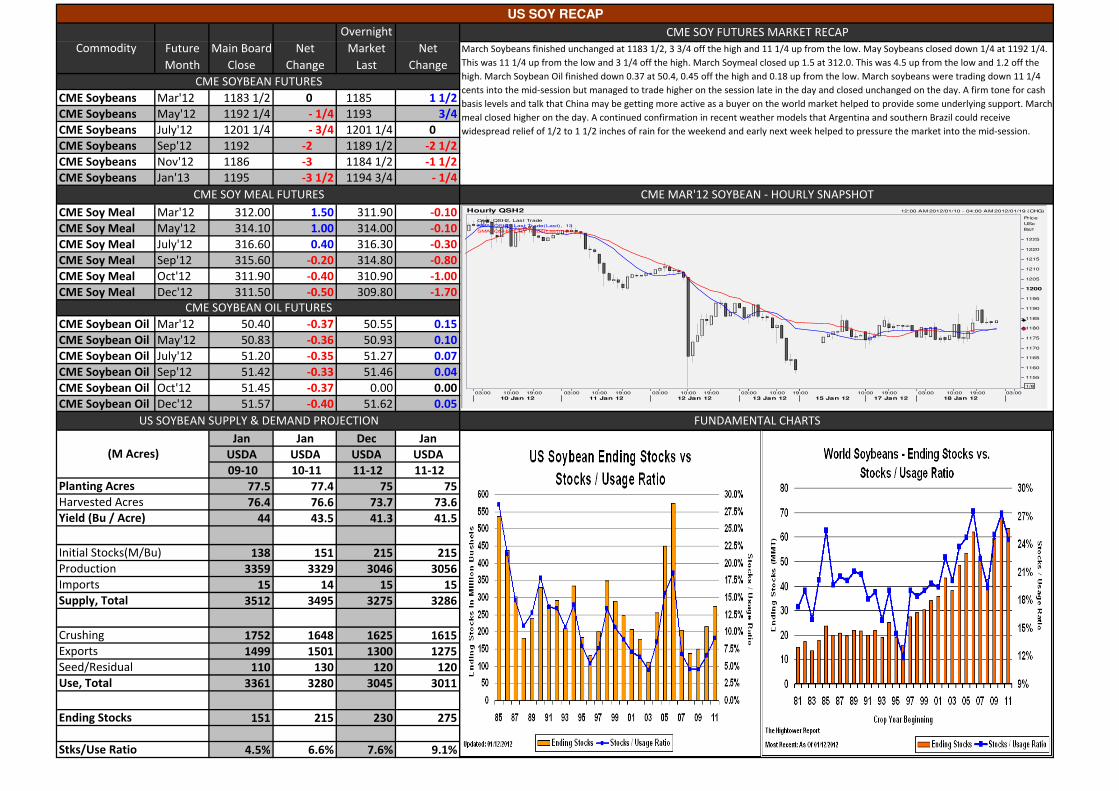
March Soybeans finished unchanged at 1183 1/2, 3 3/4 off the high and 11 1/4 up from the low. May Soybeans closed down 1/4 at 1192 1/4.
This was 11 1/4 up from the low and 3 1/4 off the high. March Soymeal closed up 1.5 at 312.0. This was 4.5 up from the low and 1.2 off the
high. March Soybean Oil finished down 0.37 at 50.4, 0.45 off the high and 0.18 up from the low. March soybeans were trading down 11 1/4
cents into the mid-session but managed to trade higher on the session late in the day and closed unchanged on the day. A firm tone for cash
basis levels and talk that China may be getting more active as a buyer on the world market helped to provide some underlying support. March
meal closed higher on the day. A continued confirmation in recent weather models that Argentina and southern Brazil could receive
widespread relief of 1/2 to 1 1/2 inches of rain for the weekend and early next week helped to pressure the market into the mid-session.
CME SOY MEAL FUTURES
Crushing
Imports
Supply, Total
Production
Initial Stocks(M/Bu)
Commodity Net
Change
Net
Change
US SOY RECAP
Hourly QSH2 12:00 AM 2012/01/10 - 04:00 AM 2012/01/19 (CHG)
Cndl, QSH2, Last Trade
SMA, QSH2, Last Trade(Last), 13
SMA, QSH2, Last Trade(Last), 21
Price
USc
Bsh
1/8
1155
1160
1165
1170
1175
1180
1185
1190
1195
1200
1205
1210
1215
1220
1225
03:00 10:00 19:00 03:00 10:00 19:00 03:00 10:00 19:00 03:00 10:00 19:00 10:00 19:00 03:00 10:00 19:00 03:00
10 Jan 12 11 Jan 12 12 Jan 12 13 Jan 12 15 Jan 12 17 Jan 12 18 Jan 12
Mar'12 May'12 July'12 Sep'12 Dec'12 Mar'13
SAFEX SUNS Jan'12 4400 5 0.00 -R 10 4537 4607 4679 4691 4736 4836
SAFEX SUNS Mar'12 4435 -5 0.00 -R 10 4558 4632 4707 4728 4777 4875
SAFEX SUNS May'12 4390 0 23.50 -R 10 -21 -25 -28 -37 -42 -39
SAFEX SUNS Jul'12 4450 10 31.50 -R 10 1207 1237 1259 n/a n/a n/a
SAFEX SOYA Jan'12 3281 -39 0.00 -R 10
SAFEX SOYA Mar'12 3330 -35 26.00 -R 10 Mar'12 May'12 July'12 Sep'12 Dec'12 Mar'13
SAFEX SOYA May'12 3370 -35 30.00 -R 10 4857 4927 4999 5011 5056 5156
SAFEX SOYA Jul'12 3420 -43 0.00 -R 10 4878 4952 5027 5048 5097 5195
-21 -25 -28 -37 -42 -39
1527 1557 1579 n/a n/a n/a
SOYA 686 000 710 000 32 000 -8 000 Mar'12 May'12 July'12 Sep'12 Dec'12 Mar'13
SUNS 858 600 860 000 0 1 400 3234 3294 3356 3364 3400 3486
3250 3314 3379 3395 3435 3519
-17 -20 -23 -32 -35 -33
96 76 64 n/a n/a n/a
Out-
standing
Latest SAGIS - MONTHLY PRODUCER DELIVERIES PROG.
JAN 2011 - NOV 2011 (tons)
RSA SOYA AND SUNFLOWER SUPPLY & DEMAND PROJECTION
Parity Change Up/Down
PARITY GRAPH www.grainsa.co.za
SAFEX Above Export Parity
USA SOYBEANS Import Parity - Delivered - Durban to Randfontein
R/ton (Previous 12:00pm)
Month
Month
R/ton (Previous 12:00pm)
R/ton (Current 07:00am)
Parity Change Up/Down
SAFEX Below Randfontein
SOYBEANS Export Parity Durban HarbourTotal Less CEC
Month
Commodity Retentions
SAFEX SOYA FUTURES (Previous Close)
R/ton (Current 07:00am)
SAFEX SUNFLOWER FUTURES (Previous Close)
R/ton (Previous 12:00pm)
SAFEX Below Durban Harbour
Parity Change Up/Down
Indicative Import and Export Parity Prices - USA SOYBEANS
Future
Month
Main Board
Close
R/ton (Current 07:00am)
USA SOYBEANS Import Parity FOR Durban HarbourOption
Volatility
(%)
Today's
Opening
Call
Commodity
South African Soy and Sunflower Recap
Net
Change
CME Wheat Mar'12 592 1/4 -12 1/2 595 1/2 3 1/4
CME Wheat May'12 614 1/2 -13 1/2 616 3/4 2 1/4
CME Wheat July'12 633 1/4 -15 633 3/4 1/2
CME Wheat Sep'12 652 -16 1/2 653 1/4 1 1/4
CME Wheat Dec'12 673 3/4 -15 3/4 675 1 1/4
CME Wheat Mar'13 690 1/2 -15 0 0
KCBT Wheat Mar'12 653 -20 654 3/4 1 3/4
KCBT Wheat May'12 662 1/2 -19 1/2 664 1/2 2
KCBT Wheat July'12 671 3/4 -20 1/4 673 1/2 1 3/4
KCBT Wheat Sep'12 686 1/2 -20 1/2 689 3/4 3 1/4
KCBT Wheat Dec'12 709 -20 3/4 709 0
KCBT Wheat Mar'13 723 -20 3/4 723 0
Jan Jan Dec Jan
USDA USDA USDA USDA
09-10 10-11 11-12 11-12
59.20 53.60 54.40 54.40
49.90 47.60 45.70 45.70
44.50 46.30 43.70 43.70
657 976 862 862
2218 2207 1999 1999
119 97 120 120
2993 3279 2982 2982
919 926 940 935
69 71 78 82
150 132 160 145
1138 1128 1178 1162
879 1289 925 950
2018 2417 2103 2112
976 862 878 870
48.4% 35.7% 41.7% 41.2%
Total Usage
Exports
Stks/Use Ratio
Total Domestic
Feed/Residual
FUNDAMENTAL CHARTS
KCBT WHEAT FUTURES
CME WHEAT FUTURES
Ending Stocks
Seed
Food
Initial Stocks(M/Bu)
Imports
Production
Total Supply
US WHEAT SUPPLY & DEMAND PROJECTION (M/Bu)
Net
Change
Yield (Bu / Acre)
Planting Acres
(M Acres)
Harvested Acres
Main Board
Close
Future
Month
Overnight
Market
Last
Net
Change
US WHEAT RECAP
Commodity
CME WHEAT FUTURES MARKET RECAP
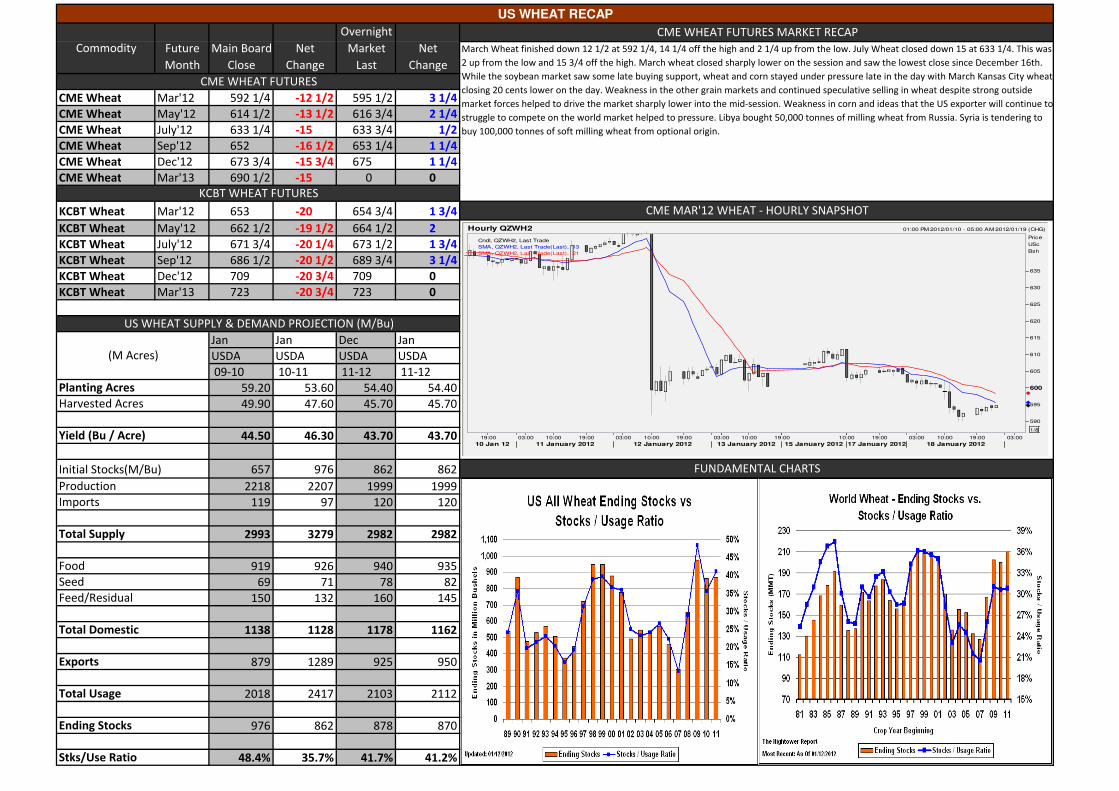
March Wheat finished down 12 1/2 at 592 1/4, 14 1/4 off the high and 2 1/4 up from the low. July Wheat closed down 15 at 633 1/4. This was
2 up from the low and 15 3/4 off the high. March wheat closed sharply lower on the session and saw the lowest close since December 16th.
While the soybean market saw some late buying support, wheat and corn stayed under pressure late in the day with March Kansas City wheat
closing 20 cents lower on the day. Weakness in the other grain markets and continued speculative selling in wheat despite strong outside
market forces helped to drive the market sharply lower into the mid-session. Weakness in corn and ideas that the US exporter will continue to
struggle to compete on the world market helped to pressure. Libya bought 50,000 tonnes of milling wheat from Russia. Syria is tendering to
buy 100,000 tonnes of soft milling wheat from optional origin.
CME MAR'12 WHEAT - HOURLY SNAPSHOT
Hourly QZWH2 01:00 PM 2012/01/10 - 05:00 AM 2012/01/19 (CHG)
Cndl, QZWH2, Last Trade
SMA, QZWH2, Last Trade(Last), 13
SMA, QZWH2, Last Trade(Last), 21
Price
USc
Bsh
1/8
590
595
600
605
610
615
620
625
630
635
19:00 03:00 10:00 19:00 03:00 10:00 19:00 03:00 10:00 19:00 10:00 19:00 03:00 10:00 19:00 03:00
10 Jan 12 11 January 2012 12 January 2012 13 January 2012 15 January 2012 17 January 2012 18 January 2012
Mar'12 May'12 July'12 Sep'12 Dec'12 Mar'13
SAFEX Wheat Jan'12 2758 -14 0.00 -R 30 2774 2830 2884 2961 3062 3148
SAFEX Wheat Mar'12 2800 -15 21.00 -R 30 2836 2905 2946 3017 3134 3236
SAFEX Wheat May'12 2840 -25 22.50 -R 30 -62 -75 -62 -56 -72 -88
SAFEX Wheat Jul'12 2870 0 20.50 -R 30 -26 -10 14 n/a n/a n/a
Mar'12 May'12 July'12 Sep'12 Dec'12 Mar'13
3024 3080 3134 3211 3312 3398
3086 3155 3196 3267 3384 3486
RSA Africa Overseas -62 -75 -62 -56 -72 -88
Overseas 523853 503070 20783 0 224 240 264 n/a n/a n/a
Africa Overseas
Overseas 22689 22689 0 Mar'12 May'12 July'12 Sep'12 Dec'12 Mar'13
RSA 60494 60494 0 1565 1611 1655 1720 1805 1876
1617 1675 1708 1767 1866 1951
-52 -64 -53 -47 -61 -75
1235 1229 1215 n/a n/a n/a
PARITY GRAPH www.grainsa.co.zaRSA WHEAT SUPPLY & DEMAND PROJECTION
Destined for:
Latest SAGIS WHEAT IMPORTS / EXPORTS ('11/'12)
Total TonsDestined for:
USA HRW No.2 Wheat Import Parity - Delivered - Durban to Randfontein
SAFEX Below Durban Harbour
SAFEX Below Randfontein
Wheat Export Parity Durban Harbour
Month
Parity Change Up/Down
SAFEX Above Export Parity
R/ton (Current 07:00am)
R/ton (Previous 12:00pm)
Parity Change Up/Down
Month
R/ton (Current 07:00am)
Parity Change Up/Down
R/ton (Previous 12:00pm)
R/ton (Current 07:00am)
Option
Volatility
(%)
Main Board
Close
Indicative Import and Export Parity Prices - USA HRW No.2 Wheat
USA HRW No.2 Wheat Import Parity FOR Durban Harbour
SAFEX WHEAT FUTURES (Previous Close)
Total Tons
Commodity
Imported from:
Exported from:
South African Wheat Recap
R/ton (Previous 12:00pm)
Month
Today's
Opening
Call
Future
Month
Net
Change
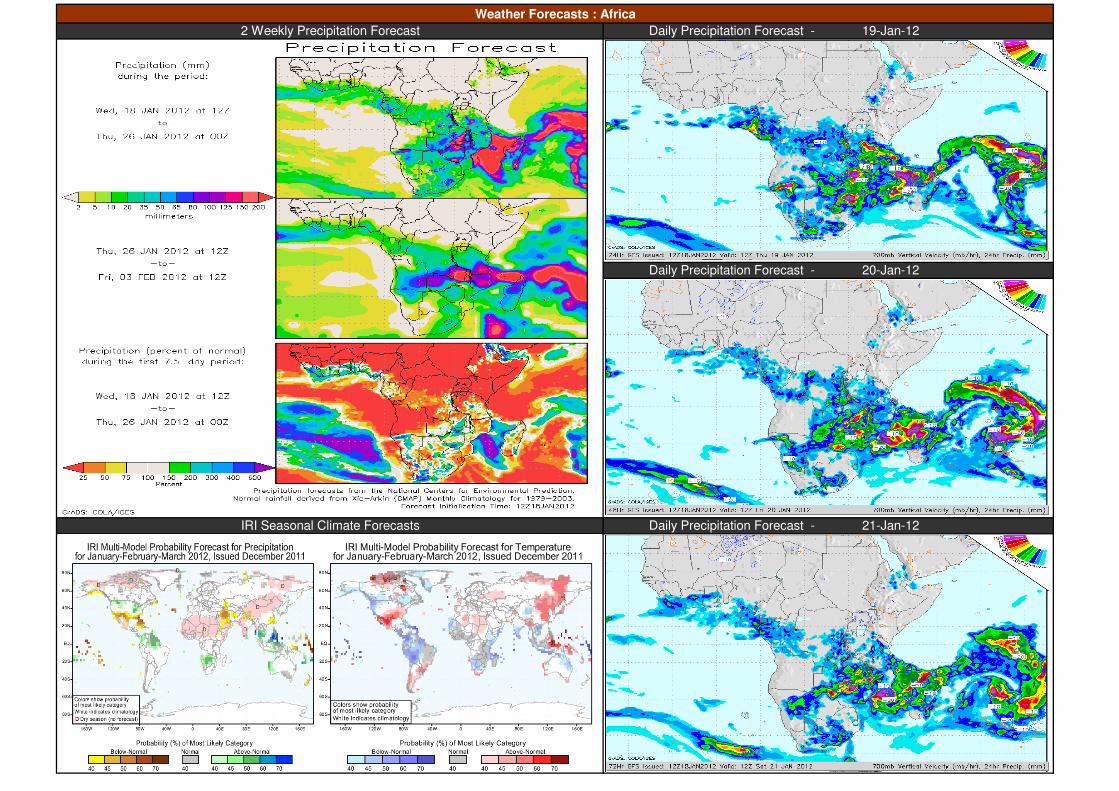
20-Jan-12
Daily Precipitation Forecast - 21-Jan-12IRI Seasonal Climate Forecasts
Daily Precipitation Forecast -
Weather Forecasts : Africa
2 Weekly Precipitation Forecast 19-Jan-12
Daily Precipitation Forecast -
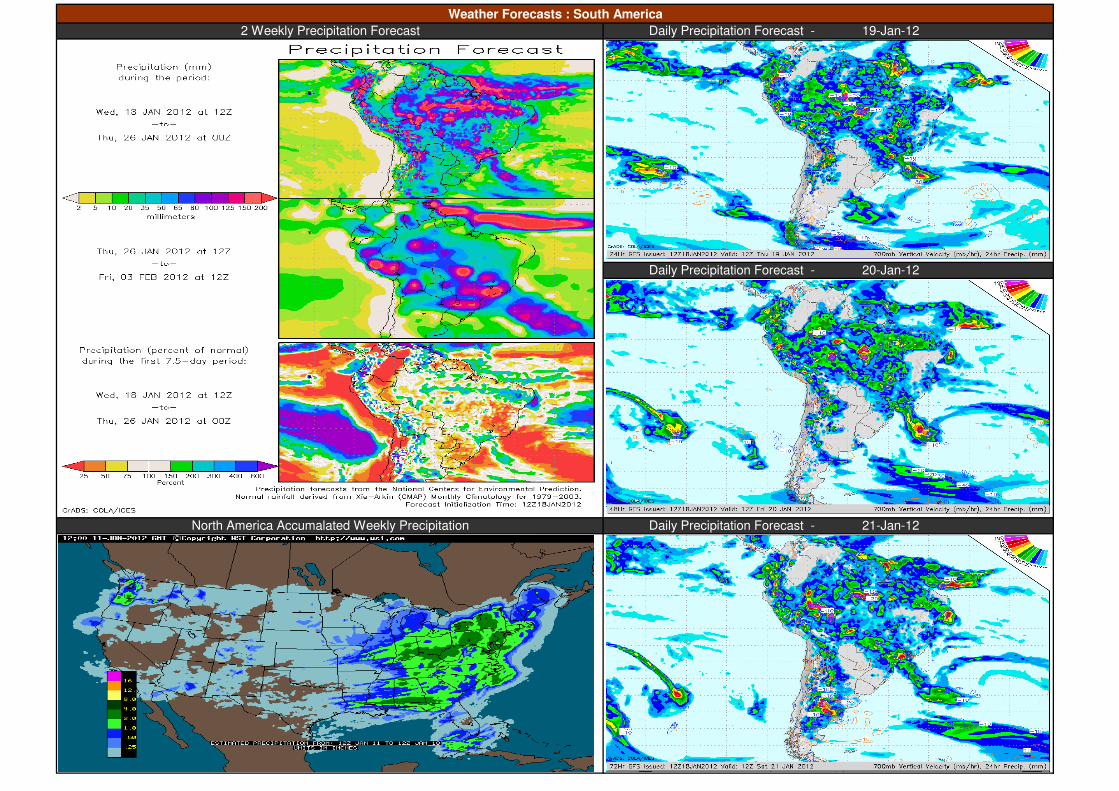
Daily Precipitation Forecast - 19-Jan-12
Weather Forecasts : South America
Daily Precipitation Forecast -
21-Jan-12
20-Jan-12
North America Accumalated Weekly Precipitation Daily Precipitation Forecast -
2 Weekly Precipitation Forecast
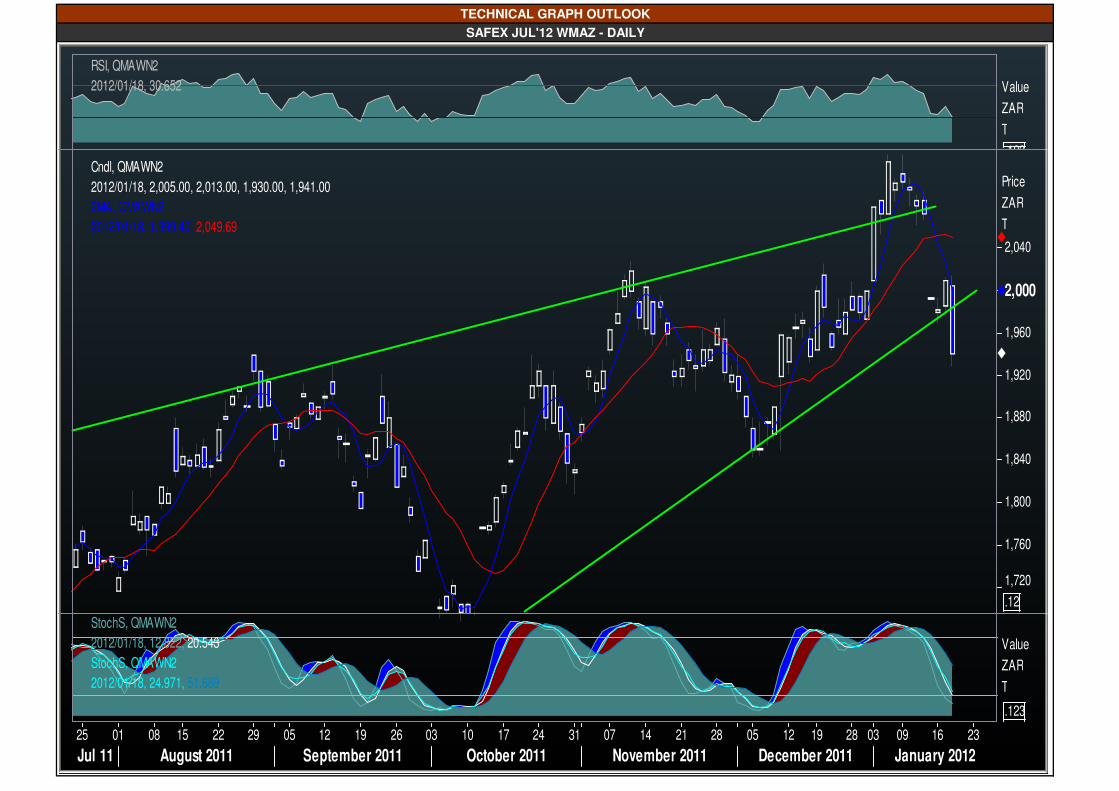
TECHNICAL GRAPH OUTLOOK
SAFEX JUL'12 WMAZ - DAILY
RSI, QMAWN2
2012/01/18, 30.652 Value
ZAR
T
.123Cndl, QMAWN2
2012/01/18, 2,005.00, 2,013.00, 1,930.00, 1,941.00
2MA, QMAWN2
2012/01/18, 1,999.40, 2,049.69
Price
ZAR
T
.12
1,720
1,760
1,800
1,840
1,880
1,920
1,960
2,000
2,040
StochS, QMAWN2
2012/01/18, 12.822, 20.543
StochS, QMAWN2
2012/01/18, 24.971, 51.689
Value
ZAR
T
.123
25 01 08 15 22 29 05 12 19 26 03 10 17 24 31 07 14 21 28 05 12 19 28 03 09 16 23
Jul 11 August 2011 September 2011 October 2011 November 2011 December 2011 January 2012
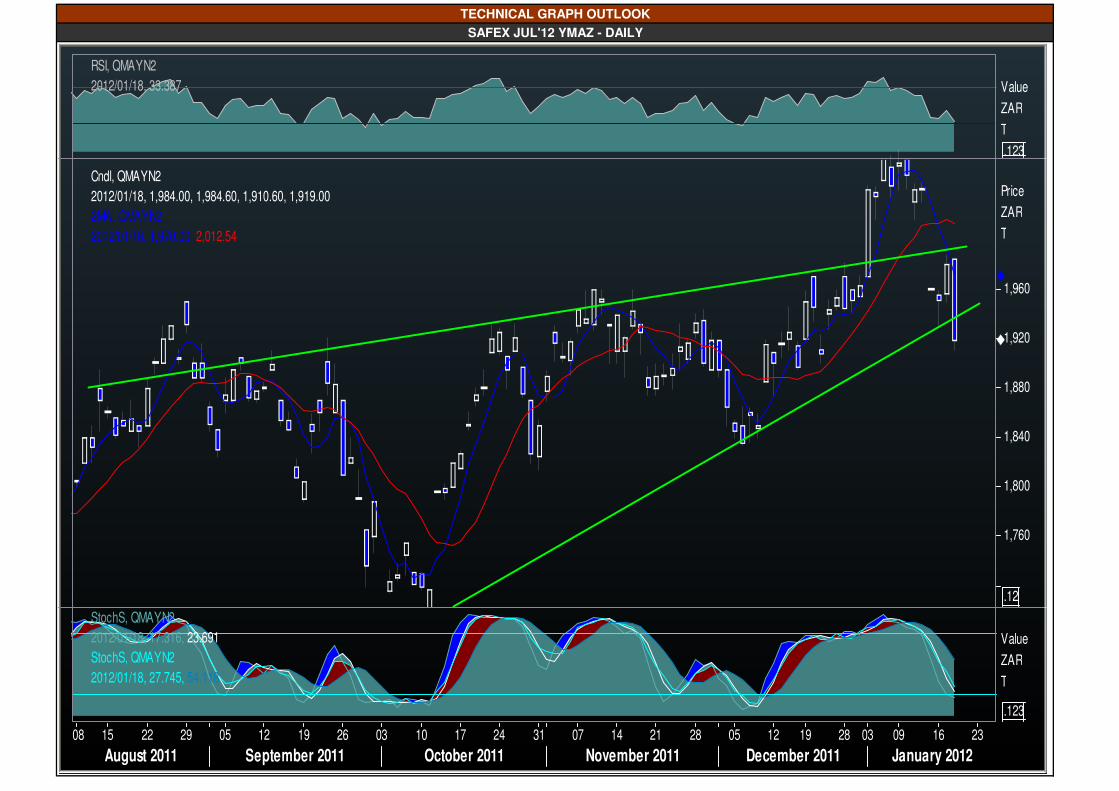
TECHNICAL GRAPH OUTLOOK
SAFEX JUL'12 YMAZ - DAILY
RSI, QMAYN2
2012/01/18, 33.387 Value
ZAR
T
.123
Cndl, QMAYN2
2012/01/18, 1,984.00, 1,984.60, 1,910.60, 1,919.00
2MA, QMAYN2
2012/01/18, 1,970.00, 2,012.54
Price
ZAR
T
.12
1,760
1,800
1,840
1,880
1,920
1,960
StochS, QMAYN2
2012/01/18, 17.316, 23.691
StochS, QMAYN2
2012/01/18, 27.745, 54.118
Value
ZAR
T
.123
08 15 22 29 05 12 19 26 03 10 17 24 31 07 14 21 28 05 12 19 28 03 09 16 23
August 2011 September 2011 October 2011 November 2011 December 2011 January 2012
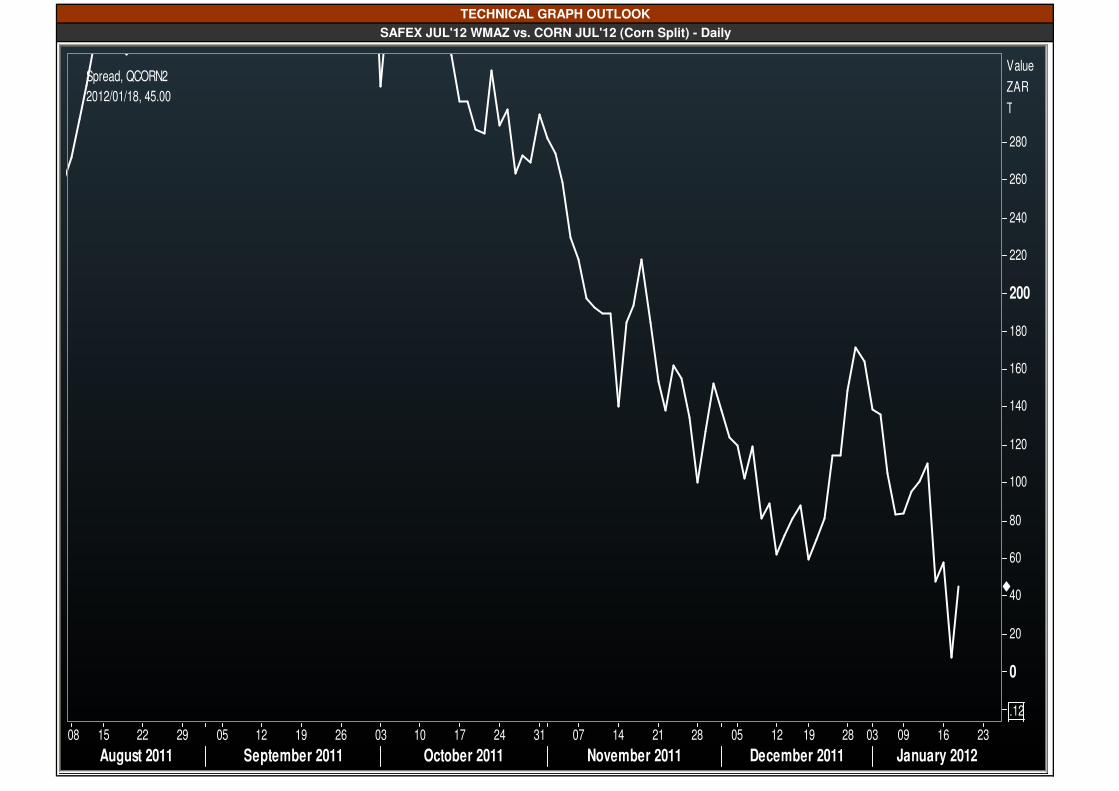
TECHNICAL GRAPH OUTLOOK
SAFEX JUL'12 WMAZ vs. CORN JUL'12 (Corn Split) - Daily
Spread, QCORN2
2012/01/18, 45.00
Value
ZAR
T
.12
0
20
40
60
80
100
120
140
160
180
200
220
240
260
280
08 15 22 29 05 12 19 26 03 10 17 24 31 07 14 21 28 05 12 19 28 03 09 16 23
August 2011 September 2011 October 2011 November 2011 December 2011 January 2012
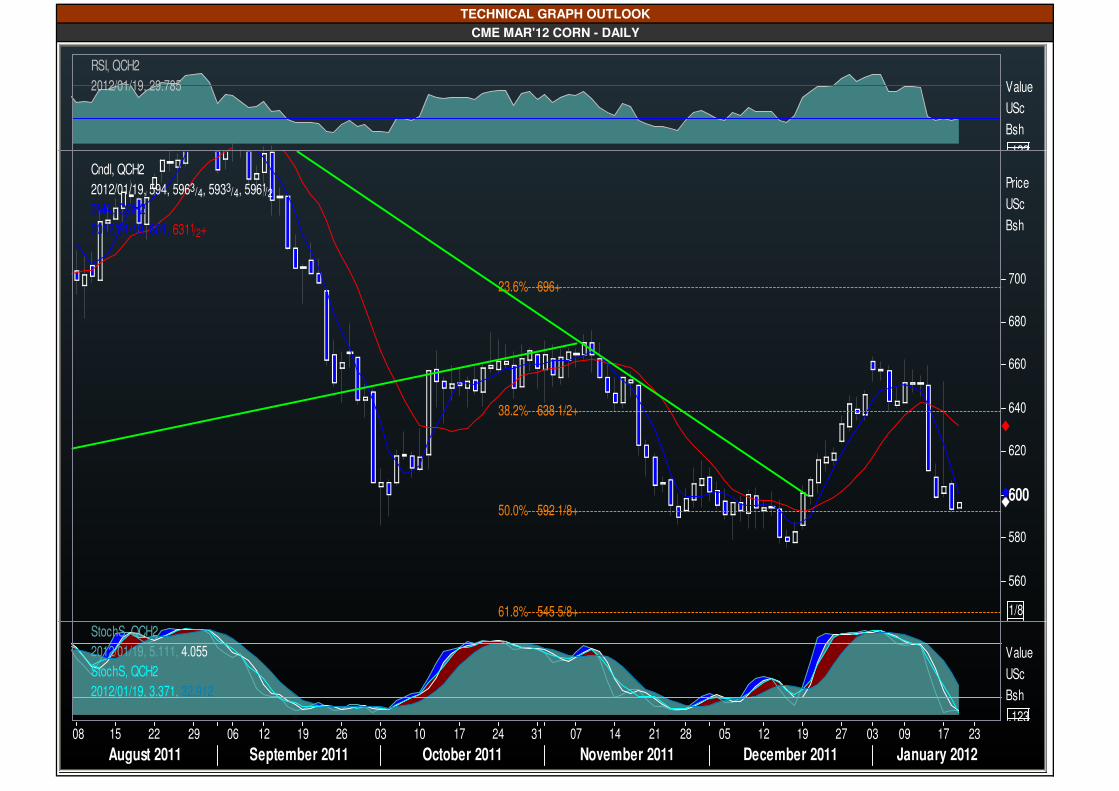
TECHNICAL GRAPH OUTLOOK
CME MAR'12 CORN - DAILY
RSI, QCH2
2012/01/19, 29.785 Value
USc
Bsh
.123
696+23.6%
638 1/2+38.2%
592 1/8+50.0%
545 5/8+61.8%
Cndl, QCH2
2012/01/19, 594, 5963/4, 5933/4, 5961/2
2MA, QCH2
2012/01/19, 601, 6311/2+
Price
USc
Bsh
1/8
560
580
600
620
640
660
680
700
StochS, QCH2
2012/01/19, 5.111, 4.055
StochS, QCH2
2012/01/19, 3.371, 32.912
Value
USc
Bsh
.12308 15 22 29 06 12 19 26 03 10 17 24 31 07 14 21 28 05 12 19 27 03 09 17 23
August 2011 September 2011 October 2011 November 2011 December 2011 January 2012
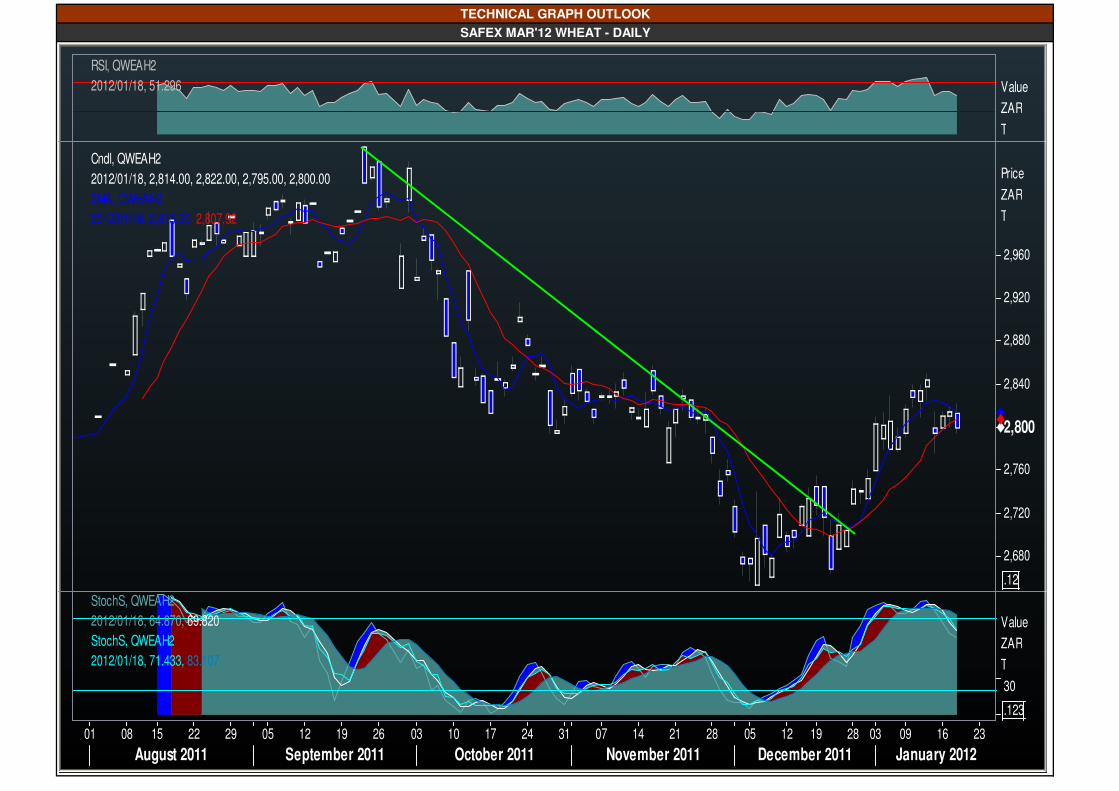
SAFEX MAR'12 WHEAT - DAILY
TECHNICAL GRAPH OUTLOOK
RSI, QWEAH2
2012/01/18, 51.296 Value
ZAR
T
Cndl, QWEAH2
2012/01/18, 2,814.00, 2,822.00, 2,795.00, 2,800.00
2MA, QWEAH2
2012/01/18, 2,813.20, 2,807.92
Price
ZAR
T
.12
2,680
2,720
2,760
2,800
2,840
2,880
2,920
2,960
StochS, QWEAH2
2012/01/18, 64.870, 69.820
StochS, QWEAH2
2012/01/18, 71.433, 83.107
Value
ZAR
T
.123
30
01 08 15 22 29 05 12 19 26 03 10 17 24 31 07 14 21 28 05 12 19 28 03 09 16 23
August 2011 September 2011 October 2011 November 2011 December 2011 January 2012
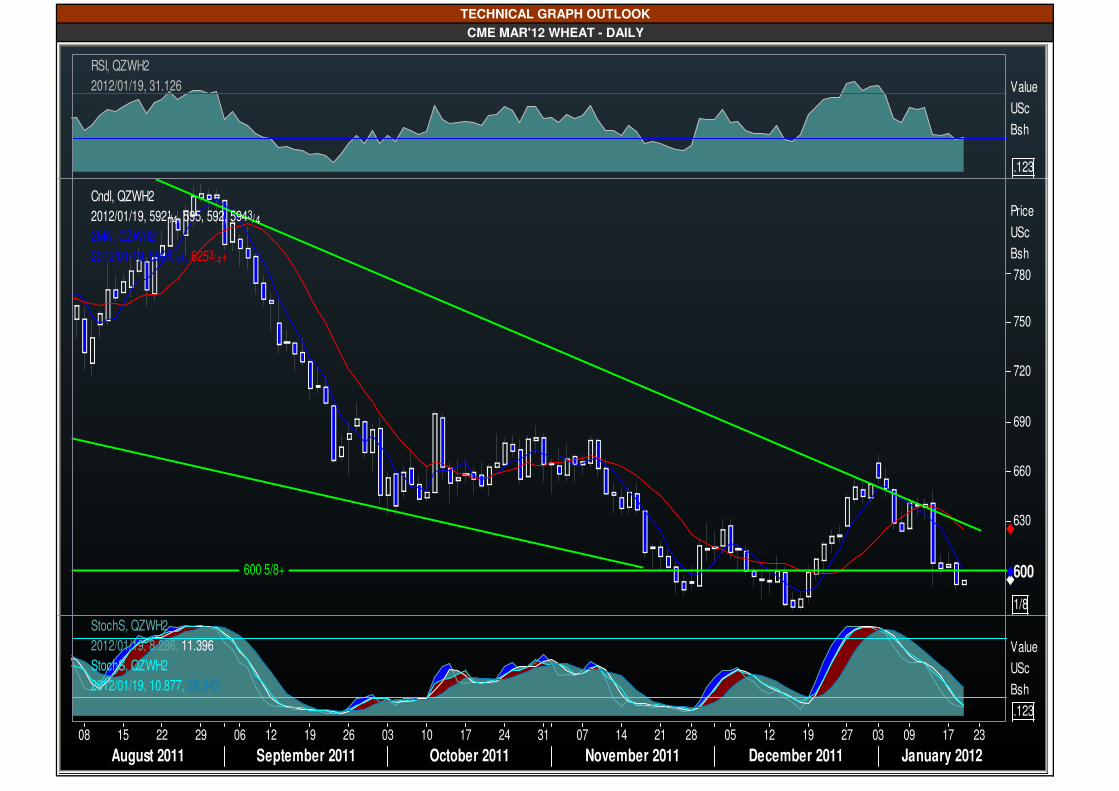
CME MAR'12 WHEAT - DAILY
TECHNICAL GRAPH OUTLOOK
RSI, QZWH2
2012/01/19, 31.126 Value
USc
Bsh
.123
600 5/8+
Cndl, QZWH2
2012/01/19, 5921/4, 595, 592, 5943/4
2MA, QZWH2
2012/01/19, 5993/4+, 6253/4+
Price
USc
Bsh
1/8
600
630
660
690
720
750
780
StochS, QZWH2
2012/01/19, 8.286, 11.396
StochS, QZWH2
2012/01/19, 10.877, 29.343
Value
USc
Bsh
.123
08 15 22 29 06 12 19 26 03 10 17 24 31 07 14 21 28 05 12 19 27 03 09 17 23
August 2011 September 2011 October 2011 November 2011 December 2011 January 2012
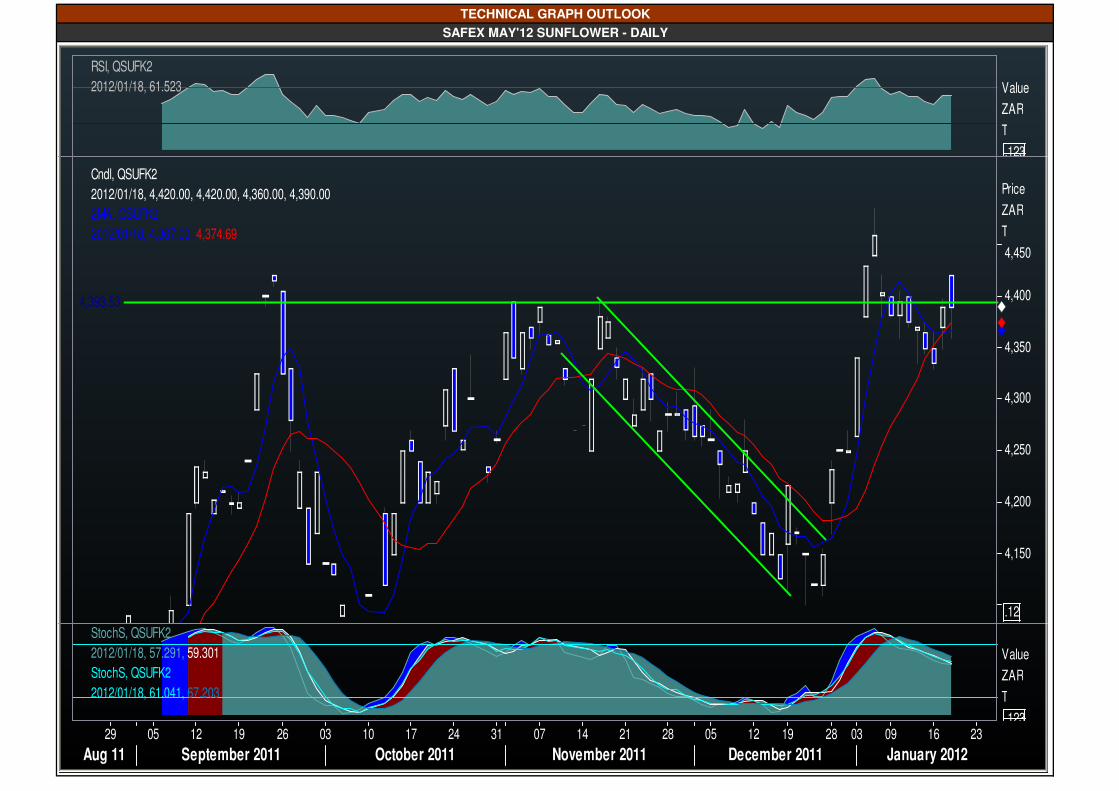
TECHNICAL GRAPH OUTLOOK
SAFEX MAY'12 SUNFLOWER - DAILY
RSI, QSUFK2
2012/01/18, 61.523 Value
ZAR
T
.123
4,393.53
Cndl, QSUFK2
2012/01/18, 4,420.00, 4,420.00, 4,360.00, 4,390.00
2MA, QSUFK2
2012/01/18, 4,367.00, 4,374.69
Price
ZAR
T
.12
4,150
4,200
4,250
4,300
4,350
4,400
4,450
StochS, QSUFK2
2012/01/18, 57.291, 59.301
StochS, QSUFK2
2012/01/18, 61.041, 67.203
Value
ZAR
T
.12329 05 12 19 26 03 10 17 24 31 07 14 21 28 05 12 19 28 03 09 16 23
Aug 11 September 2011 October 2011 November 2011 December 2011 January 2012
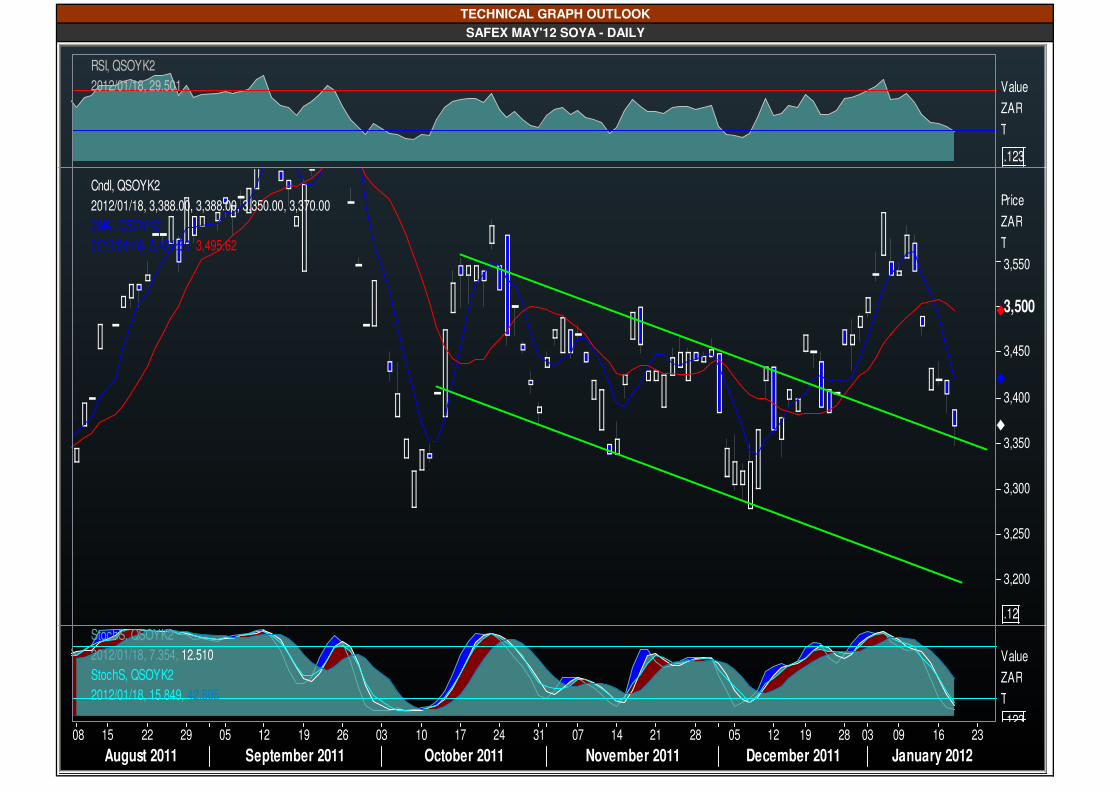
SAFEX MAY'12 SOYA - DAILY
TECHNICAL GRAPH OUTLOOK
RSI, QSOYK2
2012/01/18, 29.501 Value
ZAR
T
.123
Cndl, QSOYK2
2012/01/18, 3,388.00, 3,388.00, 3,350.00, 3,370.00
2MA, QSOYK2
2012/01/18, 3,421.60, 3,495.62
Price
ZAR
T
.12
3,200
3,250
3,300
3,350
3,400
3,450
3,500
3,550
StochS, QSOYK2
2012/01/18, 7.354, 12.510
StochS, QSOYK2
2012/01/18, 15.849, 42.805
Value
ZAR
T
.12308 15 22 29 05 12 19 26 03 10 17 24 31 07 14 21 28 05 12 19 28 03 09 16 23
August 2011 September 2011 October 2011 November 2011 December 2011 January 2012
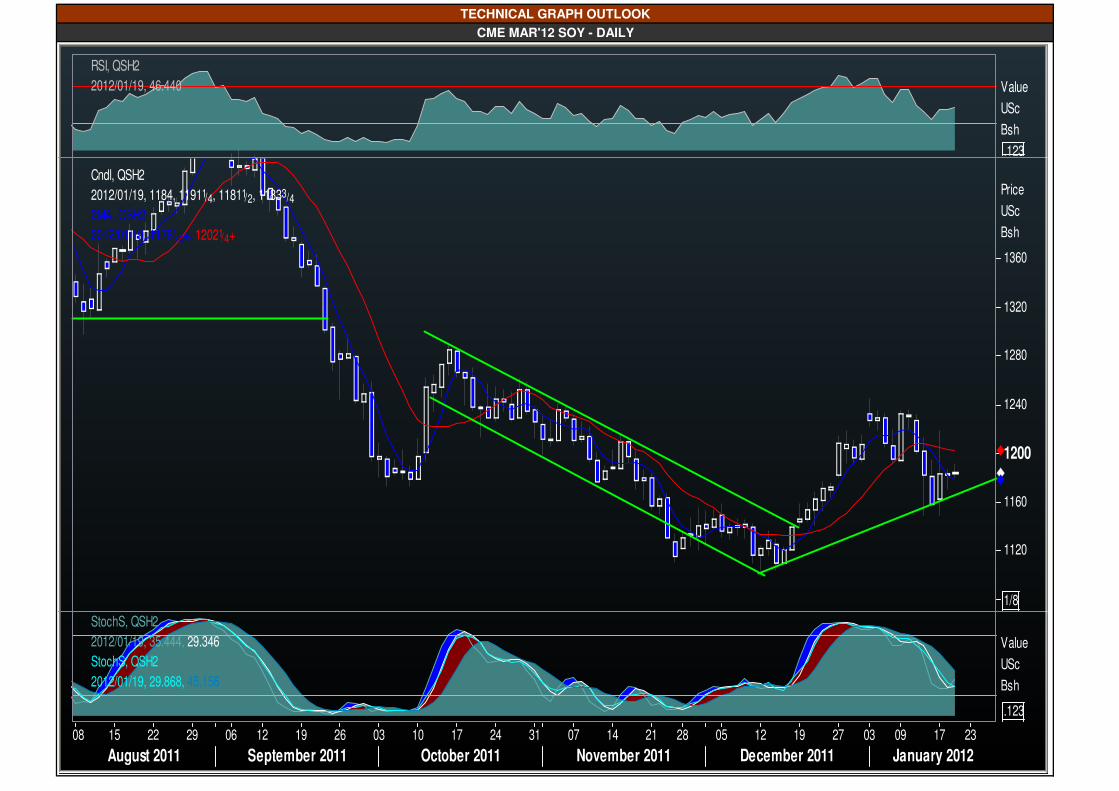
CME MAR'12 SOY - DAILY
TECHNICAL GRAPH OUTLOOK
RSI, QSH2
2012/01/19, 46.440 Value
USc
Bsh
.123
Cndl, QSH2
2012/01/19, 1184, 11911/4, 11811/2, 11833/4
2MA, QSH2
2012/01/19, 11781/4+, 12021/4+
Price
USc
Bsh
1/8
1120
1160
1200
1240
1280
1320
1360
StochS, QSH2
2012/01/19, 35.444, 29.346
StochS, QSH2
2012/01/19, 29.868, 45.156
Value
USc
Bsh
.123
08 15 22 29 06 12 19 26 03 10 17 24 31 07 14 21 28 05 12 19 27 03 09 17 23
August 2011 September 2011 October 2011 November 2011 December 2011 January 2012
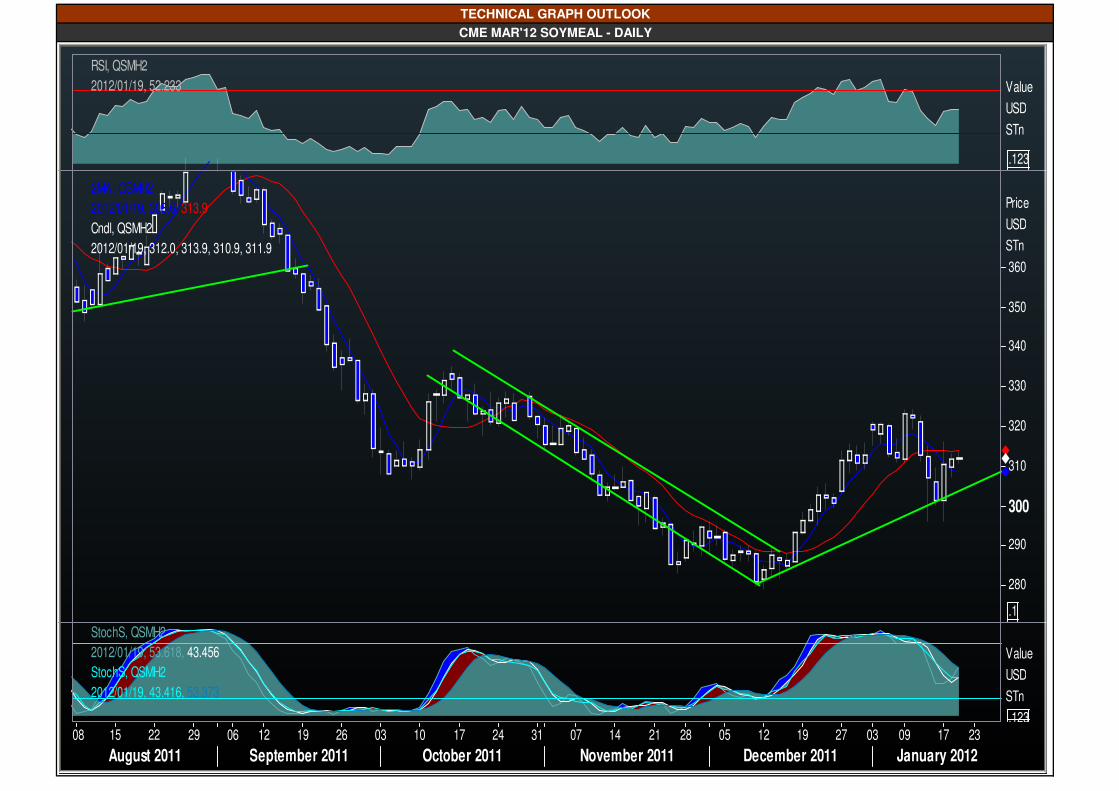
TECHNICAL GRAPH OUTLOOK
CME MAR'12 SOYMEAL - DAILY
RSI, QSMH2
2012/01/19, 52.233 Value
USD
STn
.123
2MA, QSMH2
2012/01/19, 308.6, 313.9
Cndl, QSMH2
2012/01/19, 312.0, 313.9, 310.9, 311.9
Price
USD
STn
.1
280
290
300
310
320
330
340
350
360
StochS, QSMH2
2012/01/19, 53.618, 43.456
StochS, QSMH2
2012/01/19, 43.416, 53.373
Value
USD
STn
.12308 15 22 29 06 12 19 26 03 10 17 24 31 07 14 21 28 05 12 19 27 03 09 17 23
August 2011 September 2011 October 2011 November 2011 December 2011 January 2012
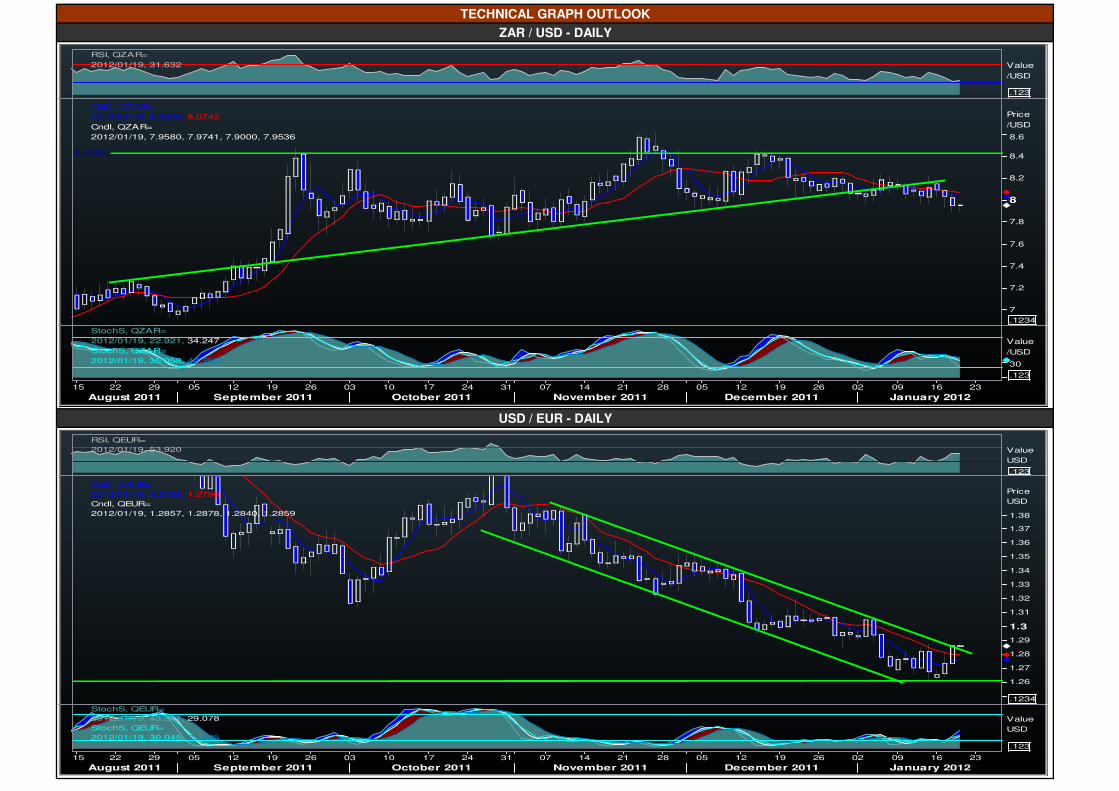
ZAR / USD - DAILY
USD / EUR - DAILY
TECHNICAL GRAPH OUTLOOK
RSI, QZAR=
2012/01/19, 31.632 Value
/USD
.123
8.4292
2MA, QZAR=
2012/01/19, 8.0320, 8.0742
Cndl, QZAR=
2012/01/19, 7.9580, 7.9741, 7.9000, 7.9536
Price
/USD
.1234
7
7.2
7.4
7.6
7.8
8
8.2
8.4
8.6
StochS, QZAR=
2012/01/19, 22.921, 34.247
StochS, QZAR=
2012/01/19, 35.058, 40.303
Value
/USD
.123
30
15 22 29 05 12 19 26 03 10 17 24 31 07 14 21 28 05 12 19 26 02 09 16 23
August 2011 September 2011 October 2011 November 2011 December 2011 January 2012
RSI, QEUR=
2012/01/19, 53.920 Value
USD
.123
2MA, QEUR=
2012/01/19, 1.2759, 1.2796
Cndl, QEUR=
2012/01/19, 1.2857, 1.2878, 1.2840, 1.2859
Price
USD
.1234
1.26
1.27
1.28
1.29
1.3
1.31
1.32
1.33
1.34
1.35
1.36
1.37
1.38
StochS, QEUR=
2012/01/19, 43.341, 29.078
StochS, QEUR=
2012/01/19, 30.045, 23.335
Value
USD
.123
15 22 29 05 12 19 26 03 10 17 24 31 07 14 21 28 05 12 19 26 02 09 16 23
August 2011 September 2011 October 2011 November 2011 December 2011 January 2012
Farmwise Grains (Pty) Ltd is a member of the Johannesburg Securities Exchange. Some text, images and any other material contained or displayed are proprietary to Farmwise
Grains (Pty) Ltd and constitutes valuable intellectual property intended for subscribers to services offered by Farmwise Grains (Pty) Ltd. Any information provided in this report is
for interest and educational purposes only, and does not constitute advice. Farmwise Grains (Pty) Ltd will not be responsible for losses incurred as a result of the opinions
expressed in this report. Since one deals in probabilities in market forecasting, the accuracy cannot be guaranteed. There is a risk of monetary loss in trading and/or investing on
the financial markets. Farmwise does not warrant the integrity of this communication or that it is free of errors, viruses, interception or interference. For more information about
Farmwise, visit our website at http://www.farmwise.co.za
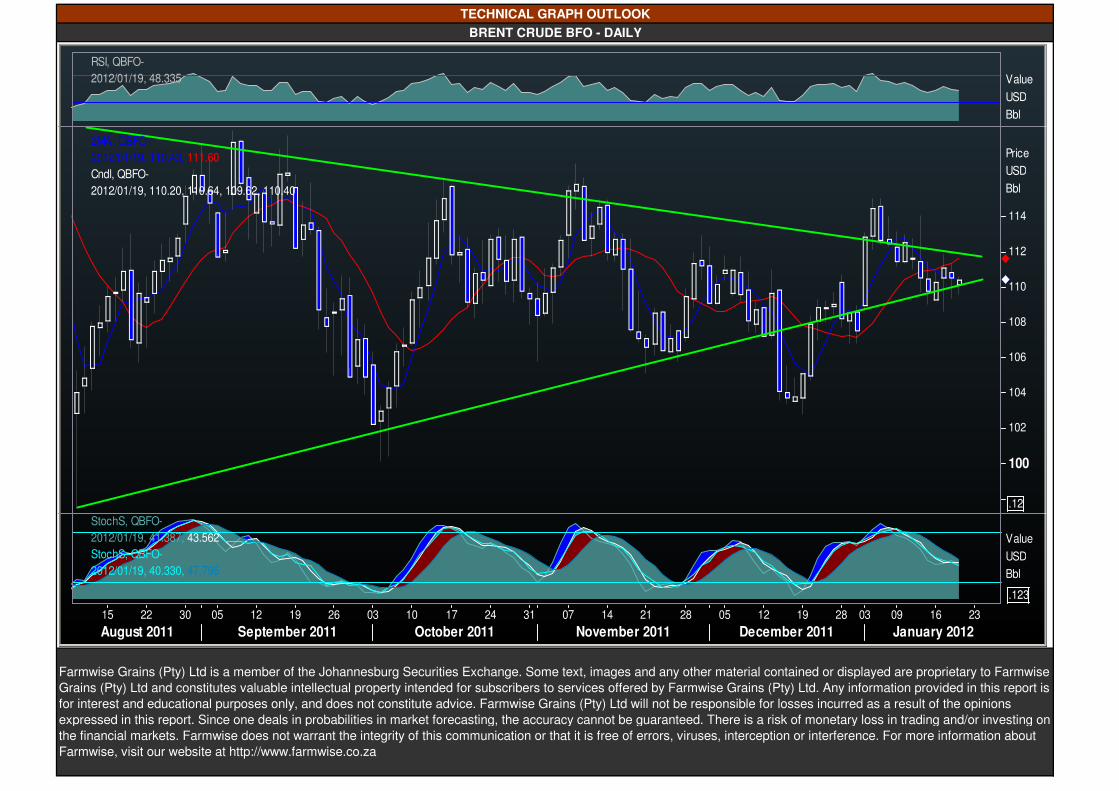
BRENT CRUDE BFO - DAILY
TECHNICAL GRAPH OUTLOOK
RSI, QBFO-
2012/01/19, 48.335 Value
USD
Bbl
2MA, QBFO-
2012/01/19, 110.43, 111.60
Cndl, QBFO-
2012/01/19, 110.20, 110.64, 109.62, 110.40
Price
USD
Bbl
.12
100
102
104
106
108
110
112
114
StochS, QBFO-
2012/01/19, 41.387, 43.562
StochS, QBFO-
2012/01/19, 40.330, 47.795
Value
USD
Bbl
.123
15 22 30 05 12 19 26 03 10 17 24 31 07 14 21 28 05 12 19 28 03 09 16 23
August 2011 September 2011 October 2011 November 2011 December 2011 January 2012