U.S. Container Ports and Air Pollution: A Perfect Storm
90
U.S. Container Ports and Air Pollution: A Perfect Storm An Energy Futures, Inc. Study By Jmes S. Cnnon
Transcript of U.S. Container Ports and Air Pollution: A Perfect Storm

�
U.S. Container Ports and Air Pollution: A Perfect Storm
An Energy Futures, Inc. Study
By J�mes S. C�nnon
Classic Columns Cover Stock

�
U.S. Container Ports and Air Pollution: A Perfect Storm
An Energy Futures, Inc. Study
By J�mes S. C�nnon
© 2008: Energy Futures, Inc.

���
Table of Contents
Executive Summary 1
Chapter 1: Introduction 6
Chapter 2: Fndings and Recommendations 11
Chapter 3: Emissions from Port Operations 25
Chapter 4: Profiles of the 10 Largest U.S. Container Ports 36 Profile: Ports of Los Angeles and Long Beach 37 Profile: Port of New York and New Jersey 46 Profile: Port of Oakland 50 Profile: Port of Savannah 55 Profile: Port of Tacoma 58 Profile: Port of Hampton Roads 61 Profile: Port of Seattle 64 Profile: Port of Charleston 70 Profile: Port of Houston 73
Acknowledgements 77
About the Author 77
References 79

�v

�
Executive Summary
Oceangoing container ships make more than 10,000 visits to ports in the United States (U.S.) from around the world each year. Delivery of goods to ports and from there to U.S. consumers is powered by diesel fuel each step of the way. Diesel fuel quality ranges from notoriously filthy bunker fuel that powers ships, to lower quality grades for offroad vehicles, to lower sulfur grades recently required for onroad trucks. Burning diesel fuel releases health threatening toxic air contaminants, smog forming air pollut-ants, and climate changing greenhouse gases. Air pollution and greenhouse gas emissions from international shipping are bad and getting worse. The combination of growing port activity, the densely populated regions where most ports are lo-cated, and the prevailing onshore wind patterns that accumulate, rather than disperse, port air pollution creates a “perfect storm” of threats to public health. Most U.S. ports are now among the largest sources of air pollution in their cities and progress toward reducing that pollution has been slow. Public concern is rising, however, and efforts to grapple with the complex challenge of reducing air pollution from ports are finally gathering momentum. Climate and human health impacts from port air pollution do not have to occur. A wide range of pollution control strategies are now available. Many squelch the thirst for imported oil in the process. These strategies include switching to cleaner alternative fuels and changing operating procedures to improve efficiency. Ports around the country, particularly at the adjacent ports of Los Angeles and Long Beach, California, are beginning to grapple with air pollution problems and working to develop clean air programs that include use of alternative fuels. This study by Energy Futures, Inc., examines the actions underway to reduce air pollution at the 10 largest container ports in the U.S. The goal is to identify the specific environmental problems at each port, the development status of pollution control strategies, and the opportunities for alternative fuels and advanced technologies to play a critical role in reducing air pollution.

2
Overv�ew of Ports
Nearly 45 million twenty-foot equivalent units (TEUs) of containers were unloaded or loaded at U.S. marine ports in 2005. A standard shipping container holds two TEUs and measures 40 feet long and 8 feet by 8 feet wide and high. This is the perfect size to fit on the carriage of a standard heavy duty semi-truck. Alternatively, they can be stacked two high to fit on a standard railroad car chassis. The 10 largest container ports in the U.S. account for roughly 80 percent of imports. The top ten container ports and their cargo loads for 2006 are listed below:
Cont��ner Port TEUs (m�l)
Los Angeles 8.4
Long Beach 7.3
New York City and neighboring New Jersey 5.1
Oakland, California 2.4
Savannah, Georgia 2.2
Tacoma, Washington 2.1
Hampton Roads, Virginia 2.0
Seattle, Washington 2.0
Charleston, South Carolina 2.0
Houston, Texas 1.6
Container ports are one of the fastest growing business sectors in many areas of the U.S. Container shipments more than quintupled in the U.S. from 1980 to 2006, as shown in the figure below. Over the last decade alone, container shipments rose 80.8 percent.
U.S. CONTAINER SHIPMENTS: �980-2006
(million TEUs per year)
1980 1982 1984 1986 1988 1990 1992 1994 1996 1998 2000 2002 2004 2006
45
40
35
30
25
20
15
10
5
0

�
F�nd�ngs
The process of grappling with the environmental challenges posed by large and growing port operations begins with the formation of a division within the port authority to direct pollution control programs. Nine of the 10 top ports have environmental departments within their management structures. The most basic role of environment departments is to assess compliance with government regulations. The Envi-ronmental Management System (EMS) established early this decade by the Port Authority of New York and New Jersey (PATH) does this, and other ports have followed with similar programs of their own. The problem with most EMS programs, however, is that they focus primarily on environmental compliance, not on innovation in cleaning the air from goods movement operations. The backbone of air pollution control efforts at U.S. container ports today is efforts to reduce emissions from diesel-powered equipment through the following steps: the use of newer diesel engines that pollute less; the installation of pollution control equipment; and switching to grades of diesel fuel containing lower sulfur content. All 10 container ports in this study have diesel emission reduction pro-grams in place, collectively spending millions of dollars in public and private funds. Introducing cleaner diesel equipment in new equipment purchases will soon be required by public law, however, as it already is for vehicles in other economic sectors. Moreover, continuing to run diesel equipment does nothing to diversify fuel supply away from oil. The best way to lower air pollution and greenhouse gas emissions and diversify fuel supply at U.S. container ports is to use alternative fuels or advanced technologies. Fortunately, important steps are being taken that are leading global efforts to replace diesel with alternative fuels and advanced technolo-gies. Natural gas is currently the leading alternative fuel being deployed in port vehicles. There is also interest in biodiesel, particularly at the two ports in the Northwest. Hybrid electric vehicle technology is beginning to enter the port market, too. Six programs are currently underway at the California ports to deploy fleets of natural gas powered cargo handling vehicles. Programs to replace diesel fuel with liquefied natural gas (LNG) are underway at the three largest container ports in California—Los Angeles, Long Beach and Oakland. The Clean Air Action Plan now in place for the ports of Los Angeles and Long Beach sets out an aggressive program to replace approximately 5,300 onroad diesel trucks at the two ports with LNG trucks by 2011. The port of Oakland is also deploying LNG in the fleet of trucks serving the port. The two ports of Seattle and Tacoma on Puget Sound in the state of Washington are spearhead-ing the use of renewable biodiesel blends in their vehicle fleets. Both ports are located in areas that currently meet the national ambient air quality standards for ozone, which affects the choice of biodiesel. Emissions of nitrogen oxide increase with the use of biodiesel, but biodiesel has been shown to reduce emissions of particulate matter, the pollutant of greater concern in the Puget Sound area. Converting to cargo handling equipment with hybrid electric drivetrains offers another option to reduce air pollution at ports. Although hybrid electric drivetrains raise vehicle costs substantially, they reduce fuel use, emissions and operating costs. Use of hybrid electric technology at ports is only beginning. A project to develop hybrid-powered cargo handling equipment has been underway at Long Beach since September 2006. In September 2007, the EPA announced a project to develop and test a new EPA-patented hybrid technology on a yard tractor at a PATH container facility in New Jersey. The electricity used to power a ship’s onboard lights and other non-propulsion equipment while at berth is normally generated by the auxiliary engines onboard the ships burning whatever quality diesel is allowed in ships entering the port. This ranges from 1,000 to 27,000 ppm sulfur. Even the cleanest ship fuel is still much dirtier than the 15 ppm sulfur fuel now required for U.S. onroad diesel truck engines. Shore power, often called cold ironing or alternative marine power, is an alternative to generating power onboard ship. Shore power systems use electric power substations to connect berths to the main power grid or portable dockside generators that use natural gas as the fuel and are independent of the grid. Projects to

�
extend grid power to the ports are underway in Los Angeles and Long Beach. Oakland is the first port in the U.S. to introduce cold ironing technology at a container terminal that produces electricity on the dock using a portable natural gas-fired generator. The unit was publicly demonstrated in port operations in July 2007. The problem of air pollution from oceangoing ships while in ports is severe, but it is only one part of the global shipping industry that is in dire need of reducing its use of bunker fuel. Bunker fuel is the dirtiest grade of diesel allowed under international law. The most polluting fuel contains 45,000 ppm of sulfur. Ships using bunker fuel emit more sulfur dioxide than the entirety of the world’s cars, trucks and buses combined and up to 21 percent of the greenhouse gases from all transportation sources. In the long term, depletion of oil resources and environmental pressure are likely to force the international marine shipping industry to switch to another fuel altogether. There is already some experience with natural gas use in ships. The total cost for reducing air pollution at container ports in the U.S. will be huge. The total needed nationwide between now and 2020 will probably exceed $20 billion, or roughly $1.5 billion per year. To meet these needs, full use of all traditional funding sources, public and private, will be necessary. To date, most of the money funding port clean-up efforts has come from government sources. As expen-sive as $1.5 billion per year to clean up U.S. container ports is, it is only a small percentage of the value of imported goods contained in the containers. Over $5.5 billion worth of goods moves in and out of U.S. ports every day. A $1.5 billion fee to cover air pollution control would add less than 0.1 percent to the cost of products to the consumer
Recommend�t�ons: C�lls for Act�on
Based on the findings of its research, Energy Futures has developed recommendations for public and private sector decisionmakers as the national debate about how to combat the growing air pollution at U.S. container ports moves forward.
1. Promote Use of Alternative Fuels and Advanced Technologies for Port Clean Ups. The ability of diesel to meet the energy and environmental demands posed by container ports is already strained. Fuel supplies are insecure, costs are rising and pollution control strategies are not likely to be effective, especially if container traffic doubles by 2020 as predicted. Natural gas has already been shown to be a viable substitute for diesel fuel in port vehicles. Natural gas has the environmental advantages of lower tailpipe emissions, lower greenhouse gas emis-sions, and greater supply. It is primarily produced domestically. Natural reserves can be supplemented by biomethane produced from renewable resources. Natural gas and biodiesel blends and hybrid drive-trains, the two other options practical for ports, already receive favorable financial incentives in the form of tax credits and fuel tax relief. New government programs are needed specifically to promote use of alternative fuels and advanced technologies at the many unique port operations.
2. Develop and Implement a National Port Clean-Up Strategy. Every port has a unique competitive position, but all ports are major sources of air pollution that share the same portfolio of pollution control options. Each port must face the possibility that changes in its operating procedures could increase costs and place it at a competitive disadvantage to other ports. Several ports recognize this dilemma and are acting cooperatively to prevent adverse competi-tive repercussions from clean-up efforts. The Northwest Ports Clean Air Strategy binding three ports along Puget Sound, including one in Canada, is an example. The next logical step is to develop a national port strategy at the federal government level.

�
3. Create a National Funding Mechanism to Finance Comprehensive Port Clean Up. A new national initiative to reduce air pollution at ports will require significant funding to be effective. New sources of public money in the form of tax revenues or credits, loan funds, or port user fees will be needed. A national debate needs to take place to develop a funding strategy for port clean-up programs. A national container fee is one logical option for the federal government to consider. A $30 per TEU fee would raise $1.3 billion, if implemented nationally. This is roughly equal to the annual clean-up costs estimated in this study to be required between now and 2020.
4. Advocate Global Environmental Standards in the International Arena: National leadership in port clean-up efforts would boost the credibility of the U.S. in international arenas, especially at the International Mari-time Organization (IMO), where maritime energy and environmental issues are debated. International diplomacy is vital to any long-term solution to port pollution issues. The regulation of international fuel standards for transoceanic ships is the most important priority for the IMO.
5. Create a Clearinghouse of Public Information about Port Clean-Up Efforts: There is an urgent need for a na-tional clearinghouse of information about environmental issues at ports. The lack of widely disseminated information about environmental challenges at container ports, the pros and cons of the many options to reduce pollution, and the experiences of individual ports in assessing and addressing their environmen-tal issues are critical stumbling blocks to the emergence of an effective national port clean-up effort.

6
Chapter 1: Introduction
Early this morning, a huge transoceanic container ship crossed an invisible line off the coast of southern California. The line marked 24 nautical miles offshore, the point at which air pollution from the ship’s smokestacks legally become an environmental problem for the city of Los Angeles, the most polluted city in the United States (U.S.). The crossing occurred about the time the prevailing wind in southern California switched from a nighttime land breeze, blowing from the land out to sea, into a sea breeze. From this point on, the wind carries the air pollution from the ship inland, across the largest harbor and port complex in the U.S., along the truck and rail routes connecting the ports to transfer points in the heart of Los Angeles, traveling over the working class communities of San Pedro and Wilmington and skirting Disneyland in the process. The air pollution accumulates along this route as air pollution from container-toting trucks and trains mixes with the discharges from the ship. The toxic soup finds its way into the lungs of residents along the path across one of the most populated metropolitan areas in the U.S. Residents of communities near the ports probably suffer the worst, but a big dose of air pollution also falls on the fast growing, densely populated portion of Riverside County east of Los Angeles, the most polluted county in the country, according to the U.S. Environmental Protection Agency (EPA).� This imaginary ship, like the thousands actually on the seas at any one time, burns marine bunker oil, which is simply filthy. Bunker fuel contains several thousand times more sulfur and other contami-nants than allowed in onroad motor vehicles in the U.S. It is the garbage from oil refineries, selling for less per gallon than the crude oil from which it was originally refined. Every day, more than 50 ships burning bunker fuel with no air pollution control equipment berth at U.S. ports, where they daily unload collectively more than 60,000 containers of consumer goods.2 Pollution is also emitted from diesel burning tugboats. While the ships are in port, generally a day or so, their engines usually keep running to generate power needed for onboard lights, electronic equipment and other auxiliary power demands. The contain-ers are transferred dockside by thousands of pieces of specially designed cargo handling yard equipment and are eventually loaded onto rail cars and semi-trailer trucks and sent on their way to U.S. consumers. Diesel is the only fuel of choice for each step in this process, currently supplying ships, tugboats, yard and semi-trailer trucks, and locomotives. Taken together, the air pollution from fuel burning linked

�
to port operations constitutes the largest single pollution source in many coastal cities in the U.S. Port operations are also among the least regulated industries, however. Air pollution control requirements are far weaker for port operations than for other sources. Until recently, the environmental consequences of port operations were largely unrecognized by the public and ignored by government policymakers. As other sources of pollution have been reduced in the decades-long battle to improve urban air quality, pollution from ports is becoming more obvious, as visible as it is worrisome. Port pollution is bad and rapidly getting worse. Oceangoing container ships make more than 10,000 visits to U.S. ports from around the world each year. The largest foreign goods provider of course is China, and the largest importing state is California. Container ships make nearly half of total ship visits to California, 4,727 out of 9,613 in 2004.� These ships arrive in the U.S. completing journeys similar to those onboard the imaginary ship, and the environmental damage they cause extends beyond the narrow boundaries described above, affecting even the planet as a whole through emissions of greenhouse gases that cause global climate change. The tremendous rate of growth in transoceanic shipping as American consumers continue to turn to cheaper imports raises the environmental stakes posed by global container shipping.
The first container ship, the Ideal X, toured U.S. ports in 1956, demonstrating the innovative concept of carrying goods across oceans in identically sized containers that would not be unpacked until they reached inland destinations.� Propelled by globalization, container ship traffic to and from the U.S. grew rapidly, doubling between 1990 and 2001. Today, more than 44 million twenty-foot equivalent units (TEUs) of containers are handled at U.S. ports every year, and this total is expected to double again by 2020. Nearly every port in the U.S. is experiencing rapidly growing goods movement and is suffering increased air pollution as a result.� The issues of booming port growth and major public health impacts from port emissions are especially acute at the nation’s two largest ports, the adjacent import terminals in Los Angeles and Long Beach along San Pedro Bay in southern California. Nearly 40 percent of all containerized trade in the nation flows through these two ports. They are located in the most heavily polluted region in the country and the home to more than 17 million people. The combination of growing port activity, the densely populated region, and a wind pattern that accumulates rather than disperses air pollution from port operations creates a “perfect storm” of threats to public health. The two San Pedro Bay ports are the largest single point source of air pollution in the region, accounting for about 10 percent of the nitrogen oxides emissions and about 25 percent of the diesel particulate matter in the region.6 The region and the ports are regulated by the world’s largest local pol-lution control agency, the South Coast Air Quality Management District (SCAQMD). A key driving force behind the move to reduce pollution from the San Pedro ports is concern that diesel emissions from port
F�gure �
Cont��ner sh�p �t �erth
�t Port of Los Angeles

8
operations are contributing to high cancer and asthma rates among residents in the area. Several years ago, the SCAQMD released the Multiple Air Toxics Exposure Study, which concluded that diesel particu-late emissions from heavy duty vehicles contributes 71 percent of the cancer risk facing residents in the Los Angeles metropolitan area.� The California Air Resources Board estimates that port pollution alone is responsible for roughly 640 premature deaths every year in the state and $1.0 billion in health costs just in the Los Angeles metropolitan area.8 These costs and human health impacts do not have to occur in Los Angeles, or near any other port for that matter. A wide range of pollution control strategies are now available to nearly completely eliminate air pollution at ports. Many squelch the thirst for imported oil in the process. These strategies include switching to cleaner alternative fuels and changing operating procedures to improve efficiency. The people of California have recently embarked on a major effort to reduce air pollution at the ports. In November 2006, the Clean Air Action Plan was endorsed by the harbor commissions governing the ports of Los Angeles and Long Beach.9 It sets ambitious 85 percent pollution reduction goals for the ports by 2020. Also in November, California voters approved a $20 billion bond initiative, which desig-nates $1 billion in government incentive funds to finance port clean up programs and $2 billion more to improve port infrastructure. Since approval, the state government has been negotiating the precise division of bond revenues among competing programs. In January 2007, the state government officially adopted the Goods Movement Action Plan.�0 Three years in the making, the plan will guide port capacity expansion, goods movement, and environmental and community impact mitigation. Combined with related federal, state and local funding programs, the emerging clean up effort in Los Angeles and Long Beach is by far the most ambitious in the world. Ports in other parts of the country are also grappling with pollution and working to develop remedial programs that include use of alternative fuels. Los Angeles and Long Beach will hopefully create a beachhead against growing air pollution, potentially inspiring a more comprehensive national port clean up effort. The port of Oakland, for example, has several natural gas projects underway to reduce pollution from berthed ships and container hauling trucks. The ports of Seattle and Tacoma are using biodiesel in their cargo handling equipment and beginning to implement a comprehensive regional air pollution reduction program. Several ports along the East and Gulf Coasts have established environmental management systems to guide their voluntary pollution control initiatives. Although none are as advanced as the program now being implemented at the southern California ports, the problems are daunting at other ports and the need for remedial strategies compelling.
The Energy Futures Port Study
According to the American Association of Port Authorities (AAPA), which is the port industry’s lead trade group and is based in Alexandria, Virginia, nearly 45 million TEUs of containers were unloaded or loaded at U.S. marine ports in 2005.�� Most containers measure 40 feet long and 8 feet by 8 feet wide and high, the perfect size to fit on the carriage of a heavy duty semitruck. Alternatively, they can be stacked two high to fit on a railroad car chassis. In marine cargo parlance, each standard 40 foot container represents two TEUs. A typical 40 foot container includes 2,560 cubic feet of cargo space. This is enough to store over 31,000 bottles of wine, 4,700 computer speakers, 17,500 frozen chickens or 1,200 Christmas trees.�2 Most transoceanic container ships carry about 2,000 containers, or 4,000 TEUs, filled with imported goods. About 11,500 port dockings of container ships occur in the U.S. every year. Each ship weighs on average 38,000 tons. The trend is toward bigger ships. The newest generation of ships weigh 70,000 tons and are too large to fit through the Panama Canal. They hold over 8,000 TEUs.
9
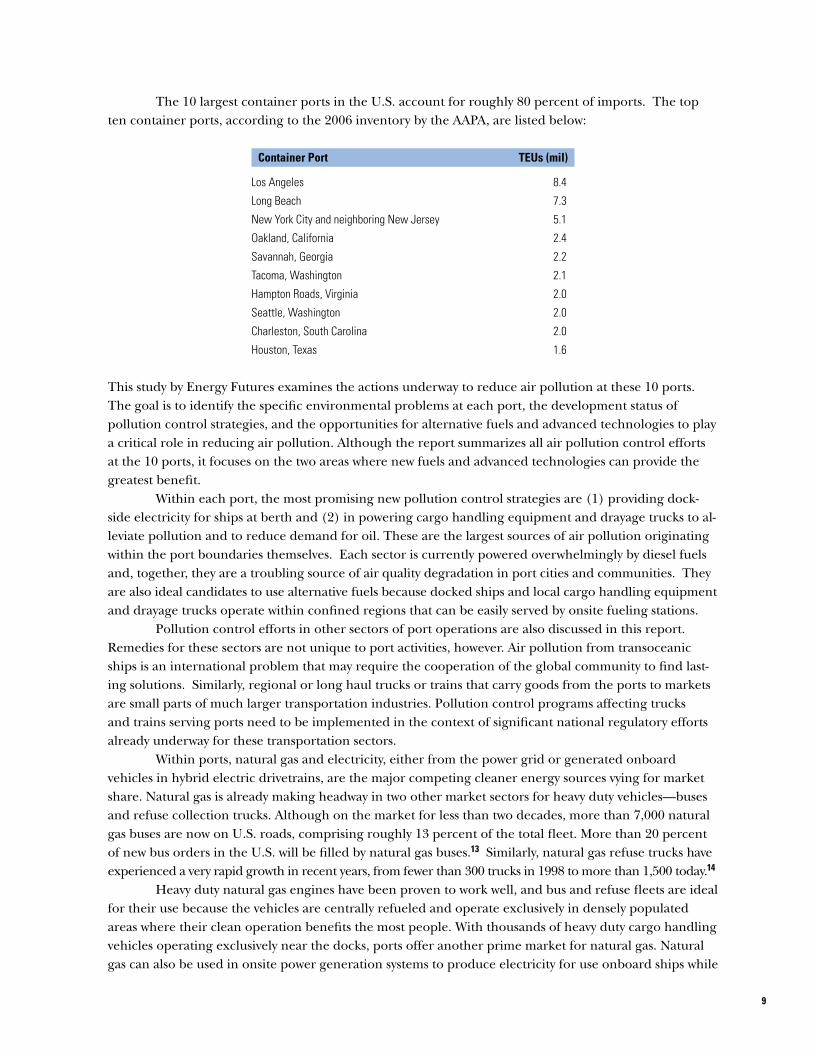
The 10 largest container ports in the U.S. account for roughly 80 percent of imports. The top ten container ports, according to the 2006 inventory by the AAPA, are listed below:
Cont��ner Port TEUs (m�l)
Los Angeles 8.4
Long Beach 7.3
New York City and neighboring New Jersey 5.1
Oakland, California 2.4
Savannah, Georgia 2.2
Tacoma, Washington 2.1
Hampton Roads, Virginia 2.0
Seattle, Washington 2.0
Charleston, South Carolina 2.0
Houston, Texas 1.6
This study by Energy Futures examines the actions underway to reduce air pollution at these 10 ports. The goal is to identify the specific environmental problems at each port, the development status of pollution control strategies, and the opportunities for alternative fuels and advanced technologies to play a critical role in reducing air pollution. Although the report summarizes all air pollution control efforts at the 10 ports, it focuses on the two areas where new fuels and advanced technologies can provide the greatest benefit. Within each port, the most promising new pollution control strategies are (1) providing dock-side electricity for ships at berth and (2) in powering cargo handling equipment and drayage trucks to al-leviate pollution and to reduce demand for oil. These are the largest sources of air pollution originating within the port boundaries themselves. Each sector is currently powered overwhelmingly by diesel fuels and, together, they are a troubling source of air quality degradation in port cities and communities. They are also ideal candidates to use alternative fuels because docked ships and local cargo handling equipment and drayage trucks operate within confined regions that can be easily served by onsite fueling stations. Pollution control efforts in other sectors of port operations are also discussed in this report. Remedies for these sectors are not unique to port activities, however. Air pollution from transoceanic ships is an international problem that may require the cooperation of the global community to find last-ing solutions. Similarly, regional or long haul trucks or trains that carry goods from the ports to markets are small parts of much larger transportation industries. Pollution control programs affecting trucks and trains serving ports need to be implemented in the context of significant national regulatory efforts already underway for these transportation sectors. Within ports, natural gas and electricity, either from the power grid or generated onboard vehicles in hybrid electric drivetrains, are the major competing cleaner energy sources vying for market share. Natural gas is already making headway in two other market sectors for heavy duty vehicles—buses and refuse collection trucks. Although on the market for less than two decades, more than 7,000 natural gas buses are now on U.S. roads, comprising roughly 13 percent of the total fleet. More than 20 percent of new bus orders in the U.S. will be filled by natural gas buses.�� Similarly, natural gas refuse trucks have experienced a very rapid growth in recent years, from fewer than 300 trucks in 1998 to more than 1,500 today.�� Heavy duty natural gas engines have been proven to work well, and bus and refuse fleets are ideal for their use because the vehicles are centrally refueled and operate exclusively in densely populated areas where their clean operation benefits the most people. With thousands of heavy duty cargo handling vehicles operating exclusively near the docks, ports offer another prime market for natural gas. Natural gas can also be used in onsite power generation systems to produce electricity for use onboard ships while

�0
they are docked. Other fuels and technologies could also be viable and some programs are underway at ports to test their applicability. Biodiesel, which can be produced from renewable domestic crops, is currently used to power vehicles at the northwestern ports of Seattle and Tacoma, Washington.
Electricity is a second alternative fuel that could be used to displace diesel and bunker fuel at ports. Hybrid electric vehicles (HEVs), which use onboard internal combustion engines to efficiently generate electricity, provide a new application of electricity that is gaining commercial application. Like natural gas, HEV technology is rapidly gaining ground in bus applications, and prototype hybrid electric powered refuse trucks are undergoing tests. Ports could be next. Direct use of grid power generated at power plants located far from the ports could be applied to provide power onboard docked ships in a second new application of electric power in the shipping business.
Ro�dm�p to the Report
Three chapters follow this introduction. Chapter 2 presents the findings of the study, based mostly on information obtained from site visits to the ten ports surveyed in this study. The major goal of this chapter is to present a catalog of pollution control programs currently underway at container ports across the U.S. The collection and analysis of this information also raised several issues that are critical to the success or failure of pollution control efforts. These ingredients for success are presented in Chapter 2 along with recommendations about strategies to encourage further efforts to reduce air pollution at container ports. Chapter 3 provides an overview of typical port operations with a focus on the major sources of air pollution within each operating sector. It also discusses the major competing options to reduce air pollu-tion at ports: diesel emission control strategies, the use of alternative fuels or advanced technologies, and changes in operating procedures. Chapter 4 contains in-depth profiles of the ten largest port facilities in the U.S. The profiles provide brief histories of each port, overviews of their management structure, a description of their equipment and operating procedures, in-depth reviews of their efforts to reduce air pollution, and com-mentary on their level of cooperation with this study.
F�gure 2
Y�rd tr�ctor �t T�com�

��
Chapter 2:Findings and Recommendations
Container ports are highly polluting and for the most part under regulated in the United States (U.S.). They also are one of the fastest growing business sectors in many areas of the country. Container ship-ments more than quintupled in the U.S. from 1980 to 2006, according to the American Association of Port Authorities (AAPA).�� As shown in Figure 3, shipments to and from U.S. ports rose from roughly 8.4 million twenty-foot equivalents (TEUs) to 44.4 million TEUs during this period. Over the last decade alone, container shipments rose 80.8 percent.
F�gure �
U.S. CONTAINER SHIPMENTS: �980-2006
(million TEUs per year)
1980 1982 1984 1986 1988 1990 1992 1994 1996 1998 2000 2002 2004 2006
45
40
35
30
25
20
15
10
5
0

�2
Every day, more than 50 ships burning bunker or diesel fuel with no air pollution control equipment berth at U.S. ports, where they daily unload more than 60,000 containers of consumer goods. While the ships are in port, generally a day or so, their engines usually keep running to generate power needed for onboard lights, electronic equipment and other auxiliary power demands. The containers are transferred dockside by more than 2,500 specially designed cargo handling vehicles and are eventually loaded onto rail cars and semitrailer trucks and sent on their way to U.S. consumers. Nearly three-quarters of all cargo containers leaving U.S. ports are carried on trucks. As a result, approximately 30,000 onroad heavy duty trucks routinely transport containers to and from major U.S. ports. Because most trucks pick up several containers in the course of a day, the total number of truck arrivals and departures is more than twice that number. Short haul trucks, called drayage trucks, operat-ing exclusively near the ports, are generally older and more polluting trucks that are near or even beyond the normal retirement age for such vehicles. They are major sources of local air pollution near ports, but they are also the hardest to clean up because their age precludes economic retrofitting with more advanced diesel engines or pollution controls. Roughly 20 percent of the containers leave ports by rail, usually in unit trains containing 100 cars, with two containers onboard each car. The unit trains, more than 50 of which leave ports daily, are assembled at rail yards with the help of switching engines that operate solely within the yard. Switching engines are frequently highly polluting, converted long-haul engines that are no longer economic to operate in long distance service. As environmental regulations have tightened in other sectors of the U.S. economy, air pollution from ports has emerged as an increasingly large and worrisome source of urban environmental degrada-tion. Most U.S. ports are now among the largest sources of air pollution in their cities and progress toward reducing that pollution has been slow. Public concern is rising, however, and public and private efforts to grapple with the complex challenge of reducing air pollution from ports are finally gathering momentum. These actions are most advanced at the adjacent ports of Los Angeles and Long Beach, California, but actions to reduce pollution are underway at virtually every port in the U.S. This is the first study to be based on field visits to the ten largest container ports in the U.S. The goal is to identify the specific environmental problems at each port, the development status of pollution control strategies, and the opportunities for alternative fuels and advanced technologies to play a role in reducing air pollution. Although the report summarizes all air pollution control efforts at the 10 ports, it focuses on the opportunities to replace imported diesel fuel—the most limited and expensive fossil fuel, which now powers virtually all port operations—with alternative fuels and advanced technologies that are cleaner, cheaper and more diverse.
The Top �0 Cont��ner Ports: B�g, D�verse �nd Grow�ng
The unloading of millions of containers that arrive each year on U.S. shores occurs at relatively few ports near major population centers.�6 Deep water ports are scarce and connections to local markets and the national transportation grid of railroads and interstate highways are critical to the economic success of ports. The top ten container ports investigated in this study handled 79.1 percent of all containers in 2006. Roughly one-third of all containers are unloaded at Los Angeles, the largest container port in the U.S., and at the second largest port in neighboring Long Beach. Combined, these two ports along San Pedro Bay are the fifth largest container port in the world—behind Singapore, Hong Kong, Shanghai and Shenzhen.��

��
Three other top 10 ports are on the West Coast, including Oakland, ranking 4th; Tacoma, at number 6; and 8th ranked Seattle. Four large ports are located on the East Coast. The port of New York and New Jersey (NY/NJ) along the shores of New York City and Newark and Elizabeth, New Jersey, is the largest East Coast port by far, and it ranks 3rd in the U.S. The other three East Coast ports are Savannah, Georgia (5th); Hampton Roads, Virginia (7th); and Charleston, South Carolina (9th). The final and 10th largest port is Houston, Texas, along the Gulf Coast. Table 1 shows recent trends in container handling at the top ten ports. The importance of the top 10 ports to the container industry is growing. A decade ago, in 1997, the top ten ports handled 70.2 percent of all containers. During the past ten years, the 10 largest ports grew by 103.8 percent, far exceeding overall growth across the entire industry and raising their share of the industry’s business by nearly 10 percentage points.
T��le �
TOP TEN CONTAINER HANDLING PORTS: 2006
(million TEUs per year)
Annu�l Growth
Port 2006 TEUs 200� TEUs 200�-2006 �99�-2006
Los Angeles 8,469,853 7,484,624 13.2% 186.2%
Long Beach 7,289,365 6,709,818 8.6% 108.0%
New York/New Jersey 5,092,806 4,785,318 6.4% 107.3%
Oakland 2,390,262 2,272,525 5.2% 56.1%
Savannah 2,160,168 1,901,520 13.6% 194.0%
Tacoma 2,067,186 2,066,447 0.0% 78.5%
Hampton Roads 2,029,799 1,981,955 2.4% 64.7%
Seattle 1,987,360 2,087,929 -4.8% 34.7%
Charleston 1,968,474 1,986,586 -0.9% 61.7%
Houston 1,606,360 1,594,366 0.8% 72.1%
Tot�l Top �0 Ports ��,06�,6�� �2,8��,088 6.�% �0�.8%
Tot�l U.S. Ports ��,���,�00 ��,968,��2 �.�% 80.9%
All ten top container ports are owned by public agencies. Table 2 shows the managing agencies for each of the ports and the selection process for the governing boards of the agencies. Four of the ports are run by boards selected by governors. Half of the board of the Port Authority of New York and New Jersey (PATH) is appointed by one of the governors of the neighboring states. Three boards are appointed by city mayors. Two boards are publicly elected by county voters. The final board is an array of appointees from several municipalities and counties.

��
T��le 2
TEN PORTS: GOVERNING BOARDS
Port M�n�g�ng Agency Bo�rd Select�on
Los Angeles Port of Los Angeles (POLA) Harbor Commission Appointed by City Mayor
Long Beach Port of Long Beach (POLB) Harbor Commission Appointed by City Mayor
New York/New Jersey Port Authority of New York and New Jersey (PATH) Appointed by Two Governors
Oakland Port of Oakland Appointed by City Mayor
Savannah Georgia Ports Authority (GPA) Appointed by Governor
Tacoma Port of Tacoma Elected by County Voters
Hampton Roads Virginia Port Authority (VPA) Appointed by Governor
Seattle Port of Seattle Elected by County Voters
Charleston South Carolina Ports Authority (SPA) Appointed by Governor
Houston Port of Houston Authority (POHA) Appointed by Several Cities and Counties
Several port authorities manage only seaports. Others also manage airports. PATH is uniquely broad, operating regional bridges, tunnels and transit services as well as seaports and airports. It also has extensive real estate holdings, including the site of the former World Trade Center in New York City. None of the ports is supported by taxpayer contributions. All receive their revenue from fees collected from the operation of the facilities they manage. The annual total operating revenues of the managing agencies for the top 10 ports covers a wide range. Hampton Roads collected $59.3 million in 2006, for example, while total revenue collected by PATH exceeded $3.0 billion. All port authorities own the waterfront property and the terminal facilities built on it to load, unload and transfer containers. They do not necessarily operate the terminal facilities, however. Four of the 10 ports are operated by the port authorities that own the terminals. The other six, including the four largest ports, are landlord owners. The terminals are leased to private operators. Whether or not a port authority acts as an operator or a landlord greatly affects its approach to implementing environmental protection programs. Clean up initiatives can be implemented directly by an operator. Landlords, on the other hand, don’t operate polluting equipment, so they cannot clean them up directly. However, port authorities that act as landlords nevertheless have a number of tools at their disposal to help motivate lessees to clean up. The two largest ports with the most ambitious clean-up programs underway, Los Angeles and Long Beach, are both landlord ports. A central component of their clean-up efforts is the use of Green Leases negotiated with private terminal operators. Green leases incorporate environmental protection requirements among their provisions. In some cases, terminal operators receive more favorable lease rates in exchange for expanded clean-up efforts. For example, ship owners that achieve a 90 percent compliance rate with a voluntary speed reduction program estab-lished to reduce emissions from ongoing ships visiting the ports are eligible for a 15 percent reduction in dockage fees. The first green lease was successfully negotiated in 2006. Size appears to have little effect on willingness to invest in pollution control equipment. The most progressive ports in California and the Northwest are quite diverse in terms of the size of their operating revenues. They are all much smaller than PATH, which is five times larger than the next largest port authority in terms of operating revenue. Yet, the environmental initiatives underway at PATH ports are far less ambitious than those at West Coast ports. The larger size of some managing authorities fre-quently results from their responsibilities to manage airports as well as seaports. This is true of PATH and the ports in Seattle and Oakland, for example. An interesting observation in the case of PATH and the

��
Port of Seattle is that the airports operated by them have been more aggressive in implementing clean-up programs. For example, the airports under their control have extensive and positive experience with the use of natural gas as a vehicle fuel for shuttle buses and taxicabs. Neither seaport is currently operating natural gas vehicle fleets, however, suggesting that a lack of communication between air and sea divisions at ports exists. In Oakland, the successful use of natural gas at the airport seems to have increased the confidence in its viability as a fuel at the seaport as well.
Env�ronment�l M�n�gement: The Entry Level
The process of grappling with the environmental challenges posed by large and growing port operations begins with the formation of a division within the port authority to direct pollution control programs. Nine of the 10 top ports have environmental departments within their management structures. Charles-ton appears to be the exception. The oldest of the nine environmental departments at the largest container ports was formed about a decade ago. The newest is less than one year old. The most basic role of environment departments is to assess compliance with government regulations. The Environmental Management System (EMS) established early this decade by PATH does this. PATH launched its EMS in January 2004. The EMS team has identified ten activities with significant environmental aspects and begun to develop remedial strategies for each of them. One measure under-way is Voluntary Tenant Environmental Awareness Training, which earned the American Association of Port Authorities’ Environmental Improvement Award in 2003. It trains port employees about environ-mental best management practices and green terminal design and construction practices. Environmental projects are reviewed by the Green Practices Task Force, comprised of PATH staff and terminal operators. Several other ports along the East and Gulf Coasts have followed the example set by PATH and created EMS programs of their own. The problem with most EMS operations, however, is that they focus primarily on environmental compliance, not on innovation. More proactive environment departments now in place at the five West Coast ports go well beyond the minimum standards of an EMS. They have precise environmental goals for the future and concrete initiatives in place to move toward those goals. The environmental departments at the ports of Los Angeles and Long Beach have worked for years to develop a joint strategy to reduce pollution. In November 2006, the ports adopted the Clean Air Action Plan to guide clean-up efforts in the decades ahead. Nearly $2.0 billion has been designated by the ports and state and local governments to help finance the implementation of more than 100 concrete pollution control programs. The ports of Seattle and Tacoma have also created a joint clean-up strategy. In May 2007, they joined the port of Vancouver to issue a collaborative draft report titled Northwest Ports Clean Air Strategy. The plan sets common goals, strategies and timelines that each port will strive to achieve.
D�esel Retrofits �nd Fuels: The St�tus Quo
The backbone of air pollution control efforts at U.S. container ports today are efforts to reduce emissions from diesel powered equipment through the following steps: the use of newer and cleaner diesel engines; the installation of pollution control equipment; and switching to cleaner grades of diesel fuel containing lower sulfur contents. The technology used to implement these measures in most cases is well advanced. In fact, most are already required for new onroad trucks by the U.S. Environmental Protection Agency (EPA) and the California Air Resources Board (CARB). Regulation of offroad trucks is not yet as rigorous as for onroad trucks, so the implementation deadlines facing port vehicles are frequently several years in the future. Moreover, regulation of rail locomotives, oceangoing ships and harbor craft is not yet compre-

�6
hensive, so regulatory standards are still evolving. However, trends suggest that diesel equipment used in these types of applications will be subject to stricter environmental standards in the near future. In fact, new regulations were proposed in March 2007 by the EPA, which, if implemented, could do this in the future.�8 All 10 ports have diesel emission reduction programs in place, collectively spending millions of dollars in public and private funds. The current environmental protection program at Hampton Roads, for example, has focused on replacing existing diesel engines in its 360 vehicle fleet of cargo handling equipment with newer engines that comply with stricter emissions standards already in place for onroad vehicles. A 2005 study of emissions showed that emissions decreased at the port due to these retrofits, even as cargo volumes increased. Overall, emissions from all cargo handling equipment have declined by 33 percent, despite a 55 percent increase in container volume. A program underway at PATH facilities in New York and New Jersey aims to switch cargo han-dling equipment vehicles from conventional diesel fuel to ultra low sulfur diesel fuel (ULSD) containing at most 15 parts per million (ppm) of sulfur a few years ahead of a federal requirement to do so. The program also includes installation of idling control equipment on yard tractors that shut off engines when the equipment is not moving. This program has reduced cargo handling equipment emissions by 30 percent, according to a 2005 analysis by PATH’s Green Practices Task Force. The reductions were achieved despite a 19 percent increase in the size of the cargo handling equipment fleet and a 25 percent jump in container volume. When considered on a per container basis, the program achieved a 48 percent air pollution reduction. Four of the Port of Tacoma’s five container terminals use ULSD. The cleaner fuel reduces emis-sions and also permits the use of advanced pollution control equipment to reduce emissions from diesel engines even more. ULSD is also being used in the locomotives for switching operations run by Tacoma Rail, a city owned division of Tacoma Public Utilities. This program was established in June 2006, five years ahead of the EPA requirement that it be in place. Several years ago, the EPA awarded a $75,000 grant to the Port of Tacoma to equip the port’s 30 straddle carriers with diesel oxidation catalysts to reduce particulate emissions from diesel engines. This retrofit project reduces sulfur dioxide by 1.0 ton per year and particulate matter by 0.94 tons, based on current annual fuel use. Tacoma Rail has also installed two idle reduction systems on its switching engines. The first is a SmartStart system that senses when a locomotive is idle and shuts off the combus-tion engine. The second is a Chem Hotstart diesel-driven heating system that keeps the engine oil and coolant warm enough to facilitate easy restarting when the locomotive again is needed to move railcars. Together these two idle control systems reduce fuel costs by over $550 per week. Most air pollution control efforts to date at Seattle have also focused on upgrading diesel engines in the cargo handling equipment fleet. These programs received state government support as part of the “Diesel Solution” effort by the Puget Sound Clean Air Agency. Moreover, in November 2005, the U.S. Environmental Protection Agency awarded the Port of Seattle’s Diesel Emissions Reduction Project a federal grant of $35,000. The two San Pedro ports have already reduced emissions from their container terminals by 24 percent for nitrogen oxides and more than 50 percent for diesel particulate matter compared to 2002 through the accelerated replacement and retrofitting of 600 vehicles in their cargo handling equipment fleets. The reductions have occurred even while cargo tonnage has increased by 30 percent. Diesel clean-up efforts facing container ships entering U.S. ports to date have been limited to requiring a switch to lower sulfur diesel fuel that usually contains between 1,000 and 2,000 ppm of sulfur. Although this is much cleaner than the average 27,000 ppm of sulfur found in the common bunker fuel burned in ships on the open seas, it is still much dirtier than the 15 ppm fuel now required by the EPA in all onroad diesel trucks. Another problem is that the requirements often apply only to the auxiliary engines, not to the main engines that provide propulsion power. The three ports in California and the
��
two in Puget Sound in Washington require the use of cleaner diesel fuels while ships are in their harbors. Introducing new, cleaner diesel equipment is an important short-term step helping to lower emissions. Most of these efforts will soon be required by public law, however, as they already are for vehicles in other economic sectors. Moreover, diesel pollution controls are not the cleanest options in many port applications, including some specialty port activities, such as power generation onboard ships at berth. Perhaps most importantly, continuing to operate diesel powered equipment does nothing to diversify fuel supply away from oil, the most limited and expensive fossil fuel.
Altern�t�ve Fuel Veh�cles Are Incre�s�ngly Attr�ct�ve Su�st�tute for D�esel
The best way to lower emissions and diversify fuel supply is to use alternative fuels and advanced tech-nologies. Fortunately, important steps are being taken at U.S. container ports that are leading global efforts to replace diesel with alternative fuels and advanced technologies. Natural gas is currently the leading alternative fuel being deployed in port vehicles. Five programs are currently underway at the California ports to deploy fleets of natural gas powered cargo handling vehicles. There is also interest in biodiesel, particularly at the two ports in the Northwest. Hybrid electric vehicle technology is beginning to enter the port market, too, although only a few prototype vehicles are under development. The use of new fuels and technologies is discussed in the next three sections.
N�tur�l G�s Veh�cles: The Le�d�ng Altern�t�ve
Programs to replace diesel fuel with natural gas are underway at the three largest container ports in California—Los Angeles, Long Beach and Oakland. These programs switch yard tractors, drayage trucks and rail yard switching engines from diesel to natural gas. Three demonstration projects are underway to test the use of liquefied natural gas (LNG) in yard tractors. The first project is testing LNG in two yard tractors first deployed in September 2005 at YTI Terminals in the Port of Los Angeles. Built by Kalmar Industries Corp., these LNG yard tractors are powered by dedicated natural gas engines from Cummins Westport. Earth LNG, formerly ALT Fuels, provides the LNG and the fueling station. The second project was launched in June 2006 at the Long Beach Container Terminal. The program involves use of three LNG yard tractors. A third yard tractor fleet entered service in May 2007 at a rail yard owned by the BNSF Railway Company serving the ports. Ten tractors are being tested at the BNSF Commerce yard. Parsec Inc., BNSF’s intermodal contract operator, acquired the 10 LNG yard tractors as part of a pilot program funded through a grant from the CARB. Clean Energy Inc. is providing the LNG and the fueling station for the project. A fourth natural gas yard tractor project has been announced for implementation at the ITS terminal in the POLB. Three LNG yard tractors will be tested as part of this project. The Clean Air Action Plan now in place for the ports of Los Angeles and Long Beach sets out a very aggressive program to replace approximately 5,300 onroad diesel trucks at the two ports with LNG trucks by 2011. The first implementation step was taken in June 2007 to convert onroad drayage trucks to natural gas when the South Coast Air Quality Management District (SCAQMD) announced a $2.9 million contract to deploy 20 LNG heavy duty engines in drayage trucks serving the ports. The port of Oakland is also deploying LNG in the fleet of drayage trucks serving the port. In 2007, Pacific Gas and Electric Company (PG&E) teamed with Burlington Northern Santa Fe Railroad to select 10 LNG drayage trucks. The trucks were put into service by a local “green” trucking company, CleanAir Transport. As part of a demonstration project, PG&E loaned CleanAir Transport a compressed natural gas (CNG) truck and an LNG mobile fueling station to fuel the LNG trucks. A permanent CNG

�8
fueling station was completed in the summer of 2007 by Clean Energy. A plan is being developed to add nine more trucks in the near future and 70 additional natural gas trucks to serve the port. BNSF is currently the only rail company in the nation to operate natural gas powered switching engines. These engines are in service in Los Angeles. The diesel engines in the conventional switching locomotive have been replaced with a 5,500 horsepower gas turbine with a thermal efficiency of about 40 percent and a specially designed high speed alternator. This smaller powertrain creates the room to add 44 natural gas storage cylinders that hold the equivalent of 5,500 gallons of diesel fuel. This will give the unit a range of 40 plus hours in a medium duty use cycle, about the same as existing locomotives. The Clean Air Action Plan also calls for testing of new switching locomotives powered by LNG.
B�od�esel: A Renew��le Altern�t�ve �n the Northwest
The two ports of Seattle and Tacoma on Puget Sound in the state of Washington are spearheading the use of biodiesel blends in their vehicle fleets. Biodiesel can be produced from a diverse set of renewable feedstocks, including soy beans, canola and restaurant wastes. Both ports are located in areas that cur-rently meet the national ambient air quality standards for ozone, which affects the choice of biodiesel. Emissions of nitrogen oxide increase with the use of biodiesel, but biodiesel has been shown to reduce emissions of particulate matter, the pollutant of greater concern in the Puget Sound area. Several terminals at the port of Seattle use blends of 20 percent biodiesel and 80 percent diesel (B20) in their ground vehicles or for their local fishing boats. In early 2006, the port also began using a particularly high concentration of biodiesel in its fleet of 60 to 70 administrative and maintenance vehicles that operate on the docks. During most of the year, the fuel is a blend of 99 percent biodiesel and 1 percent diesel (B99). Because fuel gelling problems have been reported in other programs from high con-centrations of biodiesel, the vehicles use 50 percent biodiesel blends (B50) when temperatures approach freezing in the Seattle area. The port uses about a million gallons of diesel fuel per year in its vehicles. In 2006, the Husky Terminal, an international shipping terminal at the port of Tacoma, became the first terminal at the port to begin using a biodiesel fuel blend in all of its cargo equipment to reduce air emissions. B50 is used most of the year. During cold periods in the winter when biodiesel gelling is a concern, Husky switches to B20. The cargo handling equipment burning biodiesel includes six rubber tired gantry cranes, 32 yard tractors and eight top picks. The port of Tacoma also uses lower biodiesel blends, between 2 and 5 percent, in its fleet of fewer than 100 vehicles operating throughout the port. It currently burns about 800,000 gallons of diesel annually in its fleet.
Hy�r�d Electr�c Veh�cles: The Newest Altern�t�ve
Converting cargo handling equipment to hybrid electric drivetrains offers another option to reduce air pollution at ports. Hybrid electric vehicles obtain a portion of their propulsion power from an electric drivetrain. An onboard energy storage system is recharged by a small onboard internal combustion engine. Although hybrid electric drivetrains raise vehicle costs substantially, they reduce fuel use, emis-sions and operating costs. Most hybrids today burn gasoline or diesel in their engines, but natural gas is also viable. A natural gas hybrid totally eliminates oil use in a very efficient drivetrain. Several years ago, the Hybrid Truck Users Forum (H-TUF) was created by Calstart, an advanced transportation consortium based in Pasadena, California, to help develop and commercialize hybrid electric systems suitable for use in medium and heavy duty trucks. To date, a number of H-TUF vehicle projects have been launched to commercialize this technology in delivery, utility repair and other specialty vehicle markets. The members of H-TUF are considering a new subcommittee to develop hybrid

�9
electric drivetrains for installation in port cargo handling equipment. Use of hybrid electric technology at ports is only beginning. Three applications of hybrid electric drivetrains are underway at the ports of Los Angeles and Long Beach. A project to develop hybrid powered cargo handling equipment has been underway at Long Beach since September 2006. The two-year, $1.2 million project will research, develop, build and test a hybrid yard tractor at the Long Beach Container Terminal’s Pier F facility. The project participants expect to select a hybrid electric drivetrain manufacturer before the end of 2007 and to have the three hybrid yard tractors operating in 2008 for a six month test. Foss Maritime Company, a marine transportation company based in Seattle, Washington, an-nounced in March 2007 that it plans to build the world’s first hybrid electric tugboat. The decision by Foss Maritime was made a few days after the port of Los Angeles pledged $850,000 to the project. Foss has agreed to station the new tugboat in southern California for five years. The Foss hybrid electric tugboat is scheduled to be delivered to southern California in 2008. It will be powered by batteries coupled with diesel generators and feature a modified engine room accommodating two 670 horsepower battery packs and two 335 horsepower generators. The Clean Air Action Plan calls for testing of new switching locomotives designed with hybrid electric drivetrains. RailPower Technologies, a leading developer of hybrid electric switching engines, plans to participate in this program. It has spent more than $1 million to date to develop its Green Goat, which reduces both particulate matter and nitrogen oxides by roughly 85 percent. It uses a 100 horsepower generator, as compared to 2,000 horsepower locomotive engines, to replenish power to a bank of lead acid batteries, cutting fuel use and lowering noise. Early tests were plagued by performance problems, however, including frequent battery fires, and this technology is not yet ready for commercial application. One program is underway in Seattle to test hybrid electric rubber tired gantry (RTG) cranes. A major container terminal tenant, SSA, is testing two RTGs in a closely monitored demonstration. One has a conventional diesel-fueled drivetrain. The second uses a hybrid electric drivetrain equipped with a supercapacitor to store and deliver electrical energy on demand. In September 2007, the EPA announced a project to develop and test a new EPA-patented hybrid technology on a yard tractor at a PATH container facility in New Jersey. The hybrid vehicle will feature a unique hydraulic hybrid power train that can generate, recover, store and reuse braking power with very little air pollution. The hydraulic hybrid technology is expected to improve the fuel efficiency of the yard tractor by 50 to 60 percent, reduce or eliminate emissions during idling, and decrease brake wear.
Cold Iron�ng w�th N�tur�l G�s or Gr�d Power: Needed Altern�t�ves
In port, the electricity used to power a ship’s onboard lights and other non-propulsion equipment is normally generated by the auxiliary engines onboard the ships burning whatever quality diesel is allowed in ships entering the port. This usually ranges from 2,000 to 27,000 ppm sulfur. Even the cleanest ship fuel is still much dirtier than the 15 ppm sulfur fuel now required for U.S. onroad vehicle engines. Shore power, often called cold ironing or alternative marine power, is an alternative to generat-ing power onboard ship. Shore power systems use electric power substations to connect berths to the main power grid, allowing ships to operate from the grid. Alternatively, power can be generated at small dockside generating units that use natural gas as the fuel and are independent of the grid. Major shore power programs based on grid power at container ship berths are underway at the ports of Los Angeles and Long Beach. The program at Los Angeles was launched in November 2002. The Clean Air Action Plan targets all berthed ships at its container terminals to use shore power within 5 years. Shore power will also be required for all frequent visitors to the Long Beach container terminals within

20
5 years. Los Angeles expects to invest $49 million of public funds in its shore side power program from 2006 through 2011, while investments at Long Beach are predicted to be $130 million. Oakland is the first port in the U.S. to introduce cold ironing technology at a container terminal that produces electricity on the dock using a natural gas fired generator. The dockside power unit is being provided by Wittmar Engineering & Construction, Inc. as part of a project scheduled to become operational late in 2007 at a cost of only about $1.0 million. The unit built for Oakland is small, about the size of a 40-foot ship container. It is mounted on a trailer that is easily moved from dock to dock to meet incoming ships as they arrive at their berths. Wittmar estimates that the power generator can supply electricity to 80 ships per year. In Seattle, no container ships are currently using cold ironing energy supplies. However, two cruise lines, Princess Cruises and Holland America, now use electrical shore power rather engine power when their ships dock in the city. This project eliminates 35 metric tons of turbine engine fuel per ship call, resulting in a total reduction of 1,400 metric tons of fuel during the 2005 cruise season. Estimated seasonal reductions are 7.7 tons of particulate matter and 203.5 tons of reduced sulfur oxides emissions. In 2006, a second shore power unit was built at the Holland America berth. Houston invested $1.4 million at the newly built Bayport Terminal to provide the infrastructure to carry electrical conduit cables that would be needed for cold ironing. This investment will lower the future cost of implementing cold ironing at the terminal. Savannah has commissioned a study into the potential for cold ironing at its port, and PATH has completed an assessment for its area.
Oce�ngo�ng Cont��ner Sh�ps: The Long Term Ch�llenge
Transoceanic ships are the largest source of air pollution at container ports. This pollution is due to the use of bunker fuel, the dirtiest grade of diesel, which is allowed under international law. The most pollut-ing fuel contains 45,000 ppm of sulfur, although most bunker fuel in common use contains about 27,000 ppm of sulfur. The two most practical options for U.S. ports to pursue to lower air pollution emissions from ships traversing port waters are to require fuel switching to better quality fuel while operating in port waters and to implement speed reductions. Both are being done at several U.S. ports. For example, instituting a speed limit of 12 knots between the ports and a 24 mile offshore boundary off Los Angeles and Long Beach has been estimated to result in a 40 percent reduction in nitrogen oxide emissions compared to ships traveling at 20 knots or more. Speed reduction programs are in effect at a number of other ports, mostly implemented for safety reasons, as in Houston and Savannah, because of the narrow channels container ships must traverse on their way to berths. Switching to cleaner diesel fuels requires ships to load limited quantities of cleaner fuels in separate auxiliary tanks. Beginning in 2007, CARB regulations require ships entering California waters to burn distillate fuel containing less than 2,000 ppm sulfur in their auxiliary engines while proceeding to port and in their main engines while at berth. Since the beginning of 2007, this higher quality fuel must be burned within 24 nautical miles of the port. The zone where the cleaner fuel is required will be extended to 40 miles offshore in 2008. CARB estimates that between 2007 and 2020 the new rule will reduce particulate emissions by more than 23,000 tons, nitrogen oxides by 15,000 tons, and sulfur oxides by 200,000 tons, preventing 520 premature deaths in the process. Although still in developmental stages, there are technologies being developed for onboard air pollution control devices that are small and light enough to be retrofitted onboard vessels. The most advanced is a venturi scrubber that uses seawater to wash roughly 80 percent of the sulfur dioxide and particulate matter out of ship exhausts. The world’s first cruise ship to feature a seawater exhaust scrub-ber set sail in May 2007 from Vancouver, British Columbia, Canada, destined for Alaska.

2�
The problem of air pollution from oceangoing ships while in ports is severe, but it is only one part of the global shipping industry that is in dire need of reducing its use of bunker fuel. Large trans-oceanic ships emit 14 percent of the nitrogen oxides, 5 percent of the sulfur oxides, and 2 percent of the carbon dioxide of all transport related emissions. According to a March 2007 report by the International Council on Clean Transportation, they emit more sulfur dioxide than the entirety of the world’s cars, trucks and buses combined.�9 These vessels are poorly regulated and their share of polluting emissions is likely to double by 2020, unless ambitious pollution control efforts are mounted before then. Ships that refuse to comply with local fuel quality or speed reduction requirements often have the option to select a different port based solely on its weaker environmental standards. The best approach to reducing pollution from ships, therefore, might be to negotiate environmental standards that can be implemented internationally and applied to all ships visiting all ports. The International Maritime Organization (IMO) has 162 member states and serves as an agency under the United Nations.20 The Protocol of 1978, commonly known as MARPOL, is the main international convention negotiated by the IMO. A first step toward reducing pollution from oceangoing ships occurred in May 2004 when Annex VI of the MARPOL convention covering air pollution and cleaner marine fuels was adopted. It gained the requisite number of international signatories to lead to its “entry into force” in May 2005, but the U.S. government has not ratified the annex. MARPOL has established special sulfur emission control areas (SECAs) where cleaner fuel use is required in small marine areas, such as the Baltic Sea, where ship traffic is great. SECAs are essentially stopgap measures put into place until comprehensive air pollution requirements are in effect globally. Several U.S. ports are urging the federal government to propose creating SECAs to cover portions of U.S. coastlines. In the long term, depletion of oil resources and environmental pressure are likely to force the international marine shipping industry to switch to another fuel altogether. There is already some experi-ence with natural gas use in ships. Oceangoing tanker ships carrying LNG have used boil off gases, which are created as cryogenic liquid fuels gradually warm despite heavy insulation, as a fuel since the first such tankers were built in 1964. Hydrogen may also offer considerable potential as a marine fuel. The 2006 World Hydrogen Energy Conference in Lyon, France, featured an analysis of international shipping that concluded it is technically feasible to build hydrogen powered ships that could achieve delivery times currently possible only by airfreight, but at a fraction of the cost. They studied the feasibility of powering a high speed foil-assisted catamaran capable of transporting 600 industry-standard containers. There are also many other feasibility studies that have been published, mostly in academic journals, assessing the potential for a variety of alternative fuels to substitute for bunker fuel on a global basis.
F�n�nc�ng Port Cle�n Ups: The Need for � N�t�on�l Str�tegy
The total cost for reducing air pollution at container ports in the U.S. will be huge. The total needed nationwide between now and 2020 will probably exceed $20 billion, or roughly $1.5 billion per year. To meet these needs, full use of all traditional funding sources, public and private, will be necessary. To date, most of the money funding port clean-up efforts has come from government sources. The largest single source is $3.0 billion in public bond money approved by California voters in November 2006. Port authorities are also independently financing clean-up programs. The Port of Los Angeles, for example, has committed to spend $177.5 million over the next five years and the Port of Long Beach will provide $240.4 million for its clean-up. The SCAQMD, a regional pollution control agency, has committed $47.0 million over the next five years. The U.S. EPA CleanPorts USA program finances a number of port clean-up projects annually. To date, the EPA has funded 11 port projects with a mere $1.9 million in federal funds. A variety of other government programs, including the Carl Moyer

22
Program and the Gateway Cities Clean Air Pilot Program in California and the Texas Emission Reduction Program in Texas, also provide funds for specific port clean-up efforts. The shipping industry, private terminal operators and railroads have contributed only modest sums to date to finance clean-up programs. Sound Energy Solutions in Long Beach is an example of a company that has contributed more than $1.0 million in private sector funds to demonstrate the use of LNG in cargo handling equipment. Another example is Maersk Line, which is conducting a pilot fuel switching program that is expected to remove 400 tons of vessel related emissions from the company’s fleet when it operates in California waters. Maersk has voluntarily switched from bunker fuel containing 27,000 ppm of sulfur to a cleaner distillate fuel containing less than 15,000 ppm sulfur. BNSF railroad has pioneered clean-up efforts at several of its rail yards serving ports. The alternative fuels industry is also contributing money for port clean up. Clean Energy, for example, is currently investing $55 million to build an LNG production plant and $10 million to build the fueling infrastructure at the POLA and POLB. The company is financing these investments using money obtained from a successful initial public stock offering completed in May 2007. As expensive as $1.5 billion per year to clean up U.S. container ports is, it is only a small percent-age of the value of imported goods contained in the containers. According to the AAPA, over $5.5 billion worth of goods moves in and out of U.S. ports every day. If containers account for half of this, container shipping is still a trillion dollar per year industry in the U.S. A $1.5 billion fee to cover air pollution control at ports would be less than 0.1 percent of the cost of products to the consumer. Looking at the impact solely on container shipping costs alone, the costs of air pollution abate-ment are also small. A typical TEU container costs about $500 to ship from Asia to California. With 44 million TEUs handled by U.S. container ports annually, total shipment costs are roughly $22 billion. Clean-up costs would account for just 7 percent of transoceanic shipping charges, and much less if the costs of shipping containers from the ports to markets is added to ocean shipping charges. California debated a strategy in 2006 that could provide a good model for a U.S. program to raise money for port clean-up. Senate Bill (SB) 760 passed the California legislature in September 2006 but was vetoed by Governor Arnold Schwarzenegger. The bill would have established a $30 per container fee for all containers unloaded at California ports. This money would have been collected by the state and used to fund environmental protection programs at ports throughout the state. Although a public program, the container fee would have collected revenue solely from industry causing the air pollution. Funding of the national toxic waste clean up provides a precedent for the successful use of this approach. Fees for the national “superfund” are collected from companies in the chemical industry and then dispersed for clean-up projects by the government.
Recommend�t�ons: C�lls for Act�on
Based on the findings of this research report, Energy Futures has developed five recommendations for public and private sector decision makers. The hope is that these recommendations will be considered as the national debate about how to combat the growing air pollution at U.S. container ports moves forward.
1. Promote Use of Alternative Fuels and Advanced Technologies for Port Clean Ups. The ability of diesel to meet the energy and environmental demands posed by container ports is already strained. Fuel supplies are insecure, costs are rising and pollution control strategies are not likely to achieve emission controls needed to protect public health as port business in constrained urban areas grows, especially if container traffic doubles by 2020 as predicted. Natural gas and biodiesel have already been shown to be viable substitutes for diesel fuel in port vehicles. Both alternative fuels are primarily produced domestically. Natural gas has the environmental

2�
advantages of lower tailpipe emissions, lower greenhouse gases and greater supply. The natural reserves can be supplemented by biomethane produced from renewable resources. Also, since dedicated natural gas vehicles burn no diesel fuel at all, they displace more diesel fuel than all the other alternative fuel and advanced technology vehicle options. Biodiesel has the advantage of being renewable, although its production can entail significant environmental challenges and impacts on food costs and availability. Its air pollution benefits are largely restricted to particulate matter. Hybrid electric technology is also promising and entering a broader demonstration phase in port vehicles. Although hybrids do not neces-sarily eliminate reliance on diesel, they operate much more efficiently and cleanly than conventional drivetrains and have the capability to burn alternative fuels. All three alternatives to conventional use of diesel receive favorable financial incentives in the form of tax credits and fuel tax relief in the Energy Policy Act of 2005. The creation of additional policy initiatives in support of their more rapid deployment in the market is being debated by the federal govern-ment and by the governments of many states where ports are located. New government programs are also needed specifically to promote use of alternative fuels and advanced technologies at the many unique port operations, such as for support power to berthed ships or powering cargo handling equipment.
2. Develop and Implement a National Port Clean-Up Strategy. Every port has a unique competitive position, but all ports are major sources of air pollution that share the same portfolio of pollution control op-tions. When operating alone to address environmental problems, each port must face the possibility that changes in its operating procedures could increase costs and place it at a competitive disadvantage to other ports. Several ports recognize this dilemma and are acting cooperatively to prevent adverse competitive repercussions from clean-up efforts. The joint Clean Air Action Plan now binding the adjacent ports of Los Angeles and Long Beach to a common pollution control strategy is one example of a local coopera-tive agreement. The Goods Movement Action Plan is an example of a move to link all ports in California together to a single set of principles. The Northwest Ports Clean Air Strategy binding three ports along Puget Sound, including one in Canada, is an example of a regional cooperative agreement. All three plans are less than one year old. The next logical step is to develop a national port strategy at the federal government level. This strategy should establish minimum clean-up targets for all ports and set long-term environmental objec-tives. The targets should be incorporated into new federal regulations to ensure compliance.
3. Create a National Funding Mechanism to Finance Uniform and Comprehensive Port Clean Up. A new national initiative to reduce air pollution at ports will require significant funding to be effective. New funding sources will need to be created using tax revenues or credits, loan funds, or port user fees as the revenue source. A national debate needs to be initiated that will develop a politically viable strategy to finance uniform and comprehensive port clean-up programs. A national container fee, similar to the one under debate in California, is a potentially attractive option for the federal government as well. A $30 per TEU fee would raise $1.3 billion, if implemented nationally. This is roughly equal to the annual clean-up costs estimated in this study to be required between now and 2020. A fee at this level would make an inconsequential impact on the cost to the consumer goods imported by container ship. It would also raise shipping costs by less than 10 percent. Airports already use such a federal program to fund environmental and other projects with funds collected through passenger facility charges. Another positive precedent for a container fee has been established by the superfund fee that chemical companies pay to finance the clean up of abandoned toxic waste dumps. A national container fee could collect money from all ports, but return it to them for use in funding pollution control programs. This would ensure a measure of equity and accountability.

2�
4. Advocate Global Environmental Standards in the International Arena: National leadership in port clean-up efforts would boost the credibility of the U.S. in international arenas, especially at the International Mari-time Organization (IMO) where maritime energy and environmental issues are debated. International diplomacy is vital to any long-term solution to port pollution issues. Many ports, the shipping industry and the AAPA have publicly urged the U.S. government to ratify the MARPOL Annex VI treaty adopted by the IMO in 2004, yet it has not done so. Without this endorsement, attempts by the U.S. to play a more active role in IMO deliberations are likely to be fruitless. When the U.S. elevates its involvement in IMO negotiation, the regulation of fuel standards for transoceanic ships is probably the most important priority. The entire global shipping industry is powered by notoriously filthy, but inexpensive, bunker fuel. The short-term goal must be to improve the fuel quality of the shipping industry’s fuel. An intermediate goal is to develop pollution control technology capable of reducing smokestack emissions. The long-term goal should be to replace bunker fuel entirely with an alternative fuel, such as natural gas or hydrogen, which are already being studied for use onboard ships.
5. Create a Clearinghouse of Public Information about Port Clean-Up Efforts: There is a lot of information in the public domain and more attention is being focused on ports as decision makers are becoming more aware of the adverse consequences of port air pollution. Nonetheless, there remains an urgent need for a national clearinghouse of information about environmental issues at ports. The lack of widely disseminat-ed information about environmental challenges at container ports, the pros and cons of the many options to reduce pollution, and the experiences of individual ports in assessing and addressing their environmen-tal issues are critical stumbling blocks to the emergence of an effective national port clean-up effort. This role is already being played in part by the AAPA, but its information is primarily for use by its members. Some individual ports and regulatory agencies also have excellent websites, but the informa-tion they post is mostly limited to local programs. A central clearinghouse would remedy these short-comings by providing information about environmental problems at ports and viable pollution control strategies. It would publish progress reports on the implementation of pollution control programs at individual ports. It would monitor development of federal, state and local government legislation and regulations with direct impacts on port activities. Finally, it would review progress at the IMO and other international organizations active on maritime issues.

2�
Chapter 3:Emissions from Port Operations
Container port operations can be divided into three sectors. The first is offshore and involves the passage of transoceanic ships to their berths, including the operation of tugboats to guide the ships through the harbor. The second involves activities exclusively conducted within the port boundaries. These activities include the generation of power for use by berthed ships, the unloading of containers from the ships and their transfer by cargo handling equipment to vehicles capable of carrying them to markets. The third includes the trucks and trains that originate within or near the port, but which leave the ports on highways and rail lines to serve distant markets. Each sector is a major source of air pollution. There is no comprehensive inventory of air emissions by ports around the country. Several studies have assessed emissions from individual ports or ports within a region or state. A representative emission inventory for the combined ports of Los Angeles and Long Beach shows the following contributions to particulate matter emissions by five major source categories: 2�
• Transoceanic ships: 59% • Harbor craft: 11% • Cargo handling equipment: 14% • Heavy duty onroad regional trucks: 10% • Rail locomotives: 6%
A California statewide inventory was completed by the California Air Resources Board (CARB) in April 2006. Called the Emission Reduction Plan for Ports and Goods Movement in California, the report includes projected emissions in 2020 after implementation of a broad range of pollution control initiatives.22 The results, shown in Table 3, show only limited anticipated success in controlling ship and harbor craft pol-lution, especially for sulfur dioxide. On the other hand, the inventory shows major reductions predicted for emissions from cargo handling equipment and onroad trucks.

26
T��le �
EMISSION TRENDS FROM CALIFORNIA PORTS BY SECTOR
(tons per day)
Pollut�ntSh�ps �nd H�r�or Cr�ft
C�rgo H�ndl�ng Equ�pment Onro�d Trucks Locomot�ves
D�esel P�rt�cul�te M�tter
2001 11.6 0.8 40.2 4.7
2020 25.1 0.2 6.3 4.5
Percent Change 116.4% -75.0% -84.3% -4.3%
N�trogen Ox�des
2001 170.0 21.0 655.0 203.0
2020 293.0 6.0 255.0 139.0
Percent Change 72.4% -71.4% -61.1% -31.5%
Sulfur D�ox�de
2001 61.0 <1 6.0 8.0
2020 181.0 <1 2.0 1.0
Percent Change 196.7% 0.0% -66.7% -87.5%
Similar distributions of emissions from port activities have been reported by other locations. For example, the Puget Sound Maritime Air Emissions Inventory, released in April 2007, found that maritime sources in Puget Sound, which includes both Seattle and Tacoma ports, account for a significant amount of local air pollution: 33 percent of sulfur dioxide emissions, 28 percent of diesel particulate matter emissions and 11 percent of nitrogen oxide emissions.2�
Tr�nsoce�n�c Sh�pp�ng
Transoceanic ships are the largest source of air pollution at container ports. In fact, large transoceanic ships are arguably the worst mobile source polluters on the planet. The 90,000 registered ocean going vessels worldwide are estimated to emit up to 3 percent of the total world inventory of greenhouse gas emissions. Vessels also emit nitrogen oxides, another pollutant that contributes to global warming. Ships emit about five to six times more nitrogen oxides than aircraft annually worldwide. In addition, nitrogen oxide emissions contribute to the formation of ozone, a severe local pollution concern in most major cities.2� Marine vessels emit 14 percent of the worldwide nitrogen oxide emissions and 5 percent of the sulfur oxide emissions. According to a March 2007 report by the International Council on Clean Transportation, oceangoing vessels emit more sulfur dioxide than the entirety of the world’s cars, trucks and buses combined.2� These vessels are poorly regulated and their share of polluting emissions is likely to double by 2020, unless ambitious pollution control efforts are mounted before then. In October 2007, California Attorney General Jerry Brown Jr. joined three national environmental organizations to petition the EPA to adopt strict greenhouse gas regulations for ocean going vessels. The petition asks the EPA to make specific findings that ships significantly contribute to global warming.26

2�
The high pollution load of ships is a direct result of notoriously filthy bunker fuel, the dirtiest grade of diesel, which they are allowed to burn under international law. According to the International Organization for Standardization, 19 categories of marine residual fuels are available internationally. The most polluting contains 45,000 parts per million (ppm) of sulfur. By comparison, the new ultra low sulfur diesel fuel standards that took effect in the United States (U.S.) in October 2006 limit the sulfur content in diesel motor fuel for onroad trucks to a maximum of 15 ppm, 1/3,000th the maximum allowed in marine fuel. The sulfur in fuel is converted to sulfur dioxide air pollution when fuel is burned. Higher sulfur content fuels also release higher levels of nitrogen oxides and particulate matter than cleaner fuels. The average bunker fuel used in ships is somewhat cleaner than the maximum allowable, con-taining an estimated 27,000 ppm of sulfur. Even so, burning this fuel means that an average transoceanic container ship arriving at a port will emit more diesel air pollution than would a regional or long haul truck carrying a container away from the port driving three trips around the world.
Transoceanic ships, to date, are not built with pollution control devices, and there are no inter-national standards requiring the use of even rudimentary controls. Therefore, the amount of pollution emitted by a ship when it enters a U.S. port is governed mainly by the quality of the fuel it is burning and the speed the ship is traveling, which affects its fuel consumption and emissions. In the short term, the two most practical options for U.S. ports to pursue to lower air pollution emissions from ships traversing port waters are to require fuel switching to better quality fuel while operating in port waters and to imple-ment speed reductions. Both are being done at several U.S. ports. A speed limit of 12 knots between the ports and a 24 mile offshore boundary off the Los Angeles port now in effect has been estimated to lead to reduced nitrogen oxide emissions from cruising ships by 40 percent compared to ships speeding to docks at speeds of 20 knots or more.2� No ship or fuel modifi-cations are needed to implement speed reduction programs. Speed reduction programs are in effect at a number of other ports, sometimes implemented for safety reasons, as in Houston and Savannah, because of the narrow channels container ships must traverse on their way to berths. Switching to cleaner diesel fuels requires ships to load limited quantities of cleaner fuels in sepa-rate auxiliary tanks. This fuel is either carried across the ocean or purchased from barges in U.S. waters. Maersk Line is currently conducting a pilot fuel-switching program that is expected to reduce 400 tons of vessel related emissions from the company’s fleet when it operates in California waters at the ports of Los Angeles and Oakland. Maersk has voluntarily switched from bunker fuel containing 27,000 ppm of sulfur to a cleaner distillate fuel containing less than 15,000 ppm sulfur when traveling in U.S. waters. In 2005, the CARB adopted a regulation requiring ships entering California waters beginning in 2007 to burn distillate fuel containing less than 2,000 ppm sulfur in their auxiliary engines. This higher quality fuel must be burned within 24 nautical miles of the port in 2007. Use of the cleaner fuel must begin 40 miles offshore in 2008. CARB estimates that between 2007 and 2020 the new rule will reduce particulate emissions by more than 23,000 tons, nitrogen oxides by 15,000 tons, and sulfur oxides by 200,000 tons, preventing 520 premature deaths in the process.
F�gure �
Sh�p �t �erth �n the
Port of Los Angeles

28
Shortly after adoption of the CARB rules, the Pacific Merchant Shipping Association challenged their legality in a lawsuit filed in the U.S. District Court for the Eastern District of California. In February 2007, the Natural Resources Defense Council and the Coalition for Clean Air announced their intent to join the battle to defend the CARB regulation.28 As of July 2007, the lawsuit was still pending. Meanwhile, the CARB commenced a series of public hearings in June 2007 to consider a new rule to extend the border to 100 miles offshore. Unfortunately, the cleaner fuel requirement does not extend to the main engines of ships, which are the primary fuel consumer. The Marine Vessel Emissions Reduction Act was introduced in May 2007 in the U.S. Senate by the two California senators and in the House of Representatives by four California members of Con-gress.29 It seeks to limit the sulfur content of fuel for ships in U.S. ports to 1,000 ppm by 2010. Europe has already adopted a 1,000 ppm sulfur limit for vessels at berth, also with an implementation date of 2010. Although still in developmental stages, there are technologies being developed for onboard air pollution control devices that are small and light enough to be retrofitted onboard vehicles. The most advanced is a venturi scrubber that uses seawater to wash roughly 80 percent of the sulfur dioxide and particulate matter out of ship exhausts. The contaminated water is returned to the ocean, limiting the practicality of this approach, especially while ships are in ports and pollution controls are most needed. The world’s first cruise ship to feature a seawater exhaust scrubber set sail in May 2007 from Vancouver, British Columbia, Canada, destined for Alaska. The Holland America Zaandam was fitted with a scrubber unit that cost more than $1.2 million.�0 In the long term, declining oil resources or environmental pressure might cause the interna-tional marine shipping industry to switch to another fuel altogether. There is already some experience with natural gas use in ships. Some oceangoing tanker ships carrying LNG have used boil off gases, which are created as cryogenic liquid fuels gradually warm despite heavy insulation, as a fuel since the first such tankers were built in 1964. Natural gas has also been used to power ferry boats. The Glutra passenger and automobile ferry operating in Molde, Norway, for example, has been burning natural gas since February 2000. It is one of the largest of about ten ships powered by LNG.�� Hydrogen may also offer considerable potential as a marine fuel. Researchers at the University of Southampton told the audience at the 2006 World Hydrogen Energy Conference in Lyon, France, that it is technically feasible to build hydrogen powered ships that could achieve delivery times currently possible only by airfreight, but at a fraction of the cost.�2 They studied the feasibility of powering a high speed foil-assisted catamaran capable of transporting 600 industry standard containers at speeds of up to 64 knots across the Pacific Ocean to connect the Chinese port of Shanghai with Los Angeles. There are still many technical and economic obstacles that currently face hydrogen powered ships, however.
H�r�or Cr�ft
An average of two tugboats per ship are needed to guide transoceanic ships through harbors and into their port berths. Tugboats are voracious fuel consumers given their small size because of the huge engines they require to guide ships in areas too cramped for ship steering systems. Tugboat engines typically have a total of 5,000 horsepower. When they are maneuvering ships, the engines operate at high power output with high air pollution output as well, but even when idling at lower output their air pollution emissions are significant. Tugboats frequently spend up to 50 percent of their time idling, with the main engines on and ready to respond, but with no power actually being used for propulsion. Several ports already regulate the quality of fuel burned in harbor craft. The CARB, for example, requires the use of low sulfur diesel fuel in all harbor craft in California ports. In March 2007, the U.S. EPA proposed regulations that, if promulgated, would reduce air pollution from marine diesel engines in harbor craft by setting tighter federal emission standards. When fully implemented, the rule could

29
cut particulate matter emissions from these engines by 90 percent and nitrogen oxides emissions by 80 percent. Standards for new marine diesel engines would phase in starting in 2009. Long-term standards would phase in beginning in 2014 for marine diesel engines. Tugboats can be retrofitted with pollution control devices to reduce emissions or be required to use cleaner grades of diesel. They are also candidates for the use of alternative fuels or advanced propul-sion systems. Although natural gas is used in a number of cities around the world to power ferry boats, it has not yet been applied to tugboats. However, Foss Maritime Company expects to deliver the world’s first hybrid electric tugboat to the Port of Los Angeles in 2008. The diesel hybrid electric tugboat’s drivetrain will be powered by batteries coupled with diesel generators.
Port Oper�t�ons
There are two aspects of port operations that lead to high air pollution emissions. The first is the opera-tion of ship boilers at berth to generate auxiliary electrical power consumed by the ship’s vital equipment while docked. Secondly, there are hundreds of pieces of cargo handling equipment used dockside to transfer containers to trucks and railcars that carry them away from the port.
Cold IroningMost container ships are propelled by a very large low-speed diesel engine. Onboard electrical power is provided by three to five auxiliary diesel engines, ranging in size from 500 kW to 3 MW each.�� Ships are typically at berth from six hours, or one tide, to three days. Short stays are the norm at ports along the East Coast, where only a portion of the containers onboard a ship are unloaded at any port. The ship then moves several hundred miles up or down the coast to unload containers at other ports. Three-day stops are most common at the San Pedro ports in California, where huge ships from Asia dock to completely unload their cargo before returning to Asia. A total of 344 different container ships called on California ports in 2005. Ships returning to a port six or more times a year, called “frequent flyers,” account for about 70 percent of the total container ship visits. In port, the electrical power used to power onboard lights and other nonpropulsion equipment is generated by the auxiliary engines. While at berth, a small container ship will have a power demand of 600 kilowatts (kW), while a large ship will consume 1.2 megawatts (MW) or more of power. The onboard electrical power and voltage requirements widely vary among transoceanic vessel types and the country of manufacture. Most oceangoing vessels are configured for 440 to 480 Volts, although larger and newer container ships are configured for 6.6 kilovolts (kV). The current practice for most ships is to use their auxiliary engines to generate power using diesel fuel stored onboard, either bunker fuel in cases where no fuel quality requirements are in place or some-what cleaner distillate fuels where they are. Although cleaner than bunker fuel, the distillate fuels allowed in auxiliary engines in ships at berth are still much dirtier than fuels allowed in onroad vehicle engines. Even coal-fired power plants release only a fraction of the air pollution emitted by marine diesel engines. Supplying power generated on land to docked ships is an alternative to generating power onboard ships while at berth. Use of land power is called “cold ironing,” a term derived from operations at dry docks, where ship repairs cannot be undertaken until all fuel burning systems onboard are shut down, allowing the ship’s iron components to become cold and serviceable. Other terms for land power for use on ships are shore power or alternative marine power (AMP).
Grid Electricity: In order to use grid power, equipment must be added to ships to allow the importing of power from the dock. A transformer is often needed to increase or decrease the voltage to a ship. A transformer can only be added to a wharf or a ship if enough space is available. The average cost for

�0
retrofitting oceangoing vessels is $500,000 per ship without an onboard transformer and $1.5 million per ship with an onboard transformer. In addition, adding shore side infrastructure is costly, running between $1 million and $7 million per berth at ports where cold ironing has been implemented. Once at berth, it takes about 90 minutes to turn off onboard boilers and connect cables to transfer land power onto a ship. This process must be reversed when the ship prepares to leave. Cables used for cold ironing must be stored when ships are not connected to shore power. These cables and the reels that house the extra lengths of cable must be stored either at the dock or on the ship. As with transformers, having enough space on a dock or on a ship for this equipment is an issue. Once the basic infrastructure to transfer land power at the right voltage and wattage onboard ships is in place, there still are further major cost and logistical issues involved with this approach, but the air pollution reductions are large. An analysis by CARB found that emissions after the switch to cold iron-ing were reduced between 70 and 74 percent for nitrogen oxides, particulate matter and hydrocarbons. Cold ironing with grid electricity will increase the electric power demand for a port, potentially straining local power infrastructure. The problem in most cases is not the lack of power on the grid. While the local electric demand of a berth ship is large, it is small compared to the capacity of the total power grid. For example, the CARB estimates that cold ironing at all California ports could create a demand of 190 MW by 2010 and 523 MW by 2020. The current peak statewide energy demand is approximately 57,000 MW and is expected to grow to about 75,000 MW by 2020. The electricity demand from cold ironing implementation, therefore, would represent about one percent of the total energy peak demand. The adequacy of the local grid power delivery system is another story. Shore side infrastructure needs are site specific and can vary widely. Modifications to the existing electrical infrastructure may be required to bring adequate power to specific terminals. High voltage and current power conduits must be built to connect the power grid to the pier. These are usually buried for safety reasons and to prevent interfer-ence with dock activities. New electrical substations might be needed to regulate power supplies to ships. The fact that most ships are not frequent flyers, and the short stays of many ships at ports and the need for ships to be modified to accept shore power while at port, suggest that there might be better op-portunities to reduce pollution from berthed ships than using grid power for container ships. Most early cold ironing projects focus on cruise ship terminals, which service ships dedicated to serving the port. For example, two cruise terminals in Seattle have built cold ironing systems providing grid power to cruise liners traveling exclusively between Seattle and select Alaskan ports. Another factor favoring cruise liners is that their power demand while at port is much greater than a container ship. Power is needed for individual rooms, for example, which must be cleaned while at port. Container ships, by contrast, have relatively few areas where electricity is needed at port.
Dockside Generation Using Natural Gas: Another alternative to generating power onboard ships while docked is to supply power generated on land using much cleaner technology than ship boilers. Wittmar Engineering & Construction, Inc., based in Signal Hill, California, has developed a modular onshore electrical generation system powered by natural gas. These units are small—about the size of a 40-foot ship container—and they can be easily moved from dock to dock to meet incoming ships as they arrive at their berths. Wittmar estimates that each onshore power generator could supply electricity to 80 ships per year.�� The lower cost of small-scale dockside power generators and their mobility to service several berths are advantages of this approach. Moreover, the Wittmar cold ironing system uses a dual frequency multi-voltage system capable of generating electrical power at either 50 or 60 Hertz and voltages ranging from 380 to 460 Volts. This flexibility allows the system to meet the power needs of virtually any ship design arriving at port. A standard unit provides 725 kW of power, but multiple units can be coupled to provide greater power supplies for larger ships. Power generation is provided by a stationary natural gas engine burning either compressed or liquefied natural gas (LNG). Wittmar estimates that its cold ironing system would burn 4,752 gallons of LNG during a typical 2-day stay at dock for a container ship. This

��
would displace 3,840 gallons of diesel bunker fuel. Emission reduction rates on average are greater than 95 percent with LNG use. Wittmar has built the first natural gas cold ironing system at the Port of Oakland, California. It hopes to sell 43 units to ports around the U.S. by 2012. At roughly $1.0 to $2.0 million per unit, the Wit-tmar cold ironing unit is often much less expensive than building electrical power lines and substations to provide grid power to docks.
Cargo Handling EquipmentOnce removed from ships by large fixed electric cranes, containers are transferred to rail and trucks by specially designed cargo handling equipment. The major category of cargo handling equipment used at ports is yard tractors, also called hostlers. Operating within port terminals, they are essentially scaled down versions of heavy duty trucks that operate on public roads at highway speeds. Yard tractors oper-ate only at low speeds and are powered by medium duty engines, roughly 6.0 liters in size, producing between 100 and 250 horsepower.��
Rubber tired gantry and smaller straddler cranes are other examples of cargo handling equip-ment. Both are U-shaped moveable hoists on wheels used to stack containers while they are awaiting assignment to trucks and rails for transit off the port. Finally, there are smaller cargo handling vehicles—including top picks, side picks and forklifts—capable of moving individual containers short distances between storage stacks and yard tractors or between yard tractors and regional trucks or railcars.
The engines in most cargo handling equipment meet offroad emission standards that allow more air pollution than the current standards for onroad engines. Regulation of offroad diesel equipment generally lags a few decades behind the regulation of onroad diesel trucks. The first emission standards
F�gure �
LNG y�rd tr�ctor
�e�ng tested �t Port
of Los Angeles
F�gure 6
Ru��er t�re g�ntry
�t T�com�

�2
for offroad heavy diesel equipment were not established until 1996. Fuel quality standards for offroad cargo handling equipment are also generally weaker than the tight standards now in place for fuels used by onroad vehicles. Fuel standards for use in offroad vehicles will not be tightened to the levels now required for onroad trucks until the early part of the next decade. Cargo handling equipment is probably the most significant source of port emissions contributing to regional and community pollution because their emissions occur near residential areas bordering the ports. Strategies that could reduce emissions from cargo handling equipment include the use of less polluting diesel fuels or onroad diesel engines in yard trucks, installation of pollution control retrofit equipment on diesel engines, modernization of fleets and greater use of cleaner alternative fuels, like natural gas, and electricity. Replacing the offroad engines now powering most cargo handling equipment with newer, onroad engines can produce significant emissions benefits, especially when the engines being replaced are older and, therefore, more polluting. Tier 4 engine regulations from the EPA require significantly tighter standards for offroad equipment, but the rule phases in gradually from 2008 to 2015 and covers only new equipment. Depending on the size of the engine, Tier 4 standards are 67 percent to 89 percent more stringent than Tier 2 standards currently in effect for nitrogen oxides and 50 to 95 percent lower than current Tier 2 standards for particulate matter. Several retrofit control devices can reduce diesel particulate matter and nitrogen oxides emis-sions. The best available pollution control equipment includes diesel particulate filters, lean nitrogen oxide catalysts and diesel oxidation catalysts. These devices, which have been approved by the CARB for use in cargo handling equipment, are capable of achieving at least 85 percent diesel particulate matter reduction and 80 percent reduction in nitrogen oxide emissions. Retrofit devices are particularly ap-propriate for use on newer cargo handling equipment, which is not equipped with advanced pollution control devices, but is not yet nearing the end of its economic life. The two San Pedro ports have already reduced emissions from their container terminals by 24 percent for nitrogen oxides and more than 50 percent for diesel particulate matter compared to 2002 through the accelerated replacement and retrofitting of cargo handling equipment. The reductions have occurred even while cargo tonnage has increased by 30 percent. More than $2 million in CARB and EPA funds have been spent to retrofit more than 600 pieces of cargo handling equipment with diesel oxida-tion catalysts alone.�6 Increasing the use of cleaner alternative fuels, such as natural gas, or advanced technology, such as various electric vehicle systems, are perhaps the most attractive options for achieving diesel emission reductions from cargo handling equipment, both in terms of the pollution reductions they achieve and their freedom from reliance on imported oil. There are currently three natural gas demonstration projects underway at the San Pedro ports in southern California. The projects use natural gas engines from Cummins Westport, an advanced heavy duty engine developer based in Vancouver, British Colum-bia, Canada. The company is currently the only manufacturer marketing heavy duty natural gas engines suitable for powering very large trucks. Outside the U.S., a repowering project involving deployment of two CNG powered yard tractors at the Bangkok Laem Chabang Sea Port was launched in the summer of 2007. The two UTR container handling vehicles, owned by LCB1 Ltd., are equipped with 5.8 liter CNG engines from Omnitek En-gineering, a developer of natural gas engine systems based in San Marcos, California. These engines replaced the conventional diesel-burning Cummins 5.9 liter engines originally installed in the trucks. The engine of a third UTR vehicle is also being converted from diesel to CNG. A short evaluation period will determine the economics and performance of the repowered trucks. LCB1 Ltd. operates approximately 200 UTR trucks at the Bangkok port. Thailand natural gas supplier PTT has installed CNG refueling infrastructure at the seaport.�� Converting cargo handling equipment to hybrid electric drivetrains offers another option.

��
Although hybrid electric drivetrains raise vehicle costs significantly, they reduce fuel and other operating costs. Several years ago, the Hybrid Truck Users Forum (H-TUF) was created by Calstart, an advanced transportation consortium based in Pasadena, California, to help develop and commercialize hybrid electric systems suitable for use in medium and heavy duty trucks.�8 To date, a number of H-TUF vehicle projects have been launched to develop hybrid electric technology for use in delivery, utility repair and other specialty vehicle markets. The members of H-TUF are considering a new subcommittee to develop hybrid electric drivetrains for installation in port cargo handling equipment.
Onro�d D�esel Trucks
Approximately 30,000 onroad heavy duty semitrailer trucks routinely transport containerized and bulk cargo to and from the 10 largest container ports in the U.S. Because most trucks pick up several contain-ers in the course of a day, the total number of truck arrivals and departures, called truck “gates,” are over 70,000 per day. Trucks that transport containers to and from ports are almost universally large class 8 tractors with maximum hauling capacities up to 80,000 pounds. Roughly three-quarters of all cargo containers leaving U.S. ports are carried on these trucks. Most of the remainder leave by rail.
There are two categories of heavy duty onroad trucks serving the ports.�9 The first are short haul trucks, called drayage trucks, which frequently make several trips each day between the ports and intermodal transfer points near the ports, where they are transferred to regional transport vehicles. The second truck category includes onroad trucks that leave the ports bound for regional distribution centers or distant markets. Drayage trucks are generally older and more polluting trucks that are near or even beyond retirement age. They are major sources of local air pollution near ports, but they are also the hardest to clean up because their age precludes the economic retrofitting with more advanced diesel engines or pollution controls. They are immune to CARB and EPA requirements that require cleaner equipment in new trucks. Most drayage trucks are driven by independent operators in an economically competitive busi-ness that generates low profit margins with little ability to increase rates to cover the costs of complying with potential emission reduction strategies. Port truck owners rely on dispatching companies to arrange port container pickups. The dispatchers, in turn, contract with port terminals to transport containers or bulk cargo. Drayage truck drivers in southern California frequently earn only about $30,000 per year af-ter deducting annual operating costs, such as fuel, maintenance, and mandated fees from gross revenues. Thus, there is little money to finance expensive clean-up projects to reduce air pollution. Nearly all trucks serving ports are powered by heavy duty diesel engines that emit particulate matter, nitrogen oxides and other air pollutants known to increase health risks to nearby residents. The
F�gure �
Onro�d trucks
�t S�v�nn�h

��
communities closest to the ports and adjacent to heavily traveled freeways are subject to even greater im-pacts and have a greater localized risk due to exposures to unacceptably high levels of diesel air pollution. The options to reduce air pollution for regional or long haul trucks are basically the same as for cargo handling equipment. Diesel engines can be repowered with newer and cleaner models, air pol-lution devices can be installed and the quality of the diesel fuel can be improved. Regulatory programs from the EPA and CARB already require major pollution reductions from new diesel trucks and the use of cleaner diesel fuel in all trucks. The new EPA fuel quality standards, which set a maximum sulfur con-tent in all diesel fuel of 15 parts per million, took effect in October 2006. New engine standards from the EPA and CARB went into effect with model year 2007 engines. A second round of pollution reductions is set to take effect with 2010 model year engines. As a result of these standards, air pollution from new onroad diesel engines will drop by over 90 percent after 2010 compared to emissions allowed for engines built before 2007. Trucks can also switch to run on cleaner alternative fuels or be replaced by trucks with advanced hybrid electric drivetrains. Both alternatives are doing well in specific heavy duty vehicle markets, particularly in buses and refuse collection vehicles, but their application to container-carrying trucks is only beginning. The first fleet of natural gas trucks serving ports was launched at the Port of Oakland in January 2007. The 10 trucks connecting the port with a nearby intermodal rail yard are equipped with Cummins Westport engines and have performed so well that additions to the natural gas fleet are planned. To date, no heavy duty trucks powered by hybrid electric drivetrains are serving U.S. ports, but future efforts by H-TUF or others could change this.
R��lc�rs
A little more than 20 percent of the 45 million containers unloaded or loaded at U.S. ports travel to or from their final markets by rail. Assuming two containers, or 4 TEUs, per car, this means that roughly 6,000 railcars leave or arrive at U.S. container ports each day. Compiled into unit trains of 100 cars, more than 100,000 unit trains serve U.S. ports each year, or about 300 per day. Overall, locomotives are a more energy efficient way to transport goods than trucks, but train en-gines are less heavily regulated than trucks and therefore more polluting. A key component of rail trans-portation is the creation of trains at rail yards where switching locomotives are used to maneuver railcars into position on long haul trains. Switching locomotives never leave a rail yard, but they are heavily used. They operate inefficiently at low speeds and they predate most emission standards. They also tend to idle about 75 percent of the time, burning fuel in large combustion chambers without performing any work. Although some engines have been designed and built specifically for use in switching yards, a common practice by rail companies is to use old long haul engines in switching operations when they reach the end of their reliable service life for long haul use. This practice means that old, highly polluting engines are common at switchyards, performing short haul duties for which they were not specifically designed. Options to reduce air pollution from switching and long haul locomotives include replacing or repowering older locomotives with newer models designed for switching service; installing idling control devices to reduce engine idle time; use of cleaner fuels, such as lower sulfur diesel fuel or natural gas; or switching to more advanced locomotive drivetrains, such as hybrid electric drivetrains, that improve efficiency and lower emissions. The CARB has developed a program to reduce locomotive and rail yard emissions through a combination of voluntary agreements, state and federal regulations, and funding programs.�0 Several years ago, the CARB signed a pollution reduction Memorandum of Understanding (MOU) agreement with Union Pacific and Burlington Northern-Santa Fe Railway that commits the companies to reduce pollutant emissions from 17 rail yards operating throughout the state. When fully implemented, the

��
agreement is expected to achieve a 20 percent reduction in locomotive diesel particulate matter emis-sions near rail yards. The new MOU is supplemental to an earlier MOU signed in 1998. The March 2007 EPA proposed regulations, if promulgated, would establish a new program to significantly reduce air pollution from locomotive engines. The rule would tighten emission standards for existing locomotives when they are rebuilt and set stringent emission standards for new locomotive engines. It would cut emissions from all types of diesel locomotives, including line haul, switch and pas-senger rail. The locomotive remanufacturing proposal would take effect as soon as certified systems are available, as early as 2008, but no later than 2010. Standards for new locomotives would phase in starting in 2009. Long-term standards would phase in beginning in 2015. The replacement of pre-1973 switching locomotive engines with new equipment provides sig-nificant emission benefits. One option is to replace retired long haul engines equipped with single large engines with newer switching locomotives that include three smaller engines. This allows the locomotives to idle using only one of the engines, thereby reducing fuel consumption and pollution. In July 2007, Union Pacific completed replacement of its entire fleet of switcher locomotives at its Commerce rail yard serving the San Pedro ports with new locomotives equipped with multiple genset power generation units. Each locomotive is powered by three 700 horsepower nonroad Tier 3 certified diesel engines. Union Pacific has purchased 60 new genset switcher locomotives to replace many of the 95 older locomotives currently being used in Los Angeles Basin rail yards. Another project is underway by Pacific Harbor Lines to deploy new locomotives at the ports of Los Angeles and Long Beach. Using cleaner grades of diesel fuel and installing anti-idling devices on engines are other options to reduce pollution at switchyards. Under an MOU signed with the CARB, railroad companies have agreed to phase out nonessential idling and will install idling reduction devices on all California based locomotives. They also maximized the use of ultra low sulfur diesel fuel containing less than 15 ppm of sulfur by January 1, 2007, six years before such fuel is required by regulation. Several natural gas and hybrid electric locomotives are in the prototype development phase. BNSF ran two LNG line haul locomotives transporting coal inside Wyoming from 1991 to 1995. Union Pacific also tested two LNG fueled switching engines in the Los Angeles area. The cost to convert these diesel locomotives to burn natural gas ranged from $400,000 to $800,000. All four LNG locomotives are now in service at a BNSF rail yard serving the San Pedro ports. This is the only natural gas locomotive test program now underway in the U.S. RailPower Technologies, based in Vancouver, British Columbia, Canada, is currently developing a new locomotive technology that uses natural gas in place of diesel fuel. Initial studies of the new system, called compressed integrated natural gas locomotive (CINGL), indicate that it would reduce total capital and operating costs between 27 and 33 percent over its lifetime compared to the costs of a conventional locomotive. In a CINGL, the diesel engine is replaced with a 5,500 horsepower gas turbine with a thermal efficiency of about 40 percent and a specially designed high speed alternator. This smaller powertrain creates the room to add 44 compressed natural gas storage cylinders, which hold the equivalent of 5,500 gallons of diesel fuel. This will give the unit a range of 40-plus hours in a medium duty use cycle, about the same as existing locomotives. RailPower Technologies is also a leading developer of hybrid electric switching engines. It has spent more than $1 million (U.S. dollars) to date to develop its “Green Goat,” which reduces both particu-late matter and nitrogen oxides by roughly 85 percent. It uses a 100 horsepower generator, as compared to 2,000 horsepower locomotive engines, to replenish power to a bank of lead acid batteries, cutting fuel use and lowering noise levels. The Green Goat reduces fuel consumption between 15 and 45 percent. The maximum speed of the 52-foot-long hybrid electric switching locomotive is 20 miles per hour.
�6
Chapter 4:Profiles of the 10 Largest
U.S. Container Ports
The heart of the research phase of this project was site visits to
each of the 10 largest container ports in the United States.
The profiles provide brief histories of each port, overviews of their
management structure, a description of their equipment and
operating procedures, in depth reviews of their efforts
to reduce air pollution, and a comment on their level of
cooperation with this study. The profiles appear in the
following pages from the largest to the smallest.

��
Profile: PORTS OF LOS ANGELES AND LONG BEACH
In the early 1900s, the state legislature of California conveyed ownership of the tidelands bordering San Pedro Bay to the adjacent cities of Los Angeles and Long Beach, allowing local control over harbor commerce, navigation and fisheries. During the 20th century, the San Pedro Bay ports grew into a huge regional and national economic engine, accounting for approximately $300 billion in annual trade. The ports of Long Beach and Los Angeles have emerged to become the two largest container seaports in the United States (U.S.), together handling more than 15 million TEUs of containers each year. Roughly one-third of all containerized trade in the nation flows through the two ports. Taken together, the adjacent ports are the fifth largest container port in the world. Economic forecasts suggest that the demand for containerized cargo moving through the San Pedro Bay region will more than double by the year 2020.��
The Port of Los Angeles (POLA), located 20 miles south of downtown Los Angeles, is currently the largest container port in the U.S. In 2006, the port handled 8,469,853 million TEUs of contain-ers, up 13.2 percent from the 7,484,624 million TEUs handled in 2005. Over the past decade, POLA container traffic has risen 186.2 percent. Both percentage growth figures are second only to Savannah among the top 10 container ports in the U.S.
T��le �
PORT OF LOS ANGELES
Port Ch�r�cter�st�c Descr�pt�on
National Ranking 2006 1st
Port Commission Port of Los Angeles (POLA)
Operating Revenue (2006) $412.8 million
Landlord or Operator Landlord
TEUs 2005 7,484,624
TEUs 2006 8,469,853
Percent Growth 2005 to 2006 13.2%
Percent Growth Over Past Decade 186.2%
Percentage by Truck/Rail 80%/20%
Number of Container Terminals 8
Alternative Fuel Cargo Handling Equipment Yes
Cold Ironing Capacity Yes
Alternative Fuel Onroad Trucks Yes
Alternative Fuel Rail Engines Yes
Management of POLA is coordinated by the Los Angeles Harbor Department, a city government department.�2 A five-member Board of Harbor Commissioners is appointed by the mayor and confirmed by the Los Angeles City Council to provide direction and create policy for the port. The Harbor Commis-sion received $412.8 million in operating revenue in 2006. The Port of Long Beach (POLB), which is located immediately to the east of POLA, is the second busiest port in the U.S.�� In 2006, the port handled 7,289,365 million TEUs of containers, up 8.6 percent

�8
from the 6,709,818 million TEUs handled in 2005. Over the past decade, POLB container traffic has risen 108.0 percent. Both growth figures are third highest among the top 10 container ports in the U.S.
T��le �
PORT OF LONG BEACH
Port Ch�r�cter�st�c Descr�pt�on
National Ranking 2006 2nd
Port Commission Port of Long Beach (POLB)
Operating Revenue (2006) $353.3 million
Landlord or Operator Landlord
TEUs 2005 6,709,818
TEUs 2006 7,289,365
Percent Growth 2005 to 2006 8.6%
Percent Growth Over Past Decade 108.0%
Percentage by Truck/Rail 80%/20%
Number of Container Terminals 5
Alternative Fuel Cargo Handling Equipment Yes
Cold Ironing Capacity Yes
Alternative Fuel Onroad Trucks Yes
Alternative Fuel Rail Engines Yes
POLB is governed by the Harbor Department of the city of Long Beach. The city charter created the department to promote and develop the port. Under the charter, the five-member Board of Harbor Commissioners is responsible for setting policy and managing the Harbor Department. Commissioners are appointed by the mayor and are confirmed by the City Council. They may serve no more than two six-year terms. The Harbor Commission received $353.3 million in operating revenue in 2006. Both ports are landlords. They build terminal facilities and lease them to shipping lines and stevedoring companies. They do not operate the terminals, ships, yard equipment, trucks or trains that move the cargo. As proprietary and self-supporting departments, the Harbor Departments at POLA and POLB are not supported by taxes. Instead, revenue is derived from fees for shipping services, such as dockage, pilotage, storage, property rentals, royalties and other services. Because of the history of collaboration in developing the current air pollution control strategy underway at each port, the profiles for POLA and POLB are combined in this report into one profile. Individual projects occurring solely within one of the two ports are appropriately identified.
Env�ronment�l Imp�cts from the Ports
The San Pedro Bay Ports are located in the South Coast Air Basin (SoCAB).�� The basin has the worst air quality in the U.S., which represents a major health concern for its residents. Currently, the SoCAB is designated by the U.S. Environmental Protection Agency (EPA) as being in violation of federal public

�9
health standards for ozone and for particulate matter less than 2.5 microns in diameter (PM2.5). The ozone nonattainment level is rated “severe-17,” with a deadline of 2021 to reach attainment with health standards. The PM2.5 attainment deadline is 2015. In addition, the CARB has designated the exhaust from diesel fueled engines as a toxic air contaminant. The EPA also lists diesel exhaust as a mobile source air toxic. In 2000, the South Coast Air Quality Management District (SCAQMD) released results from its second Multiple Air Toxics Exposure Study (MATES II), which raised concerns about the impact of emissions from ships, trucks and trains in the vicinity of the ports and their major transportation corridors. Current emissions from goods movement activities are a significant contributor to regional air pollution.�� In the Los Angeles metropolitan region, port emissions accounted for about 10 percent of the regional nitrogen oxides emissions and about 25 percent of the diesel particulate matter in 2001. The CARB estimates that a tripling in trade at the ports by 2020 would result in about a 40 percent increase in nitrogen oxides emissions and a 50 percent increase in diesel particulate matter from 2005 levels, unless additional pollution control efforts are instituted. If such emission increases occur, port related pollution could account for as much as 30 percent of the regional nitrogen oxides emissions and 65 percent of the diesel particulate matter emissions.
M�jor A�r Pollut�on Control Progr�ms
Since the late 1990s, a major program has unfolded to develop and implement strategies to reduce air pollution from POLA and POLB. Individual programs are implemented by the ports where they occur, but the development of the pollution control strategy has occurred through a collaborative process. Both ports worked closely with the CARB and SCAQMD to develop a Clean Air Action Plan (CAAP), officially endorsed by the respective Harbor Commissions on November 26, 2006, at the first joint meeting of both commissions ever held. The CAAP integrates the many programs underway at each port under a single set of goals and standards to create “a more perfect union,” in the words of POLA’s Harbor Commission president, S. David Freeman.�6 The plan merges elements in the POLB Green Port Plan, launched in January 2005, with POLA’s No Net Increase Plan adopted in 2001 to prevent any increase in air pollution as the port grows. While the CAAP was being developed at the local level, the state government was conducting a more comprehensive analysis of the future of goods movement throughout the state. In December 2004, a Goods Movement Cabinet Work Group was formed within state government agencies. The group adopted a state goods movement policy in January 2005. The Phase I: Foundations report, the first of two parts comprising the official Goods Movement Action Plan, was released in September 2005. It included an inventory of existing and proposed goods movement infrastructure projects. The Phase II report of the Goods Movement Action Plan was released in January 2007. It includes a statewide plan for goods movement capacity expansion to be achieved, while mitigating public health, environmental and community impacts.�� Collectively, the action plan identifies approximately 200 actions and projects recommended for further investigation, review or implementation. The total cost for emission reduction strategies related to goods movement is estimated to be $15 billion over the next decade. Between $6 billion and $10 billion will be needed just for air pollution reductions. The costs of implementing the CAAP for the San Pedro ports alone are huge. To meet these needs, full use of all traditional funding sources, public and private, will be necessary. Both ports have committed significant direct funding over the next five fiscal years. Regulatory agencies, especially the CARB and SCAQMD, are also committed to provide major funding. Moreover, the state will be disbursing more than $1.0 billion in public funds for environmental programs at ports raised through Bond 1B—the Highway Safety, Traffic Reduction, Air Quality, and Port Security Bond Act of 2006—approved by the voters in November 2006. Another $2 billion was provided

�0
by the bond to finance projects to improve port infrastructure. This money will be spent to implement priorities contained in the Goods Movement Action Plan. The current public monetary commitments for each funding entity over the next five years are listed below:
• Port of Los Angeles: $177.5 million • Port of Long Beach: $240.4 million • SCAQMD: $47.0 million • Bond Funding: $1.6 billion
The future availability of bond revenue will supplement an already vast array of funding sources available to finance port clean-up efforts.�8 At the state level, the Carl Moyer Memorial Air Quality Standards At-tainment Program is an incentive based program founded in 1998 to fund emission reductions from heavy duty diesel engines by retrofitting, repowering or replacing them with new and cleaner models. During the first five years, over $154 million was dispersed through the program. Ten percent of its annual funds are reserved for projects of statewide significance, including the clean up of port vehicles. The Gateway Cities Clean Air Pilot Program was created by the Gateway Cities Council of Governments, CARB, SCAQMD and POLB to provide incentives to reduce pollution from heavy duty trucks. The average grant has been between $20,000 and $25,000 per engine. Several million dollars have been dispersed to date. At the federal level, the U.S. EPA CleanPorts USA and SmartWay Transport Partnership have pro-vided small grants to fund air pollution control programs at POLA and POLB. CleanPorts USA provides grants in the range of $75,000 to $150,000, mostly to finance the retrofitting of cargo handling equipment with new and cleaner engines.�9 On the West Coast, the EPA is partnering with the West Coast Collabora-tive, which provides funds from diesel engine manufacturers and other public and private sources. Other federal funds are available through the Clean Cities program, a division of the Department of Energy, and the Congestion Mitigation for Air Quality program, managed by the Department of Transportation. Despite the sizable public funds available to finance port clean-up efforts, a significant shortfall of funding still remains. On the private sector side, owners and operators of sources of air pollution shoulder the cost of the majority of necessary equipment upgrades and replacements to achieve the required level of pollution control. Both ports are using leases with private container terminal operators as a means to require clean-up efforts. Called the Green Port Lease Program, the POLA and POLB are incorporating environmental protection requirements in the terms of new and renegotiated leases. In some cases, terminal operators receive more favorable lease rates in exchange for expanded clean-up efforts. The first green lease was successfully negotiated in 2006. The Clean Trucks Program uses another tactic to convince private companies to reduce pollution. Under this program, the ports waive impact fees assessed on trucks if they are equipped with qualifying clean engine technology. All other trucks must pay the fees in order to enter the port to pick up containers. The pot of public and private money would have been larger if Senate Bill (SB) 760, passed in September 2006 by the California legislature, had not been vetoed by Governor Arnold Schwarzenegger. The bill would have established a $30 per container fee for all containers unloaded at California ports. This money would have been collected by the state and used to fund environmental protection programs at ports throughout the state. According to Diane Bailey, air program attorney for the Natural Resources Defense Council and a lead author of the 2004 study Harboring Pollution: Strategies to Clean Up U.S. Ports, enactment of a container fee remains a high priority for the California environmental community.�0 The overall goal of the CAAP and the many other state and local pollution control programs is to reduce air pollution at the POLA and POLB by 30 to 40 percent within five years and by 85 percent in 2020. Elements of the overall strategy are complex and significant accomplishments in implement-ing specific projects has already be made. The next two sections discuss several key components of the clean-up effort. The first section discusses programs designed to reduce emissions through the use of

��
cleaner grades of diesel and newer, lower polluting diesel engines. The second section discusses specific programs involving alternative fuels or advanced electric technologies.
D�esel A�r Pollut�on Control In�t��t�ves
Two programs have been established to reduce air pollution from oceangoing ships as they arrive or leave the ports on San Pedro Bay. CARB regulations require the use of 2,000 parts per million (ppm) sulfur marine fuel in vessel auxiliary engines out to a distance of 24 nautical miles. The boundary will be expanded to 40 nautical miles in 2008. This cleaner fuel compares to 27,000 ppm sulfur fuel that is average for oceangoing ships operating on the open seas. The second program for ships was launched in May 2001 when a memorandum of under-standing (MOU) between the POLA, POLB, EPA, CARB, SCAQMD, the Pacific Merchants Shipping Association and the Marine Exchange of Southern California was signed. The MOU specifically requests oceangoing vessels to voluntarily reduce their speed to 12 knots at a distance of 20 nautical miles from the ports. Ship owners that achieve a 90 percent compliance rate with the speed reduction program, called the Green Flag program, are eligible for a 15 percent reduction in dockage fees. By 2008, all harbor craft, including tugboats, must meet federal EPA Tier II standards. By 2012, all previously repowered harbor craft must be retrofitted with the most effective CARB verified nitrogen oxides or particulate matter emissions reduction technologies. Five years after Tier III engines become available for use in harbor craft, all harbor craft must be repowered with them. Most of the 45 tugboats serving the POLA have already been retrofitted with cleaner diesel engines. Beginning in 2007, all cargo handling equipment purchases must use either the cleanest available alternative fueled engine for nitrogen oxides or meet 0.01 grams per brake horsepower hour (g/bhp-hr) particulate matter emissions levels. By the end of 2010, all yard tractors must meet the EPA 2007 onroad or Tier IV engine standards. By end of 2014, all cargo handling equipment with engines larger than 750 hp will meet at a minimum the EPA Tier IV offroad engine standards. The most ambitious component of the CAAP deals with the implementation of a turnover of frequent caller trucks, and ultimately all trucks, calling on the ports. The first goal will be to replace or upgrade all 16,800 individual trucks serving the ports that account for around 80 percent of all truck traffic at the ports. The second goal is to develop alternative fueling infrastructure to provide additional options for cleaner trucks. The ports will undertake an extensive fleet modernization program, commit-ting over $200 million over the next five years to replace and retrofit heavy duty trucks. The current cost projections call for a total investment from all funding sources of more than $1.8 billion on heavy duty vehicle replacements or upgrades over the next five years. By 2008, all existing Pacific Harbor Line switch engines in the ports must be replaced with Tier II engines equipped with 15 minute idling limit devices, retrofitted with pollution controls, and use emulsified or other equivalently clean alternative diesel fuels. New switch engines must meet EPA Tier III standards, or equivalent to 3 grams nitrogen oxides per bhp-hr and 0.023 grams of particulate matter per bhp-hr. By 2011, all diesel powered Class 1 switcher and helper locomotives entering port facilities must be 90 percent controlled for particulate matter and nitrogen oxides and use 15 minute idle restrictors and ultra low sulfur diesel (ULSD) fuels containing a maximum of 15 ppm of sulfur. By 2014, Class 1 long haul locomotives calling at the port properties must achieve a fleet average equivalent to Tier III emission levels. In July 2007, Union Pacific completed replacement of its entire fleet of switcher locomotives at its Commerce rail yard serving the San Pedro ports with new locomotives equipped with multiple genset power generation units.�� Each locomotive is powered by three 700 horsepower nonroad Tier 3 certified diesel engines projected to reduce emissions of both oxides of nitrogen and particulate matter by up to 80 percent, while using as much as 16 percent less fuel compared to current locomotives. The

�2
railroad has purchased 60 new genset switcher locomotives to replace many of the 95 older locomotives currently being used in Los Angeles Basin rail yards. The genset fleet will reduce overall emissions at Union Pacific’s Commerce, northeast Los Angeles and Mira Loma rail yards in the Los Angeles area by 28 percent. Ten of the 60 new units will be working at the Commerce rail yard as part of the company’s voluntary efforts to reduce emissions beyond levels now required by air quality regulations.
Altern�t�ve Fuels �n Port Oper�t�ons
The ports of Los Angeles and Long Beach are heavily involved in alternative fuel and advanced technol-ogy projects. Most projects involve only demonstration programs to test the practicality of alternative so-lutions to air pollution problems, but they are nonetheless more advanced and comprehensive programs than are underway at other ports in the U.S. Three areas of activity are discussed below: cold ironing to reduce ship emissions at berth, use of natural gas as a fuel in yard tractors and drayage trucks, and use of advanced hybrid electric drivetrains to reduce emissions from a range of vehicles.
Cold Ironing: The two ports are in significantly different positions regarding shore power from an infra-structure standpoint. The POLA has the main electrical trunk lines in place from which to “step-down” and condition power for ships. The POLB, on the other hand, needs to bring new electrical service lines into the port to supply the appropriate power, which will require significant infrastructure improvements. The ongoing POLB shore side power program for berthed ships is referred to by the common term cold ironing, while the POLA program is called alternative maritime power (AMP). All shore power proposed for the two ports is currently projected to be based on grid power rather than power generated on the dock. The AMP program at POLA was launched in November 2002 and China Shipping has been using grid power at its berths for several years. Other projects are in the planning stages. The CAAP plan expects all berthed ships at POLA container terminals to use shore power within five years. Shore power will also be required for all frequent callers at the POLB container terminals within five years. Over the next five years, the POLA will conduct a major infrastructure improvement program to equip a number of berths at container and cruise terminals with AMP infrastructure to tap power from the grid. During the same period, the POLB plans to have nine container berths and one crude oil berth operational with shore power based on grid power. In addition, the POLB will undergo a significant electrical infrastructure improvement program to construct an additional 6.6 kilovolt transmission line to serve the port. The POLA expects to invest $49 million of public funds into its AMP program from 2006 through 2011, while investments at the POLB are predicted to be $130 million.
Natural Gas Vehicles: The first use of alternative fuels at the San Pedro ports occurred in 1996 when several administrative vehicles were converted to natural gas.�2 In recent years, the focus has switched to converting heavy duty trucks to natural gas. The CAAP sets out a plan to replace approximately 5,300 diesel trucks at the two ports with LNG trucks by 2011. There are currently three demonstration projects underway to test the use of liquefied natural gas (LNG) in yard tractors operating at the ports and one project to use LNG in onroad trucks. A fourth yard tractor project has been announced. There is also a project to demonstrate the use of natural gas powered locomotives in a rail yard serving the ports.
Yard tractors: The first project to test LNG in yard tractors was deployed in September 2005 at YTI Terminals in the POLA. This project currently includes two LNG yard tractors. Built by Kalmar Industries Corp., the LNG yard tractors are powered by the 250 horsepower C Gas Plus dedicated natural gas engine from Cummins Westport, based in Vancouver, British Columbia, Canada. This project was funded in part by the state of California through the Carl Moyer program and by Sound Energy Solutions (SES), a

��
developer of a proposed LNG import terminal in Long Beach. Earth LNG, formerly ALT Fuels, provides the LNG and the fueling station. Gladstein & Neandross, a consulting firm based in Santa Monica, California, is providing project coordination as a contractor to SES for this project as well as the other two discussed below. The second project was launched in June 2006 at the Long Beach Container Terminal at the POLB. It is a formal demonstration program involving extensive performance data collection. The program involves use of three LNG yard tractors. The project is funded in part by a $600,000 grant from the POLB and SES and by a $75,000 grant from the Region 9 office of the U.S. EPA. Calstart, an advanced transportation consortium based in Pasadena, California, is preparing a report for the POLB about the results of extensive testing on these vehicles. Data collection was completed in early 2007 and a final report on the project will be published. A third yard tractor fleet entered service in May 2007 at a rail yard owned by the BNSF Railway Company serving the ports.�� Ten tractors will be tested at the BNSF Commerce yard, next to the Hobart Intermodal Facility, the nation’s largest intermodal rail center. Parsec Inc., BNSF’s intermodal contract operator that oversees the operations at Commerce and Hobart, acquired the 10 LNG yard tractors and is testing them at the Commerce yard as part of a pilot program funded through a grant from the CARB. On average, a prototype natural gas powered hostler costs between $40,000 and $65,000 more than one that runs on diesel fuel. Clean Energy Inc. is providing the LNG and the fueling station for the project. In October 2007, a fourth natural gas yard tractor project was announced by SES. It will place three LNG powered yard tractors in service at the ITS container terminal at the POLB. ITS, a wholly owned subsidiary of “K” Line in Japan, has been operating a container terminal at the POLB since 1971. In 2006, it signed a 20-year “green” lease agreement with the port that will transform the container terminal into an environmentally friendly facility.��
Onroad Trucks: The first implementation step was taken in June 2007 to convert onroad drayage trucks to natural gas when the SCAQMD awarded a $2.9 million contract to deploy 20 LNG heavy duty engines in drayage trucks serving the ports.�� Under the contract to Total Transportation Services Inc. (TTSI) of Los Angeles, TTSI will replace 20 of its pre-1990 trucks with Kenworth T800 trucks equipped with LNG engines manufactured by Westport Innovations Inc. (a partner in Cummins Westport). The natural gas systems are the cleanest available technology for heavy duty Class 8 engines. The funding support for TTSI’s LNG vehicle acquisition is $144,000 per truck. The contract was the result of a joint request for proposals (RFP) in February 2007 by the SCAQMD, POLA and POLB for LNG truck projects. Six responses to the RFP were received for 170 trucks, with a total funding request of $24.5 million. A year earlier, the SCAQMD set aside $6 million to replace older heavy duty diesel trucks at the POLA and the POLB with new LNG trucks. The ports contributed $8 million each towards this project.
Switching Engines: The CAAP calls for testing of new switching locomotives powered by LNG. BNSF already operates the only four LNG powered switching engines in the U.S. in Los Angeles. Initial studies indicate that they will reduce total capital and operating costs between 27 and 33 percent over their lifetime compared to the costs of conventional locomotives.�6 The diesel engines in the conventional switching locomotive have been replaced with a 5,500 horsepower gas turbine with a thermal efficiency of about 40 percent and a specially designed high speed alternator. This smaller powertrain creates the room to add 44 compressed natural gas storage cylinders, which hold the equivalent of 5,500 gallons of diesel fuel. This will give the unit a range of more than 40 hours in a medium duty use cycle, about the same as existing locomotives.

��
Hy�r�d Electr�c Dr�vetr��ns
Three applications of hybrid electric drivetrains are underway at the POLA and POLB. They involve yard tractors, a tugboat and switching locomotives.
Yard Tractor: The EPA awarded a $300,000 grant in September 2006 to the POLB to fund the develop-ment of hybrid powered cargo handling equipment and testing of a prototype at one of the port’s container shipping terminals. The two-year project will research, develop, build and test an ultra low emissions hybrid yard tractor to improve air quality. The project will specifically test the components in the hybrid drivetrain.�� The Hybrid Yard Hostler Demonstration and Commercialization Project is headed by the POLB in partnership with the POLA. The testing will be at POLB’s Long Beach Container Terminal’s Pier F facility. Cargo handling equipment manufacturer Kalmar Industries will integrate the hybrid drivetrains into the yard tractors. Calstart/Weststart is assisting in evaluation of the feasibility of the hybrid hostlers, focusing on emissions and fuel savings. A final partner is the West Coast Collaborative, a member of the National Clean Diesel Campaign. The project participants expect to select a hybrid electric drivetrain manufacturer before the end of 2007 and to have the three hybrid yard tractors operating in 2008 for a six-month test. In August 2007, Calstart/Weststart issued a request for information to determine the degree of interest in the private sector in participating in the construction of three hybrid yard tractors at the POLB.�8 The vehicles will use either a hybrid electric drivetrain, which includes a battery pack for energy storage, or a hybrid hydraulic system, which uses hydraulic fluid compression to store energy. Either system, when coupled with the cleanest available diesel engine, is expected to provide a 93 percent reduc-tion in nitrogen oxides and diesel particulate matter compared to typical yard hostlers. In addition, the hybrid technology is expected to reduce or eliminate emissions during idling, which can represent more than half of the yard hostler duty cycle. The estimated cuts in emissions from idling reductions during the six-month test are about 19 tons of nitrogen oxides and 200 pounds of particulate matter. In addition to the $300,000 award from the EPA, the two ports have agreed to contribute $375,000 each in funding and services toward the project. Kalmar, Long Beach Container Terminal and the hybrid technology supplier will provide an additional $150,000 in services. The total project cost is expected to be about $1.2 million.
Tugboat: Foss Maritime Company, a marine transportation and logistic services company based in Seattle, Washington, announced in March 2007 plans to build the world’s first hybrid electric tugboat capable of significantly reducing emissions of nitrogen oxides, particulate matter, sulfur dioxide and carbon.�9 It will also consume less fuel and be quieter than its conventional predecessors. The decision by Foss Maritime to move forward with the hybrid electric tugboat was made a few days after the POLA pledged $850,000 to the project in association with the SCAQMD. The POLB has preliminarily approved another $500,000 contribution to the vessel’s construction. Foss has agreed to station the new tugboat in southern California for five years. The Foss hybrid electric tugboat is scheduled to go into production late in 2007 and will be deliv-ered to Foss’ southern California operations in 2008. The hybrid electric model will look almost identical to its sister Dolphin class tugboats but will be quieter, cleaner and more fuel efficient. The hybrid electric tugboat’s drivetrain will be powered by batteries coupled with diesel generators and feature a modified engine room accommodating two 670 horsepower battery packs and two 335 horsepower generators. Although the main engines in the hybrid electric tugboat will have lower horsepower than the existing Dolphin engines, the tugboat will still have the same 5,000 total horsepower as its conventional counter-parts. Initial estimates show a 44 percent reduction in particulate matter and nitrogen oxide emissions

��
for the same duty as the current Dolphin tugboats. The hybrid electric tugboat will also be much quieter than traditional tugs, running on battery power in standby mode and only bringing the generators and main engines online when higher power is required. The Foss hybrid electric tugboat will be used primarily for harbor assist services, moving vessels such as tankers and container ships in and out of the harbor and into their berths. While performing these jobs, tugboats generally spend little time at peak revolutions per minute, rarely using their full horsepower. Tugboats in San Pedro Bay spend up to 50 percent of their time idling, with the main en-gines on and ready to respond, but with no power actually being used for propulsion. The hybrid electric tugboat design minimizes fuel consumption by using a power management system to match the required power to the most efficient combination of batteries, generators and main engines for that particular power level. For example, instead of idling the main engines while in standby mode when alongside a customer vessel awaiting orders from the pilot, the hybrid electric tugboat will run on battery power with the main engines shut down.
Switching Locomotive: The CAAP calls for testing of new switching locomotives designed with hybrid electric drivetrains. RailPower Technologies is one leading developer of hybrid electric switching engines that plans to participate in this program.60 It has spent more than $1 million to date to develop its Green Goat, which reduces both particulate matter and nitrogen oxides by roughly 85 percent. “Goat” is a traditional railroad term for locomotives used in yard switching operations. It uses a 100 horsepower generator, as compared to a 2,000 horsepower locomotive engine, to replenish power to a bank of lead acid batteries, cutting fuel use and lowering noise. The Green Goat reduces fuel consumption between 15 and 45 percent. It consumes just 130 gallons of fuel a day, while a conventional diesel locomotive uses approximately 200 gallons in switching duties at a rail yard. The new locomotives are the world’s largest and heaviest hybrid electric land vehicles currently in production. Each Green Goat has a traction output of 2,000 horsepower. The onboard fuel storage capacity is 2,100 gallons of diesel. The 600 Volt lead acid battery pack includes 30 batteries with a total capacity of 1,000 kilowatt hours of electricity. The total gross vehicle weight is 280,000 pounds. The batteries alone weigh 55,000 pounds. The maximum speed of the 52-foot-long hybrid electric locomotive is 20 miles per hour.

�6
Profile: PORT OF NEW YORK AND NEW JERSEY
Trade at the ports lining the shores of the bay defining the border between New York City and New Jersey began more than 300 years ago, before the American Revolution. Port trading grew steadily and by the 19th century, New York and New Jersey were waging multiple disputes over their valuable and shared harbor. One dispute, over the boundary line through the harbor and the Hudson River, was settled by the Treaty of 1834. In 1921, The Port of New York Authority was established to administer the common harbor interests of New York and New Jersey. The first of its kind in the western hemisphere, the organi-zation was created under a clause of the Constitution permitting compacts between states. In 1972, the organization’s name was changed to The Port Authority of New York and New Jersey (PATH) to more accurately identify its role as a bi-state agency.6� The PATH manages one of the world’s largest networks of transportation systems, including three of the region’s airports, a regional light rail line connecting New York and New Jersey, the major bus terminal, and several bridges and tunnels, in addition to the major ports. It also owns and manages substantial real estate holdings, including the World Trade Center destroyed in the September 2001 ter-rorist attack. The PATH is a financially self-supporting public agency that receives no tax revenues from any state or local jurisdiction and has no power to tax. It relies almost entirely on revenues generated by facility users, tolls, fees and rents. In 2005, the PATH had total gross revenues of $3.0 billion. The governor of each state appoints six members to the Board of Commissioners, subject to state senate approval. Board members serve as public officials without pay for overlapping six year terms. The governors retain the right to veto the actions of commissioners from his or her state. PATH board meet-ings are public. The Board of Commissioners appoints an executive director to carry out the agency’s policies and manage the day-to-day operations.
Overv�ew of Port
Each year, more than 25 million tons of ocean-borne general cargo moves through the port. In 2006, PATH terminals handled 5,092,806 TEUs of containers, up 6.4 percent from the 4,785,318 TEUs of containers handled in 2005. Business at the port more than doubled over the decade from 1997 through 2006. The exact growth over the decade was 107.3 percent, which was slightly above the average growth for the top 10 ports. The port projects a doubling of container capacity by 2020. PATH is currently in the middle of a $1.7 billion capital investment program to improve and enlarge the ports in New York and New Jersey.62 It expects to grow by an annual rate of 7 percent and to handle 6.4 million TEUs of containers by 2010 and 10 million TEUs by 2016. The PATH owns the largest port complex on the East Coast of North America. It is nearly twice as large as the next largest container port on the East or Gulf Coasts of the U.S. It is a landlord port that leases all port facilities to private operators. The PATH does not directly operate any port equip-ment. However, it directly oversees the operation of seven cargo terminals leased to private operators at three sites—Port Newark and Port Elizabeth in New Jersey and the New York Container Terminal in the Staten Island borough of New York City. Port Newark and the Elizabeth Port Authority Marine Terminal operate as one fully integrated marine terminal. Port Elizabeth is known as “America’s Containership Capital.” It is home to fully equipped containership terminals operated by APM Terminals and Maher Terminals Inc. New York Container Terminal Inc. operates a container terminal on a 187-acre site in the northwest corner of Staten Island.

��
T��le 6
PORT OF NEW YORK/NEW JERSEY
Port Ch�r�cter�st�c Descr�pt�on
National Ranking 2006 3rd
Port Commission Port Authority of New York and New Jersey (PATH)
Operating Revenue (2006) $3.0 billion
Landlord or Operator Landlord
TEUs 2005 4,785,318
TEUs 2006 5,092,806
Percent Growth 2005 to 2006 6.4%
Percent Growth Over Past Decade 107.3%
Percentage by Truck/Rail 87%/13%
Number of Container Terminals 7
Alternative Fuel Cargo Handling Equipment No
Cold Ironing Capacity No
Alternative Fuel Onroad Trucks No
Alternative Fuel Rail Engines No
About 87 percent of the containers unloaded at the PATH port facilities travel by truck to markets. About 6,000 trucks leave the port terminals each day carrying containers. Only 13 percent of the containers now leave by rail. A $600 million Rail Express program is underway that will increase rail traffic to 1.5 million containers per year, or 20 percent of all ship containers projected for that time. The first phase of the project, the ExpressRail Facility at Port Elizabeth, was completed in October 2004. It increased the rail capacity of the Elizabeth terminal from 225,000 to 350,000 containers per year. The metropolitan area that includes the ports in New York and New Jersey is one of the most heavily polluted regions in the country. The region currently violates federal public health standards for ozone and particulate matter.
M�jor A�r Pollut�on Control Progr�ms
Most environmental initiatives at the PATH involve facilities planning. Actual implementation of specific environmental controls is largely left to the individual lessees of port facilities, which operate without much prodding from the PATH. The major environmental initiative directed by the PATH to date is the Green Port Program, which consists of a set of environmental measures that exceed the regulatory and legal standards that govern port operations.6� In May 2003, the PATH retained the services of an envi-ronmental consultant to assess its environmental programs and initiatives by comparing them against the International Standards Organization’s code for environmental management. The results of this analysis indicated that there were significant gaps between the management system currently in place and the ISO 14001 benchmark. In response to the findings of the analysis, the PATH undertook the development and implemen-tation of an Environmental Management System (EMS), consisting of 17 elements. The first element is the development of an environmental policy, and the remaining 16 elements are parts of four implemen-tation phases—review of environmental aspects, assessment of legal and other requirements, identifica-

�8
tion of objectives and targets, and development of an environmental management program. The PATH began its EMS implementation in January 2004. The EMS team has identified ten activities with significant environmental aspects and begun to develop remedial strategies for each of them. One measure underway is Voluntary Tenant Environ-mental Awareness Training, which earned the American Association of Port Authorities’ Environmental Improvement Award in 2003. It trains port employees to implement environmental best management practices and green terminal design and construction practices. Environmental projects are reviewed by the Green Practices Task Force, comprised of staff from the PATH and the terminal operators. Unfortunately, little of the enthusiasm for environmental protection engendered by the Green Port Program has produced concrete air pollution reductions.6� There are no fuel quality standards or speed reduction limits placed on ships or the tugboats that guide the ships to their berths, for example. There are no requirements for the use of trucks or rail engines that use cleaner fuel, or to equip vehicles with advanced pollution control equipment. Truck emissions, however, have been reduced through use of an electronic gate system that more quickly connects trucks and containers, thereby reducing truck idling emissions. The rail system is being expanded, which will also reduce total air pollution by eliminat-ing truck traffic in favor of rail service. The new rail system at the Staten Island container terminal, for example, is expected to reduce truck traffic by 55,000 trips per year. One of the few actions that has been taken specifically to reduce air pollution has been a program to switch cargo handling equipment vehicles from conventional to ultra low sulfur diesel fuel (ULSD). The program also included installation of idling control equipment on yard tractors that shuts off engines when the equipment is not moving. This program reduced cargo handling equipment emissions by 30 percent, according to a 2005 analysis by the PATH’s Green Practices Task Force. The reductions were achieved despite a 19 percent increase in the size of the cargo handling equipment fleet and a 25 percent jump in container volume. When considered on a per container basis, the program achieved a 48 percent air pollution reduction. In 2005, the PATH won a second Environmental Improvement Award from the American Association of Port Authorities for its cargo handling equipment clean-up effort.6� The PATH also operates a tugboat engine replacement project, although it only involves two tugboats used in its harbor channel deepening program. The project, which includes the replacement of two engines on each tug with cleaner diesel burning engines, cost $600,000 and reduced nitrogen oxide emissions by 50 tons a year. The program was implemented in 2003. The PATH is also partnering with the New York City Department of Transportation to conduct a test pilot project to retrofit the engine exhaust system on one Staten Island Ferry. If the test project is successful, the PATH will fund a program to retrofit all six remaining vessels in the Staten Island Ferry fleet. In another PATH program not located at the ports, the agency initiated a test program for the use of ULSD on heavy equipment used in the construction of the temporary World Trade Center PATH station. The data and experience gathered from this test program will be used to evaluate opportunities to implement a larger use of ULSD fueled equipment in the construction of the permanent World Trade Center PATH terminal.
Altern�t�ve Fuels �n Port Oper�t�ons
There is currently no alternative fuel use in dockside port operations. In 2006, the PATH tried to interest lessees in testing biodiesel blends in cargo handling equipment, but the lessees were intimidated by nega-tive results of biodiesel gelling during cold weather reported from other test fleets. Also in 2006, there was an agreement between Public Service Electric & Gas, the local natural gas provider, and two terminal operators in New Jersey to extend a natural gas pipeline onto the site to provide gaseous natural gas heat for a cargo warehouse. The Department of Homeland Security raised safety concerns over this use of

�9
natural gas at a port and the project has not moved ahead. The PATH has also been gradually electrifying its large container unloading cranes and its rubber tire gantries. More than $100 million has been invested in providing the infrastructure to supply electricity to these cranes and gantries. Enthusiasm for dockside electrification does not extend to cold ironing, however. An analysis of the potential to reduce dockside air pollution through cold ironing using grid power concluded that the cost was exorbitant. Costs were estimated to include $1.0 million to upgrade electrical equipment onboard a ship, another $1.0 million for new dockside infrastructure, and $0.5 million for the extra cost of grid power per year, compared to the cost of generating power using ship boilers. The analysis showed that the cost of eliminating a pound of nitrogen oxide emissions through cold ironing was 25 times greater than reducing the same pound of pollution from other more cost effective alternatives available in the New York metropolitan area. In September 2007, the EPA announced a project to develop and test a new EPA-patented hybrid technology on cargo handling equipment at a PATH container facility in Elizabeth, New Jersey.66 The hybrid vehicle will feature a unique hydraulic hybrid power train that can generate, recover, store and reuse braking power with very little air pollution. The new hybrid yard tractor will be equipped with a diesel hydraulic system developed at the EPA that will combine the cleanest available diesel engine technology with components that use hydraulic fluid compression to store energy. Hydraulic tanks are used to store energy, in contrast to the less efficient batteries used in hybrid electric vehicles. Like other hybrid systems, energy saved when applying the brakes is reused to help accelerate the vehicle. The hydraulic hybrid technology is expected to improve the fuel efficiency of the yard tractor by 50 to 60 percent, reduce or eliminate emissions during idling, and decrease brake wear. The demonstra-tion project will try to prove the effectiveness of hybrid hydraulic technologies on yard hostlers. The goal is to develop a hybrid drive system that will include a diesel engine that meets the 2007 and 2010 onroad diesel standards. Other partners in the project include APM Terminals, Kalmar Industries, Parker Han-nifin Corporation and the Port of Rotterdam in The Netherlands. The PATH has been more aggressive in implementing alternative fuel programs in other por-tions of its operations. The Port Authority ranks among the nation’s top 100 government and private clean fuel vehicle fleets, according to Automotive Fleet magazine. None of these vehicles operate at the seaport. In 2003, PATH bought 16 new Ford E-350 natural gas vans.6� The vans cost approximately $24,000 each. The total PATH natural gas vehicle fleet now numbers over 350 vehicles. In 2005, the PATH launched a program to test biodiesel in 41 of its heavy duty vehicles. About 152,000 gallons of biodiesel were burned in 2005 in this program. In 2006, the PATH authorized the purchase of 21 new diesel hybrid electric shuttle buses, seven each for use at John F. Kennedy International, Newark Liberty International and LaGuardia airports.68 The shuttle buses are vital to the airports’ operations, transport-ing travelers and employees between long-term parking lots, passenger terminals and cargo areas. The initiative is estimated to cost about $21 million, and the buses are expected to be in service in 2007.

�0
Profile: PORT OF OAKLAND
The first ferry service between Oakland and San Francisco was founded in 1850 by Captain Thomas Gray, grandfather of the famous dancer Isadora Duncan. The port of Oakland was already a major trading center by that time. Jack London’s sailboat Razzle Dazzle and his fellow teenage “oyster pirates” populated the port. His favorite saloon, Heinhold’s First & Last Chance, still stands today at Jack London Square, near the modern day port administration building.69 The port of Oakland today occupies 19 miles of waterfront on the eastern shore of San Francisco Bay, with about 900 acres devoted to maritime activities and another 2,600 acres devoted to aviation activities associated with Oakland International Airport. Oakland was among the first ports to specialize in intermodal container operations, which have revolutionized international trade and helped create the global economy. The Port of Oakland was established in 1927. The seaport division of the Port of Oakland owns, manages and markets seaport facilities on San Francisco Bay and the Oakland Estuary. The maritime division leases the container terminals and other facilities for railroad and trucking operations needed to transport import and export cargo. The charter of the city of Oakland vests the Board of Port Commissioners with exclusive control and management of the port. The board consists of seven members nominated by the mayor and ap-pointed by the City Council for four year terms. Members must live in Oakland during their term. They serve without salary or compensation. Each year, depending upon the revenue surplus, the Port of Oakland makes financial contributions to the city of Oakland. In 2005, the port paid the city of Oakland $25.3 million from its revenue. In 2005, the port generated 28,522 direct, induced and indirect jobs, $2.0 billion of total personal income and consumption expenditures, and $1.8 billion in direct operating revenue for busi-nesses providing maritime services for cargo and vessels at the port. The average annual salary of those directly employed at the port grew from $43,200 in 2001 to nearly $51,000 in 2005. The firms involved in providing transportation and cargo handling services at the port made $418 million of local purchases for goods and services in support of their port operations, and there were $208 million of state and local taxes generated through the business activity at the port.
Overv�ew of Port
The Port of Oakland is the 4th largest container terminal in the U.S., the 3rd largest in California and the 20th in the world. In 2006, Oakland handled 2,390,262 TEUs of containers, up 5.2 percent from the 2,272,525 TEUs of containers handled in 2005. The port handles more than 99 percent of the container-ized goods moving through northern California. About 58.9 percent of Oakland’s trade is with Asia. Business at the port grew 56.1 percent over the decade from 1997 through 2006. The port projects a doubling of container capacity by 2020. Eight container terminals and two intermodal rail facilities serve the Oakland waterfront. There are 20 deepwater berths at these terminals and 35 container cranes, 29 of which are too large to travel through the Panama Canal. About 40 percent of all transoceanic vessels entering San Francisco Bay are container ships destined for the Port of Oakland. Each ship stays in port an average of 20 hours. The Union Pacific and BNSF railroad facilities are located adjacent to the center of the marine terminal area to provide an efficient movement of cargo between the marine terminals or transfer facili-

��
ties and the intermodal rail facilities. Between 25 and 30 percent of the containers unloaded at Oakland leave the port by rail; the rest travel to markets by trucks.
T��le �
PORT OF OAKLAND
Port Ch�r�cter�st�c Descr�pt�on
National Ranking 2006 4th
Port Commission Port of Oakland
Operating Revenue (2006) NA
Landlord or Operator Landlord
TEUs 2005 2,272,525
TEUs 2006 2,390,262
Percent Growth 2005 to 2006 5.2%
Percent Growth Over Past Decade 56.1%
Percentage by Truck/Rail 75%/25%
Number of Container Terminals 8
Alternative Fuel Cargo Handling Equipment No
Cold Ironing Capacity Yes
Alternative Fuel Onroad Trucks Yes
Alternative Fuel Rail Engines Yes
Since 1962, the port has spent more than $1.4 billion to construct 1,210 acres of marine terminals, an intermodal rail facility and maritime support areas. This includes over $700 million for the Vision 2000 program, discussed below, which includes development of two new maritime terminals, a new intermodal rail facility, deepening channels and berths to 50 feet, and a new public park and wildlife habitat.
M�jor A�r Pollut�on Control Progr�ms
Most of the growth at the container terminals in Oakland has occurred since the mid-1990s, when the U.S. Navy ceded to the port waterfront property formerly belonging to the FISCO Naval Station.�0 Early development plans by the port were met with stiff opposition by local communities bordering the water-front in West Oakland. A lawsuit was filed by the West Oakland Neighbors and a settlement was reached under which the port agreed to create a harbor renovation and expansion program known as the “Vision 2000 Maritime Development Program.” A key component of the Vision 2000 plan, released in 1999, was a $9 million air quality program designed to reduce air emissions from marine terminal equipment, tugboats, local buses and trucks. Other outcomes have included the formation of the West Oakland Toxic Reduction Collaborative and the creation of the Oil Free Oakland Initiative. According to Tim Leong, Port Environmental Scientist, “because of that lawsuit, we all have our jobs today.” There are currently 20 people working in the environmental department at the Port of Oakland. The port initiated an air quality and meteorological monitoring program in West Oakland in April 1997. The program was designed to collect baseline data on particulate air pollution in the West Oakland region prior to and during construction and operation of the maritime development projects, and to help evaluate the effectiveness of the mitigation projects.

�2
In June 2000, the Port of Oakland provided $500,000 to a tugboat operator serving the port to repower the two main engines on a single tugboat with cleaner technology. Additional funds were obtained through California’s Carl Moyer program. The project reduces emissions of particulate matter by 1 ton per year and nitrogen oxide emissions by 26 tons per year. In January 2004, the Port of Oakland launched a year-long demonstration of PuriNOx fuel additive and diesel oxidation catalysts (DOCs) in onroad diesel trucks that haul containers to and from the marine terminals.�� The project was part of the Vision 2000 effort. Twelve heavy duty diesel trucks from Horizon Lines were used for the demonstration program. Two Horizon trucks were left unchanged for baseline control; two were outfitted with the DOCs made by Lubrizol; four were fueled with PuriNOx; and four were equipped with DOCs and fueled with PuriNOx. The port, Bay Area Air Quality Manage-ment District and the California Air Resources Board provided $148,000 for the project. The Port of Oakland does not own or operate any of the equipment used at the port and there-fore had to design an incentive-based program for local operators to reduce diesel emissions. It estab-lished the Truck Replacement Project in 2002 as part of its Vision 2000 program.�2 Under the project, the port provides qualifying owners of drayage trucks up to $40,000 to replace the onroad heavy duty diesel trucks serving the maritime area with a 1999 or newer model year truck. The port will provide up to $2 million in total funding to replace approximately 80 trucks. Participation in the project is voluntary. To qualify, the existing truck must be model year 1990 or older, have been operated in the maritime area continuously for the two-year period immediately before the application was filed, have been used to haul containers for at least 400 trips in the preceding year, be in good working order, have a minimum gross vehicle weight rating greater than 33,000 pounds, and not have any outstanding civil penalties levied for excessive smoke. In August 2006, the Port of Oakland honored five local truck drivers who had recently completed the truck replacement program. The Port of Oakland expanded its Truck Replacement Project with a $5.0 million program to promote the use of ultra low sulfur diesel (ULSD) fuel and cleaner engines with pollution control equip-ment more broadly within the port. As a result, more than half the terminals have switched to ULSD and 150 pieces of cargo handling equipment have converted to new low emission diesel engines, and 151 diesel DOCs and 159 diesel particulate filters have been installed. The expanded container terminal equipment program reduced hydrocarbon emissions by nearly 80 percent, carbon monoxide emissions by nearly 70 percent, nitrogen oxide emissions by over 30 percent and particulate matter emissions by over 70 percent. The program was discontinued when CARB promulgated its cargo handling equipment rule in 2006 requiring the phased replacement of old engines with new engines meeting strict onroad engine emission standards. In November 2006, California voters passed Proposition 1B, a $20 billion transportation bond measure, with over 60 percent of the vote. The Port of Oakland will seek approximately $600 million for goods movement initiatives, environmental programs and security enhancements from these bonds.�� Priority projects for 1B funding include building a “green” intermodal rail terminal on the site of the for-mer Oakland Army Base. The project will include the construction of container loading and unloading tracks, container parking areas and connections to the major railroad lines. This facility will increase rail terminal capacity from approximately 640,000 containers per year to 1.7 million containers and include the development of a clean facility with fully electric yard operations. In December 2006, the EPA awarded a $178,000 Community Action for a Renewed Environment (CARE) grant to the nonprofit Pacific Institute to allow it to continue to support efforts of the West Oakland Toxic Emission Reduction Collaborative to examine emissions from ships, trucks, trains and other sources.�� One of the efforts underway in 2007 by the Collaborative is a health risk assessment to evaluate health risks from diesel exhaust in West Oakland. There are currently no speed restrictions or fuel requirements set by the Port of Oakland for incoming container ships. The CARB has established statewide requirements for use of lower sulfur dis-

��
tillate fuels in the auxiliary engines of all ships once they reach 24 nautical miles off the California coast. The new rule requires use of 2,000 parts per million fuel beginning in 2007. The zone is extended to 40 nautical miles in 2008. The CARB is considering a new rule to expand the cleaner fuel rule to include the main engines onboard ships and to extend the jurisdiction out to 100 miles off the coast.
Altern�t�ve Fuels �n Port Oper�t�ons
Three initiatives are currently underway in Oakland to reduce air pollution through use of alternative fuels and advanced technologies as part of its “Oil Free Oakland” campaign. All three involve use of natural gas, while the focus of the third effort is on deployment of hybrid electric vehicles (HEVs).
Natural Gas Trucks: Early in 2007, a partnership between Pacific Gas and Electric Company (PG&E), a trucking firm, and a transportation company was launched to reduce onroad diesel truck emissions from port operations. PG&E teamed with Burlington Northern Santa Fe Railroad to identify 10 liquefied natural gas (LNG) drayage trucks to put in service in Oakland.�� The trucks were put into service by a local “green” trucking company, CleanAir Transport. As part of a demonstration project, PG&E loaned CleanAir Transport a compressed natural gas (CNG) port shuttle truck and an LNG mobile fueling station to fuel the LNG trucks. A permanent CNG fueling station was opened in July 2007. The CNG station is open 24 hours a day to fuel vehicles from the port and from the city of Oakland natural gas vehicle fleet. The trucks are performing well and a plan is being developed to add nine more trucks in the near future and 70 additional natural gas trucks to serve the port. About $2.1 million of the overall program budget is being split between the Port of Oakland and a federal grant from the Congestion Miti-gation and Air Quality Improvement Program. The remainder will be provided by CleanAir Transport. The LNG trucks at the port of Oakland are part of a growing fleet of natural gas vehicles in the Oakland area. Several refuse truck fleets, including those operated by the cities of Oakland and neigh-boring Berkeley, burn natural gas. Moreover, there are several hundred natural gas vehicles operating in shuttle bus applications at the Oakland International Airport and in taxicab fleets serving the airport. The Oakland airport is only a few miles south of the port along the waterfront, and it is owned and oper-ated by the Port of Oakland. BNSF also operates one LNG yard tractor in a private program at its rail yard serving the port.
Cold Ironing: The Port of Oakland is the first port in the U.S. to introduce cold ironing technology at a container terminal that will produce electricity on the dock using natural gas fired generators. On-dock power generation “offers an interesting option,” says Leong. “We are not prepared to provide power to handle ships from the existing grid. There is not enough power in the lines.” A study by the California Air Resources Board concluded that the cost of implementing cold ironing using grid power throughout the port would be $70 million. The dockside power unit is being provided by Wittmar Engineering & Construction, Inc., based in Signal Hill, California, as part of a project scheduled to become operational in 2007.�6 Project funds of about $1 to $2 million are being provided by Wittmar, the port, the Bay Area Air Quality Management District and Pacific Gas & Electric Company. Wittmar has developed a modular onshore electrical genera-tion system that uses natural gas as the fuel. The unit built for Oakland is small, about the size of a 40-foot ship container. It is mounted on a skid that can be easily moved from dock to dock to meet incoming ships as they arrive at their berths. Wittmar estimates that the power generator can supply electricity to 80 ships per year. The Wittmar cold ironing system uses a dual frequency multi-voltage system capable of generat-ing electrical power at either 50 or 60 Hertz and voltages ranging from 380 to 460 Volts. A standard unit

��
provides 725 kW of power, but multiple units can easily be coupled to provide greater pwer supplies for larger ships. This flexibility allows the system to meet the power needs of virtually any ship design arriving at port. Power generation is provided by a stationary natural gas engine burning either compressed or liquefied natural gas provided by Clean Energy. Wittmar estimated that its cold ironing system would burn 4,752 gallons of LNG during a typical 2-day stay at dock for a container ship. This would displace 3,840 gallons of diesel bunker fuel. The switch to LNG would eliminate 836 pounds of nitrogen oxides, 6.95 pounds of fine particulate matter and 139 pounds of sulfur dioxide compared to burning diesel bunker fuel containing 5,000 ppm of sulfur onboard a ship. Carbon dioxide reductions of 49,018 pounds also would be achieved. The Oakland project will be Wittmar’s first port application of its onsite natural gas fired power generator. On July 18, 2007, Wittmar Engineering, PG&E and CleanAir Marine Power demonstrated the natural gas powered cold ironing system on APL’s 863-foot container ship the APL China. CleanAir Marine Power is a newly formed subsidiary resulting from the merger of CleanAir Logix and Wittmar. The 8-hour test showed a 94.71 percent reduction in nitrogen oxide emissions using the Wittmar system compared to generating power using the onboard diesel power unit. Moreover, emissions of particulate matter dropped 99.93 percent. The APL China is the first container ship in the U.S. to be cold ironed by a natural gas generator located at a ship’s berth.�� Hybrid Electric Vehicles: Early in 2007, the Board of Commissioners of the Port of Oakland authorized the purchase of four specially built rail yard switching engines for the BNSF and Union Pacific shipping centers serving the port. The new engines will feature advanced electric propulsion systems using diesel gensets with or without onboard energy storage systems. The presence of onboard energy storage would make them hybrid electric vehicles (HEVs). In February 2007, the Port of Oakland added new light-duty HEVs to its Clean Fleet Program by replacing five older sedans in the carpool with five new Honda Civic Hybrids.�8 The carpool’s remaining seven vehicles will be replaced by HEVs before the end of 2008. The port’s broader goal is to replace the entire sedan and pickup truck fleet of approximately 210 vehicles with HEVs and alternative fuel vehicles by the end of 2013. In addition to the Civic Hybrids, the port has recently purchased four new Ford Escape Hybrids, with more on the way. The Port of Oakland fleet also includes 40 other HEVs and compressed natural gas passenger vehicles and 12 small neighborhood electric vehicles powered by batteries.

��
Profile: PORT OF SAVANNAH
On February 12, 1733, James E. Oglethorpe and 114 colonists from Gravesend, England, arrived at Yamacraw Bluff on the Savannah River to found America’s thirteenth colony, Georgia. Savannah became America’s first planned city, as a system of public squares was designed to provide central areas of fortifi-cation, as well as social areas for the colonists.�9 From the outset, Savannah was an important seaport. The first ship carrying export goods set sail three years after the city was founded. Transportation history was made in 1819 when the SS Savannah became the first steamship to cross an ocean, traveling from Savannah to Liverpool, England. In 1834, the shift from sail to steam was furthered when the country’s first all-iron vessel, the John Randolph, was built, owned and operated in Savannah. In 1955, city residents created the Historic Savannah Foundation with the purpose of restoring old buildings in the city’s original town center. Multimillion dollar river-front revitalization in 1977 capped the restoration efforts. Today, the historic district encompasses more than 2,300 architecturally and historically significant buildings in its 2.5-square-mile area. Georgia’s deepwater ports, managed by the Georgia Port Authority (GPA), are located in Savannah and Brunswick. Both ports are owned and operated by the GPA, a state agency created by the legislature in 1945. A 13-member board of directors, appointed by the governor, directs the GPA. Board members serve four years, in staggered terms. A chief executive officer implements policy directives and handles administrative duties and managerial controls. The GPA directly employs more than 850 people. Georgia’s deepwater ports and inland barge terminals support more than 275,968 jobs throughout the state annually and contribute $10.8 billion in income, $35.4 billion in revenue and some $1.4 billion in state and local taxes to Georgia’s economy.
Overv�ew of Port
The Port of Savannah handled a total of 2,160,168 TEUs of containers in 2006, making it the 5th largest container port in the U.S. The port was the fastest growing among the top 10 container ports for the year and for the decade. The port grew 13.6 percent in 2006 from the 1,901,520 TEUs of containers handled in 2005, allowing it to bypass Tacoma, Seattle and Charleston in the top 10 rankings. For the first time, the port handled more than 2.0 million TEUs of containers. Since 2002, annual growth rates have ranged from 4.5 percent to 31.5 percent. The annual number of containers handled at Savannah grew a total of 194.0 percent from 1997 through 2006, exceeding even the growth rate of the port of Los Angeles. Eighteen percent of the containers leave or arrive by rail, while the vast majority, 82 percent, leaves by regional truck.80 Approximately 6,300 trucks leave the port every day through the busiest gate complex in North America. Container loading and unloading continues around the clock, seven days a week. The port gates are only open during the day shift, Monday through Friday, thereby reducing community impacts from truck and rail traffic. The Port of Savannah includes two deepwater terminals: the Garden City Terminal and the Ocean Terminal, both owned and operated by the GPA. The Garden City Terminal is the largest dedicat-ed container facility along the East and Gulf coasts.8� The 1,200-acre single terminal facility features 9,693 linear feet of continuous berthing, the longest unloading dock in the U.S., and more than 1.3 million square feet of covered storage. The Garden City Terminal is equipped with fifteen high-speed container cranes, as well as an extensive inventory of yard handling equipment. The Ocean Terminal covers 208 acres and handles bulk cargo as well as containers. Both terminals are located more than 20 miles up the Savannah River, beyond the city of Savan-nah. All ships must navigate the river at slow speeds, passing along the historic riverfront of Savannah, a

�6
major tourist site. This arrangement raises the public visibility of the port operations, but it also reduces the port air pollution affecting the city. There is no truck traffic from the port within Savannah city-limits, for example, and air pollution emitted from ship engines is at a minimum due to the speed restrictions required for safe transit. The terminals themselves are within a few miles of Interstates 16 and 95, thereby easing the exit of trucks from the port. Moreover, CSX Transportation and Norfolk Southern Railroad provide Class I rail service, with two rail yards, including the Intermodal Container Transfer Facility, located within the ports.
T��le 8
PORT OF SAVANNAH
Port Ch�r�cter�st�c Descr�pt�on
National Ranking 2006 5th
Port Commission Georgia Port Authority (GPA)
Operating Revenue (2006) NA
Landlord or Operator Operator
TEUs 2005 1,901,520
TEUs 2006 2,160,168
Percent Growth 2005 to 2006 13.6%
Percent Growth Over Past Decade 194.0%
Percentage by Truck/Rail 82%/18%
Number of Container Terminals 2
Alternative Fuel Cargo Handling Equipment Yes
Cold Ironing Capacity No
Alternative Fuel Onroad Trucks No
Alternative Fuel Rail Engines No
The GPA is currently implementing a 10-year, $900 million port upgrade scheduled to be completed in 2015. Docks are being expanded, new cargo handling equipment is being deployed and an additional 100 acres of paved storage area is being built. During the first four years, new facilities will increase the terminal’s total capacity by 20 percent. By 2018, the port expects to double its capacity to 5.07 million TEUs per year.
M�jor A�r Pollut�on Control Progr�ms
“Our goal is to become environmentally compliant. We don’t want to be leaders.” These words from Wilson Tillotson, the GPA’s Director of Engineering & Maintenance, sum up the strategy in place at Savannah. Since air quality in Savannah currently complies with all federal public health standards, pressure to make significant reductions is not great. Thus, there is nothing cutting edge in terms of programs to reduce air pollution. The unusual upriver location of the container terminals and the modernization programs undertaken to increase capacity and improve efficiency reduce emissions and limit the impact of the emissions that occur. The port hired its first environmental affairs manager, Natalie Schanze, in August 2006, suggesting that more attention to environmental issues might occur in the future.

��
There are currently no fuel quality regulations in place affecting fuel burning by either ships or tugboats. Speed reductions along the narrow and curvy Savannah River reduce air pollution, however. Dock vehicles burn “whatever’s cheapest,” says Tillotson. Non-road port vehicles do not use ultra low sulfur diesel (ULSD), now required by the U.S. EPA in onroad diesel trucks, because of its high cost in the Savannah area. The premium for ULSD is now $0.33 per gallon above the cost of off-road diesel fuel. Neither regional trucks nor rail lines are regulated by the GPA. Truck idling time has been reduced through the use of a sophisticated container tracking system that coordinates truck loading. The average truck enters and leaves the port loaded in less than one hour. In recent years, the GPA has invested in improving the onsite rail yards to increase container traffic by rail. The Intermodal Container Transfer Facility is located onsite within a half mile of the berths, allowing quick transfer and shipment of containers. Compared to truck transport, rail service emits less air pollution per container shipped.
Altern�t�ve Fuels �n Port Oper�t�ons
There is no alternative fuel use currently underway for cold ironing or yard tractors among the cargo handling equipment operations. There are about 130 yard tractors at Savannah, half operated by the GPA and half operated by private companies working for the shipping lines. The GPA intends to initiate a test program in 2008 to introduce diesel fuel blends containing 20 percent biodiesel. Tillotson said cold ironing was probably impractical at Savannah because most ships are only in port for a few hours for partial unloading of containers before moving to other ports up the eastern seaboard. Early this year, however, the GPA initiated a study of the potential for cold ironing in the fu-ture. The study, scheduled for completion later in 2007, will assess the costs involved and, says Tillotson, answer the question: “When should we seriously look at this?” Emissions from top lift cargo handling equipment are being reduced by replacement with rubber tire gantry cranes powered by electricity obtained from the grid. The first phase, to be completed in 2007, will replace diesel powered top picks with 15 electric rubber tire gantries. This will eliminate the burning of about 500,000 gallons of diesel each year. By 2018, the GPA intends to have 91 electric powered rubber tire gantries in place, cutting its fleet of diesel top pickers from 68 to 35.

�8
Profile: PORT OF TACOMA
The forestry industry first capitalized on Tacoma’s naturally deep harbor when it opened a lumber mill on the tide flats in 1852. The first cargo shipped by the mill was carried to San Francisco in 1853. In 1873, the Northern Pacific Railroad chose Tacoma as the western terminus of its transcontinental line. Water-front monopolies in the state of Washington were dismantled in 1889 when the new state constitution declared that beds of navigable waters belonged to the people, and the legislature could designate which of those areas would be harbors. It also provided a system for leasing waterfront tidelands and uplands in those areas.82 In 1911, the legislature enacted laws that allowed the people to establish port districts and elect commissioners to administer the districts and oversee their development and operation. The Port of Tacoma was created by Pierce County citizens in 1918. The five-member Port of Tacoma Commission is the governing body of the independent, municipal corporation. The commission sets policy and autho-rizes major expenditures. Commissioners are elected to four-year terms by voters in Pierce County. The commission appoints an executive director, who is responsible for the executive leadership of the port. In 2005, the Port of Tacoma had a gross operating revenue of $91.7 million.
Overv�ew of Port
The Port of Tacoma handled a total of 2,067,186 TEUs of containers in 2006, making it the 6th largest container port in the U.S. Container volume was virtually unchanged from 2005. The annual number of containers handled at Tacoma grew by 78.5 percent from 1997 through 2006, however. The Washington Public Ports Association’s 2004 Marine Cargo Forecast indicates Puget Sound containerized trade is pro-jected to grow by an average of 4.0 percent per year from 2002 to 2025, reaching 3.0 million TEUs by 2010. By 2020, capacity at Tacoma by some estimates might grow fivefold, reaching nearly 10 million TEUs. The Port of Tacoma provides more than 43,000 jobs in Pierce County and 113,000 jobs in Wash-ington State. Port-related jobs generate $637 million in annual wages in Pierce County and $90 million annually in state and local taxes. The port has long been known as the Gateway to Alaska, handling more than 70 percent of the waterborne cargo bound for Alaska. The Port of Tacoma is a landlord port. It does not operate container terminals on its own, but leases terminal facilities it builds to tenants that operate them. There are currently five container terminals in operation within the contiguous 2,500-acre area owned by the port. Two of the five terminals are operated by APM and Husky. The other three are the Olympic Container Terminal, the Washington United Terminal and, the newest one, the Pierce County Terminal managed by Evergreen. Another container terminal, East Blair #1, is now under construction and scheduled to open in 2009. The Puget Sound region, which includes Tacoma, is in compliance with all federal air quality standards, but concerns about potential cancer risks from growing diesel particulate emissions is high. Ozone is not the highest concern, so emphasis is on using those alternative fuels known to reduce particulate matter. Officials do not appear overly concerned about potential increases in NOx emissions from using some alternative fuels. Thus, biodiesel blends are viewed favorably. Another pollutant of concern to state and local officials in Washington is carbon dioxide. “We are really thinking about carbon dioxide,” Galen Hon, Environmental Program Technician at the port, told Energy Futures.8�

�9
T��le 9
PORT OF TACOMA
Port Ch�r�cter�st�c Descr�pt�on
National Ranking 2006 6th
Port Commission Port of Tacoma
Operating Revenue (2005) $91.7 million
Landlord or Operator Landlord
TEUs 2005 2,066,447
TEUs 2006 2,067,186
Percent Growth 2005 to 2006 0.0%
Percent Growth Over Past Decade 78.5%
Percentage by Truck/Rail NA
Number of Container Terminals 5
Alternative Fuel Cargo Handling Equipment Yes
Cold Ironing Capacity No
Alternative Fuel Onroad Trucks No
Alternative Fuel Rail Engines No
M�jor A�r Pollut�on Control Progr�ms
Over the last 20 years, the Port of Tacoma has invested millions of dollars in a wide range of environ-mental projects. Thus far, the Port of Tacoma has invested $126 million in environmental projects to protect land, water or air resources. Prior to the middle of the 1990s, the environmental protection program at the Port of Tacoma was a “mom and pop” operation, in Hon’s words, run essentially by one person. Then, in 1998, the port instituted an Environmental Compliance Program to ensure that local, state and federal environmental regulations and policies are observed in its activities. The Environmental Department, formed in 2002, is now staffed by nine people. It serves as a resource to staff members on environmental compliance issues and is responsible for overall coordination of the program. There are no fuel quality or speed restrictions facing ships as they travel more than 100 miles from the open ocean to Commencement Bay in Tacoma at the far end of Puget Sound. Once berthed, however, roughly 58 percent of the ships voluntarily switch to lower sulfur marine fuel containing be-tween 2,000 and 5,000 ppm sulfur, a dramatic drop from the average 27,000 ppm in most marine bunker fuels. The port is working with terminal operators toward a target of 75 to 80 percent of ships operating on lower sulfur fuels at berth. The fuel switching generally occurs when shipping briefly ties onto a harbor barge in Puget Sound containing lower sulfur fuel before proceeding to the docking pier. Four of the Port of Tacoma’s five container terminals use ultra low sulfur diesel (ULSD), contain-ing a maximum of 15 parts per million (ppm) of sulfur, in their cargo handling equipment. The cleaner fuel reduces emissions and also permits the use of advanced pollution control equipment to reduce emis-sions from diesel engines even more. The fifth terminal uses biodiesel blends with ULSD. This program is discussed in the next section. ULSD has been used in the locomotives for switching operations run by Tacoma Rail, a city-owned division of Tacoma Public Utilities, since June 2006, five years ahead of the Environmental Protec-tion Agency (EPA) requirement for railroads. In addition, Tacoma Rail has installed two idle reduction systems on its switching engines. The first is a SmartStart system that senses when a locomotive is idle and

60
shuts off the combustion engine. The second is a Chem Hotstart diesel-driven heating system that keeps the engine oil warm enough to facilitate easy restarting when the locomotive again is needed to move railcars. Switching engines generally idle about 3,600 hours per year. Together these two idle control systems reduce fuel use by 3 to 5 gallons per hour, saving over 5,000 gallons of fuel each month at the rail yard. This reduces fuel cost by over $550 per week and eliminates emissions associated with idling. In 2004, the EPA awarded a $75,000 grant to the Port of Tacoma to equip the port’s 30 straddle carriers, which also run on ULSD, with diesel oxidation catalysts (DOCs) to reduce particulate emissions from diesel engines.8� This retrofit project reduces sulfur dioxide by 1.0 ton per year and particulate mat-ter by 0.94 tons, based on current annual fuel use. Loss of power was the major concern with the devices, but the port has received no adverse comments from drivers regarding vehicle performance since they went into operation in the fall of 2005. There have been no maintenance issues with the DOCs. Based on these results, the port has changed its specifications for new straddle carriers to employ EPA-verified DOCs when new carriers are purchased. In addition to implementing programs specifically at port facilities in Tacoma, the Environmen-tal Department is working through the four regional and state processes discussed in the Port of Seattle profile (see below). These actions include The Puget Sound Maritime Air Forum, the Puget Sound Mari-time Air Emissions Inventory, state government leadership in the form of Governor Christine Gregoire’s Puget Sound Action Agenda and the draft three-port action plan released on May 16, 2007. The May 2007 draft three-port action plan, Northwest Ports Clean Air Strategy, identifies air pollu-tion control objectives and timetables for the port through 2015.8� An overview of this plan appears in the Port of Seattle profile provided below. In January 2007, the governor traveled to Tacoma to empha-size the role of the port in implementing the provisions of the Container Port Initiative.
Altern�t�ve Fuels �n Port Oper�t�ons
In 2006, the Husky Terminal, an international shipping terminal at the Port of Tacoma, became the first at the port to begin using a biodiesel fuel blend in all of its cargo equipment to reduce air emissions. A fuel blend of 50 percent biodiesel and 50 percent low sulfur diesel is used most of the year. During cold periods in the winter when biodiesel gelling is a concern, Husky switches to a 20 percent biodiesel blend. The cargo handling equipment burning biodiesel include six rubber-tired gantry cranes, 32 yard tractors and eight top picks. The biodiesel blends generally add an additional $0.05 to $0.07 cost per gallon to diesel prices. With the terminal using up to 5,600 gallons to a week, this translates into an extra cost of from $280 to $392 weekly. As diesel prices have risen in recent years and subsidies have been offered to lower the cost of biodiesel to the consumer, however, there are now times when the biodiesel blends cost less than pure diesel. The Port of Tacoma uses low-level biodiesel blends, between 2 and 5 percent, in its fleet of nearly 100 vehicles operating throughout the port. It currently burns about 800,000 gallons of ULSD in its fleet. Several years ago, the port adopted a policy to buy hybrid electric vehicles to replace its passenger car fleet. It now owns and operates several Toyota Priuses and Ford Escape Hybrids. The Northwest region generates most of its electricity from renewable hydroelectric power, which is both inexpensive and free of carbon emissions. Because of this, the port is looking to increase the electrification of port operations, including cold ironing and use of battery powered cargo handling equipment. Development of a battery powered yard tractor is currently in the concept stage. The truck would be equipped with advanced batteries capable of withstanding fast recharging rates. Despite the interest in using grid power at the port, there are currently no cold ironing projects underway at the Port of Tacoma and “there has been no interest from either side,” says Hon. The prob-lem has been high cost to achieve relatively small pollution reductions from berth ships that are in port for only a short period of time.

6�
Profile: PORT OF HAMPTON ROADS
On May 14, 1607, a party of pioneering settlers stepped ashore at what is now Jamestown, Virginia, near the present day Hampton Roads. Virginia’s first major export, a load of tobacco, left the colony for England in 1614. Two years later, the colony shipped 2,300 pounds of tobacco to England. By 1618, the amount increased 20-fold. The Jamestown colony, under the direction of the Virginia Company, grew to become a center of commerce and trade. The ports of Hampton Roads are celebrating their 400th anniversary in 2007, making them the oldest continuously operating port system in the U.S.86 The combined ports of Norfolk, Newport News and Plymouth along the banks of the James and Elizabeth rivers near the mouth of Chesapeake Bay form the port system at Hampton Roads. The ports lie 18 miles inland from the open ocean on one of the world’s largest natural harbors. The Virginia Port Authority (VPA) was established in 1952 as a state government agency respon-sible for managing ports within the state, reporting to the state Secretary of Transportation. The VPA owns and operates three container facilities on behalf of the state. The 12-member VPA Board of Com-missioners includes 11 citizens appointed by the governor of Virginia, plus the state treasurer. Citizen board members serve staggered five-year terms. The VPA, is financially self-sufficient. Total revenues received in 2006 by the VPA were $59.3 million.
Overv�ew of Port
Hampton Roads handled a total of 2,029,799 TEUs of containers in 2006, making it the 7th largest container port in the U.S. The port grew 2.4 percent in 2006 from the 1,981,955 TEUs of containers handled in 2005, allowing it to bypass Seattle and Charleston in the top 10 rankings. The annual number of containers handled at Hampton Roads grew by 64.7 percent from 1997 through 2006. Since 1996, the port has had nine years of growth, with the only off year occurring in 2001. The ports at Hampton Roads handle 39 million tons of cargo annually and employ 104,000 workers.8� Roughly 1,700 ships call on the ports each year. The average ship stays in port 15 hours. Two-thirds of the U.S. population is located within a 750-mile, two-day truck drive. Over half the containers are shipped out of Virginia once unloaded at the ports. Two-thirds of the containers leave the port by truck, 28 percent are carried on rail cars and the remaining 6 percent leave by barge. The use of rail is facilitated by ondock railyards at all three terminals. Roughly 1,200 trucks and four trains leave the port carrying containers every day. The three container ports at Hampton Roads include the Norfolk International Terminals (NIT), the Portsmouth Marine Terminal (PMT) and the Newport News Marine Terminal (NNMT). The NIT is located on the northern shore of Hampton Roads Harbor in the town of Norfolk. The PMT and NNMT are on the southern shore. There is a fourth container port under development, the Craney Island Marine Terminal located near the PMT in Portsmouth. It is scheduled to open in 2017 to handle the doubling of container traffic expected by 2015 and the tripling anticipated by 2020. The terminals are operated by Virginia International Terminals, Inc. (VIT), a nonprofit operating company established in 1982 as a move to unify the ports of Hampton Roads. The NIT is the largest terminal and home to the world’s largest container cranes. These Suez-class container cranes can work the largest container ship in the world today, the Emma Maersk, with 13,000 TEUs of containers stacked 22 across, moving as many as forty 50-ton containers in an hour. The PMT is the second largest container terminal at Hampton Roads.

62
T��le �0
PORT OF HAMPTON ROADS
Port Ch�r�cter�st�c Descr�pt�on
National Ranking 2006 7th
Port Commission Virgina Port Authority (VPA)
Operating Revenue (2006) $59.3 million
Landlord or Operator Operator
TEUs 2005 1,981,955
TEUs 2006 2,029,799
Percent Growth 2005 to 2006 2.4%
Percent Growth Over Past Decade 64.7%
Percentage by Truck/Rail/Barge 66%/28%/6%
Number of Container Terminals 3
Alternative Fuel Cargo Handling Equipment No
Cold Ironing Capacity No
Alternative Fuel Onroad Trucks No
Alternative Fuel Rail Engines No
The airshed that includes the ports at Hampton Roads currently violates the 8-hour federal ozone public health standard. The area has been in noncompliance only since 2004. Nevertheless, the noncompliance status is forcing the VPA to devote more effort to reducing port emissions, especially for nitrogen oxides.
M�jor A�r Pollut�on Control Progr�ms
In 1995, the VPA created the position of project manager for environmental projects. In 2001, the job was elevated to Director of Environmental Affairs. Heather Mantz has held this position since October 2001.88 In May 2005, the VPA Board of Commissioners formally adopted an environmental policy state-ment,89 committing the VPA to strive to meet four objectives, as follow:
• Meet or exceed all applicable federal, state and local environmental laws and regulations• Employ management systems and procedures specifically designed to prevent activities and
conditions that pose a threat to human health, safety and the environment • Integrate environmental costs, risks and impacts into port project development and facility
improvements to achieve established environmental and business objectives• Promote pollution prevention and environmental awareness through communication with
employees, customers, tenants, suppliers, contractors, other terminal users, regulatory agencies, neighboring communities and environmental organizations
The current environmental protection program at Hampton Roads was launched in 1999. It has focused on replacing the existing diesel engines in its 360 vehicle fleet of cargo handling equipment, generally older and more polluting models, with newer engines that comply with stricter emissions standards for onroad vehicle applications.

6�
A 2005 study of emissions showed that emissions decreased as cargo volumes increased. Overall, emissions from all cargo handling equipment declined by 33 percent, despite a 55 percent increase in container volume. The study measured the combined output of volatile organic compounds (VOC), carbon monoxide (CO), NOx and particulate matter (PM) coming from cargo handling equipment at the three container terminals between 2002 and 2004. The results indicated that:
• In 2002, the port handled 1.18 million TEUs and VOC production dropped 13 percent, CO dropped 13 percent, NOx dropped 14 percent and PM was down 16 percent
• In 2003, the port handled 1.35 million TEUs and VOC production dropped 15 percent, CO dropped 12 percent and NOx dropped 12 percent
• In 2004, the port handled 1.50 million TEUs and VOC production dropped 8 percent, CO dropped 9 percent, NOx dropped 10 percent and PM was down 10 percent
The ports at Hampton Roads have been awarded a number of environmental achievement awards in recent years. Its cargo handling equipment pollution control program received the Environmental Improvement Award in 2006 from the American Association of Port Authorities. It was also honored with the Governor’s Environmental Excellence Gold Medal Award that year. In 2005, the VPA expanded its environmental program by launching the Comprehensive Air Emissions Inventory and Integrated Planning Model. The model will create a complete inventory of emis-sions from all port operations, including incoming ships and outgoing trucks and trains. It will profile the use of each polluting source, including operating and idling time, fuel consumption, and equipment productivity, in addition to total emissions of several key pollutants. Translation of the results from the planning model into concrete air pollution reduction efforts, except for the early cargo handling equipment diesel engine upgrade program, has not yet taken place. Thus, other parts of port operations have received scant attention with regard to reducing emissions. There are no fuel quality or speed reduction requirements affecting incoming ships or harbor tugboats. There are no emission control requirements or demonstration programs affecting outgoing trucks or train engines. A $60 million rail improvement project is scheduled for completion in 2009 that will shift some traffic from trucks to rail. This will reduce air pollution, but the program is not being undertaken primarily for environmental reasons. A new initiative under consideration is to use ultra low sulfur diesel (ULSD) fuel in all offroad vehicle applications at the ports, including all cargo handling equipment. ULSD is now required by the EPA in all on-road diesel engines, but it is not required for offroad vehicles until 2010. The VPA estimates that the effort will result in a 10 percent reduction in air pollution. It is currently assessing the availability and cost of ULSD in Virginia. There is an extensive environmental planning process underway for the Craney Island Marine Terminal. An Environmental Impact Statement was completed in 2005, and Mantz says the port is “very engaged with the environmental community” through frequent stakeholder meetings.
Altern�t�ve Fuels �n Port Oper�t�ons
There are no significant alternative fuel programs underway at the ports of Hampton Roads. There is no cold ironing initiative to reduce power generation emissions from ships or programs to reduce emissions from cargo handling equipment through the use of alternative fuels or hybrid electric technology. To date, the port has conducted demonstration projects featuring electric light duty vehicles used mainly for administrative duties. For example, it operates two hybrid electric passenger vehicles, a Toyota Prius and a Ford Escape Hybrid, in its administrative fleet. Moreover, several years ago it tested a Roush Electric Vehicle, powered by electricity stored in batteries. The port is attempting to buy another one of these small electric pickup trucks from the manufacturer in Mexico.

6�
Profile: PORT OF SEATTLE
Seattle’s earliest white settlers arrived in 1851 and established a trading settlement. A year later, they built a permanent home on the eastern shore of Elliot Bay where some of the port of Seattle container terminals operate today. The Great Northern Railway chose Seattle as the terminus of the railroad’s transcontinental route in 1890, and the city’s role as a commercial center grew with the discovery of gold in Alaska in 1896. By 1916, Seattle was the West Coast’s leading port in terms of dollar value of goods shipped. Within two years, it was the second largest port in the country, largely by handling cargo mov-ing to and from Asia and Alaska.90 In 1911 the voters of Seattle established the Port of Seattle as a municipal corporation and ap-proved a bond measure for waterfront development. After World War II, the Port of Seattle diversified its activities by building the Seattle-Tacoma International Airport, which it continues to manage today. Five commissioners, elected at large by the voters of King County, manage the Port of Seattle Commission. They serve four-year terms and establish port policy. In 2005, the gross operating revenues from all port activities reached $416.5 million.
Overv�ew of Port
About 70 percent of the Port of Seattle’s containerized cargo originates in or is destined for regions other than the Northwest. Because of the long haul to and from major markets, the port relies on rail service to handle about 70 percent of its container traffic, leaving only 30 percent for truck delivery. The port averages about 900 container ship visits each year. A total of 1,987,360 TEUs of containers were handled in 2006, making Seattle the 8th largest container port in the U.S. Seattle was one of only two of the top 10 ports that saw container traffic drop in 2006. The 4.8 percent drop in 2006 was by far the largest decline among the ports. Like all other ports, Seattle has seen a major growth in container traffic over the past decade. The annual number of containers handled grew by 34.7 percent from 1997 through 2006. Although impressive, this was the smallest growth among the top 10 ports. The port dropped from the 5th largest port to 8th place during the decade. Projections by the Port of Seattle suggest that the port capacity could double and handle 4.0 million TEUs by 2025. There are four container terminals within the port.9� Terminal 18 completed a major expansion in the spring of 2002. Terminal 18 is the port’s largest container terminal and one of the largest in North America. Financing of the $300 million expansion was provided by the sale of special facility bonds backed solely by lessee payments. Expansion highlights include the addition of 90 acres, for a total terminal size of 196 acres, and a doubling of intermodal container rail capacity. On March 17, 2005, the COSCO Vancouver, owned and operated by China Ocean Shipping Company, became the largest container ship to ever visit Puget Sound when it docked at Terminal 18. The ship carries 8,000 TEUs of containers. The Port of Seattle recently completed a major $20 million modernization project of Terminal 25 for Matson Navigation. Matson Navigation is a leading U.S. domestic carrier with over a century of service in providing a full array of transportation services operating from a single user facility. Terminal 46 is located on the southeast side of Elliot Bay, just south of downtown Seattle and just north of the Burlington Northern Santa Fe (BNSF) Seattle Intermodal Gateway rail yard. The port recently completed a $70 million upgrade and expansion of the terminal, and a new lease, valid through 2015, was signed with Total Terminals International (TTI) and Hanjin. Other improvements include a new 16-lane truck gate with optical character recognition technology, new terminal buildings, additional container yard acreage, a stronger pier apron and a new fender system.

6�
T��le ��
PORT OF SEATTLE
Port Ch�r�cter�st�c Descr�pt�on
National Ranking 2006 8th
Port Commission Port of Seattle
Operating Revenue (2005) $416.5 million
Landlord or Operator Landlord
TEUs 2005 2,087,929
TEUs 2006 1,987,360
Percent Growth 2005 to 2006 -4.8%
Percent Growth Over Past Decade 34.7%
Percentage by Truck/Rail 30%/70%
Number of Container Terminals 4
Alternative Fuel Cargo Handling Equipment Yes
Cold Ironing Capacity No
Alternative Fuel Onroad Trucks No
Alternative Fuel Rail Engines No
The final container terminal, Terminal 5, is located on 182 acres in West Seattle. It has three ship berths and five container cranes. It includes a dockside intermodal rail yard and a dedicated truck overpass. The Seattle metropolitan area is currently in attainment of all federal, state and local ambient air quality standards, says Barbara Cole, Senior Environmental Program Manager at the port.92 The major pollut-ants of concern in recent times have been ozone, but the region has not violated national ambient standards for ozone since 1992, and particulate matter. Although still in compliance with federal health standards, air pollution control agencies in the Northwest estimate that diesel particulate emissions from all sources, including ports, account for 70 percent of the potential cancer risk from all air pollutants in the region.
M�jor A�r Pollut�on Control Progr�ms
A resolution adopted in 2005 by the Port of Seattle Commission sets a policy goal for the port to apply its best efforts to work with the broad maritime industry and regulatory community to help ensure that the Puget Sound region continues to meet local, state, and federal ambient air quality standards. The resolu-tion encouraged the governments of the U.S. and Canada to seek the designation of a North American Sulfur Emissions Control Area under Annex VI to the International Convention for the Prevention of Pollution from Ships (MARPOL). Among the other actions endorsed by the resolution were programs to reduce air emissions by renovating seaport cargo terminals to increase efficiency, by providing dockside electric plug-ins instead of diesel units for refrigerated containers on the docks, and by converting all seaport cargo cranes from diesel to electric power. Most air pollution control efforts to date have focused on upgrading diesel engines in the cargo handling equipment fleet, adding pollution control equipment to these vehicles and switching to cleaner grades of diesel fuel. These programs received state government support as part of the “Diesel Solution” effort by the Puget Sound Clean Air Agency (PSCAA).9� Moreover, in November 2005, the EPA awarded

66
the Port of Seattle’s Diesel Emissions Reduction Project a federal grant of $35,000.9� The EPA grant was part of $1.4 million in EPA funding, combined with more than $5.8 million in matching funds from West Coast Collaborative partners, to 16 projects in Washington, Oregon and California to help reduce diesel pollution. More than $70,000 in matching funds has been provided for the Seattle project from other sources. The goal of the diesel emissions reduction project is to improve air quality by voluntarily reduc-ing exhaust emissions from diesel fueled equipment used by the port and its tenants. These vehicles include cargo handling equipment, onroad trucks and other heavy duty equipment. The project is expanding the use of advanced pollution control technologies, such as diesel oxidation catalysts, and ultra low sulfur diesel fuel (ULSD). Fleet selections are made in collaboration with the Puget Sound Clean Air Agency and the equipment owners or operators. Container vessel owners are transitioning to larger, more efficient vessels with lower emission engines. These higher capacity vessels help reduce the number of trips in addition to cutting emissions per trip. Increased terminal efficiencies are being made to improve cargo flow, reduce truck idling time, and reduce emissions. Educational programs for equipment owners/port operator staff about options for reducing emissions are underway. The Port of Seattle has received several awards for its environmental protection program, including an EPA award several years ago after a nomination for the award by the PSCAA. Four regional air pollution control programs underway in the Seattle area have played a role in guiding environmental programs at the port. The first is the Puget Sound Maritime Air Forum, a voluntary association of private and public maritime organizations, air agencies and other parties with operational or regulatory respon-sibilities related to maritime industry air quality impacts.9� The forum was created in 2004 “to put some structure around what we were already doing,” in the words of David Kircher from the PSCAA.96 Until then, diesel pollution reduction efforts were being implemented as part of the PSCAA’s Diesel Solutions program, a voluntary partnership established in 2001. Forum members work to identify and quantify maritime related sources of air pollution and seek ways to voluntarily reduce air pollution impacts from this transportation sector. One of the more active independent participants in the Puget Sound Maritime Air Forum is the Puget Sound Clean Cities Coali-tion (PSCCC), a voluntary, public/private partnership that works to advance the region’s environmental and public health, energy security and economic development by promoting policies and practices that reduce petroleum consumption in transportation. The PSCCC is part of a national network of more than 80 communities organized by the U.S. Department of Energy Clean Cities initiative. The second public process is the Puget Sound Maritime Air Emissions Inventory, a project launched by the Air Forum shortly after its formation.9� The purpose of the emissions inventory is to provide scientifically valid data to aid in the planning and prioritization of pollution prevention invest-ments in the region. Over the course of two years, the project staff collected baseline information on a number of air pollutants and their sources within the greater Puget Sound area and in the waters north to the border with Canada. It focused primarily on diesel powered maritime sources, such as ships, cargo handling equipment, locomotives and trucks. The inventory includes estimated emissions from most maritime related sources in the Puget Sound airshed. Led by the Port of Seattle, participants in this project include more than a dozen other regional government agencies, other ports, including the port of Tacoma, private companies and nonprofit organizations. The Puget Sound Maritime Air Emissions Inventory Project received $100,000 in EPA funding, along with $310,000 in matching funds from other organizations. The Puget Sound Maritime Air Emissions Inventory was released in April 2007. The report, over 600 pages in length, found maritime sources to be a significant and growing source of area pollution through the Puget Sound study area, which included the Straits of Juan de Fuca and Georgia. In the Puget Sound area, which includes both Seattle and Tacoma ports, maritime sources account for 33 per-

6�
cent of the sulfur dioxide, 28 percent of diesel particulate matter and 11 percent of the nitrogen oxide emissions. Cargo handling equipment from all ports contributed 1,155 tons of nitrogen oxide emissions in 2005. A summary of key emission statistics is shown in Table 12.
T��le �2
SOURCE OF MARITIME AIR POLLUTION IN PUGET SOUND
(tons per year)
Em�ss�on Source D�esel P�rt�cul�te M�tter N�trogen Ox�des
Oceangoing Vessels
At Berth 131 2,259
Maneuvering 21 313
Transiting to Pier 663 11,390
Cargo Handling Equipment 74 1,155
Rail Off Terminal 32 1,285
Rail On Terminal 35 1,180
Trucks Off Terminal 39 1,120
Trucks On Terminal 4 203
The third project involves state government leadership in the form of Governor Christine Gregoire’s Puget Sound Action Agenda, launched in early 2007. On February 16, 2007, the Seattle Port Commission directed the staff to take six specific steps to demonstrate the port’s work in support of the Puget Sound Action Agenda.98 The steps include creating an action plan on air quality by the end of 2007 that includes goals and commitments for significant reductions in air emissions. Finally, on May 16, 2007, the three ports of Seattle, Tacoma and Vancouver in British Columbia, Canada, issued a collaborative draft report titled Northwest Ports Clean Air Strategy.99 Modeled after the Clean Air Action Plan, adopted simultaneously by the ports of Los Angeles and Long Beach in November 2006, the new report for the three ports in the Northwest sets common goals, strategies and timelines that each port is willing to strive to achieve. The draft Northwest Ports Clean Air Strategy was released at the Faster Freight Conference in Seattle. Public hearings will be held prior to the issuance of a final report later in 2007. The two goals of the draft Northwest port plan are to maintain compliance with government public health standards as the ports expand and to reduce port related human health and climate change impacts by reducing port emissions. By 2010, the plan’s goal for oceangoing vessels is to achieve a 70 percent replacement of bunker fuel with cleaner distillate fuels containing at most 1,500 ppm of sulfur. Continued use of existing shore power units and the completion of feasibility studies of other sites for shore power are other goals for oceangoing vessels. With regard to cargo handling equipment, the goals of the plan in 2010 are to achieve emission levels equivalent to use of ULSD in cleaner Tier 2 and 3 diesel engines throughout the entire vehicle fleet. Strategies to achieve this goal include retrofitting of diesel cargo handling equipment with newer engines and pollution controls, switching to biofuels, evaluating the use of natural gas and other alterna-tive fuels, implementing idling restrictions and completion of a test program for advanced hybrid electric cargo handling equipment.

68
For rail yards serving the ports, the plan proposes by 2010 to identify all suitable switching locomotives for repowering with cleaner and more efficient engines and pollution controls, use of ULSD or biofuels, and evaluation of hybrid electric power trains. For trucks leaving the ports, the plan foresees increased environmental regulation of drayage trucks serving the ports through the truck licensing system now in place to grant permission for trucks to enter the ports. Other strategies include requiring the retrofitting of trucks with new engines or pollution control equipment and mandating the use of biofuels or other alternative fuels. Similar strategies were also proposed for tugboats serving the ports.
Altern�t�ve Fuels �n Port Oper�t�ons
Most environmental protection efforts at the Port of Seattle to date have focused on cargo handling equipment and cold ironing projects. There are several programs to promote the use of alternative fuels and advanced technologies. Biodiesel has been the main alternative vehicle fuel promoted in Seattle and dockside power generation with grid power has been the main cold ironing strategy employed to date. There is also a small hybrid electric vehicle project and extensive natural gas vehicle use at the Sea-Tac International Airport managed by the Port of Seattle, although none are operating at the seaport container terminals.
Biodiesel: Several terminals at the port of Seattle use blends of 20 percent biodiesel and 80 percent ULSD (B20) in their ground vehicles or for their local fishing boats. The fishing boat terminal at the Shilshole Bay Marina is one example. Pure biodiesel (B100) is also provided to fishing boats at Terminal 91. The cargo terminals 5, 18 and 25 each use B20 in their cargo handling equipment fleet. In early 2006, the Port of Seattle began using a particularly high concentration of biodiesel in its fleet of 60 to 70 administrative and maintenance vehicles that operate on the docks. The heavy container handling equipment is owned and operated by the terminal lessees. During most of the year, the fuel for the Port of Seattle fleet is a blend of 99 percent biodiesel and 1 percent ULSD (B99). Because fuel gelling problems have been reported in other programs from such a high concentration of biodiesel, the vehicles switch to use of 50 percent biodiesel blends (B50) when temperatures approach freezing in the Seattle area. This program resulted from efforts launched by the Biofuels Business Collaborative, a group of Washington businesses, farmers, investors and fuel consumers formed in October 2005. The Port of Seattle uses about a million gallons of diesel fuel in its vehicles each year. The use of B99 rather than pure biodiesel takes advantage of new federal tax credits of $1.00 per gallon for biodiesel fuel blends. Pure biodiesel does not qualify for this federal subsidy, established in the Energy Policy Act of 2005, but the maximum credit is offered for a B99 blend. With the federal subsidy the price of B99 has generally been less than or equal to the price of diesel. To date, the performance of the biodiesel fleets at the Seattle ports has been excellent. Other demonstration programs involving biodiesel have reported problems with fuel clogging and gelling. Barbara Cole believes the lack of clogging in Seattle stems from preventative maintenance procedures implemented by the port to clean diesel fuel tanks before filling them with biodiesel blends. Kircher of the PSCAA believes evidence is emerging suggesting that more problems emerge from the use of lower concentrations of biodiesel, for example with 5 or 20 percent biodiesel. The PSCAA is in the last stages of finalizing a $400,000 contract with Washington State University and the University of Idaho to study the issue of engine performance with different biodiesel blends more thoroughly. A small fleet of independently owned tugboats serving the port have also switched to pure biodiesel. The fleet, operated by Ryan Campbell, has performed well to date on the new fuel.

69
Cold Ironing: Although no cold ironing of container ships currently takes place in Seattle, two cruise lines, Princess Cruises and Holland America, now use electrical shore power rather than engine power when their ships dock in the city. The first shore side power facility, built in 2004, enables Princess cruise liners to turn off their engines and plug in while calling at Terminal 30. This project eliminates 35 metric tons of turbine engine fuel per ship call, resulting in a total reduction of 1,400 metric tons of fuel during the 2005 cruise season. Estimated seasonal reductions are 7.7 tons of particulate matter and 203.5 tons of reduced sulfur oxides emissions. Thirty percent of Seattle cruise passengers are served by Princess vessels. In 2006, a second shore side power unit was built at the Holland America berth. Juneau, Alaska is another one of only a few cruise ports in the world that offers shore power to cruise ships. The shore power project is a joint effort between Princess Cruise Lines, the Port of Seattle, Puget Sound Clean Air Agency, the U.S. Environmental Protection Agency and Seattle City Light.
Natural Gas Vehicles: In a program at a non-seaport facility managed by the Port of Seattle, hundreds of shuttle buses at the Seattle-Tacoma International Airport have been converted to run on compressed natural gas. The vehicles are refueled at an onsite natural gas fueling station built by Clean Energy. In another program at the airport, the Seattle-Tacoma International Taxicab Association has converted all 166 of its cabs servicing the airport to run on compressed natural gas. Despite the early success with natural gas at the airport, so far the Port of Seattle has not opted to pursue natural gas as an alternative fuel at its seaport operations, picking biodiesel instead. Accord-ing to Cole, there was concern that natural gas engines might not be powerful enough to handle cargo handling equipment duties. Most of the natural gas used at the airport is burned in light or medium duty vehicles. Another concern was the lack of space at the seaport terminals for natural gas fueling stations to supply port vehicles. Several of the container terminals are separated along the shoreline by private property. Driving between terminals to find a fueling station could create logistical problems for the cargo handling equipment fleet. Building a station at each terminal could be uneconomical.
Hybrid Electric Vehicles: One program is underway in Seattle to test hybrid electric rubber tired gantry (RTG) cranes. A major container terminal tenant, SSA, is testing two RTGs in a closely monitored dem-onstration. One has a conventional diesel-fueled drivetrain. The second uses a hybrid electric drivetrain equipped with a supercapacitor to store and deliver electrical energy on demand.
Electric Cranes: BNSF is currently building four electric cranes powered by grid electricity to be used to load containers onto rail cars. These cranes will replace the diesel-powered yard tractors, top lifts and straddle cranes currently used in container loading operations. The cranes will be twice the size of any other cranes used in rail yards in the U.S. and the first to be powered solely by grid electricity.

�0
Profile: PORT OF CHARLESTON
Charles II, King of England in the 17th century, chartered the Carolina territory to eight of his friends, known as the Lord Proprietors, in 1663. It took seven years before the Lords could arrange for settle-ment, the first being that of Charles Town. By 1680, the settlement had grown, joined by others from England, Barbados and Virginia, relocated to its current peninsular location and become the capital of the Carolina colony. The port of Charleston is less than 15 miles from the open ocean, making it the nearest port to the sea of the four largest Southeast or Gulf coast ports. By the middle of the 18th century, Charleston had become a major trade center and the wealthiest and largest U.S. city south of Philadelphia.�00 The separate port terminals operating in the Charleston area were ultimately linked by the for-mation of the South Carolina State Ports Authority (SPA), a state agency structured as a private business. The SPA does not receive operating or capital subsidies from state government. It issues revenue bonds to raise funds for port expansions and improvements. These bonds and the interest payable on them are an obligation of the SPA, not the state taxpayer. They are repaid by revenues collected from port opera-tions. The Authority Board of the SPA is appointed by the governor with the advice and consent of the Senate.
Overv�ew of Port
The SPA owns and operates three port facilities, Charleston, Georgetown and Port Royal. Only Charles-ton handles containers. These facilities are owner operated terminals, meaning SPA owns the terminals and operates them with its own staff. SPA employees work all container cranes, run the container yard equipment and operate gates on all terminals. Both union and nonunion labor work ships docked at SPA berths. Each day an average of six vessels sail into South Carolina harbors, carrying 32,000 tons of cargo worth more than $75 million. Charleston ranks as the 9th largest container port in the U.S. The port handled 1.968,474 TEUs of containers in 2006, down 0.9 percent from the 1,986,586 TEUs handled in 2005. Charleston was one of only two ports to lose business in 2006. Over the past decade, business grew by 61.7 percent, ranking 7th out of the 10 largest container ports. There are three main container terminals within the port of Charleston. The Wando Welch Terminal (WWT) has received worldwide recognition for its design and terminal productivity since it opened in 1982. The final stage of terminal construction was recently completed in the form of a fourth container berth, three new large container cranes and nearly 90 acres of additional container storage space. At present, it is the port’s largest terminal in terms of volume and physical size—3,800 continu-ous feet of berth space and a 200,000 square foot container freight station onsite. The Columbus Street Terminal (CST) is Charleston’s premier combination breakbulk and container terminal. With dockside warehouses, dockside rail access, dockside breakbulk gantry cranes, dedicated container berths and post-Panamax container cranes, Columbus Street is a multipurpose facility. The site includes 78 acres of open storage for containers and other cargo. The North Charleston Terminal (NCT) is a modern container handling facility with post-Panamax container cranes, a container freight station and rail yard, and direct easy access to interstate highways I-26 and I-526. Three container berths totaling 2,500 feet of berth space are at the NCT.

��
T��le ��
PORT OF CHARLESTON
Port Ch�r�cter�st�c Descr�pt�on
National Ranking 2006 9th
Port Commission South Carolina State Ports Authority (SPA)
Operating Revenue (2006) NA
Landlord or Operator Operator
TEUs 2005 1,986,586
TEUs 2006 1,968,474
Percent Growth 2005 to 2006 -0.9%
Percent Growth Over Past Decade 61.7%
Percentage by Truck/Rail NA
Number of Container Terminals 3
Alternative Fuel Cargo Handling Equipment No
Cold Ironing Capacity No
Alternative Fuel Onroad Trucks No
Alternative Fuel Rail Engines No
The SPA has several major port expansion projects underway. The $150 million Charleston harbor deepening project completed in May 2004 took the inner harbor channels to 45 feet at mean low water. The Arthur Ravenel Bridge spanning the Cooper River was completed in 2005, allowing Charles-ton to handle larger vessels under any tidal condition due to its 186 feet of vertical clearance at mean high water. The SPA’s two-year capital program calls for $154 million in improvements and equipment for existing terminals. The SPA also received government clearance in April 2007 to build a new three-berth, 286-acre marine terminal at the former Charleston Naval Base.
M�jor A�r Pollut�on Control Progr�ms
Charleston is the only port among the top ten U.S. container ports not to grant Energy Futures an interview during the researching of this report. It is also the only port that does not list a director of environmental protection among its port personnel. In March 2004, a Natural Resources Defense Council (NRDC) report, Harboring Pollution: The Dirty Truth about U.S. Ports, gave the port of Charleston an “F” grade for its air quality protection effort, noting that the port “has made virtually no effort to reduce air pollution from its operations.”�0� Available information suggests some progress to date, and a new program, launched in March 2007, indicates that more attention might be awarded environmental issues in the future. The major environmental protection effort to date has been the replacement of four diesel powered container cranes with models powered by electricity obtained from the grid. In 2007, the port also deployed 16 new rubber tire gantries to efficiently stack containers dockside.�02 The new gantries were part of a $63.6 million port upgrade that also replaced older cargo handling equipment with newer and cleaner models. Over the last five years, the SPA has retired ten yard trucks, four container cranes, three rubber tired gantries, two gantry cranes and seven full container handlers.

�2
The SPA is also a leader in both crane productivity and trucker turn times. These strides in ef-ficiency mean ships stay in port for shorter lengths of time, reducing ship emissions. Cranes averaged 41 container moves per hour in 2006 and truck turnaround times at the port average only about 20 minutes, thereby reducing truck idling time at the terminal. The port handles about 5,000 TEUs of containers per acre, a notably efficient use of space. In March 2007, the SPA entered a formal partnership with the South Carolina Department of Health and Environmental Control (DHEC) to evaluate strategies to cut emissions at the port’s existing and future facilities, improving air quality in the Charleston region in the process.�0� The voluntary agreement calls for DHEC to designate an individual to coordinate air quality consultation for new and existing port facilities. The DHEC will also develop and conduct training for SPA personnel on an annual basis. In the memorandum of understanding with the DHEC, the SPA committed to take a number of specific steps at new and existing facilities, including:
• Fund the purchase, installation and utility costs for a particulate matter monitoring station to be owned and operated by DHEC
• Conduct an emissions inventory of existing facilities within 18 months • Purchase cleaner equipment for the new Navy Base Terminal • Use cleaner engines when rebuilding existing equipment or replacing retired equipment • Evaluate the use of cleaner fuels, such as biodiesel and ultra low sulfur diesel • Evaluate the future use of shore-to-ship electric power for ships at berth• Carry out air quality education and outreach and pursue anti-idling initiatives • Include contractor guidelines in construction bid documents to minimize air impacts
On April 26, 2007, the U.S. Army Corps of Engineers issued permits for the 286-acre container terminal at the former Navy Base in the Port of Charleston.�0� As part of its application, the SPA submitted a terminal mitigation plan that includes more than $10 million in environmental and community mitigation activities to be implemented in upcoming years. To offset indirect environmental impacts, the plan includes $1 million to the Trust for Public Land for the Morris Island protection effort and $1 million toward protect-ing land through the Cooper River Initiative, a broad-based consortium of environmental agencies and groups. To deal with direct impacts to aquatic resources and wetlands, the SPA will spend $2.5 million to recreate 22 acres of tidal marsh on Drum Island, restore more than five miles of oyster reefs and purchase mitigation bank credits. The SPA will also provide $4 million in community programming to fund educa-tion and job training programs, establish an affordable housing trust and other projects.
Altern�t�ve Fuels �n Port Oper�t�ons
There are no known applications of alternative fuels or advanced transportation technologies at the port of Charleston. The March 2007 agreement between the SPA and the DHEC commits the port to evaluate future applications of cold ironing at ship berths to provide cleaner electricity for onboard use, but cold ironing is not currently used at the port.

��
Profile: THE PORT OF HOUSTON
The port of Houston is a 25-mile-long complex of diversified public and private facilities located just a few hours’ sailing time from the Gulf of Mexico. The Houston Ship Channel has been a catalyst for growth in Harris County since the first journey of a steamship up Buffalo Bayou in 1837. The port now handles 94 percent of the containers moving through Texas. Economic studies indicate that ship channel-related businesses support more than 287,000 direct and indirect jobs throughout Texas, while generating nearly $11 billion in economic impact. About 200 million tons of cargo moved through the port of Houston in 2005 from a total of 7,057 vessels.�0� The ship channel connects Galveston Bay in the Gulf of Mexico to the southeastern corner of metropolitan Houston. Galveston Bay is an irregularly shaped, shallow body of water, approximately 30 miles long and generally about 7 to 9 feet deep. Midway along the length of the bay, it separates and the ship channel follows the upper bay northeast to Houston. In 1909, the voters of Harris County approved the port as the Harris County Houston Ship Channel Navigation District. The district received federal funds and locally supported bond monies to dredge and deepen the waterway. The ship channel officially opened on November 10, 1914. In 1996, the federal Water Resources Development Act of 1996 authorized the widening and deepening of the Houston Ship Channel. In 2005, a multiyear plan to deepen the channel from 40 to 45 feet and to widen it from 400 to 530 feet was completed. The Port of Houston Authority (POHA) is an autonomous governmental entity authorized by a 1927 act of the Texas legislature to manage the public docks along the channel. The Port Commission governs the POHA. Harris County, Texas and the city of Houston each appoint two commissioners and jointly appoint the chairman. The city of Pasadena and the Harris County Mayors and Councils Associa-tion, representing 26 cities, each appoint one commissioner. Under state law, the county auditor serves as the auditor of the POHA and the county treasurer serves as the POHA treasurer. The POHA owns and operates the public facilities located on the Houston Ship Channel and is the ship channel’s official sponsor. Its facilities handle approximately 15 percent of the cargo, including all the containers, moving through the port. In 2005, the POHA recorded total operating revenues of $154.9 million, the 6th consecutive year of growth. Houston is currently one of the most heavily polluted cities in the U.S. It is a nonattainment zone for ozone and is subject to federal restrictions against increases in nitrogen oxide (NOx) emissions in an effort to comply with public health standards. “We are all about NOx,” Dana Blume, the POHA Environ-mental Affairs Program Coordinator, told Energy Futures in a Houston interview.�06 Houston is among the five most polluted cities for ozone in the U.S., according to the Environmental Protection Agency.�0�
Overv�ew of Port
In 2006, 1,606,360 TEUs of containers were handled at POHA terminals, making Houston the 10th larg-est container port in the U.S. The port grew 0.8 percent in 2006 above the 1,594,366 TEUs handled in 2005. This was well below the average 6.7 percent growth among the ten largest container ports. There are two container terminals at the port of Houston, both about halfway up the Houston Ship Channel from the Gulf of Mexico. The Barbours Cut, the older of the two, has six berths that pro-vide 6,000 feet of continuous pier with 13 wharf cranes. Trucks have access through four entry points and an intermodal rail ramp onsite includes spurs leading to warehouses on terminal. There is room to store

��
more than 24,500 TEUs of containers. The Barbours Cut is more than 30 years old and has operated at capacity for the past decade as POHA built the new Bayport Terminal.
T��le ��
PORT OF HOUSTON
Port Ch�r�cter�st�c Descr�pt�on
National Ranking 2006 10th
Port Commission Port of Houston Authority
Operating Revenue (2006) $154.9 million
Landlord or Operator Operator
TEUs 2005 1,594,366
TEUs 2006 1,606,360
Percent Growth 2005 to 2006 0.8%
Percent Growth Over Past Decade 72.1%
Percentage by Truck/Rail NA
Number of Container Terminals 2
Alternative Fuel Cargo Handling Equipment No
Cold Ironing Capacity Some Infrastructure
Alternative Fuel Onroad Trucks No
Alternative Fuel Rail Engines No
On December 6, 2006, the Bayport Container Terminal received its first vessel.�08 Built to meet demand for decades into the future, the $1.4 billion Bayport Terminal will nearly triple the port’s overall container handling capacity. When fully developed, the terminal will have seven container berths with the capacity to handle 2.3 million TEUs of containers on a complex that includes 376 acres of storage space and a 123-acre intermodel rail facility. Bayport was designed to meet and exceed all applicable local, state and federal requirements.
M�jor A�r Pollut�on Control Progr�ms
The POHA created the position of Environmental Compliance Coordinator in February 1999. The POHA adopted an Environmental Compliance Policy effective May 1, 2001.�09 The policy sets a goal for the port of Houston to be recognized by the maritime industry as a “Model Port” for environmental com-pliance. It sets the intent of the POHA to promote environmental leadership and compliance, and to improve practices to achieve the goals of meeting and or exceeding current environmental standards and regulations. Blume assumed the position of Environmental Affairs Program Coordinator in late 2005. The POHA has implemented an Environmental Management System (EMS) and completed the EMS pilot program with the U.S. Environmental Protection Agency. In September 2002, the POHA received the American Association of Port Authority’s (AAPA) Calvin Hurst Award for its Environmental Management System, followed by a second Environmental Improvement Award from the AAPA for its

��
air quality program. In 2005, the new Bayport Terminal became the first port facility in the U.S. to be certified as meeting International Standards Organization ISO 14001:2004 environmental standards. The POHA environmental affairs department is a Clean Texas Partner in a program created by the Texas Commission of Environmental Quality (TCEQ). The POHA has been able to tap state and federal funds to retrofit cargo handling equipment with cleaner diesel engines. A program is underway to require Tier II diesel engines in all cargo han-dling equipment. Funds from the Texas Emission Reduction Plan (TERP) are being used to pay for the new engines. By 2005, the POHA had achieved a 14 percent decrease in nitrogen oxides emissions from terminal trucks, despite a 53 percent increase in the number of trucks in use.��0 The TERP is a comprehensive set of incentive programs aimed at improving air quality in Texas. The TCEQ administers TERP grants and financial incentives. The legislature established the TERP in 2001. The TCEQ has appointed one staff member to serve as a liaison with staff at the POHA. “We try to bring her to the table an awful lot. It’s not an antagonistic relationship,” remarked Blume, although she added that Houston city government is “very aggressive on going after polluters.” Earlier this decade, the port of Houston became the site of one of the first demonstration pro-grams to test the use of PuriNOx, a diesel emulsion fuel manufactured by Lubrizol, to reduce emissions from cargo handling equipment. A total of more than 50 vehicles were converted and tested. In December 2004, the EPA awarded $150,000 to retrofit additional rubber tire gantry cranes and yard tractors with diesel oxidation catalysts and to fuel these vehicles with diesel emulsions.��� The program received a two-year extension and ran until November 2006. Tests of the vehicles converted earlier to diesel emulsions have been discontinued. Lubrizol stopped marketing PuriNOx in the U.S. in December 2006. Its added $0.30 per gallon to the cost of diesel fuel when available and lower cost options now appear viable in the form of engines certified to meet 2007 EPA standards while burning less expensive ultra low sulfur diesel. There are few other air pollution reduction efforts underway at the port of Houston. There are no fuel quality specifications required by the port for incoming ships or tugboats, although the engines on several tugboats have been upgraded to cleaner diesel models. There are speed restrictions in place limiting ship travel to between 10 and 12 knots, which reduces air pollution, but these were established because of the narrow, curvy passages common in the channel. There are no programs in place to test or deploy clean trucks or train engines serving the port. Minor actions have been taken to reduce emissions, such as creating a rule limiting truck idling on port property to five minutes.
Altern�t�ve Fuels �n Port Oper�t�ons
There is currently no cargo handling equipment operating on alternative fuels at the port of Houston and no cold ironing for ships at berth. The POHA studied use of compressed natural gas about a decade ago by closely monitoring its use in a fleet of local supermarket trucks. The performance of this earlier generation of heavy duty natural gas engines was inadequate. “We got scared by the results,” remarks Blume. Moreover, the labor union at the port expressed concern about the safety of natural gas. Recently, the POHA has become interested in using liquefied natural gas, in part because of its growing and successful use at the two Houston airports. The POHA has also studied the use of cold ironing systems at the port of Houston, but has decided that the economics do not justify deploying this strategy. The container ships calling on the port of Houston are smaller than the average ship calling on ports in California, where cold ironing might be justified, and they usually stay in port only about one day. Houston also has fewer “frequent flyers,” ships that return six or more times per year. Frequent flyers are better able to amortize the costs of adding onboard equipment to enable them to use a cold ironing system while in port.

�6
Despite these disadvantages, the POHA invested $1.4 million as it built the Bayport Terminal to provide the infrastructure to carry electrical conduit cables that would be needed for cold ironing. This investment would lower the cost of implementing cold ironing at the terminal in the future. Although the POHA extensively advertises its belief that Bayport is “one of the greenest ports in the world,”��2 installation of these currently unused conduit cables was the only example of specific air pollution reduc-tion efforts involving alternative fuels at Bayport uncovered in the research for this report.

��
ACKNOWLEDGEMENTS
This report was researched and written by Energy Futures, Inc., an independent environmental and en-ergy research firm. The research was conducted from January through October 2007. Most information was obtained directly from the port authorities, through their websites, through interviews during site visits to the nine cooperating ports, and through presentations by port officials at conferences. Informa-tion was also collected from the American Association of Port Authorities, the Environmental Protection Agency’s CleanPorts USA program, state and local pollution control agencies regulating port operations, and a variety of private sector, academic and public interest organizations. Moreover, Energy Futures attended three conferences in 2007 that covered port air pollution issues: the Faster Freight—Cleaner Air conferences in Long Beach, California, and Seattle, Washington, and the Transportation Research Board conference in Washington, DC. Comments were received from review copies sent to NGVAmerica, Clean Energy, Calstart/West-start and the Natural Resources Defense Council. Energy Futures received partial funding for this work from Clean Energy. All findings and recommendations in this report were developed by Energy Futures and do not necessarily reflect the opinions of any port authority, funder, or reviewer. Any errors in this report are the responsibility of Energy Futures.
ABOUT THE AUTHOR
James S. Cannon is President of Energy Futures, Inc., founded in 1979 to study energy and related environmental issues in the transportation sector. Energy Futures publishes the international journal, The Clean Fuels and Electric Vehicles Report, and the bimonthly newsletter Hybrid Vehicles. Mr. Cannon has studied alternative transportation fuels since 1986 and is the author or editor of five books on the topic, including Harnessing Hydrogen: The Key to Sustainable Transportation and Paving the Way to Natural Gas Vehicles, and more than a dozen reports and over 50 professional papers. His most recent book, Driving Climate Change: Cutting Carbon from Transportation, was published in 2007. Mr. Cannon’s research into alternative fuels and advanced transportation technologies has taken him to most states in the USA and to 23 other countries on 5 continents. He holds an AB degree in chemistry from Princeton University and an MS degree in biochemistry from the University of Pennsylvania. He lives with his family in Boulder, Colorado.

�8

�9
REFERENCES
� “ALA State of the Air: 2007 Reports Increasing Air Pollution in the East,” The Clean Fuels and Electric Vehicles Report, June 2007, pp. 8-10
2 Calculations based on U.S. container port annual statistics posted by the American Association of Port Authorities on its website www.aapa-ports.org
� California Air Resources Board, Evaluation of Cold-Ironing Ocean-Going Vessels at California Ports, Sacramento, Califor-nia, March 2006, page II-4
� “Message from the Executive Director,” Port of Houston Authority magazine, January/February 2007, p. 4
� Statistics posted by the American Association of Port Authorities on its website www.aapa-ports.org
6 California Air Resources Board, Proposed Emission Reduction Plan for Ports and Goods Movement in California, Sacramento, California, March 21, 2006
� “Diesel Exhaust Leading Cancer Risk in Los Angeles,” The Clean Fuels and Electric Vehicles Report, September 2000
8 California Business, Transportation and Housing Agency and California Environmental Protection Agency, Goods Movement Action Plan, Sacramento, California, January 2007, p. III-4
9 Port of Los Angeles and Port of Long Beach, San Pedro Bay Ports Clean Air Action Plan, November 2006
�0 California Business, Transportation and Housing Agency and California Environmental Protection Agency, Goods Movement Action Plan, Sacramento, California, January 2007
�� Statistics posted by the American Association of Port Authorities on its website www.aapa-ports.org
�2 “A Little Information about Pierce County’s Port,” a brochure printed by the Port of Tacoma, Washington
�� “Natural Gas Continues to Dominate Bus Fleet Purchases in the U.S.” The Clean Fuels and Electric Vehicles Report, December 2006
�� “INFORM Report Finds Strong Market for Natural Gas in Refuse Trucks,” The Clean Fuels and Electric Vehicles Report, June 2006
�� Statistics posted by the American Association of Port Authorities on its website www.aapa-ports.org. The statistics in the following paragraphs are estimated based on total containing traffic reported by the AAPA.
�6 The information in this section is derived from more detailed presentations included in the port profiles appearing in chapter 4.
�� Statistics posted by the American Association of Port Authorities on its website www.aapa-ports.org
�8 “Light at the End of the Tunnel is Cleaner Air; EPA Cuts Diesel Locomotive and Vessel Pollution,” EPA press release, March 2, 2007
�9 International Council on Clean Transportation, Air Pollution and Greenhouse Gas Emissions from Ocean-Going Ships: Impacts, Mitigation Options and Opportunities for Managing Growth, San Francisco, California, March 2007
20 Most of the information in this section was obtained from the International Maritime Organization website www.imo.org
2� Port of Los Angeles and Port of Long Beach, San Pedro Bay Ports Clean Air Action Plan, November 2006, p. 8
22 California Business, Transportation and Housing Agency and California Environmental Protection Agency, Goods Movement Action Plan, Sacramento, California, January 2007
2� Puget Sound Maritime Air Forum, Puget Sound Maritime Air Emissions Inventory. Seattle, Washington, April 2007

80
2� “Brown Calls Upon EPA to Curb Greenhouse Gases From Ocean-Going Vessels,” the California Attorney General’s office press release, October 2, 2007
2� International Council on Clean Transportation, Air Pollution and Greenhouse Gas Emissions from Ocean-Going Ships: Impacts, Mitigation Options and Opportunities for Managing Growth, San Francisco, California, March 2007
26 “Brown Calls Upon EPA to Curb Greenhouse Gases From Ocean-Going Vessels,” the California Attorney General’s office press release, October 2, 2007
2� California Air Resources Board PowerPoint presentation “Vessel Speed Reduction for Ocean-Going Vessels Workshop,” Sacramento, California, July 12, 2007
28 “NRDC, CCA Seek to Join Legal Battle Against Polluting Ships Docking at CA,” Natural Resources Defense Council press release, February 5, 2007
29 “U.S. Sens. Boxer, Feinstein and U.S. Rep. Solis Introduce Legislation Requiring EPA to Cut Ship Emissions,” press release from the South Coast Air Quality Management District, May 24, 2007
�0 “Holland America Line To Conduct Air Emission Reducing Seawater Scrubber Study,” Holland America press release, August 18, 2006
�� “Glutra LNG Ferry First for Norway,” The Clean Fuels and Electric Vehicles Report, March 2001
�2 “Hydrogen Fueled Marine Transport Systems Studied in the UK,” The Clean Fuels and Electric Vehicles Report, December 2006
�� Most of the background information in this section was obtained from the California Air Resources Board, Evaluation of Cold-Ironing Ocean-Going Vessels at California Ports, Sacramento, California, March 2006
�� Information about the Wittmar cold ironing system was obtained mainly from “DFMV Cold Ironing Made Simple,” a brochure published by the company, and from information posted on the company website at www.wittmarengcon.com
�� Most of the background information in this section was obtained from the California Air Resources Board, Air Resources Board Emission Estimation Methodology for Cargo Handling Equipment Operating at Ports and Intermodal Rail Yards in California, Sacramento, California, October 5, 2005
�6 Port of Los Angeles and Port of Long Beach, San Pedro Bay Ports Clean Air Action Plan, November 2006
�� “Omnitek Converts Yard Tractor to CNG at Bangkok Seaport,” The Clean Fuels and Electric Vehicles Report, December 2007
�8 Hybrid Truck Users Forum website www.htuf.org
�9 Most of the background information in this section was obtained from the California Air Resources Board, Evaluation of Port Trucks and Possible Mitigation Strategies, Sacramento, California, April 2006
�0 California Air Resources Board Fact Sheet, “Statewide Strategies to Reduce Locomotive and Associated Rail Yard Emissions,” Sacramento, California, December 2006
�� Port of Los Angeles and Port of Long Beach, San Pedro Bay Ports Clean Air Action Plan, November 2006, p. 7
�2 Background information about the Port of Los Angeles was obtained mostly from its website at www.portoflosangeles.org
�� Background information about the Port of Long Beach was obtained mostly from its website at www.polb.com
�� Information in the next two paragraphs was obtained from Port of Los Angeles and Port of Long Beach, San Pedro Bay Ports Clean Air Action Plan, November 2006, p. 11
�� California Air Resources Board, Proposed Emission Reduction Plan for Ports and Goods Movement in California, Sacramento, California, March 21, 2006
�6 Speech by David Freeman at the 7th Annual Clean Heavy Duty Vehicle Conference, Los Angeles, California, February 14, 2007

8�
�� California Business, Transportation and Housing Agency and California Environmental Protection Agency, Goods Movement Action Plan, Sacramento, California, January 2007
�8 California Air Resources Board, Incentive Report, Sacramento, California, April 12, 2006
�9 U.S. Environmental Protection Agency CleanPorts USA website, www.epa.gov/cleandiesel/ports
�0 Interview with Diane Bailey, Staff Scientist at the Natural Resources Defense Council, San Francisco, California, May 17, 2007
�� “Majority of Locomotives Assigned to Union Pacific Commerce Yard Will Be Ultra-Low Emission By July,” Union Pacific press release, June 27, 2007
�2 An overview of LNG yard tractor projects at POLA and POLB was provided by Erik Neandross from Gladstein, Neandross & Associates at the Faster Freight—Cleaner Air 2007 Conference held in Long Beach, California, in February 2007. Additional information provided by Brad Ruttledge from Calstart-Weststart during a phone interview on May 3, 2007
�� “BNSF Debuts Natural Gas Hostler Trucks to Reduce Emissions at Nation’s Busiest Rail Intermodal Facility,” BNSF Railway Company press release, May 4, 2007
�� “International Transportation Service and Sound Energy Solutions Agreed To LNG Yard Hostler Demonstration Project,” Sound Energy Solutions press release, October 18, 2007
�� “First 20 LNG Heavy Duty Trucks to Deploy at Los Angeles Ports,” The Clean Fuels and Electric Vehicles Report, September 2007, pp. 34-35
�6 “‘Green Goat’ Hybrid Switcher Locomotive Tested in California,” The Clean Fuels and Electric Vehicles Report, September 2002
�� “EPA Provides $300,000 for Hybrid Yard Tractors at Long Beach Port,” The Clean Fuels and Electric Vehicles Report, December 2006. Additional information provided by Brad Ruttledge from Calstart-Weststart during a phone interview on May 3, 2007
�8 “Weststart-Calstart Asks Industry for Proposals for Hybrid Drive Yard Hostlers for Use at Ports,” Fleets and Fuels, August 20, 2007
�9 “World’s First Hybrid Electric Tugboat to be Built by Foss Maritime,” The Clean Fuels and Electric Vehicles Report, June 2007, pp. 199-120
60 “‘Green Goat’ Hybrid Switcher Locomotive Tested in California,” The Clean Fuels and Electric Vehicles Report, September 2002
6� Background information about the Port Authority of New York and New Jersey was obtained mostly from its website at www.panynj.gov
62 Most of the information about the expansion of the PATH port facilities was obtained by the Annual Report 2005, published by PATH in 2006
6� A. Ahmed et al. “Integration of an Environmental Management System and Asset Management Approaches at the Port of New York and New Jersey,” proceedings of the 86th Annual Transportation Research Board Annual Meeting, Washington DC, January 2007 (CD-ROM version)
6� Most information about the operations and clean-up efforts at the Port of New York and New Jersey was obtained during an interview at the PATH headquarters in New York City with Atef Ahmed, Manager of Environmental Program, March 27, 2007, and from the PATH brochure “The Environment” published in January 2006
6� “Port Authority Wins National Award for Seaport Environmental Initiative,” PATH press release, November 29, 2005
66 “EPA Takes Innovative Approach to Clear the Air at the Nation’s Ports,” EPA press release, September 5, 2007
6� “Port Authority Advances Projects to Reduce Air Emissions,” PATH press release, September 29, 2003
68 “Port Authority Bus Fleet to Feature 21 New Hybrid Buses,” PATH press release, February 27, 2006

82
69 Background information about the Port of Oakland was obtained mostly from its website at www. portofoakland.com
�0 Most information about the operations and clean-up efforts at the Port of Oakland was obtained during an interview at the port headquarters in Oakland with Tim Leong, Environmental Specialist, May 18, 2007
�� “Port of Oakland and Partners Collaborate on Air Quality Demonstration Project for Diesel Trucks,” press release from the Port of Oakland, January 14, 2004
�2 Information about the truck replacement program appears on the Port of Oakland website at www. portofoakland.com
�� “Port of Oakland Will Seek $600 Million from Passage of California Proposition 1B,” press release from the Port of Oakland, November 13, 2006
�� “EPA Awards over $170,000 in CARE Funds to the Pacific Institute,” press release from the U.S. EPA, December 21, 2006
�� Interview with Chris Ferrara, Program Manager for Clean Air Transportation at PG&E, February 27, 2007
�6 Information about the Wittmar cold ironing system was obtained mainly from “DFMV Cold Ironing Made Simple,” a brochure published by the company, and from information posted on the company website at www.wittmarengcon.com
�� “Demonstration of LNG Cold Ironing at Port of Oakland,” August 23, 2007, posted on the Green Car Congress website at www.greencarcongress.com
�8 “Port of Oakland Adds New Hybrid Vehicles to its Clean Fleet Program,” press release from the Port of Oakland, February 13, 2007
�9 Background information about the Port of Savannah was obtained mostly from the Georgia Ports Authority website at www.gaports.com
80 Most information about the operations at the Port of Savannah was obtained during an interview at the port headquarters in Garden City, Georgia, with Wilson Tillotson, Director of Engineering & Maintenance, April 19, 2007
8� “Garden City Terminal,” an undated booklet published by the Georgia Ports Authority
82 Background information about the Port of Tacoma was obtained mostly from its website at www.portoftacoma.com
8� Most information about Port of Tacoma clean-up efforts was obtained during an interview at the port headquarters with Galen Hon, Environmental Program Technician, May 15, 2007
8� U.S. Environmental Protection Agency CleanPorts USA website, www.epa.gov/cleandiesel/ports
8� Port of Seattle, Port of Tacoma and Vancouver Port Authority, Northwest Ports Clean Air Strategy, Seattle, Washington, May 16, 2007, draft
86 Background information about the Port of Hampton Roads was obtained mostly from the Virginia Port Authority website at www.vaports.com
8� Details about the facilities at the Port of Hampton Roads was provided in a PowerPoint presentation by Jeffrey Florin, Chief Engineer & Director of Port Development, to Energy Futures at the port headquarters in Norfolk, Virginia, on April 17, 2007
88 Most information about the clean-up efforts at the Port of Hampton Roads was obtained during an interview at the port headquarters in Norfolk, Virginia, with Heather Mantz, Director of Environmental Affairs, which included a PowerPoint presentation, April 17, 2007
89 “Virginia Port Authority and Virginia International Terminals, Inc. Environmental Policy,” adopted by the Board of Commissioners, Virginia Port Authority, on May 24, 2005
90 Background information about the Port of Seattle was obtained mostly from the Port of Seattle website at www.portseattle.org
9� Terminal descriptions are contained in an undated brochure, “Port of Seattle: The Seaport,” published by the Port of Seattle

8�
92 Most information about Port of Seattle clean-up efforts was obtained during an interview at the port headquarters with Barbara Cole, Senior Environmental Program Manager, May 14, 2007
9� “Diesel Solutions: Cleaner Air for Tomorrow, Today,” an undated brochure printed by the Puget Sound Clean Air Agency
9� U.S. Environmental Protection Agency CleanPorts USA website, www.epa.gov/cleandiesel/ports
9� Information about the Puget Sound Maritime Air Forum was obtained mostly from its website at www.maritimeairforum.org
96 Interview with Dave Kircher, Manager of Air Resources at the PSCAA, May 14, 2007
9� Puget Sound Maritime Air Forum, Puget Sound Maritime Air Emissions Inventory, Seattle, Washington, April 2007
98 “Port Commission Sets New Direction on Environmental Stewardship,” press release from the Port of Seattle, February 16, 2007
99 Port of Seattle, Port of Tacoma and Vancouver Port Authority, Northwest Ports Clean Air Strategy, Seattle, Washington, May 16, 2007, draft
�00 Background information about the Port of Charleston was obtained mostly from the South Carolina State Ports Authority website at www.scspa.com
�0� Bailey, Diane et al., Harboring Pollution: The Dirty Truth about U.S. Ports, San Francisco, California: Natural Resources Defense Council, March 2004, p. 29
�02 “New RTGs Up and Running,” Port Charleston magazine, March/April, 2007, pp.6-7
�0� “Ports Authority Partners with DHEC to Cut Air Emissions,” press release from the SCSPA, March 27, 2007
�0� “Corps Issues Permits for New Charleston Container Terminal,” press release from the SCSPA, April 26, 2007
�0� Background information about the Port of Houston was obtained mostly from its website at www.portofhouston.com
�06 Most information about Port of Houston clean-up efforts was obtained during an interview at the POHA headquarters with Dana Blume, Environmental Manager, March 21, 2007
�0� “ALA State of the Air: 2007 Reports Increasing Air Pollution in the East,” The Clean Fuels and Electric Vehicles Report, June 2007, pp. 8-10
�08 Port of Houston Authority magazine, January/February 2007. The issue was devoted to a series of articles about the opening of the Bayport container terminal
�09 “Fact Sheet: Environmental Stewardship,” posted on the POHA website at www.portofhouston.com
��0 Port of Houston Authority, 2005 Environment Report, Houston, Texas, 2006
��� U.S. Environmental Protection Agency CleanPorts USA website, www.epa.gov/cleandiesel/ports
��2 “Environmentally Sensitive: Going Above and Beyond,” Port of Houston Authority magazine, January/February 2007, p. 18

8�

8�
Classic Columns Cover Stock

86
Energy Futures, Inc.POB ��6�
Boulder, Color�do 80�06
Phone �.�0�.���.0�8�Em��l jsc�[email protected]
We� www.energy-futures.com
Classic Columns Cover Stock